Abstract
The ports around Bohai in China were taken as the object of study in this research. In light of the panel data from 2014 to 2020, the super-efficiency SBM model was applied to measure and calculate the energy conservation and emission reduction efficiency of ports. In addition, the indicator system of influencing factors for energy conservation and emission reduction efficiency was constructed on the basis of the STIRPAT model, which provided a brand-new research perspective on environmental regulation, and the research method of ridge regression was applied for studying the influencing factors of energy conservation and emission reduction. The conclusion shows: except for the energy conservation and emission reduction efficiency of Qingdao port and Tianjin port reaching the significant degree, the energy conservation and emission reduction efficiency of other ports turned out to be invalid in the years of measurement, manifesting a relatively lower situation in the overall energy conservation and emission reduction efficiency for ports around Bohai; the major influencing factor for the energy conservation and emission reduction efficiency of the ports around Bohai is environmental regulation, which has played a prominent positive role; the technical factors also play an active role in enhancing energy conservation and emission reduction efficiency, and present a reversed tendency with resource endowment; the comprehensive economic strength can contribute to the efficiency of energy conservation and emission reduction of the ports.
1. Introduction
Sea transportation in ports plays a vital role in the transportation industry as the important transportation junction. In the meantime, it constitutes one of the main drivers of economic development of many countries and global trade; a large amount of international trade and commerce is accomplished by means of ocean transportation [1]. Port transportation also results in pollution of coastal cities and the global environment, especially the increasing carbon dioxide emissions. Based on the United Nations annual review of maritime transport, the annual carbon dioxide emissions of sea transportation were estimated to be about one billion tons [2]; hence, there is a need to further reinforce the energy conservation and carbon reduction of sea transportation in ports. In September 2020, the Chinese government proposed that carbon dioxide emissions should peak by 2030 and aim to achieve carbon neutrality by 2060, referred to as the “3060 Dual-Carbon Target”. The “14th Five-Year Plan” for the economic and social development of the Chinese people refers to the construction of a green and intensive comprehensive transportation network, and the task of transportation energy conservation and emission reduction has become the focus of the whole society. In January 2022, the “14th Five-Year Plan for the Development of a Modern Comprehensive Transport System” proposed that “by 2025, we will make comprehensive and integrated development of an intelligent and green transportation system, realize innovative design, and achieve breakthrough construction.” According to the 2020 Statistical Bulletin on Transport Development Industry, the cargo throughput of China’s ports will reach 14.55 billion tons by 2020, a year-on-year increase in 4.5%. Ports are not only important platforms and nodes in China’s international shipping network, but also play a catalytic role in the development of the world economy and trade.
At the same time, the environmental problems caused by port development have become increasingly obvious. The pollution from ships in ports accounts for 29.9% of the pollutants emitted from non-road mobile sources, which shows an upward trend with the majority of pollution coming from port production and transport vessels. Approximately 70% of the world’s marine emissions occur in coastal areas of ports, while 60–90% occur during berthing. During loading and unloading from ports, there are other kinds of pollution such as dust and noise. In November 2019, the green port construction was identified as an important construction project in the new stage by the Ministry of Transport and the Ministry of Natural Resources of China, which issued the “Guideline to Accelerate the Building of World-Class Ports” and proposed the use of low-carbon and clean energy in ports as the core of energy conservation and emission reduction work. In order to ensure the implementation of energy conservation and emission reduction work in ports, the Ministry of Transport of China issued the “Green Port Grade Evaluation Guidelines” for the green development of ports in May 2020, pointing out that “green ports” are to fulfill the responsibility for protecting the environment and conservation of energy in the production and service of ports, and to actively fulfill the social responsibility of enterprises in the development of various ports. The Bohai Rim port group is one of the five major port groups of China and an important shipping center of the north, facing the Incheon port in South Korea. Under the “3060 Dual Carbon Goals,” in-depth research on the efficiency of energy conservation and emission reduction of the ports around Bohai in China and its influencing factors is a key link to ensuring the sustainable development of the ports’ economy around Bohai, and also a beneficial exploration to promote the green and low-carbon development of ports.
In the literature on the impact of environmental regulation on the efficiency of port energy conservation and emission reduction, scholars mainly focus on environmental tax, carbon tax policy and technological innovation, such as Wang T [3] from the perspective of the port carbon tax to explore the carbon tax and comprehensive berth allocation and quay crane allocation research, finding that the state of the collection of carbon tax let enterprises the choice of fuel screening; a low carbon tax is also conducive to improving the level of energy conservation and emission reduction. In terms of policy, smart logistics policy has been pointed out to have a significant impact on carbon emissions and to show a significant inhibitory effect. It is considered as an important means to reduce carbon emissions and achieve emission reduction targets, such as by Pan X, Li M, etc. [4]. The application of clean energy technology is considered to be an important way to improve the efficiency of energy conservation and emission reduction in ports. The application of solar energy, wind energy, electric energy and light energy to replace traditional fuels in ports will significantly reduce carbon dioxide and sulfur dioxide emissions, and reduce the application of fossil energy and air pollutant emissions, as found in the research of Li Xiaodong et al. [5]. The research of Lu Bo et al. pointed out that, although strict environmental regulation policies can accelerate the renovation of port equipment and optimize production processes and management, they will inevitably affect the economic benefits of ports [6]. Therefore, it is an urgent problem of the government to choose a reasonable and effective environmental regulation policy to achieve a win-win situation between economic growth and energy conservation and emission reduction. Guo Jin [7], Deng G [8], etc., proposed the need to further promote and improve market-based environmental regulation policies, clarified that the actual effect of various innovative policies is more important, and also emphasized the practical significance of quantitative monitoring of port energy conservation and emission reduction efficiency.
Scholars on port efficiency mainly focus on port operation efficiency, such as Liu J [9], Li L L [10], etc., while there are few existing studies on port energy conservation and emission reduction efficiency. Among the existing studies, Data Envelopment Analysis (DEA) is often used to measure efficiency. The traditional DEA model has many limitations and shortcomings. Scholars have derived different methods based on it, such as SBM, super-efficiency DEA, super-efficiency SBM, etc. Ayman Elsayed et al. [11] measured the efficiency of the Safaga port in Egypt using a non-radial, non-angle SBM model and compared it with the efficiency of the radial output oriented (DEA-CCR) model and (DEA-BCC) model. Joon-Ho Na et al. [12] used the SBM model based on slack variables to evaluate the environmental emission reduction efficiency of eight container ports in China to address the impact of undesired outputs; Wu Yonggui [13] used an SBM model considering non-desired outputs to measure the efficiency of major ports along the Maritime Silk Road, taking carbon emissions into account, but there are still cases where the decision-making unit efficiency exceeds one and cannot be measured. In this regard, Liu J et al. [9] evaluated and analyzed the overall efficiency, pure technical efficiency, and scale efficiency of ports of six typical pilot free trade zones in China based on the super-efficiency SBM model, and analyzed the intensification and green development degree of ports. Mushtaq Taleb [14] used the super-efficiency SBM model to study the green development efficiency of 19 major ports in South Korea, effectively measuring decision-making units with an efficiency value exceeding one. In addition, exploring the influencing factors of efficiency is an important part of energy conservation and emission reduction efficiency. Scholars have analyzed the influencing factors of energy conservation and emission reduction efficiency from different perspectives. Liu W [15] pointed out that per capita GDP and population size has a positive effect on carbon emissions. It is recommended to optimize the industrial structure and improve the standardization level of transportation. Yan W [16] believes that only by improving the industrial structure can we improve the efficiency of energy conservation and emission reduction. Technological progress plays a significant role in promoting the efficiency of energy conservation and emission reduction, and when the speed of industrial restructuring is reduced, the impact of energy conservation and environmental protection policies on the efficiency of energy conservation and emission reduction will be strengthened.
In recent years, the STIRPAT model has often been used to measure the influencing factors of carbon emissions. Ellen Thio et al. [17] analyzed the influencing factors of carbon emissions of the top ten countries based on the STIRPAT model and conducted panel quantile regression to determine the relationship between variables, as well as, including factors such as exports and imports of information communication technology, energy use, and others into the extended STIRPAT model. He Yong [18] used the STIRPAT model to investigate the carbon emission effects of R&D investment at different stages of 35 industrial sub-sectors in China and in different categories of industries. Moreover, the STIRPAT model can also be used for the study of other environmental issues; for example, Yang Jiao [19] used the STIRPAT model to study the influencing factors of water environmental pollution in China, expanding the indicators of industrial structure and water utilization structure.
To sum up, regarding the research objects of port energy conservation and emission reduction efficiency, scholars mainly choose a country‘s individual ports or some listed ports, but there is a lack of research on energy conservation and emission reduction efficiency of port groups in the same region geographically; regarding the calculation model and index selection, the input-output slackness problem and the super-efficiency evaluation problem in the DEA model cannot be solved at the same time, and there is also a lack of consideration of both carbon dioxide emission and comprehensive energy consumption in the measurement framework. Regarding the research methods of influencing factors, there is a lack of application practice of the STIRPAT model in energy conservation and emission reduction efficiency. The STIRPAT model is an environmental impact assessment with good flexibility and scalability. It is necessary to analyze the impact of human activities on the efficiency of energy conservation and emission reduction in ports.
This research has the following two contributions: Firstly, the carbon dioxide emissions and comprehensive energy consumption are introduced into the input-output indicators of the port’s energy conservation and emission reduction efficiency, and the super-efficiency SBM model is adopted to solve the problem that the decision-making unit efficiency is 1 and cannot be measured. The dynamic trends of energy conservation and emission reduction efficiency of China’s Bohai Rim ports are compared and analyzed from the perspectives of the overall group and individual differences. Secondly, a scientific model of the factors influencing the efficiency of energy conservation and emission reduction in ports is constructed, adding a new research perspective of environmental regulation to the traditional STIRPAT model, which complements the theory of energy conservation and emission reduction, and uses ridge regression analysis to explore the driving factors of energy conservation and emission reduction efficiency to solve the problem of multiple covariance of variables. This study is typical in discussing the coordinated development of energy conservation and emission reduction in China’s regional ports, revealing the reasons for the differences in efficiency. It has played a guiding role in improving the efficiency of energy conservation and emission reduction in the Bohai Rim port group, providing reference for other port groups and providing theoretical support for the formulation of energy conservation and emission reduction policies.
2. Model Construction and Index Selection
When using the traditional SBM model to calculate the energy conservation and emission reduction efficiency of the ports around Bohai in China, the efficiency values of Qingdao port and Tianjin port are more than 1 in the year of calculation. In order to distinguish the energy conservation and emission reduction of ports more obviously, this study uses the super-efficiency SBM model to measure the efficiency, considering the undesired output, so as to ensure the effective evaluation of the decision-making unit. Subsequently, the measured value of energy conservation and emission reduction efficiency is taken as the dependent variable, and the STIRPAT model, which can better reflect the environmental impact, is adopted to analyze the influencing factors of energy conservation and emission reduction efficiency of the ports around Bohai in China and explore its driving factors.
2.1. Super-Efficiency SBM Model
The super-efficiency SBM model was proposed by Tone [20]. Different from the traditional SBM model, the super-SBM model can exclude the constraint condition that the efficiency value is less than 1 and can calculate the decision-making unit with the efficiency value of 1, which the traditional SBM model cannot evaluate, so as to avoid the information loss of DMU as much as possible. Referring to the research of Ting Yuan et al. [21], the model is constructed as follows:
In Equations (1) and (2), it is assumed that there are n ports (DMUs), m is the number of input indicators: xih (i = 1,2 …, m), S1 is the number of desired outputs: ygrh, (r = 1, 2 …, S1), S2 is the number of non-desired outputs: ybkh, (r = 1, 2 …, S2), and ρ is the port efficiency value of energy conservation and emission reduction.
2.2. STIRPAT Model
In 1994, Dietz et al. [22] proposed the STIRPAT model (random effects of population, economy and technology) based on the elasticity coefficient. The STIRPAT model more accurately measures the impact of socio-economic factors on the environment and has good scalability. The basic form of the model is:
In Formula (3), I is the explanatory variable; P is the population concentration; A is the wealth level; T is the technological progress; a is the constant term; u is the error term; b, c and d are the elasticity coefficients of P, A and T, respectively.
Environmental pollution has negative externalities while environmental regulation can effectively restrict the generation of environmental pollution and promote sustainable development. Therefore, this paper extends the model and introduces environmental factor E to consider the impact of environmental regulation on port energy conservation and emission reduction. The STIRPAT model constructed in this paper is extended to include four aspects: population, economy, technology and environment. The model is as follows:
In order to avoid heteroskedasticity, the logarithms of both sides of Equation (4) are taken to obtain Equation (5):
lnI = lna + blnP + clnA + dlnT + elnE + lnu
The added variable E is the environmental factor, and e is the elastic coefficient of the environmental factor [11].
2.3. Index Selection
Selection of input-output indicators: the production operation of the port requires a lot of energy, such as terminal machinery operations, cargo transportation, etc. Therefore, energy is an important input factor of the ports, and it is also an important node for energy consumption and environmental pollution. The production and operation of the port are inseparable from capital investment. The research of Lu Bo et al. pointed out that the production and operation of a port cannot be separated from capital investment. As a key part of capital investment, fixed assets reflect the capital consumption of the port in production and operation, and the wharf is an important part of the fixed assets of the port [23]. Therefore, this paper draws on the research of Chen Xingxing and selects comprehensive energy consumption and berth length as input indicators, and container throughput and port pollutant emissions correspond to expected and undesired output indicators, respectively [24]. As a catalyst for the zero-carbon transformation of shipping, ports play an important role in the low-carbon transformation. Therefore, CO2 emissions, which have received widespread attention, are selected as the undesired output indicator.
Selection of influencing factors: the influencing factors of the extended STIRPAT model in this paper are carried out from four dimensions: population, economy, technology and environment. The input of labor force affects the development of the port, and the population factor is deemed to affect the carbon emissions. It is also very important in the evaluation of energy conservation and emission reduction efficiency, so the number of employees is included in the influencing factor index. The hinterland economy is an essential economic driving force for the port area, providing the business environment and demand for port operations. At the same time, it bears the important function of economic ties between the port and the outside world, driving and enriching the types of port elements, and promoting the international development and transformation and upgrading of the port, as found in the research of Lu Bo et al. [25]; in addition, capital investment is an indispensable and important part of the port. The work of the enterprise is inseparable from the support of funds, and it is also an important guarantee for improving the efficiency of energy conservation and emission reduction. The main business cost reflects the corresponding capital investment of the enterprise in monetary form; port planning fundamentally affects the overall energy conservation and emission reduction work of the port. The number of ports and terminals and the system planning of the field area are of great significance to the energy conservation and emission reduction work of the port. Wu Caixia pointed out that if the port lacks technical support and innovation, it will be greatly limited in maintaining and developing a low-carbon economy. Investing in technology research and development is a key factor in achieving sustainable development in a low-carbon economy [26]. Li Qigeng found that environmental regulation can deter enterprises through punitive measures such as fines and closure of enterprises, thus pushing enterprises to solve environmental pollution problems, including the introduction of advanced technology, increasing technological innovation and other ways [27], so as to effectively promote energy conservation and emission reduction work. The evaluation index system is shown in Table 1.

Table 1.
Efficiency Evaluation and Influencing Factor Index System of China’s Bohai Rim Ports.
3. Empirical Test
3.1. Data Sources and Processing
In this paper, Dalian Port, Jinzhou Port, Qinhuangdao Port, Tangshan Port, Tianjin Port, Rizhao Port, Yingkou Port and Qingdao Port around Bohai in China’s region were selected as the research objects, involving four regions of Liaoning Province, Hebei Province, Tianjin City and Shandong Province, covering the main ports around Bohai in China, which can comprehensively reflect the ports level around Bohai. Considering into account the availability of data and quantitative requirements, the indicator and data from the year of 2014 to 2020 required in this research were mainly obtained from the following channels: the data of comprehensive energy consumption were measured and calculated by means of the formula proposed in the Port Energy Consumption Statistics and Analysis Methods issued in 2020: comprehensive energy consumption = comprehensive energy unit consumption*cargo handling capacity; thereinto, the comprehensive energy unit consumption and cargo handling capacity derived from the corporate social responsibility reports of each port. The length of the berth detail is derived from the Chinese Port Yearbook, and port cargo and container handling capability are derived from the Chinese Port Website. The calculation of carbon dioxide emissions was based on the comprehensive energy unit consumption and cargo handling capacity, all of which are derived from the corporate social responsibility reports of each port. The economy of the hinterland is derived from the statistical yearbook of the city where the port was located; the number of berths is derived from the Chinese Port Yearbook; the major business costs, the number of staff on active duty, the research input, as well as the environmental regulation data are all derived from the annual corporate reports of each port.
Scholars have used different methods to measure environmental regulations, and Li Guozhu [28] and He Yongda et al. [29] have pointed out that indicators such as the investment amount of environmental pollution treatment, wastewater treatment rate, and SO2 compliance rate are widely used. The current academic community mainly holds two views on explaining the impact of environmental regulation on green production efficiency; one is based on the traditional economic theory of enterprises, which argues that environmental regulation will increase the cost of enterprises, reduce their competitiveness and thus is not conducive to the improvement of efficiency, while Porter (1991) [30] pointed out that environmental regulation could improve green production efficiency through the channel of stimulating enterprises to innovate in energy conservation and emission reduction. Therefore, the direction of the impact of environmental regulation on the efficiency of energy conservation and emission reduction cannot be determined. This paper refers to the treatment in the classic literature by He Yongda [29] to adopt the amount of investment in environmental pollution control as an indicator of environmental regulation, and draws on the research idea of Li Qigeng et al. [27] that the environmental regulation intensity of the enterprise is represented by the asset expenditures such as pollution control equipment, production line acquisition and renovation related to environmental protection under “construction in progress” in the financial reports of enterprises. Table 2 provides the descriptive statistics of the input and output variables. The mean value of comprehensive energy consumption for ports around the Bohai region from the year of 2014 to 2020 was 115,223.16 tons of standard coal; the difference between the maximum and minimum values was 119,615.73 tons of standard coal; the mean value of length of the berth was 27,887 m; and the difference between the maximum and minimum values was 35,395 m. It can be seen that there is a big gap between the ports in terms of energy input and output, and the development is unbalanced.
Table 2.
Descriptive statistical analysis of input-output variables.
3.2. Calculation of Port CO2 Emissions
The calculation of carbon emissions of ports around the Bohai Sea is mainly based on the internationally recognized guidelines (greenhouse gas reduction agreement, carbon footprint guidance document, air quality and greenhouse gas tools, etc.), the unit consumption of standard coal (1 ton standard coal/million ton), and port cargo throughput (million ton). Among them, Ge Yanyan et al. [31] pointed out that the calculation of port carbon emissions can refer to the carbon emissions factor, which is recommended by the Energy Research Institute of the National Development and Reform Commission (NDRC) of China as 0.67 and by the Institute of Energy Economics, Japan as 0.68. In this paper, we use the value of 0.67 from the data of the Energy Research Institute of the NDRC of China, which means that 1 ton of standard coal burning will produce 0.67 ton of carbon, and 1 ton of carbon combustion will produce about 3.67 tons of CO2; therefore, 1 ton of standard coal combustion in the atmosphere can produce 2.4589 tons of CO2, and the CO2 emissions factor is 2.4589. The formula for calculating port CO2 emissions in this paper is as follows: port CO2 emissions = standard coal unit consumption (1 ton standard coal/10,000 ton of throughput) × cargo throughput (10,000 ton) × CO2 emissions factor (2.4589).
According to the above formula, the CO2 emissions of the ports around the Bohai Sea for the years 2014–2020 can be calculated by combining the annual data (standard coal unit consumption and cargo throughput) of each port, as shown in Figure 1; firstly, Qingdao port and Yingkou port have the highest overall CO2 emissions and are in the first echelon, but they all started to decrease significantly after 2018, such as Qingdao port dropping from the peak of 55,000 tons to the level of 30,000 tons; secondly, the Rizhao Port, Tangshan Port, Dalian Port and Qinhuangdao Port are in the second tier, and Rizhao Port and Tangshan Port show a slow increasing trend, while Dalian Port and Qinhuangdao Port show a slow decreasing trend; finally, Tianjin Port and Jinzhou Port have the lowest CO2 emissions, which are always maintained in the range of 1–2 million t. They are in the third tier, and the change trend is relatively stable.
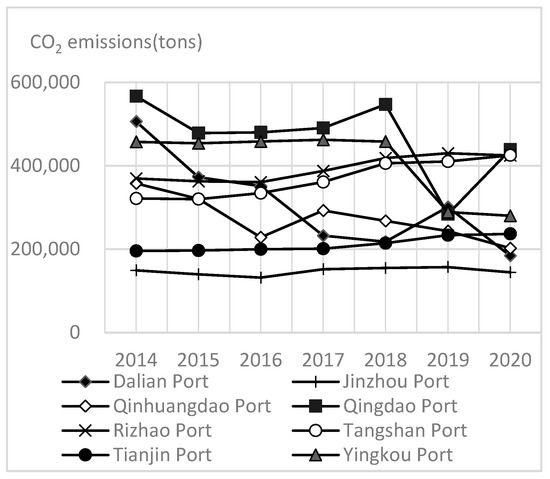
Figure 1.
CO2 emissions by ports.
3.3. Super-Efficiency SBM Analysis Results
According to the selected input-output indicators, a super-efficiency SBM model is established. Assuming that the scale revenue is unchanged (constant return to scale; CRS), the MaxDEA software (MaxDEA software is developed by a software company in Beijing, China) is used to measure the energy conservation and emission reduction efficiency of the ports around the Bohai Sea. The results are shown in Table 3.
Table 3.
Energy conservation and emission reduction efficiency values of the ports around Bohai.
3.3.1. Overall Analysis of Energy Conservation and Emission Reduction Efficiency
There are obvious differences in the efficiency of energy conservation and emission reduction of ports in the Bohai Rim region of China. It can be seen from Table 3 that the energy conservation and emission reduction of Qingdao port is effective during the 2014–2020 time series, Tianjin port is effective after 2017, and other ports are ineffective. During the timing sequence from the year of 2014 to 2020, the average energy conservation and emission reduction efficiency of ports around Bohai region from more to less was as following: Qingdao Port (1.335) > Tianjin Port (1.012) > Dalian Port (0.382) > Yingkou Port (0.311) > Rizhao Port (0.182) > Jinzhou Port (0.128) > Tangshan Port (0.088) > Qinhuangdao Port (0.036). The key node years of 2014, 2017 and 2020 are selected to display the efficiency value and average efficiency of each port. As shown in Figure 2, the development of each port is obviously different. The average efficiency values of Qingdao Port and Tianjin Port are significantly higher than those of other ports. Dalian Port and Yingkou Port are in the second echelon, and the remaining ports are in the third echelon. The average efficiency values of Qingdao Port and Tianjin Port are significantly higher than those of other ports. Dalian Port and Yingkou Port are in the second echelon, and the remaining ports are in the third echelon. Through the input-output data, it can be seen that although the comprehensive energy consumption of Tangshan Port and Qinhuangdao Port is in the middle position, the container and cargo throughput is relatively small in the past 7 years, indicating that the port development level is low and the energy consumption is high, resulting in the energy conservation and emission reduction efficiency of the port at the lowest level among the Bohai Sea ports; the average efficiency of each year did not exceed 0.5, indicating that the overall efficiency of energy conservation and emission reduction of the Bohai Sea port group is low. It is urgent to put forward reasonable improvement measures from the influencing factors to promote the efficiency of energy conservation and emission reduction.
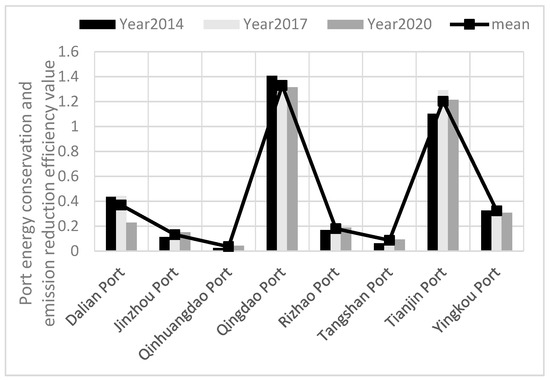
Figure 2.
Energy conservation and emission reduction efficiency value of each port.
The energy conservation and emission reduction efficiency of ports in China’s Bohai Rim region is characterized by two groups of agglomeration. Figure 3 shows that the energy conservation and emission reduction efficiency of Qingdao Port and Tianjin Port remained high and presented an upward trend from the year of 2014 to 2020, Qingdao Port ranked first with the highest efficiency of 1.42 and the lowest value of 1.266, with a relatively small amplitude of fluctuation, while Tianjin Port ranked second with the highest value of 1.291 and the lowest value of 0.599, but its amplitude of fluctuation was relatively large. The efficiency values of the remaining ports did not exceed the overall average of 0.435, and the amplitude of fluctuation was not large. The main reason is that the scale of Qingdao Port and Tianjin Port is relatively large, the management of ports is more scientific and the investment structure of port energy conservation and emission reduction is more reasonable. Since 2010, Qingdao Port has begun to establish a low-carbon economy production and technology system with independent innovation as its connotation; it invested 4.5 billion yuan in 2015 to eliminate an amount of high energy consumption and high pollution equipment, arming the port with advanced technology and equipment, so the efficiency is at a high level and is relatively stable. Tianjin Port has the largest fluctuation during the time series, which is mainly due to the implementation of the LNG (Liquefied Natural Gas) clean energy project in Tianjin Port since 2013. It has experienced the development stage of the LNG project with a construction period of 3–4 years, and the project was put into use by 2017. Therefore, it has produced a rapid increase in 2017 after the decline in energy conservation and emission reduction from 2015 to 2016. The energy conservation and emission reduction efficiency of other ports except Tianjin and Qingdao ports is at a low level and the trend of efficiency change is similar, and the fluctuation range is small.
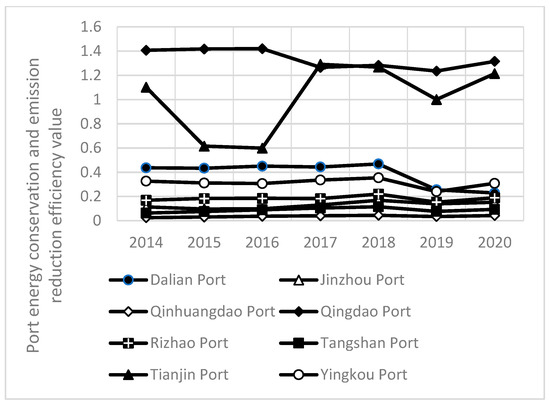
Figure 3.
Time series characteristic diagram of energy conservation and emission reduction efficiency of each port.
3.3.2. Convergence of Energy Conservation and Emission Reduction Efficiency
Since the time series period of this study is from 2014 to 2020, it does not meet the sample size requirement of the convergence test using the time series method. Therefore, this study uses σ convergence and β convergence to verify the convergence trend of energy conservation and emission reduction efficiency in China’s Bohai Rim port area. To a certain extent, σ convergence reflects the degree of dispersion of the research object. In this paper, the coefficient of variation method is selected to test for σ convergence. If the coefficient of variation shows a decreasing trend in the time series, it shows that there is σ convergence. There is a trend that continuously narrows over time in various regions. On the contrary, the difference is expanding. From Table 4, it can be seen that the coefficient of variation showed a downward trend during the years 2014–2018, but the coefficient of variation increased significantly in 2019, resulting in the coefficient of variation at the end of the period (Year 2020) greater than the coefficient of variation at the beginning of the period (Year 2014). Thus, the overall convergence during the time series needs β convergence for further verification.
Table 4.
Variation coefficient of energy conservation and emission reduction efficiency of ports around Bohai from 2014 to 2020.
β convergence is mainly used to measure the changing trend of time series. If there is β convergence, it shows that the efficiency growth rate and growth level of the region will tend to be the same over time. Efficiency differences gradually decrease. In this paper, based on the research of Wang Yan et al. [16], the β convergence test is carried out on the energy conservation and emission reduction efficiency of the Bohai Sea port area. The model is set as follows:
In Formula (6), t and T represent the time at the beginning period (Year 2014) and end of the period (Year 2020), respectively; eseret and esereT represent the energy conservation and emission reduction efficiency values at the beginning and the end of the period, respectively; η represents the convergence speed; εt represents the error term; α is a constant term. The convergence speed η can be obtained from the formula β = −[1 − e−η(T−t)]. If η > 0, it indicates that there is β convergence between regions, otherwise it does not converge. The model was estimated using OLS regression, and the results are shown in Table 5.
Table 5.
Empirical results of β-convergence of ports around the Bohai Sea.
From Table 5, it can be seen that the regression coefficient value β = −0.171 is negative at the 10% significance level, while the convergence rate η = 0.031 is positive; the annual convergence rate is 3.1%, which indicates that for the ports in the time series there is a convergence trend in the increase of energy conservation and emission reduction efficiency. The ports with low energy conservation and emission reduction efficiency are reducing the gap with the ports with high energy conservation and emission reduction efficiency by absorbing advanced energy conservation and emission reduction technology and technological innovation.
3.4. STIRPAT Model Regression Analysis Results
3.4.1. Screening of Independent Variables
In this paper, six influencing factors (port hinterland GDP, main business cost, number of berths, number of employees, R&D investment and environmental regulation) are included in the model for re-screening, scientific selection. SPSS20.0 is used for preliminary regression analysis. The results are shown in Table 6.
Table 6.
Model variable screening.
Through the output results, in light of the stepwise regression method, it can be seen that reducing the multicollinearity by means of excluding the number of staff on active duty, the main business costs and the number of berths, only the hinterland economy, the research input, and the environmental regulation can be influenced significantly; however, considering that setting bias may be caused by the accidental deletion of important relevant variables, the output results of the entry regression method were mainly referred to in this paper. As it was presented by the entry regression method, the p values of the regression test for hinterland economy, the number of berths, main business costs, research input and environmental regulation were less than five percent, the independent variables were significant, and the p value of the regression test for the number of staff on active duty = 0.521, greater than five percent, which was not significant. Therefore, excluding the number of employees, the selected five variables corresponding to the economic, technical and environmental factors in the model verify the rationality of choosing the STIRPAT model and adding environmental factors. The appropriate decomposition and adjusted model is:
lnI = lna + blnGDP + clnMBC + dlnNB + elnT + flnER + lnu
In the Formula (7), lnI is a dependent variable; lnα is a constant term; lnGDP, lnMBC, lnNB, lnT, lnER are independent variables; lnu is an error term; and b, c, d, e, and f are elastic coefficients. Among them, variable I is the energy conservation and emission reduction efficiency of the Bohai Sea port. Variables GDP and MBC represent economic factors, which are the hinterland economy and the cost of main business of the port, and comprehensively reflect the economic strength of the port. The stronger the hinterland economy, the greater the efficiency of port energy conservation; the higher the main business cost is, the smaller the energy conservation and emission reduction efficiency of the port is. Variables T and NB measure the level of technology, the port’s R & D investment and the number of berths. The more R & D investment, the higher the level of low-carbon and green technology, and the higher the efficiency of energy conservation and emission reduction. The more berths not only reflect the higher the comprehensive strength of the port, but also indicate that the closer the combination with advanced technology, the higher the efficiency of energy conservation and emission reduction. The variable ER measures the environmental protection investment by the enterprise. The more sufficient is the environmental protection investment, the higher is the energy conservation and emission reduction efficiency.
3.4.2. OLS Regression Estimation Results
Using SPSS20.0 to construct a multiple regression model for the data, Table 7 shows that the independent variable value of p was less than five percent, but the VIF values of the major business costs and the number of berths were 7.427 and 10.633, respectively, and the VIF value was > 5, indicating that there is a multicollinearity problem in the independent variables. Therefore, the coefficients fitted by OLS regression cannot be guaranteed to be accurate, so OLS regression cannot be used for analysis. The main methods to eliminate data multicollinearity are ridge regression, principal component regression, partial least squares regression, etc. Ridge regression is an improved least squares biased estimation method. Although it is not an unbiased estimation, some scholars such as Luo Hao et al. [32] believe that ridge regression can significantly enhance the stability of the estimation from the perspective of reducing the mean square of the error and improving the singularity of the matrix by selecting an appropriate bias coefficient (k). Meanwhile, Bayo, A. K. [33], Mancini M [34], QONA’AH N [35] and others all pointed out that the model prediction error of ridge regression is lower than that of partial least squares regression.
Table 7.
Analysis of OLS regression results.
3.4.3. Ridge Regression Estimation Results
In this paper, the improved least squares estimation method, ridge regression analysis, is used to solve the problem of multicollinearity of independent variables. The macro of SPSS20.0 is used to call the ridge regression program to obtain the standard regression coefficients under different k values. When the trend of independent variables in the ridge plot tends to be stable and meets the requirement of goodness of fit, the minimum k value that makes the regression coefficient stable is selected as the regression parameter. Combined with ridge plot and fitting degree analysis, when K = 0.15, the coefficient gradually stabilized and R2 was 0.851, the F test passed the test at the 1% significance level, and the fitting degree was good. Therefore, the parameter 0.15 was selected for regression, and the results are shown in Table 8.
Table 8.
Ridge regression results when K = 0.15.
The regression coefficient of the ridge regression is the elastic coefficient. Based on the above analysis, the final linear model is:
From Table 8, it can be seen that the four variables of hinterland GDP, berth number, R & D investment and environmental regulation have a positive impact on efficiency; the main business cost has a negative impact on efficiency. From the formula (8), it can be seen that the percentages of change in the efficiency of port energy conservation and emission reduction caused by each 1% change in the variable from small to large are: main business cost, −0.322%; berths, 0.383%; R & D investment, 0.384%; hinterland economy, 0.407%; environmental regulation, 0.465%.
4. Discussion of Results
Firstly, it can be seen from the empirical results that the average integrated energy conservation and emission reduction efficiency value of the eight ports during the time series is 0.435, and only Qingdao and Tianjin ports achieve effective energy conservation and emission reduction, with the highest value of 1.355 for Qingdao port and 1.012 for Tianjin port. It should be noted that the efficiency measurement of DEA is relative, and the efficiency value over 1 does not mean that the efficiency has reached the best state, but the best input-output efficiency among all decision units. Therefore, Qingdao and Tianjin Port still have room for improvement. Dalian and Yingkou ports are the next most efficient, with average integrated efficiency values of 0.382 and 0.311 respectively, while Rizhao and Jinzhou ports have average integrated efficiency values of 0.182 and 0.128, respectively. Finally, Qinhuangdao Port (0.036) and Tangshan Port (0.088) showed the lowest integrated energy conservation and emission reduction efficiency.
The development synergy of energy conservation and emission reduction efficiency of regional ports is low and there is a wide gap, with Tianjin port leading with an average energy conservation and emission reduction efficiency value of 1.012. In contrast, the average efficiency values of Qinhuangdao Port and Tangshan Port in Hebei are only 0.036 and 0.088. As regions with large port throughput and abundant resources, Qinhuangdao Port and Tangshan Port have great potential for energy conservation and emission reduction and need to learn advanced technology and management experience to narrow the efficiency gap as soon as possible. Qingdao Port and Rizhao Port on the south coast of the Bohai Sea are not very different in scale, but the integrated efficiency value of Rizhao Port is not satisfactory due to the lack of investment in technology, resulting in low efficiency caused by excessive CO2 emissions; Qingdao Port has rapidly improved energy conservation and emission reduction efficiency by virtue of taking the lead in eliminating high energy consumption and high pollution equipment since 2015 and building a low carbon economy production and technology system with independent innovation as its connotation. Dalian, Yingkou and Jinzhou ports on the north coast of the Bohai Sea have a large gap with other regions, mainly because the cargo throughput is only about 60% of that of Qingdao and Tianjin ports, and the low output results in low rates. They should actively build a fair and convenient business environment, improve their market operation ability to obtain more customers, further integrate regional resources, give full play to Dalian port’s unique location advantage, and abandon regional vicious competition in order to seek synergistic improvement in energy conservation and emission reduction efficiency.
Secondly, among the economic factors, the hinterland economy plays a supporting role in the energy conservation and emission reduction efficiency of the port, while the main business cost has a negative impact on it, which indicates that the comprehensive economic strength of the port determined by the operational efficiency is an important pillar of the energy conservation and emission reduction efficiency. The comprehensive economic strength of the Bohai Rim ports is uneven. With the improvement of port economic strength, the efficiency of energy conservation and emission reduction is also increasing. Overall, the efficiency of energy conservation and emission reduction of ports on the north coast of the Bohai Sea is lower than that on the south coast, which to a certain extent illustrates the fact that the effect of the integration of ports on the north coast of the Bohai Sea is not enough, as well as the underdeveloped maritime transport in Beijing, Tianjin and Hebei. Under the influence of economic integration, on the one hand, the regional governments with strong economic strength in the hinterland of the port can implement energy conservation and emission reduction policies and improve energy conservation and emission reduction mechanisms. However, a good business and economic environment promotes port enterprises to apply new energy technologies and effectively control pollutant emissions. Simultaneously, the main business cost of the port is negatively correlated with the profit, which indicates that the port lacks the awareness of cost management or the awareness of cost control. As the profit space of the enterprise is squeezed, it is forced to adopt more cautious economic analysis and technology application, which hinders the promotion of energy conservation and emission reduction tasks.
Thirdly, among the technical factors, R & D investment and the number of berths significantly affect the efficiency of energy conservation and emission reduction of port enterprises, which shows that the technological difference in the ports around the Bohai Sea is one of the main factors leading to the difference in energy conservation and emission reduction efficiency. Technological progress is the main driving force in promoting the improvement of energy conservation and emission reduction efficiency, and it is negatively correlated with regional resource endowment; that is, the richer the resources, the lower the efficiency of energy conservation and emission reduction, such as Tangshan Port and Qinhuangdao Port. The reason is that the low marginal cost of energy consumption causes enterprises to ignore energy conservation. Moreover, the endogenous economic growth theory in economics points out that the improvement of technological level can effectively reduce the waste and consumption of energy. Adequate R & D investment can improve the technological level of enterprises and change the original production process and management mode, particularly increasing the application of clean energy technology. At the same time, the number of port berths is proportional to the scale of the port. With the iteration of port berths and the expansion of port scale, local governments will strengthen their support for enterprise energy supply, environmental protection and technical services, which is conducive to the combination of advanced technology, promoting the progress of terminals and berths, and reducing comprehensive energy consumption and pollutant emissions.
Fourthly, among the environmental factors, under the constraint of low carbon, environmental regulation is an important measure to stimulate and restrict the ports around the Bohai Sea, which shows that environmental regulation has the most obvious effect on the improvement of energy conservation and emission reduction efficiency. For example, Qingdao and Tianjin, as national low-carbon pilot cities, have carried out in-depth energy conservation and emission reduction and energy efficiency improvement in the transportation field, prompting port enterprises to lead with green and smart ports, and effectively improving the efficiency of port energy conservation and emission reduction. According to economic theory, energy and the environment are inefficient in market allocation. At this time, the government’s invisible hand can be reasonably adjusted. Enterprises are the main body of energy conservation and emission reduction. With the further promotion of carbon peak and carbon neutrality targets, the port transportation field is bound to improve the enterprise system management under the leadership of the government, increase environmental protection investment, improve the level of port greening, and adopt clean energy and pollution treatment equipment to curb pollution and improve the ecological environment, thereby improving the efficiency of energy conservation and emission reduction of enterprises.
5. Conclusions
Based on the super-efficiency SBM model considering undesirable output, this study assumes that the scale income is unchanged (Constant Return to Scale: CRS), measures and evaluates the energy conservation and emission reduction efficiency of the ports around the Bohai Sea, and then uses the STIRPAT model which expands the environmental regulation factors to construct the influencing factors model of the energy conservation and emission reduction efficiency of the ports around the Bohai Sea in China. Due to the multicollinearity of the variables, this study uses ridge regression to analyze the influencing factors. The main conclusions are as follows:
The super-efficiency SBM model has calculated that the development of Chinese ports around the Bohai Sea is uneven, with two clusters of agglomeration characteristics, and the energy conservation and emission reduction efficiency of Qingdao port and Tianjin port ran at a high level during the time series period and showed an upward trend, while the average integrated energy conservation and emission reduction efficiency of other ports is lower than the average value of 0.435. The average energy conservation and emission reduction efficiency are ranked as: Qingdao Port > Tianjin Port > Dalian Port > Yingkou Port > Rizhao Port > Jinzhou Port > Tangshan Port > Qinhuangdao Port. The reasons for ports’ non-efficiency are due to too many input factors, but fewer inputs compared to container throughput and too many CO2 emissions from non-desired outputs. Although there is a convergence trend of the uneven energy conservation and emission reduction efficiency in the Bohai Sea ports during the time series, the ports with lower energy conservation and emission reduction efficiency are absorbing advanced technology and technological innovation to narrow the gap with the ports with high energy conservation and emission reduction efficiency. However, from an overall perspective, the average efficiency value of each year is no more than 0.5, which indicates that the energy conservation and emission reduction work of the ports around the Bohai Sea still needs to be promoted unceasingly.
The analysis of the influencing factors shows that the hinterland economy supports the energy conservation and emission reduction efficiency of the ports, while the main business cost has a negative influence on it, indicating that the comprehensive economic strength of the ports determined by their operational efficiency is an important pillar of energy conservation and emission reduction efficiency. R&D investment and the number of berths significantly affects the energy conservation and emission reduction efficiency of port enterprises, suggesting that technological progress is the main driving force to promote energy conservation and emission reduction efficiency and is negatively related to regional resource endowment. Environmental regulation has a positive effect on the improvement of energy conservation and emission reduction efficiency, indicating that environmental regulation is an important incentive and constraint for ports in the Bohai Rim.
Starting from the super-efficiency SBM model that considers non-expected outputs, this study solves the problem that traditional port efficiency evaluation does not consider energy inputs. In terms of indicator selection, we establish an evaluation system for port energy conservation and emission reduction efficiency in energy inputs, facility inputs, the expected outputs and non-expected outputs. The interaction between the variables could be examined in future studies. In addition, this paper analyzes efficiency from a static perspective, but in the future, we can consider combining dynamic efficiency with static efficiency, such as using the Malmquist method, and focus on solving the problems of using and processing “dynamic data” for dynamic evaluation of port efficiency. Finally, there are many quantitative studies on the evaluation of energy conservation and emission reduction efficiency of ports, but there are few qualitative studies on how to improve energy conservation and emission reduction efficiency scientifically and specifically from the internal operation of ports, and the mechanism needs to be further explored.
Author Contributions
Conceptualization, S.W.; methodology, S.W. and Y.L.; software, Z.L.; validation, Z.L.; formal analysis, Y.L.; investigation, S.W.; resources, S.W.; data curation, Y.L.; writing—original draft preparation, Z.L.; writing—review and editing, Y.L.; visualization, S.W.; supervision, B.L.; project administration, S.W.; funding acquisition, B.L. All authors have read and agreed to the published version of the manuscript.
Funding
This research is funded by the National Natural Science Foundation of China under Grant [Number 72073018; 71703011]; the Key Project of Philosophy and Social Science Foundation of China [grant number 20&ZD129]; the Natural Science Foundation of Liaoning [grant number 2020-MS-123]; the Science and Technology Innovation Foundation of Dalian [grant number 2021JJ12GX013]; the Liaoning revitalization talents program [grant number XLYC2007191]; the Liaoning baiqianwan talents project [grant number 2021-222]; and the Fundamental Research Project for the Central Universities [grant number DUT21RW303].
Institutional Review Board Statement
The study was conducted in accordance with the Declaration of Helsinki, and approved by the Institutional Review Board of Dalian University.
Informed Consent Statement
Not applicable.
Data Availability Statement
Data sources: 1. The port cargo and container throughput comes from the “China Port Network”. The website is as follows: http://www.port.org.cn/info/2020/206584.htm (accessed on 5 June 2022). 2. The length, number of berths, and annual throughput of berths (including container throughput, passenger throughput, and metal ore) are from the “China Port Yearbook” of CNKI. The link is as follows: https://navi.cnki.net/KNavi/YearbookDetail?pcode=CYFD&pykm=YZGAW&bh= (accessed on 5 June 2022). 3. The comprehensive energy unit consumption and R&D expenditure of the port are from the social responsibility reports of each port. The social responsibility reports are from http://www.cninfo.com.cn (accessed on 5 June 2022). The website is as follows: http://www.cninfo.com.cn/new/index (accessed on 5 June 2022). 4. The economy of hinterland comes from local statistics bureaus.
Conflicts of Interest
The authors declare no conflict of interest.
References
- Hoang, A.T.; Foley, A.M.; Nižetić, S.; Huang, Z.; Ong, H.C.; Ölçer, A.I.; Pham, V.V.; Nguyen, X.P. Energy-related approach for reduction of CO2 emissions: A critical strategy on the port-to-ship pathway. J. Clean. Prod. 2022, 355, 131772. [Google Scholar] [CrossRef]
- Alzahrani, A.; Petri, I.; Rezgui, Y.; Ghoroghi, A. Decarbonisation of seaports: A review and directions for future research. Energy Strat. Rev. 2021, 38, 100727. [Google Scholar] [CrossRef]
- Wang, T.; Du, Y.; Fang, D.; Li, Z.-C. Berth Allocation and Quay Crane Assignment for the Trade-off Between Service Efficiency and Operating Cost Considering Carbon Emission Taxation. Transp. Sci. 2020, 54, 1307–1331. [Google Scholar] [CrossRef]
- Pan, X.; Li, M.; Wang, M.; Zong, T.; Song, M. The effects of a Smart Logistics policy on carbon emissions in China: A difference-in-differences analysis. Transp. Res. Part E Logist. Transp. Rev. 2020, 137, 101939. [Google Scholar] [CrossRef]
- Li, X.; Kuang, H.; Hu, Y. Cooperation strategy of port and shipping company under emission control. Syst. Eng. Theory Pract. 2021, 41, 1750–1760. [Google Scholar]
- Lu, B.; Wang, H. Countermeasures of the government to facilitate green port construction based on evolutionary game theory. East China Econ. Manag. 2017, 31, 153–159. [Google Scholar]
- Guo, J.; Kuang, H.; Yu, F. Study on Port Carbon Footprint Measurement and Drive Factors from the Perspective of Energy Consumption. Manag. Rev. 2020, 32, 40–51. [Google Scholar]
- Deng, G.; Chen, J.; Liu, Q. Influence Mechanism and Evolutionary Game of Environmental Regulation on Green Port Construction. Sustainability 2022, 14, 2930. [Google Scholar] [CrossRef]
- Liu, J.; Wang, X.; Guo, J. Port efficiency and its influencing factors in the context of Pilot Free Trade Zones. Transp. Policy 2021, 105, 67–79. [Google Scholar] [CrossRef]
- Li, L.-L.; Seo, Y.-J.; Ha, M.-H. The efficiency of major container terminals in China: Super-efficiency data envelopment analysis approach. Marit. Bus. Rev. 2021, 6, 173–187. [Google Scholar] [CrossRef]
- Elsayed, A.; Khalil, N.S. Evaluate and analysis efficiency of safaga port using DEA-CCR, BCC and SBM models–comparison with DP world Sokhna. IOP Conf. Ser. Mater. Sci. Eng. 2017, 245, 042033. [Google Scholar] [CrossRef]
- Na, J.-H.; Choi, A.-Y.; Ji, J.; Zhang, D. Environmental efficiency analysis of Chinese container ports with CO2 emissions: An inseparable input-output SBM model. J. Transp. Geogr. 2017, 65, 13–24. [Google Scholar] [CrossRef]
- Wu, Y.; Tian, F. Considering the analysis of the main port efficiency of the main port of my country’s coastal coast. Gansu Sci. Technol. 2020, 36, 98–104. [Google Scholar]
- Taleb, M.; Khalid, R.; Emrouznejad, A.; Ramli, R. Environmental efficiency under weak disposability: An improved super efficiency data envelopment analysis model with application for assessment of port operations considering NetZero. Environ. Dev. Sustain. 2022, 1–30. [Google Scholar] [CrossRef]
- Liu, W.; Lin, B. Analysis of energy efficiency and its influencing factors in China’s transport sector. J. Clean. Prod. 2018, 170, 674–682. [Google Scholar] [CrossRef]
- Yan, W.; Yi, S. The Influencing Factors of Energy Conservation and Emission Reduction Efficiency in China from the Perspective of Green Development—An Empirical Study Based on Super-efficiency DEA and Tobit Models. Manag. Rev. 2020, 32, 59–71. [Google Scholar]
- Thio, E.; Tan, M.; Li, L.; Salman, M.; Long, X.; Sun, H.; Zhu, B. The estimation of influencing factors for carbon emissions based on EKC hypothesis and STIRPAT model: Evidence from top 10 countries. Environ. Dev. Sustain. 2022, 24, 11226–11259. [Google Scholar] [CrossRef]
- He, Y.; Fu, F.; Liao, N. Analysis on the effect R & D investment on carbon emission industrial sector based on STIRPAT model. Sci. Technol. Manag. Res. 2021, 41, 206–212. [Google Scholar]
- Yang, J.; Dong, Y. Analysis of influencing factors of water environmental pollution in China based on STIRPAT model. Environ. Sci. 2021, 47, 53–57. [Google Scholar]
- Tone, K. A slacks-based measure of super-efficiency in data envelopment analysis. Eur. J. Oper. Res. 2002, 143, 32–41. [Google Scholar] [CrossRef]
- Yuan, T.; Zhang, J.; Xiang, Y.; Lu, L. Exploring the Temporal and Spatial Evolution Laws of County Green Land-Use Efficiency: Evidence from 11 Counties in Sichuan Province. Buildings 2022, 12, 816. [Google Scholar] [CrossRef]
- Dietz, T.; Rosa, E.A. Rethinking the environmental impacts of population, affluence and technology. J. Hum. Ecol. Rev. 1994, 1, 277–300. [Google Scholar]
- Lu, B.; Wen, Y.; Xing, J.; Song, D. Competition and cooperation strategy of Bohai Rim port under the framework of TEI@I methodology. Manag. Rev. 2020, 32, 246–257. [Google Scholar]
- Chen, X. Difference of energy efficiency in China based on non-expected output. China J. Manag. Sci. 2019, 27, 191–198. [Google Scholar]
- Lu, B.; Qiu, W.; Xing, J.; Wen, Y. Coordinated development strategy of China’s coastal node ports and cities based on assessment of Belt and Road. Syst. Eng. Theory Pract. 2020, 40, 1627–1639. [Google Scholar]
- Wu, C. Research on the synergistic effect of low-carbon economy in China. Manag. World 2021, 37, 105–117. [Google Scholar]
- Li, Q.; Feng, Y.; Yu, M. Research on the Impact of Environmental Regulation on Industrial Energy Conservation and Emission Reduction—Based on System Dynamics Simulation. East China Econ. Manag. 2020, 34, 64–72. [Google Scholar]
- Li, G.; Li, X. Environmental regulation, industrial structure upgrade and high-quality economic development-thinking. Stat. Decis.-Mak. 2022, 18, 26–31. [Google Scholar]
- He, Y.; Wang, Q.; Liu, D. Measurement and Spatial-Temporal Evolution of green production efficiency in China: Based on undesired input ISBM. Math. Stat. Manag. 2022, 1–18. [Google Scholar] [CrossRef]
- Porter, M.E. America ’s Green Strategy. Sci. Am. 1991, 264, 168–170. [Google Scholar] [CrossRef]
- Ge, Y.; Wang, S. Total factor productivity and influencing factors analysis for ports considering carbon emissions. Transp. Syst. Eng. Inf. 2021, 21, 22–29. [Google Scholar]
- Luo, H.; Chen, R. A study on the growth accounting of China’s hotel industry. Travel. J. 2020, 35, 14–25. [Google Scholar]
- Bayo, A.K.; Rafiu, A.B.; Funmilayo, A.T.; Oluyemi, O.I. Investigating the impact of multicollinearity on linear regression estimates. Malays. J. Comput. (MJoC) 2021, 6, 698–714. [Google Scholar]
- Mancini, M.; Taavitsainen, V.; Toscano, G. Comparative study between Partial Least Squares and Rational function Ridge Regression models for the prediction of moisture content of woodchip samples using a handheld spectrophotometer. J. Chemom. 2021, 35, e3337. [Google Scholar] [CrossRef]
- Qona’ah, N.; Pratiwi, H.; Susanti, Y. Model Output Statistics Dengan Principal Component Regression, Partial Least Square Regression, Dan Ridge Regression Untuk Kalibrasi Prakiraan Cuaca Jangka Pendek. J. Mat. UNAND 2021, 10, 355–368. [Google Scholar] [CrossRef]


Publisher’s Note: MDPI stays neutral with regard to jurisdictional claims in published maps and institutional affiliations. |
© 2022 by the authors. Licensee MDPI, Basel, Switzerland. This article is an open access article distributed under the terms and conditions of the Creative Commons Attribution (CC BY) license (https://creativecommons.org/licenses/by/4.0/).