
Study on Analysis Principle of Spatial System Method for a Hydraulic Steel Gate


Abstract
:1. Introduction
2. Gate Structure Composition and Research Method
3. Analysis Principle of SSM for Gate Structure
3.1. Authenticity of Geometric Modeling
3.2. Appropriateness of Finite Element Type
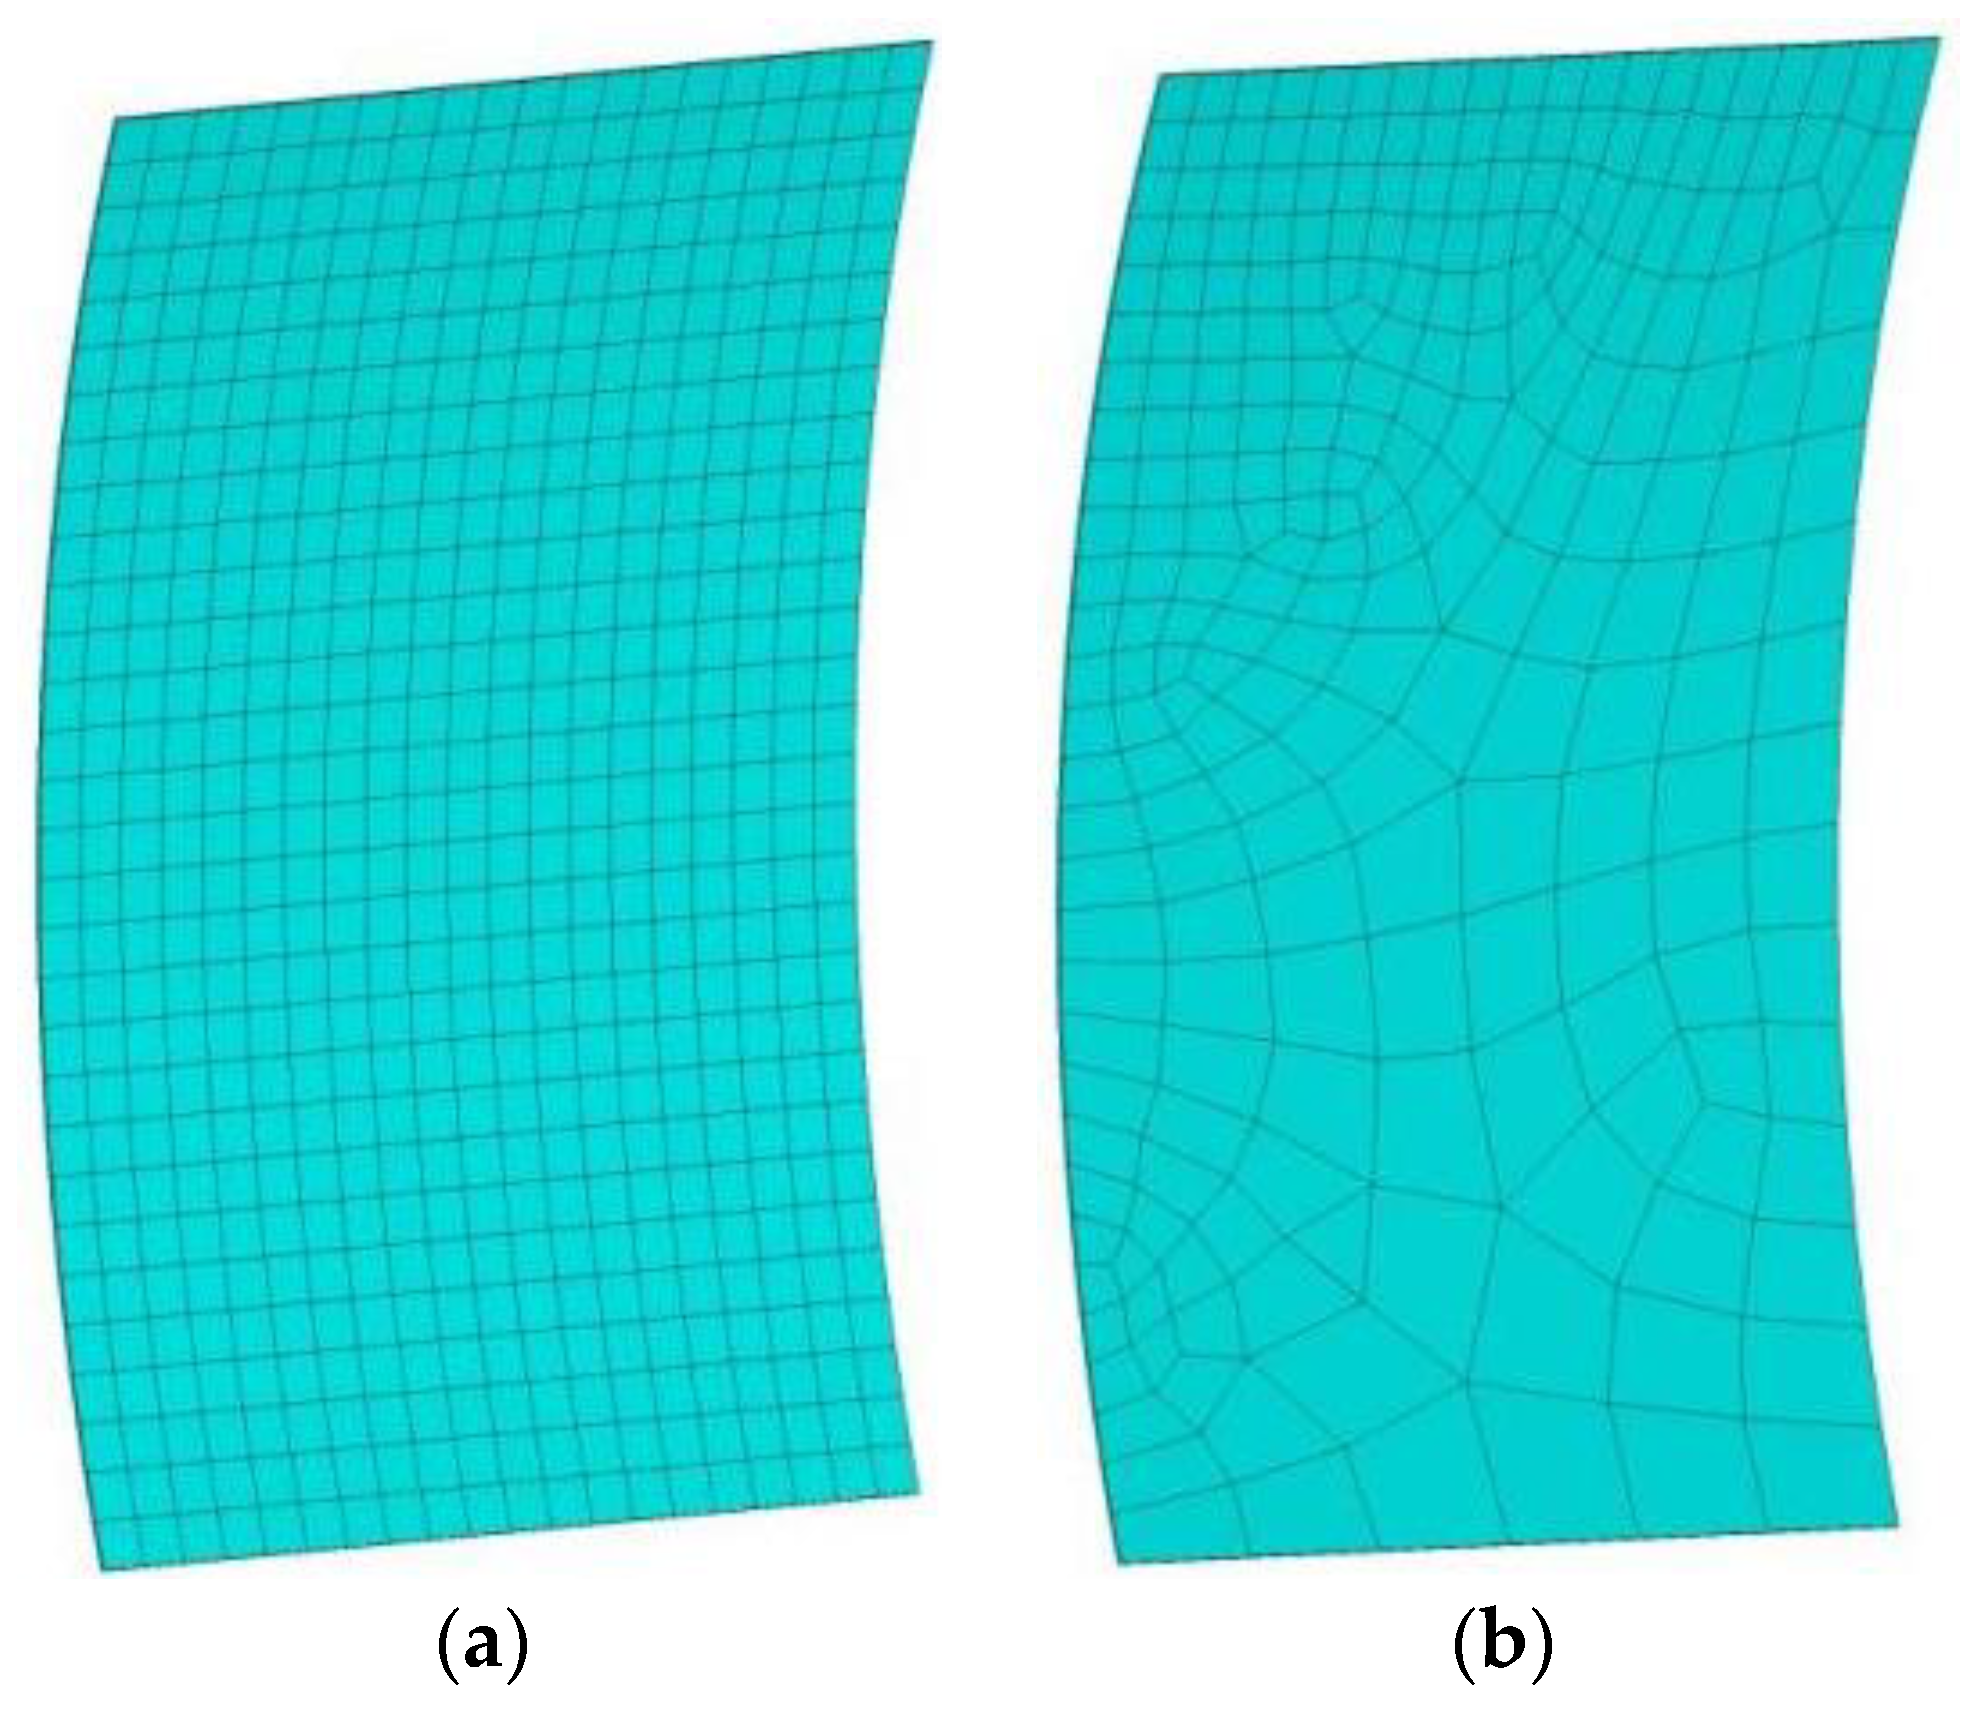
3.3. Rationality of Finite Element Mesh Generation
3.4. Accuracy of Constraints and Loads
4. Analysis Principle of Beam Structure
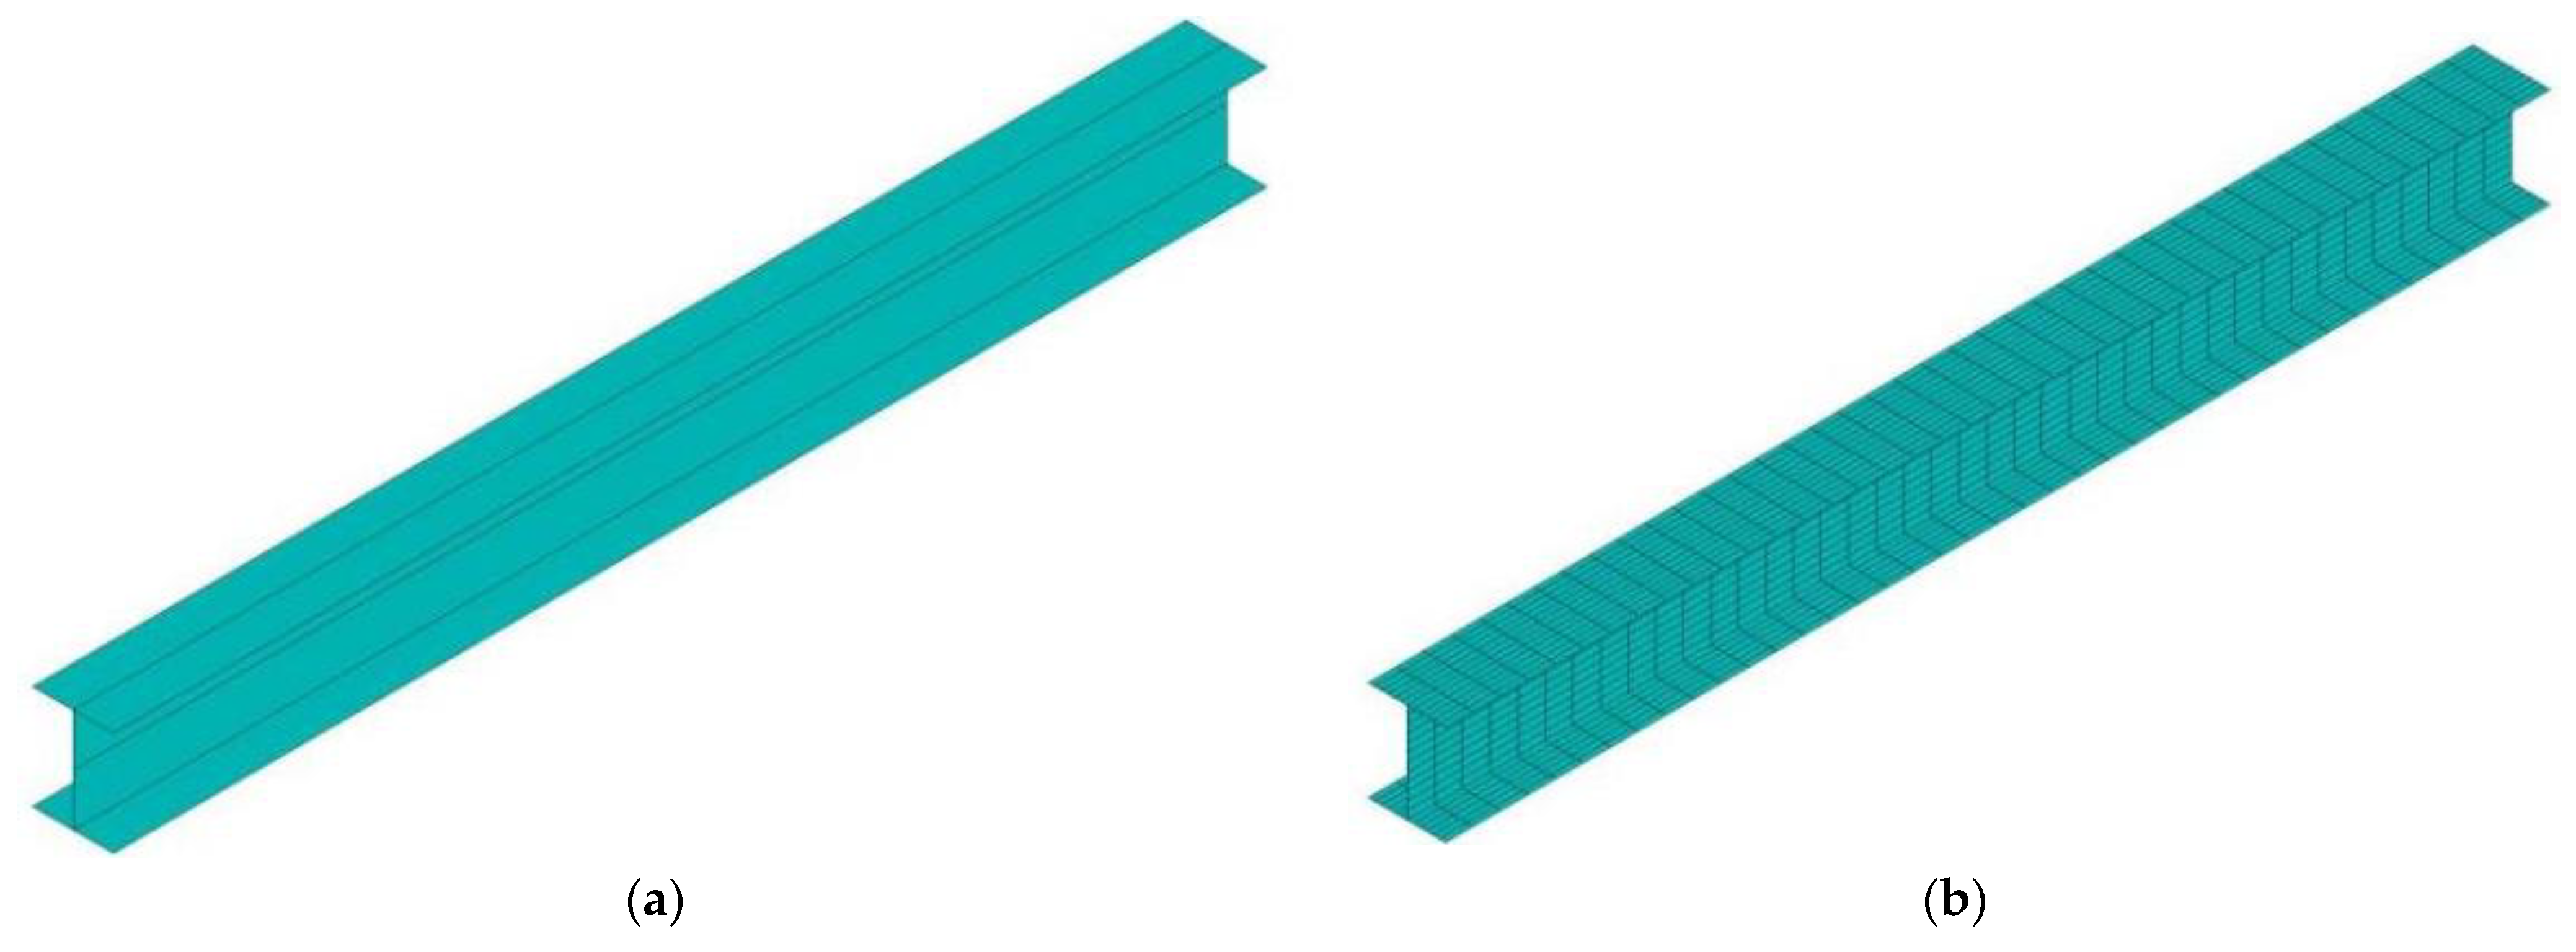
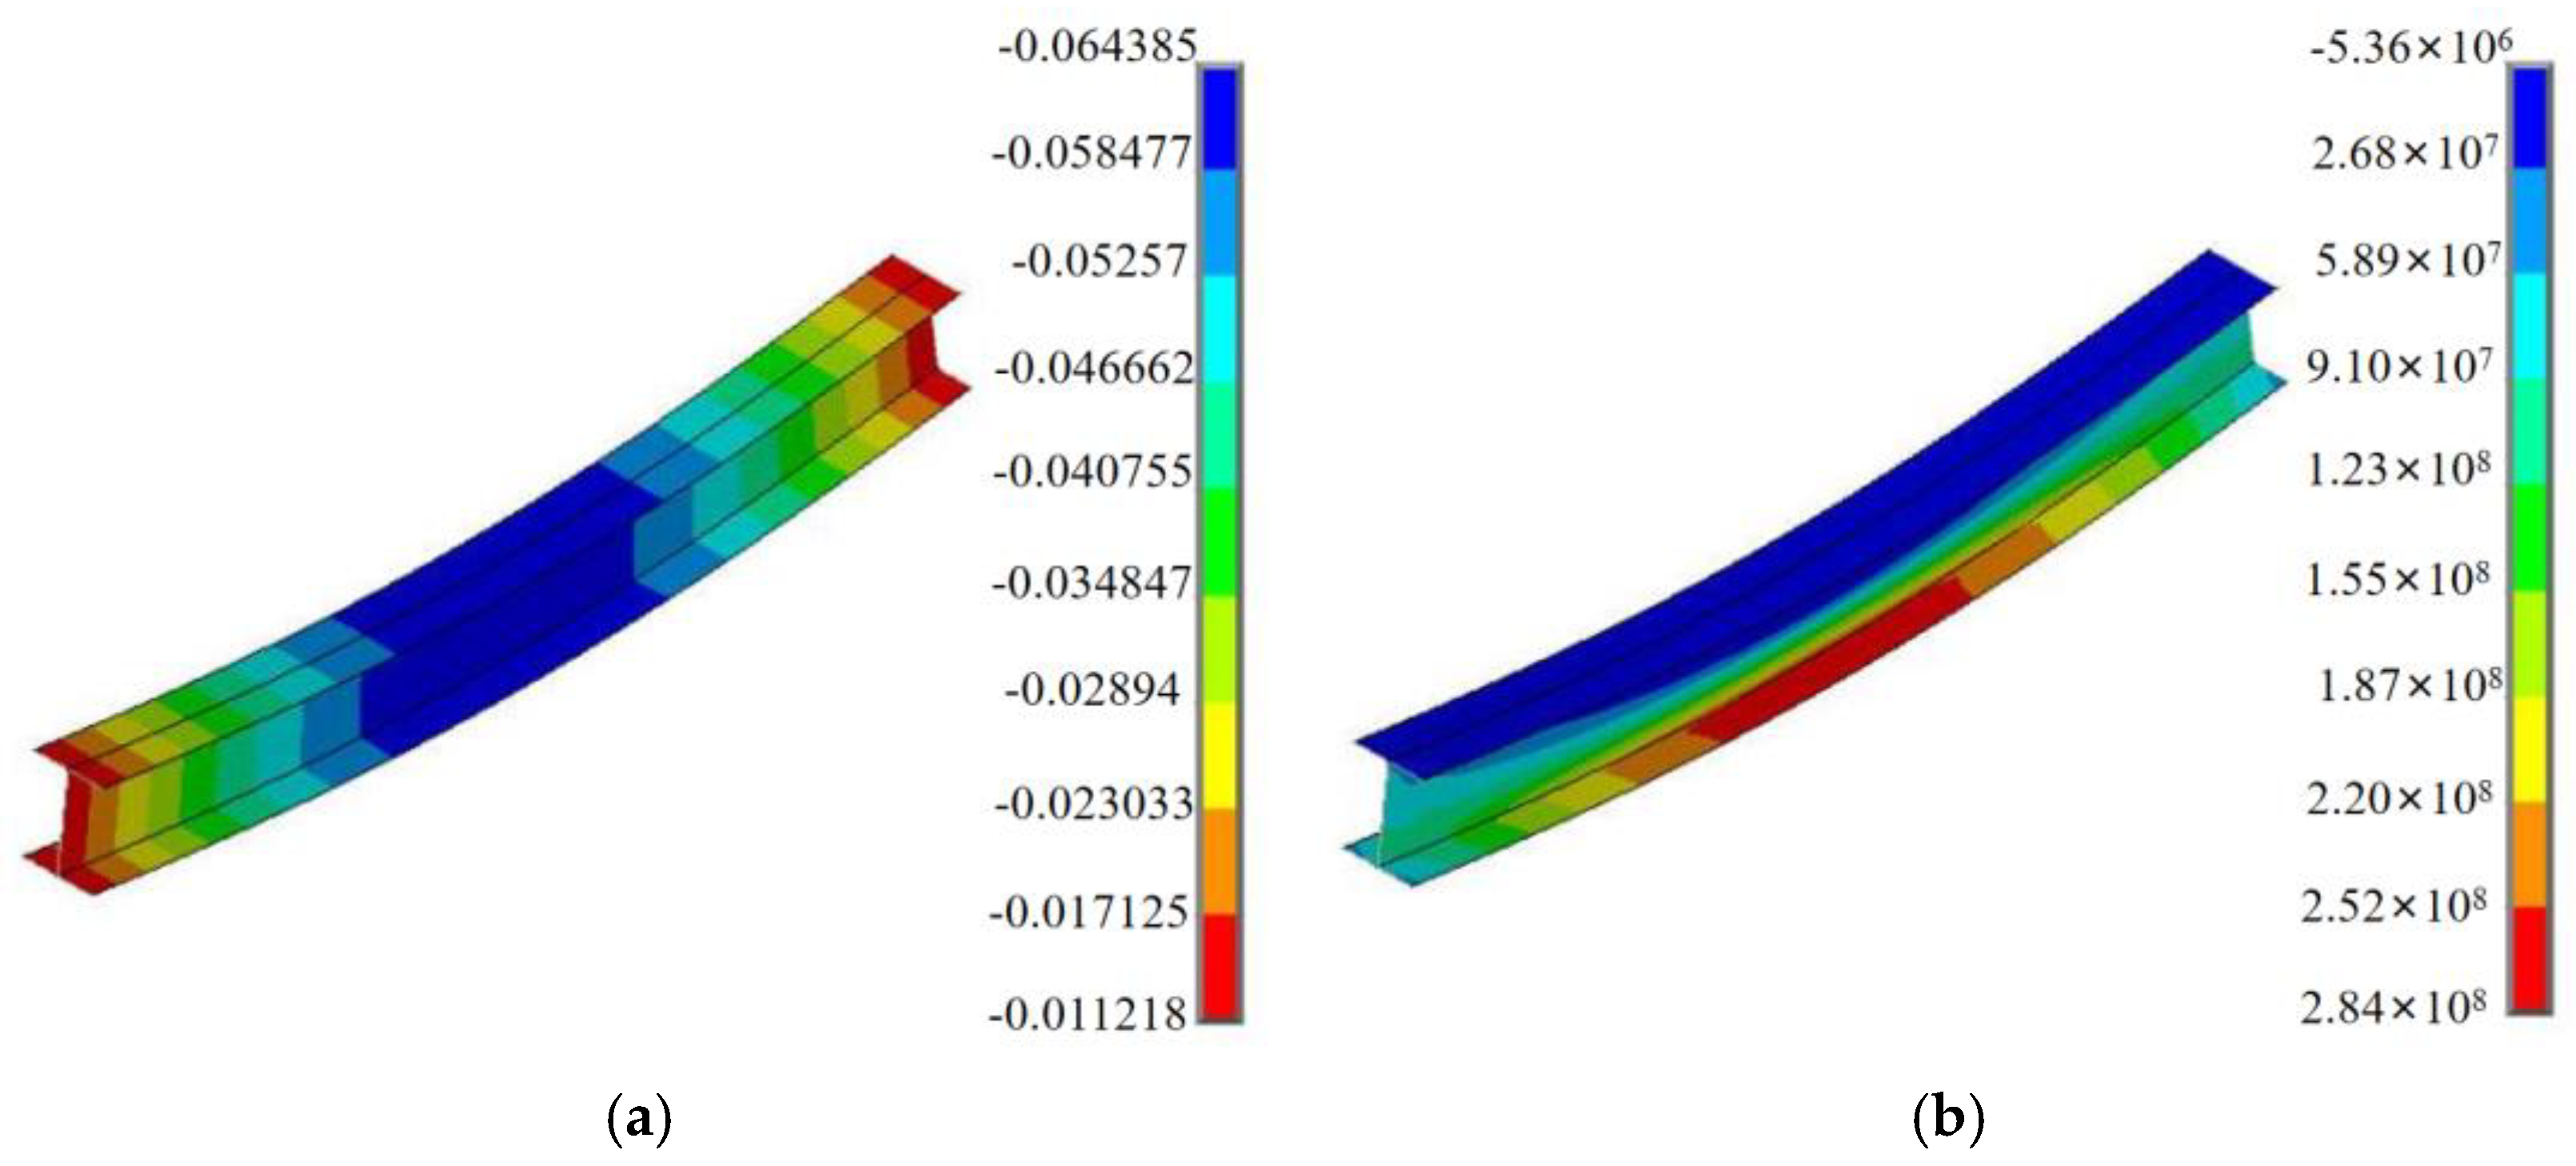
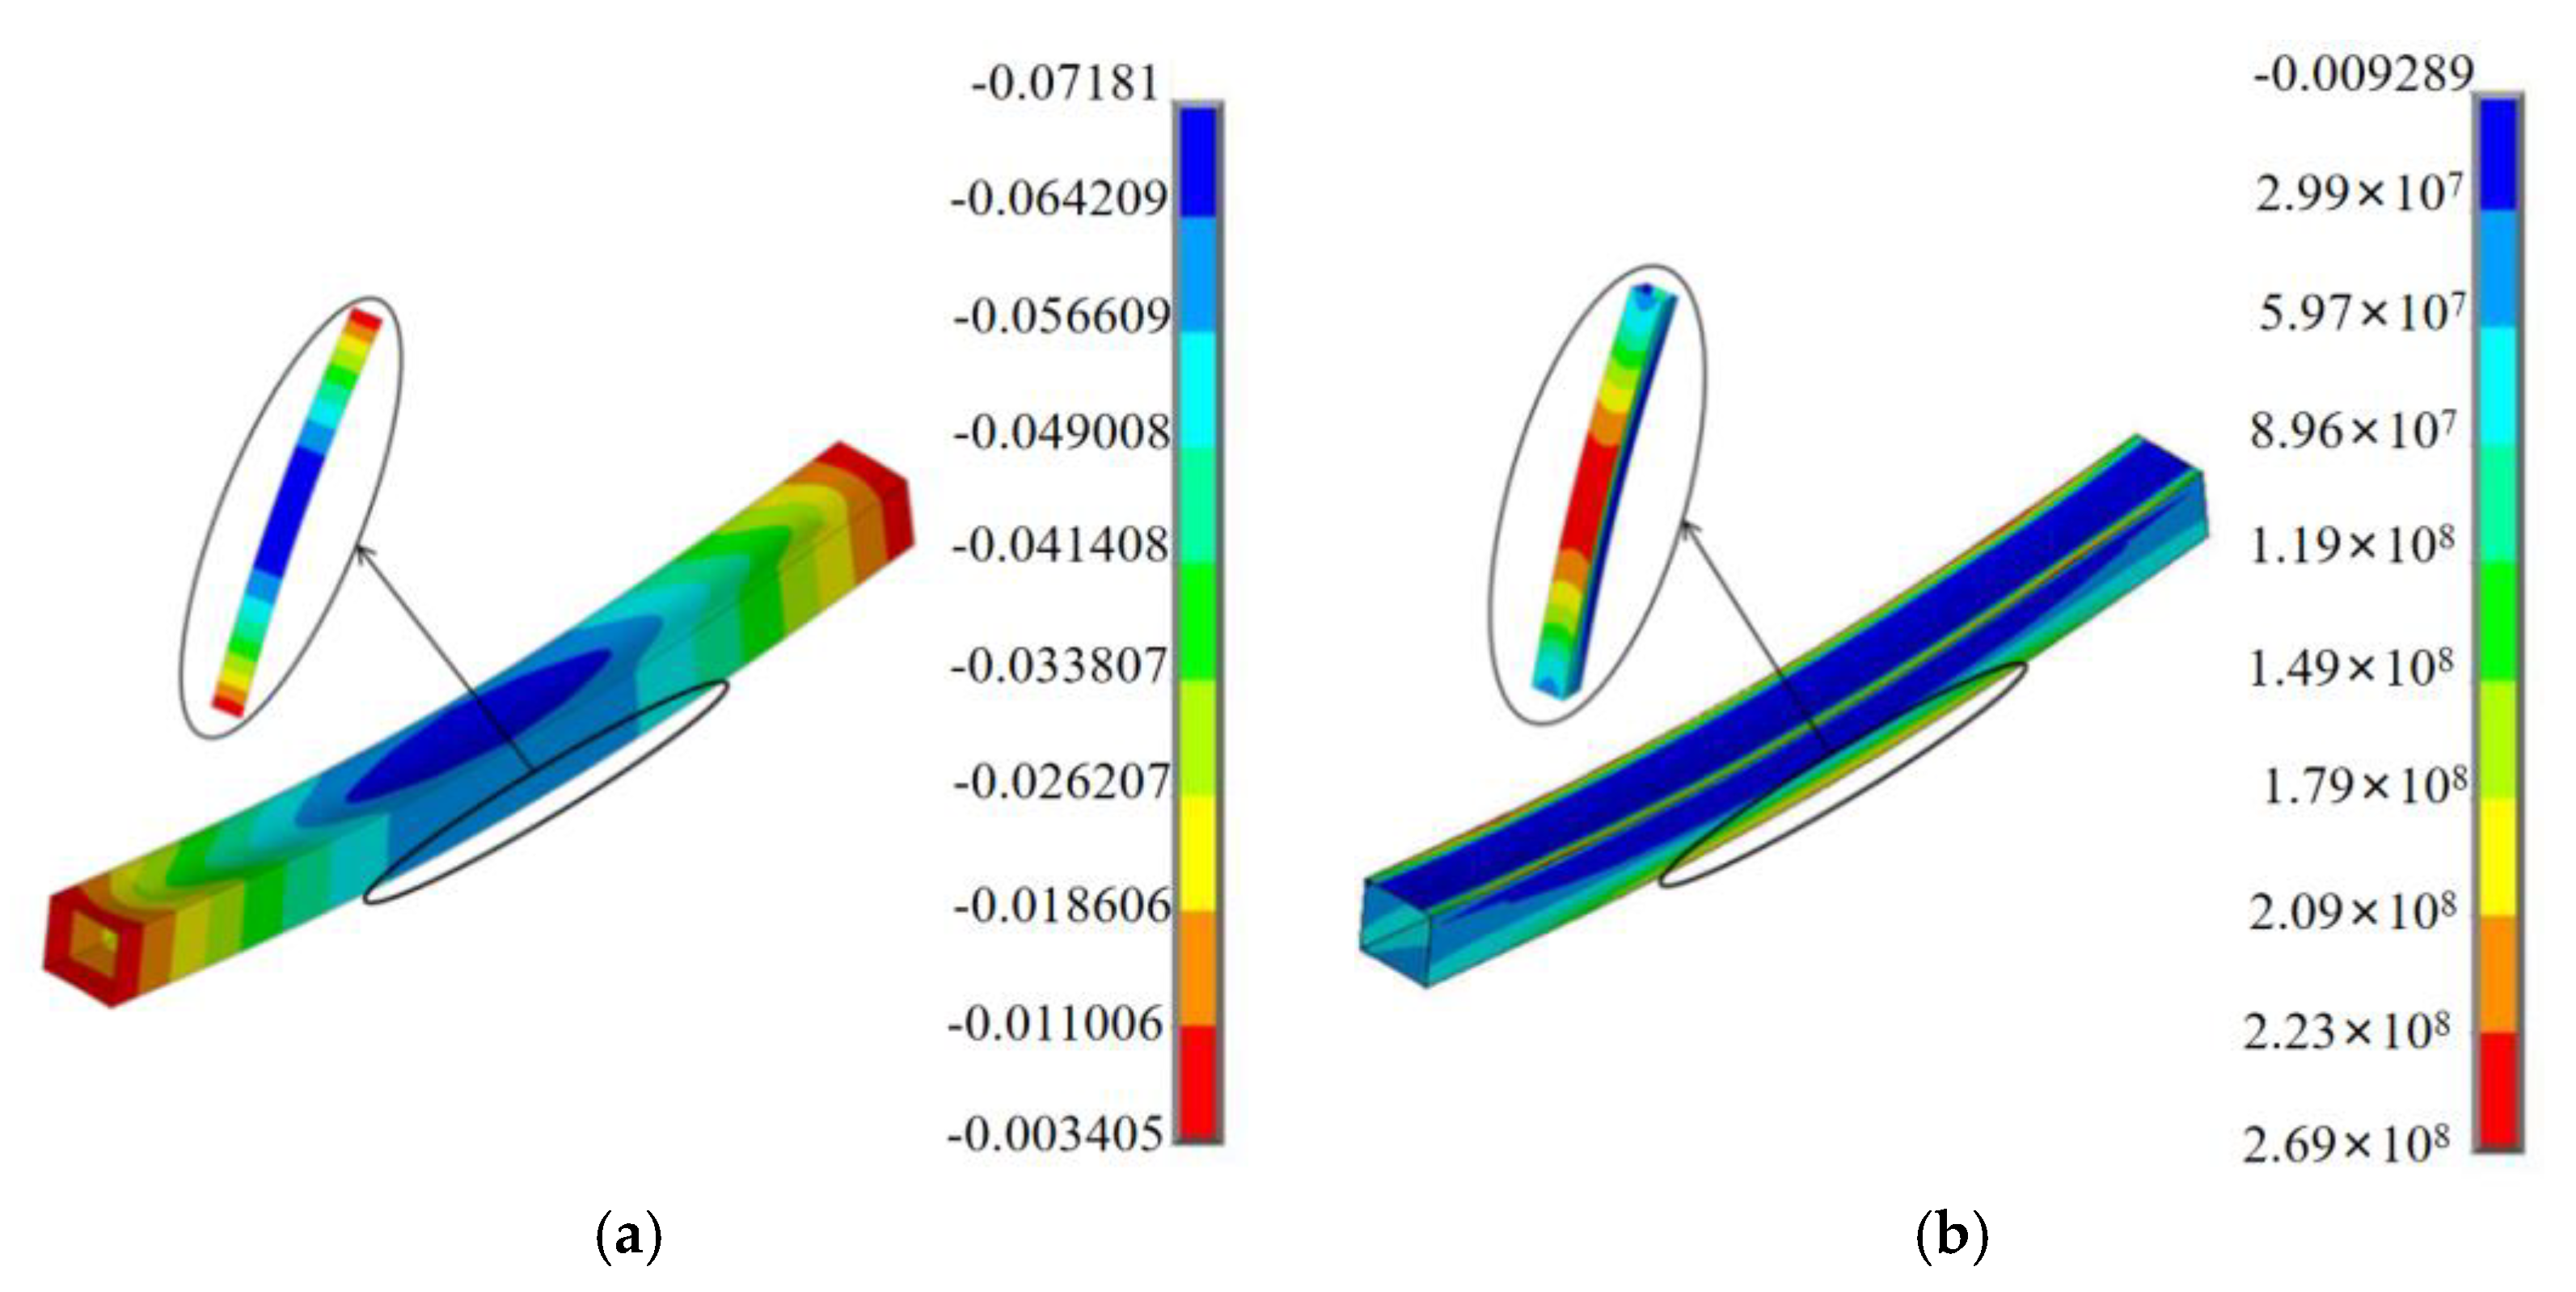
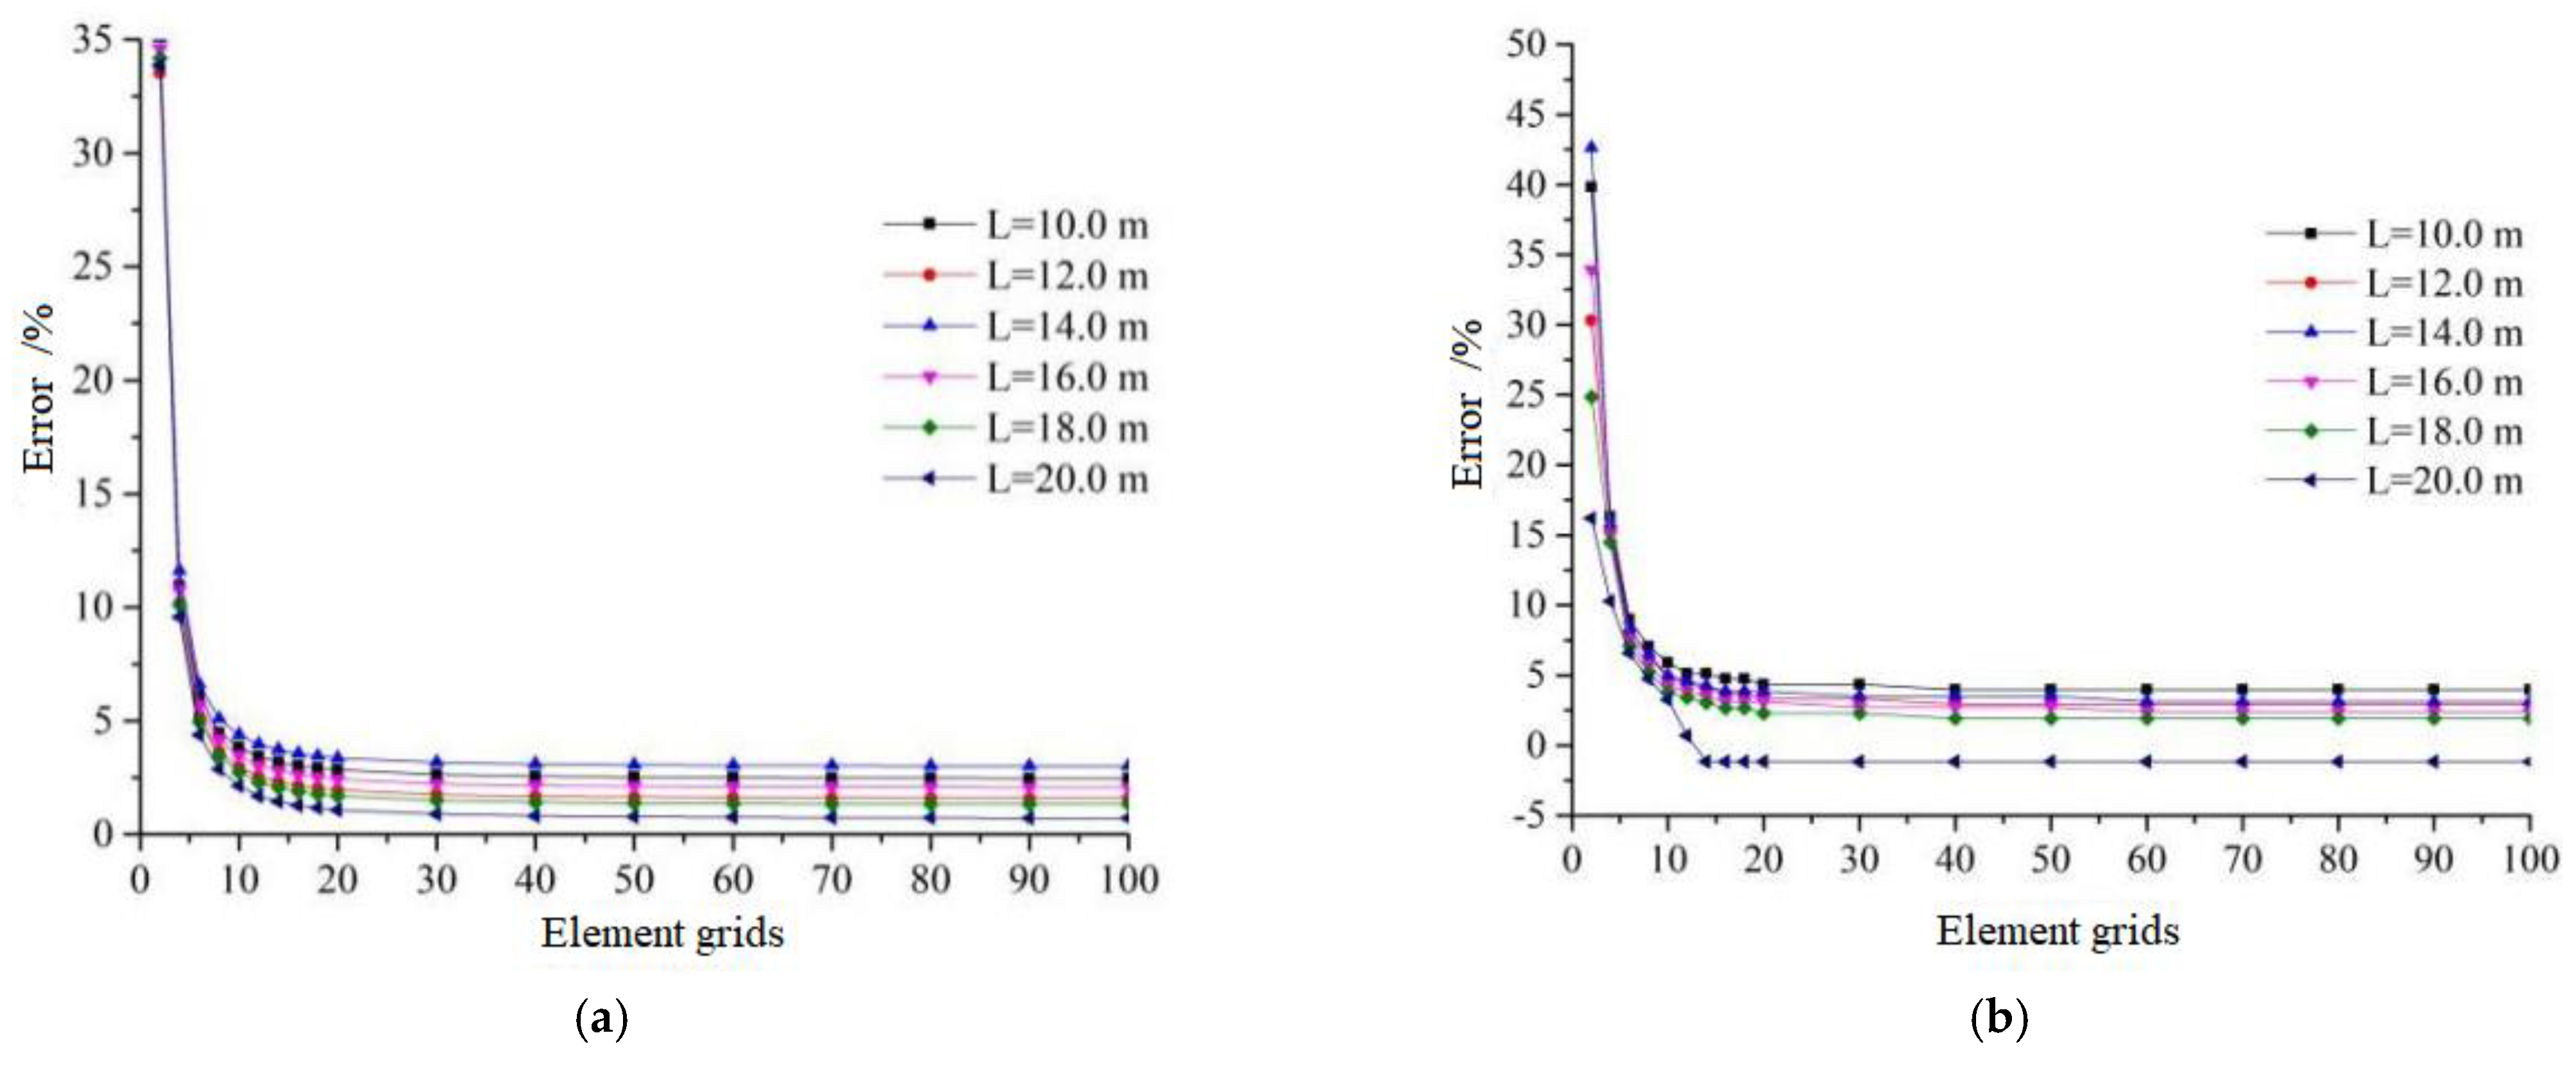
4.1. Reasonable Finite Element Mesh Number of I-Beam
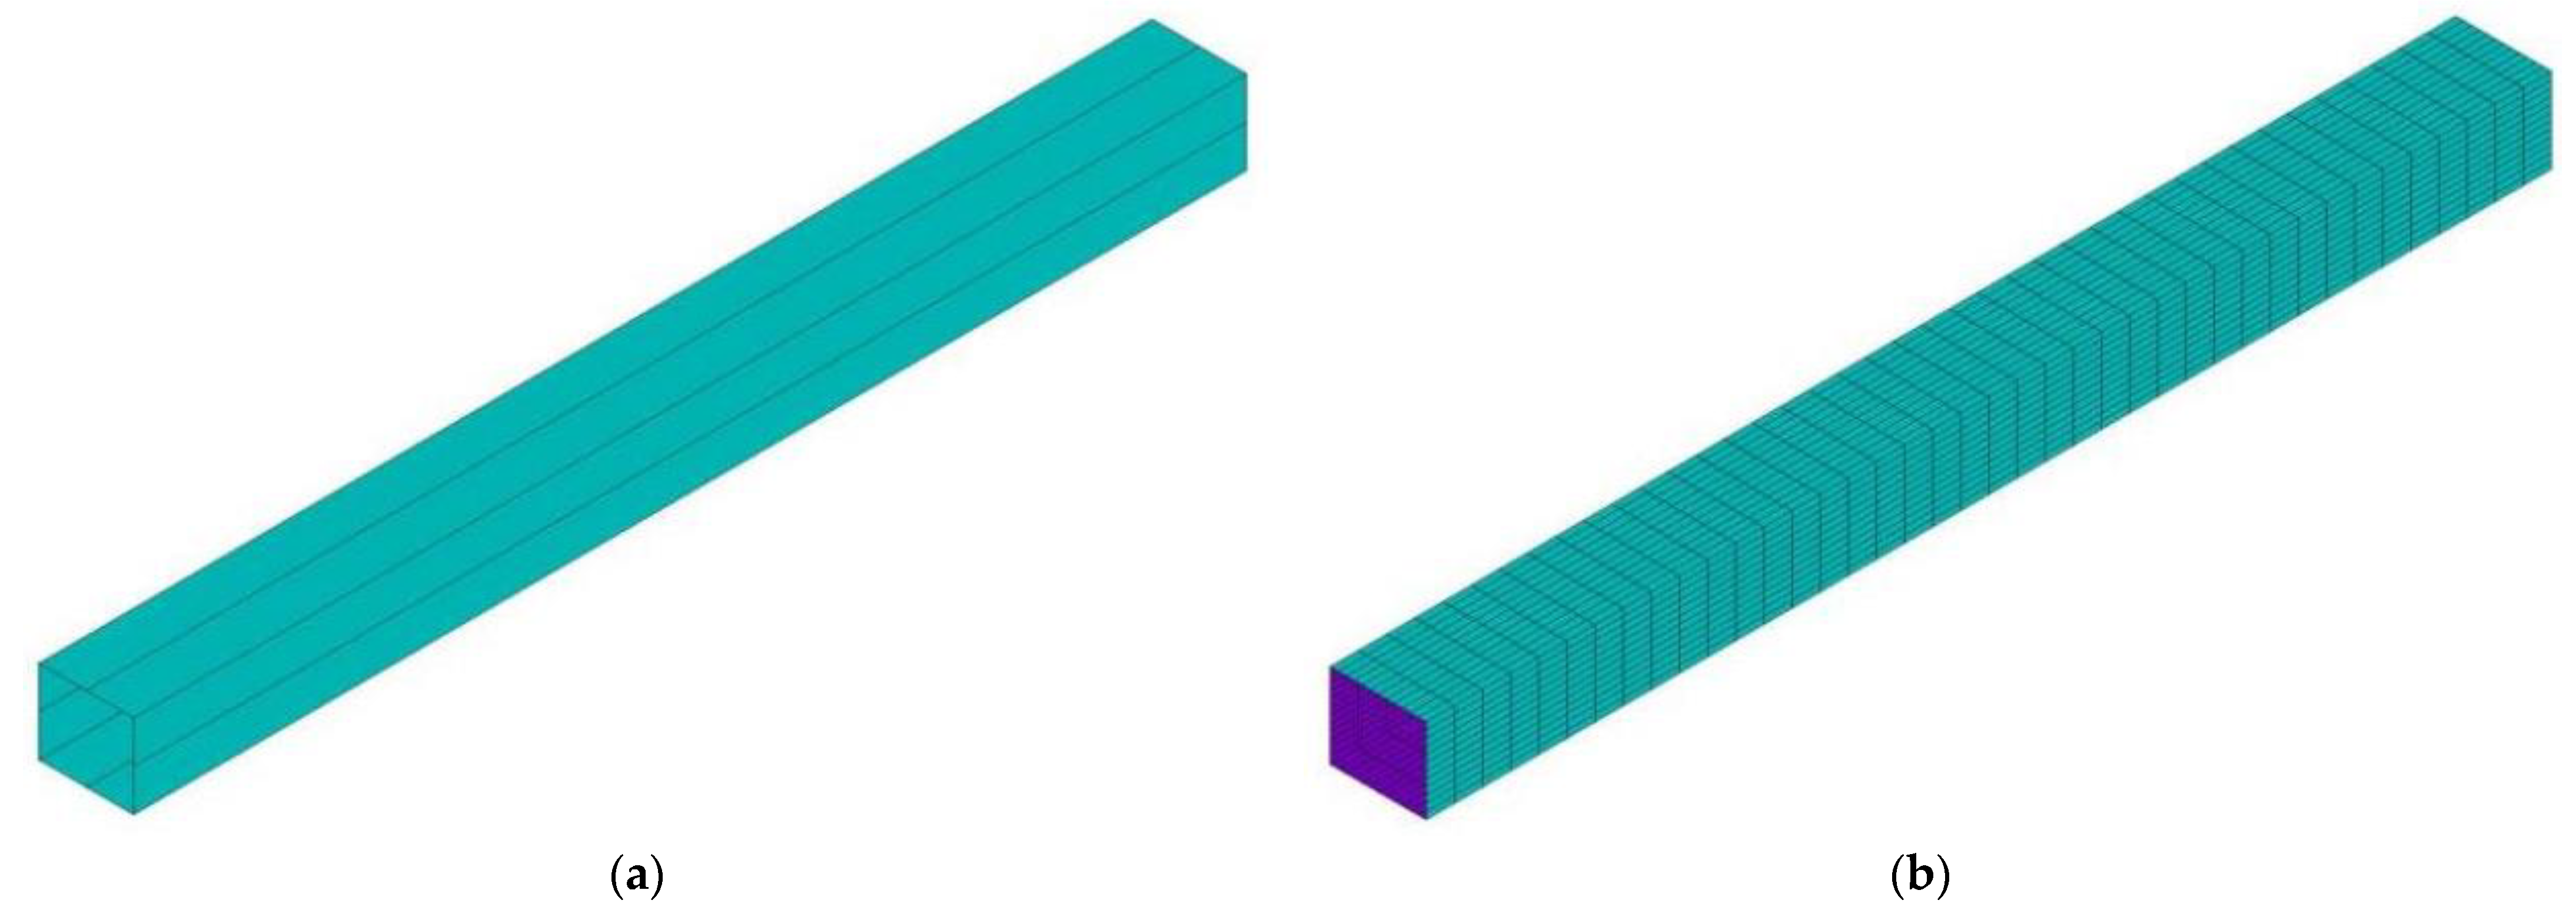
4.2. Reasonable Finite Element Mesh Number of Box Beam
5. Verification of Prototype Test
6. Conclusions
Author Contributions
Funding
Conflicts of Interest
References
- Huang, Q.; Liu, D.; Wang, X.; Yang, Y. Analysis of causes of China has the most dams in the world. J. Hydroelectr. Eng. 2021, 40, 35–45. [Google Scholar]
- Zhang, B. Hydropower development, electric power transformation and energy revolution in China. J. Hydroelectr. Eng. 2020, 39, 69–78. [Google Scholar]
- Wang, Z.; Zhang, X.; Liu, J. Advances and developing trends in research of large hydraulic steel gates. J. Hydroelectr. Eng. 2017, 36, 1–18. [Google Scholar]
- UACE. Design of Hydraulic Steel Structures: CECW-CE Engineer Manual 1110-2-584; U.S. Army Corps of Engineers (UACE): Washington, DC, USA, 2014. [Google Scholar]
- UACE. Design of Spillway Tainter Gates: CECW-ET Engineer Manual 1110-2-2702; U.S. Army Corps of Engineers (UACE): Washington, DC, USA, 2000. [Google Scholar]
- UACE. Vertical Lift Gates: CECW-ED Engineer Manual, 1110-2-2701; U.S. Army Corps of Engineers (UACE): Washington, DC, USA, 1997. [Google Scholar]
- EN 1993-1-1: 2005; Eurocode 3: Design of steel structures Part 1-1: General Rules and Rules for Building. European Committee for Standardization: Brussels, Belgium, 2005.
- Ministry of Water Resources of the People’s Republic of China. Code for Slope Design of Water Conservancy and Hydropower Engineering (L386-2007); China Water & Power Press: Beijing, China, 2007.
- National Development and Reform Commission of the people’s Republic of China. Code for Slope Design of Hydropower and Hydraulic Engineering (DL/t5353-2006); China Water & Power Press: Beijing, China, 2006.
- Ministry of Water Resources of the People’s Republic of China. Code for Design of Concrete Gravity Dams (L319-2018); China Water & Power Press: Beijing, China, 2018.
- Ministry of Water Resources of the People’s Republic of China. Code for Design of Concrete Arch Dams (L282-2018); China Water & Power Press: Beijing, China, 2018.
- Ministry of housing and urban rural development of the people’s Republic of China. General Administration of Quality Supervision, Inspection and Quarantine of the People’s Republic of China Code for Design of Steel Structures (GB50017-2017); China Construction Industry Press: Beijing, China, 2017. [Google Scholar]
- Ministry of housing and urban rural development of the people’s Republic of China. General Administration of Quality Supervision, Inspection and Quarantine of the People’s Republic of China Code for Seismic Design of Buildings (GB50011-2010); China Construction Industry Press: Beijing, China, 2016. [Google Scholar]
- Zhang, X.; Wang, Z.; Sun, D. Comparison and evaluation of design codes of hydraulic steel gates in China and America. J. Hydroelectr. Eng. 2017, 36, 78–89. [Google Scholar]
- Zhang, W.; Yan, G.; Chen, F. Static and dynamic characteristics of high pressure radial gate and its flow-induced vibration. Hydro Sci. Eng. 2016, 44, 111–119. [Google Scholar]
- Sehgal, C.K. Design Guidelines for pillway Gates. J. Hydraul. Eng. 1996, 122, 155–165. [Google Scholar] [CrossRef]
- Li, K. Dynamic performance of water seals and fatigue failure probability updating of a hydraulic steel sluice gate. J. Perform. Constr. Facil. 2016, 30, 04015082. [Google Scholar] [CrossRef]
- Design Institute of the Fourth Engineering Bureau of Ministry of water and electricity, Department of mathematics and mechanics, Lanzhou University. Finite element method for stress analysis of radial steel gate. J. Lanzhou Univ. 1977, 13, 53–74. [Google Scholar]
- Jin, Y.; Ding, J.; Zhou, J. Detection and evaluation of the safety of radial steel gate. J. Hydraul. Eng. 1991, 22, 47–53. [Google Scholar]
- Xi, X.; Liu, H.; Ye, X.; Ke, M. Three dimensional finite element analysis and reliability of radial steel gate for Huazikou River sluice. Hydr. Sci. Eng. 2012, 36–41. [Google Scholar]
- Yao, J.; Yang, G. Finite element analysis of solar radiation effect on miter gate. Port Waterw. Eng. 2022, 51, 116–121. [Google Scholar]
- Research class of General Administration of water resources and hydropower construction. Code for Design of Steel Gates of Hydraulic Structures; Revolutionary Committee of Hanxi Water Conservancy survey and Design Institute: Beijing, China, 1971. [Google Scholar]
- Ministry of Water Resources and Electric Power of the People’s Republic of China. Code for Design of Steel Gate of Water Conservancy and Hydropower Engineering (DJ13-78); Electric Power Industry Press: Beijing, China, 1981.
- Ministry of Water Resources of the People’s Republic of China. Design Specification for Steel Gates of Water and Hydropower Projects (L 74-95); China Water & Power Press: Beijing, China, 1995.
- Ministry of Water Resources of the People’s Republic of China. Design Specification for Steel Gates of Water and Hydropower Projects (L 74-2013); China Water & Power Press: Beijing, China, 2013.
- National Energy Administration. Design Code for Steel Gate in Hydropower Projects (NB35055–2015); China Electric Power Press: Beijing, China, 2015. [Google Scholar]
- Ministry of Water Resources of the People’s Republic of China. Design Specification for Steel Gates of Water and Hydropower Projects (L 74-2019); China Water & Power Press: Beijing, China, 2020.
- Boronski. Deep Hole Gate of Hydraulic Structure; Lu, W., Luo, C., Translators, Eds.; Electric Power Industry Press: Beijing, China, 1981. [Google Scholar]
- Zhang, X.; Chen, L.; Wang, Z. APDL modeling method of hydraulic radial gate structure. J. Graph. 2021, 42, 271–278. [Google Scholar]
- General Administration of quality supervision, inspection and Quarantine of the people’s Republic of China. General Rules for Finite Element Mechanical Analysis of Mechanical Product Structures (GB/t33582-107); China standards Press: Beijing, China, 2017.
- Zhang, H.; Gu, X.; Hong, W.; Sheng, X.; Zheng, L.; Kong, C. Analysis of instability accident of radial gate in reservoir. Water Conserv. Tech. Superv. 2021, 29, 129–133. [Google Scholar]
- Liao, Z.; Yang, X.; Ma, R.; Yu, J. Research on the construction of parametric standard model of three-dimensional radial and flat gate. Yunnan Water Power 2013, 29, 21–25. [Google Scholar]
- Luo, W. Application of three-dimensional design and drawing technology of hydraulic structure based on Bentley platform. Water Resour. Plan. Des. 2019, 26, 111–115. [Google Scholar]
- Wang, K.; Chen, Z.; Wang, D.; Wang, Q. Parametric modeling technology of steel gate based on CATIA. Yangtze River 2016, 47, 32–35. [Google Scholar]
- Yang, S.; Guo, L.; Liu, Z. Overview on digital construction in water conservancy and hydropower engineering. J. Hydroelectr. Eng. 2018, 37, 75–84. [Google Scholar]
- Liu, F. Application of 3D software in hydraulic metal structure manufacturing. Mech. Electr. Tech. Hydropower Stn. 2017, 40, 38–40. [Google Scholar]
- Zhang, X.; Chen, L.; Zhou, W. Study on Finite Element Static and Dynamic Analysis of Radial Gate of Flushing Tunnel of Wuluwati Water Control Project; Yellow River Engineering Consulting Co., Ltd.: Zhengzhou, China, 2021. [Google Scholar]
- Zhang, X.; Chen, L.; Yao, H. Research on patial Finite Element Analysis Principle of Radial Gate Arm structure. Water Power 2021, 47, 73–82. [Google Scholar]
- Xu, X.; Yin, L. On fining standard of fem meshing used in high frequency structure response analysis. J. Vib. Shock 2002, 21, 54–55. [Google Scholar]
- Zhu, C.; Zhang, W. Structural Mechanics (Volume II); Higher Education Press: Beijing, China, 2018. [Google Scholar]
- Zhang, X.; Yang, S.; Hou, Q. Spatial Finite Element Analysis Principle of Hydraulic Gate Panel structure. Water Power 2021, 47, 61–70. [Google Scholar]
- Compilation group of Electromechanical Design Manual of Hydropower Station. Hydropower Station Electromechanical Design Manual Metal Structure (I); Water Resources and Electric Power Press: Beijing, China, 1988. [Google Scholar]
- Editorial board of technical characteristics manual of steel gate and trash rack for water conservancy and hydropower projects. Technical Characteristics Manual of Steel Gate and Trash Rack in Water Conservancy and Hydropower Engineering; Hohai University Press: Nanjing, China, 2020. [Google Scholar]
- Ministry of Water Resources of the People’s Republic of China. Technical Specification for Safety Inspection of Hydraulic Steel Gate and Hoist (L101-2014); China Water & Power Press: Beijing, China, 2014.


| Modeling Method | Gate structure Composition | Element Type | Advantage | Disadvantage |
|---|---|---|---|---|
| I | Panel structure | Shell element | Easy to build geometric model | Model is too simplified, the calculation accuracy is low, and the connection between different element types is complex. |
| Beam structure | Beam element | |||
| Arm structure | Beam element | |||
| II | Panel structure, beam structure and arm structure | Beam element | Realistic gate geometry | Workload of geometric modeling and mesh generation is large, which cannot truly reflect the mechanical response of the gate. |
| III | Panel structure, beam structure and arm structure | Shell element | Truly presents the geometric structure of the gate and truly reflects the mechanical response of the gate. | Workload of geometric modeling is relatively large |
| Number | 1 | 2 | 3 | 4 | 5 | 6 |
|---|---|---|---|---|---|---|
| Section | I-beam | |||||
| Constraint | Simply supported at both ends | |||||
| Beam length (m) | 10 | 12 | 14 | 16 | 18 | 20 |
| Lower flange width (m) | 0.80 | 0.90 | 1.00 | 1.20 | 1.35 | 1.40 |
| Thickness of lower flange (m) | 0.032 | 0.032 | 0.032 | 0.034 | 0.036 | 0.036 |
| Upper flange width (m) | 0.80 | 0.90 | 1.00 | 1.20 | 1.35 | 1.40 |
| Thickness of upper flange (m) | 0.032 | 0.032 | 0.032 | 0.034 | 0.036 | 0.036 |
| Web height (m) | 1.00 | 1.20 | 1.40 | 1.50 | 1.60 | 1.80 |
| Web thickness (m) | 0.032 | 0.032 | 0.032 | 0.034 | 0.036 | 0.036 |
| Midspan deflection (m) | 0.027 | 0.033 | 0.040 | 0.048 | 0.057 | 0.065 |
| Midspan normal stress (MPa) | 264.4 | 275.1 | 283.4 | 276.0 | 277.1 | 287.5 |
| Midspan bending moment (kN·m) | 7500 | 10,800 | 14,700 | 19,200 | 24,300 | 30,000 |
| Number | 1 | 2 | 3 | 4 | 5 | 6 |
|---|---|---|---|---|---|---|
| Section | Box beam | |||||
| Constraint | Simply supported at both ends | |||||
| Beam length (m) | 10 | 12 | 14 | 16 | 18 | 20 |
| Section width of box beam (m) | 1.00 | 1.15 | 1.25 | 1.40 | 1.55 | 1.70 |
| Section height of box girder (m) | 0.80 | 0.95 | 1.05 | 1.20 | 1.35 | 1.50 |
| Wall thickness of upper flange (m) | 0.032 | 0.032 | 0.036 | 0.036 | 0.036 | 0.036 |
| Wall thickness of lower flange (m) | 0.032 | 0.032 | 0.036 | 0.036 | 0.036 | 0.036 |
| Wall thickness of front flange (m) | 0.032 | 0.032 | 0.036 | 0.036 | 0.036 | 0.036 |
| Wall thickness of rear flange (m) | 0.032 | 0.032 | 0.036 | 0.036 | 0.036 | 0.036 |
| Midspan deflection (m) | 0.033 | 0.041 | 0.051 | 0.058 | 0.066 | 0.073 |
| Midspan normal stress (MPa) | 259.3 | 266.9 | 268.4 | 269.4 | 270.2 | 270.9 |
| Texture of material | Q235B |
| Yield strength (MPa) | 235 |
| Resistance of strain gauge | 120 Ω |
| Uncertainty of instrument (με) | <5% ± 3 |
| Elastic modulus (GPa) | 206 |
| Model of strain gauge | WFLA-6-11 |
| Treatment method of gate surface | Grinding and polishing |
| Instrument resolution (με) | 1 |
| Poisson’s ratio | 0.28 |
| Installation method of strain gauge | Paste |
| Instrument model | DH5908L |
| Frequency of data acquisition (Hz) | 200 |
| Number | Position | Analysis Method | Flow Direction (mm) | Vertical Direction (mm) | Lateral (mm) | Illustration |
|---|---|---|---|---|---|---|
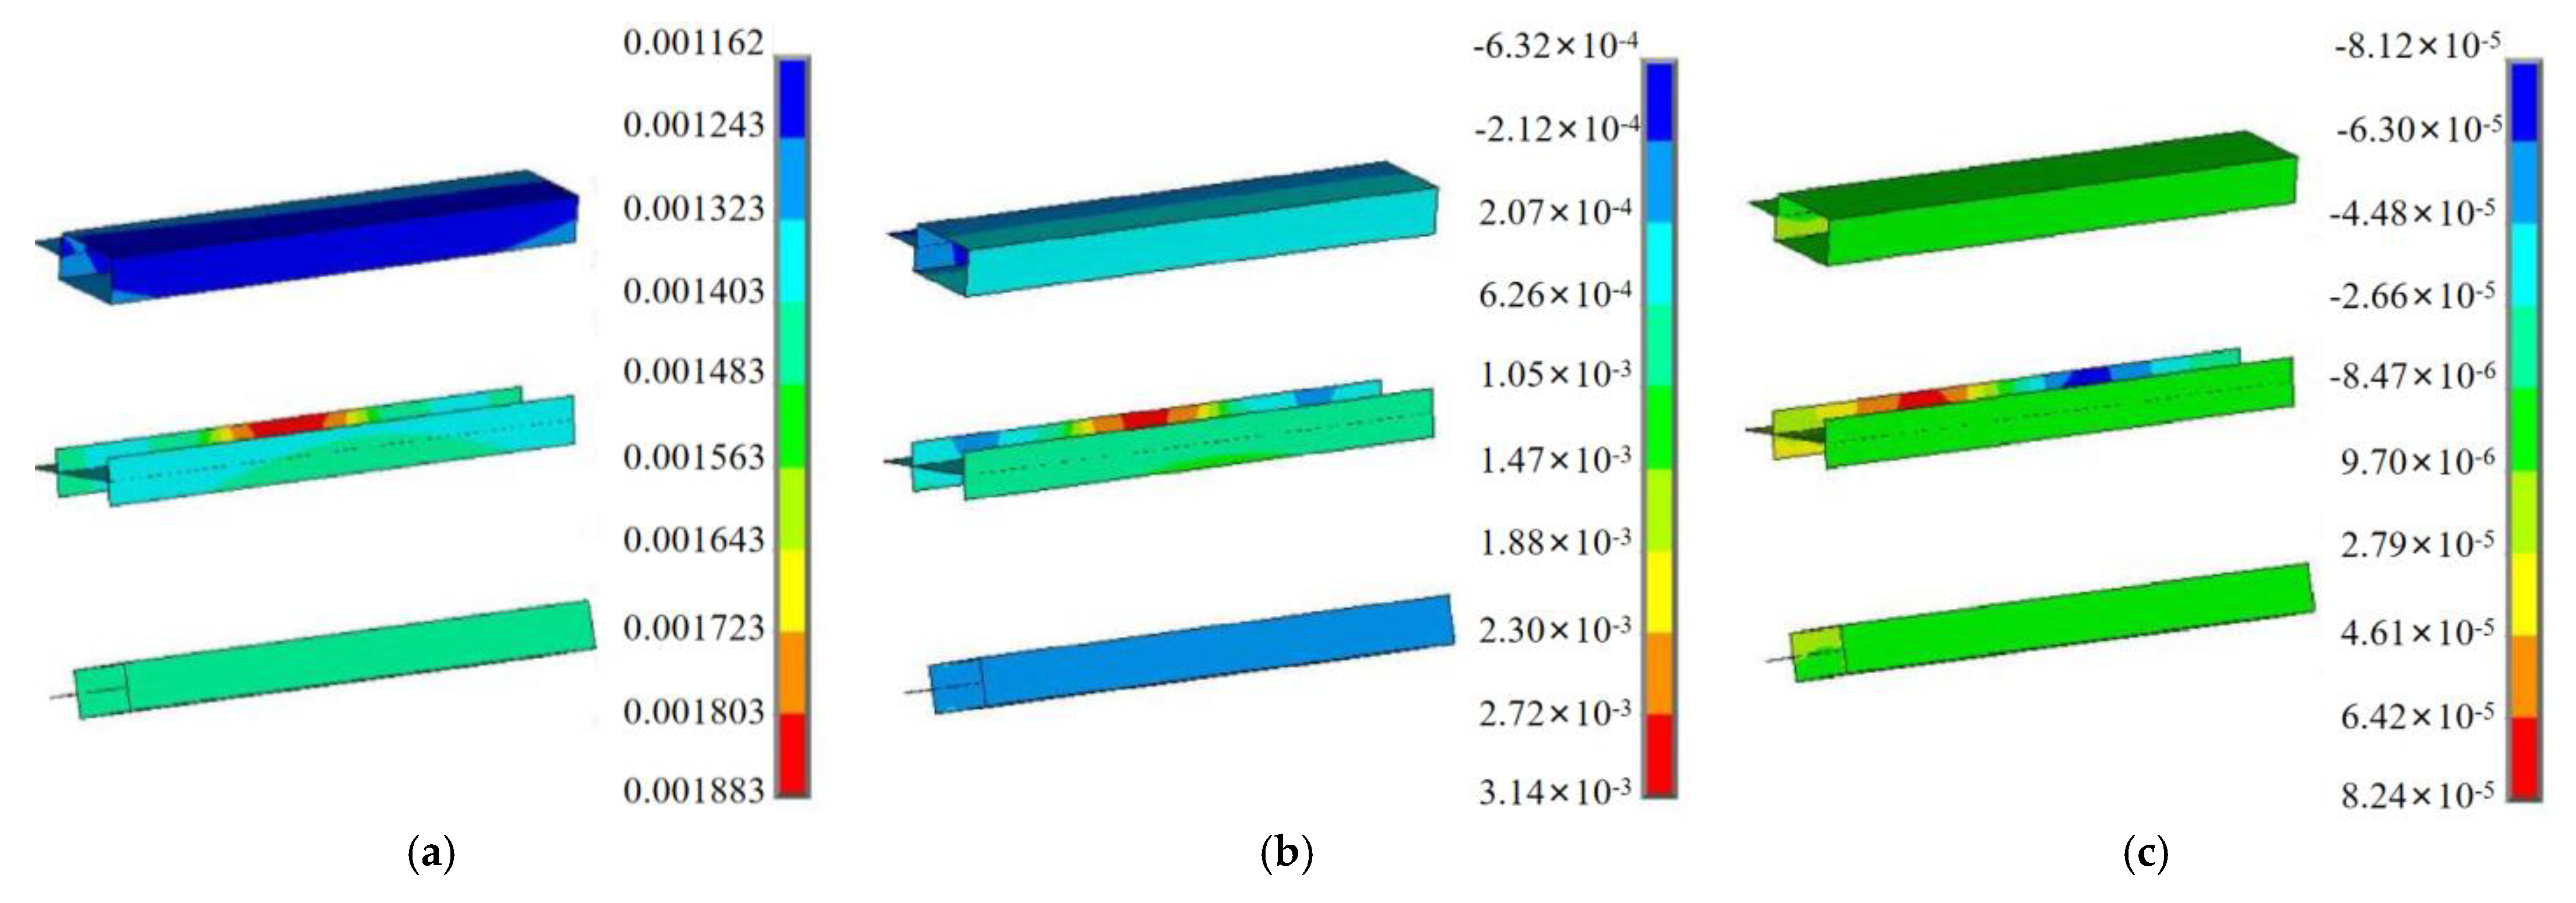
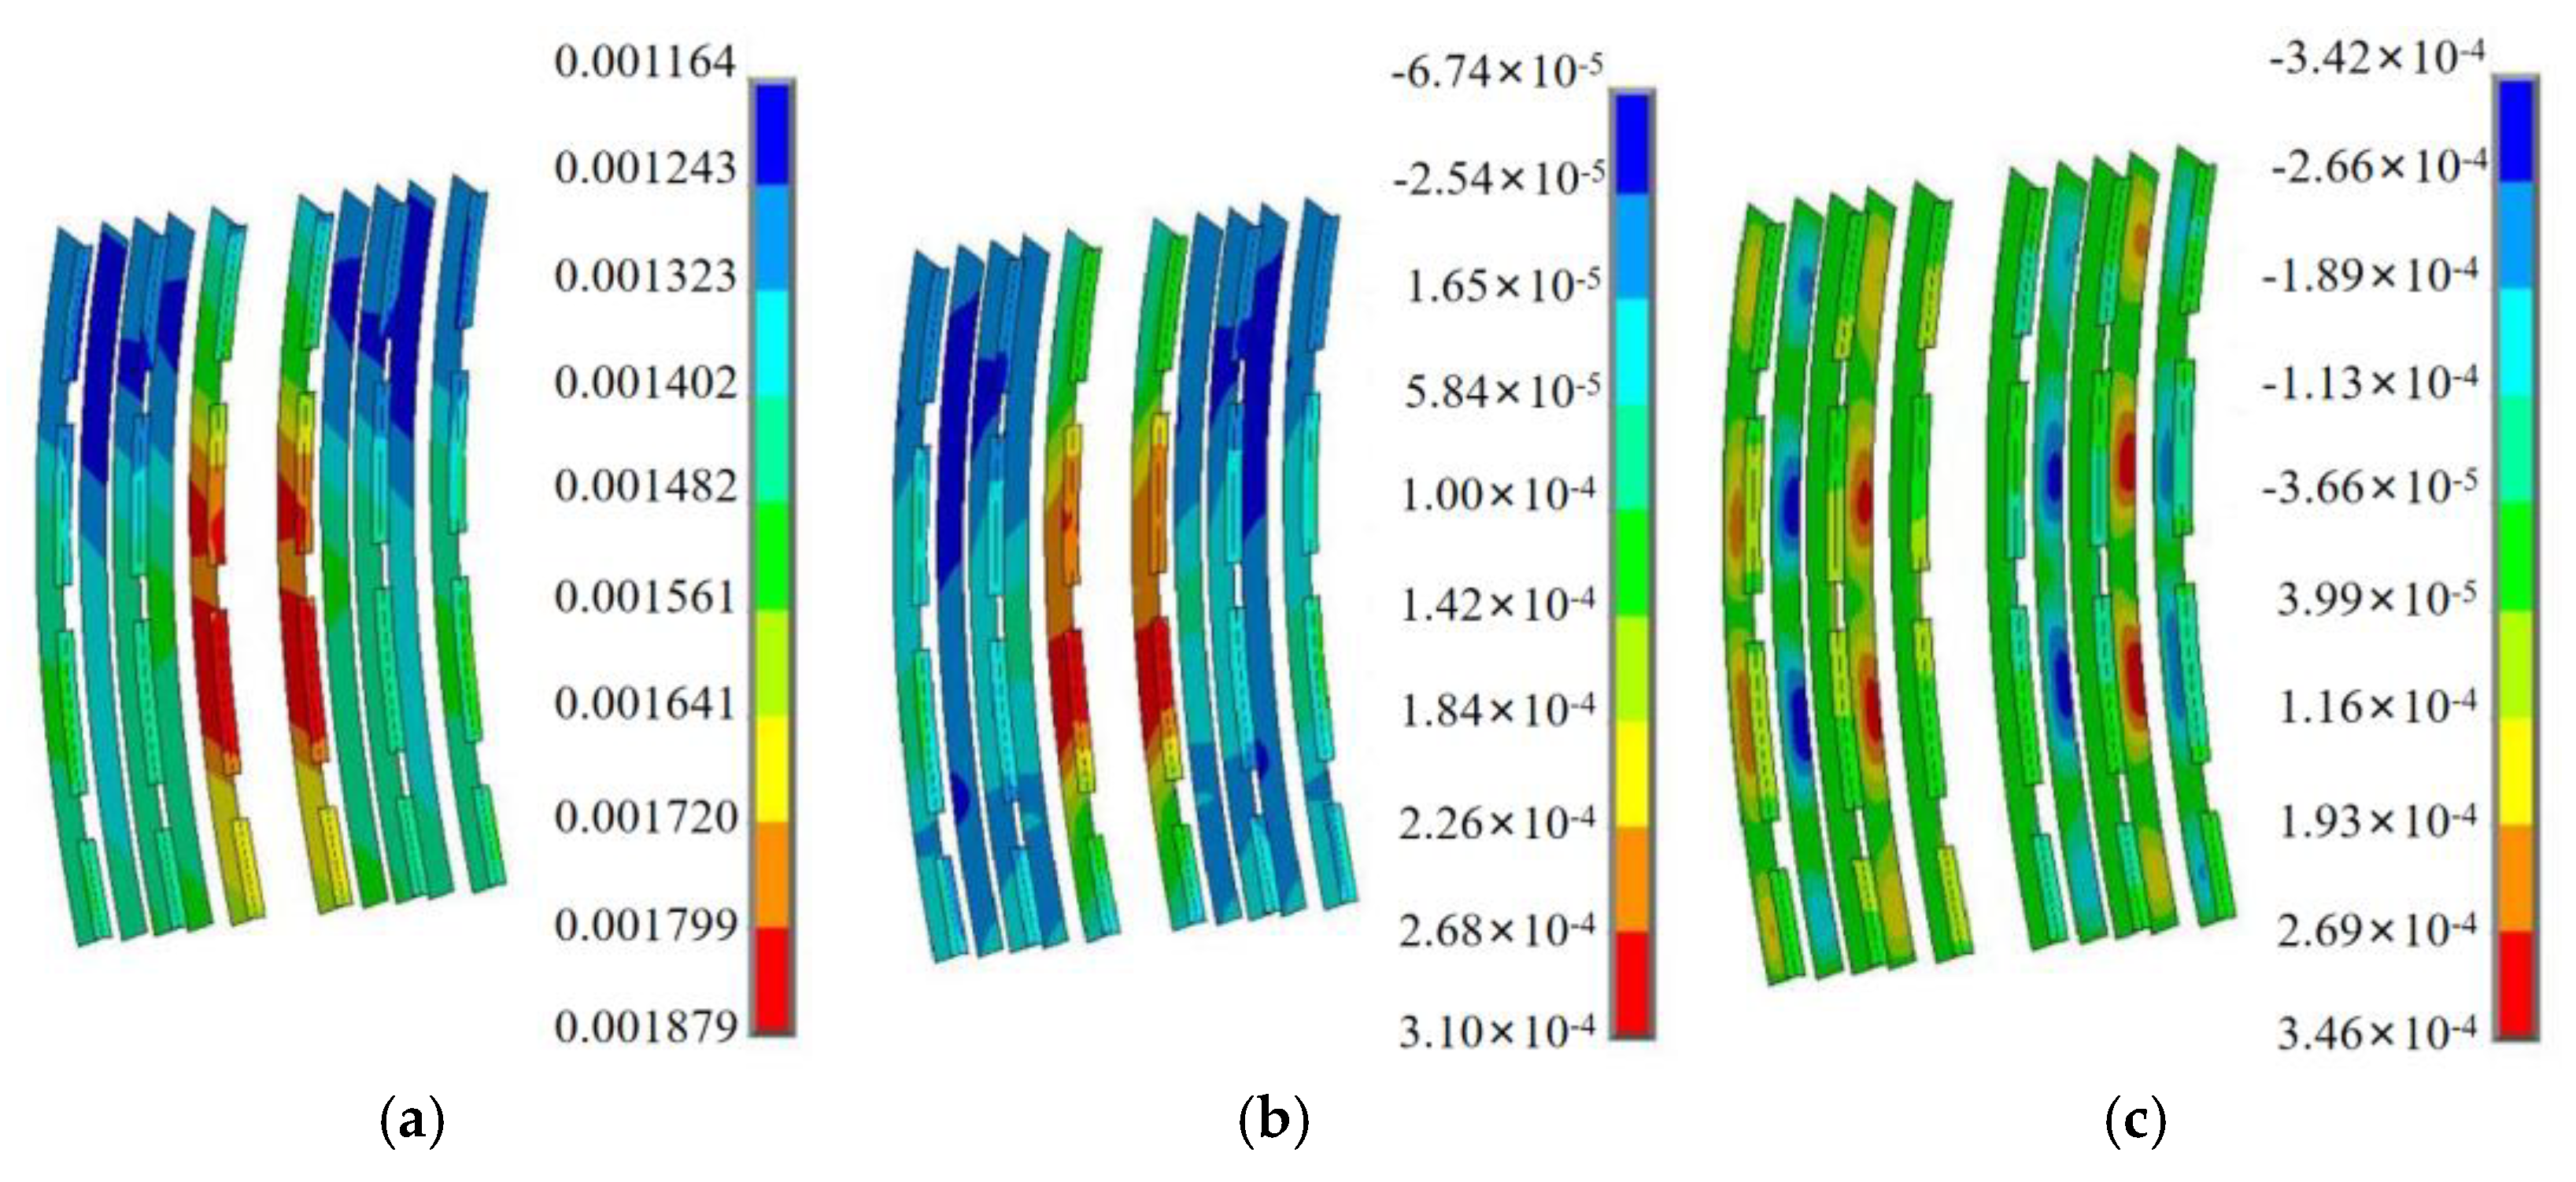
| 1 | Middle main beam | SSM | 1.88 | 0.314 | 0.082 | Figure 11 |
| Prototype test | 1.30 | 0.80 | 0 | |||
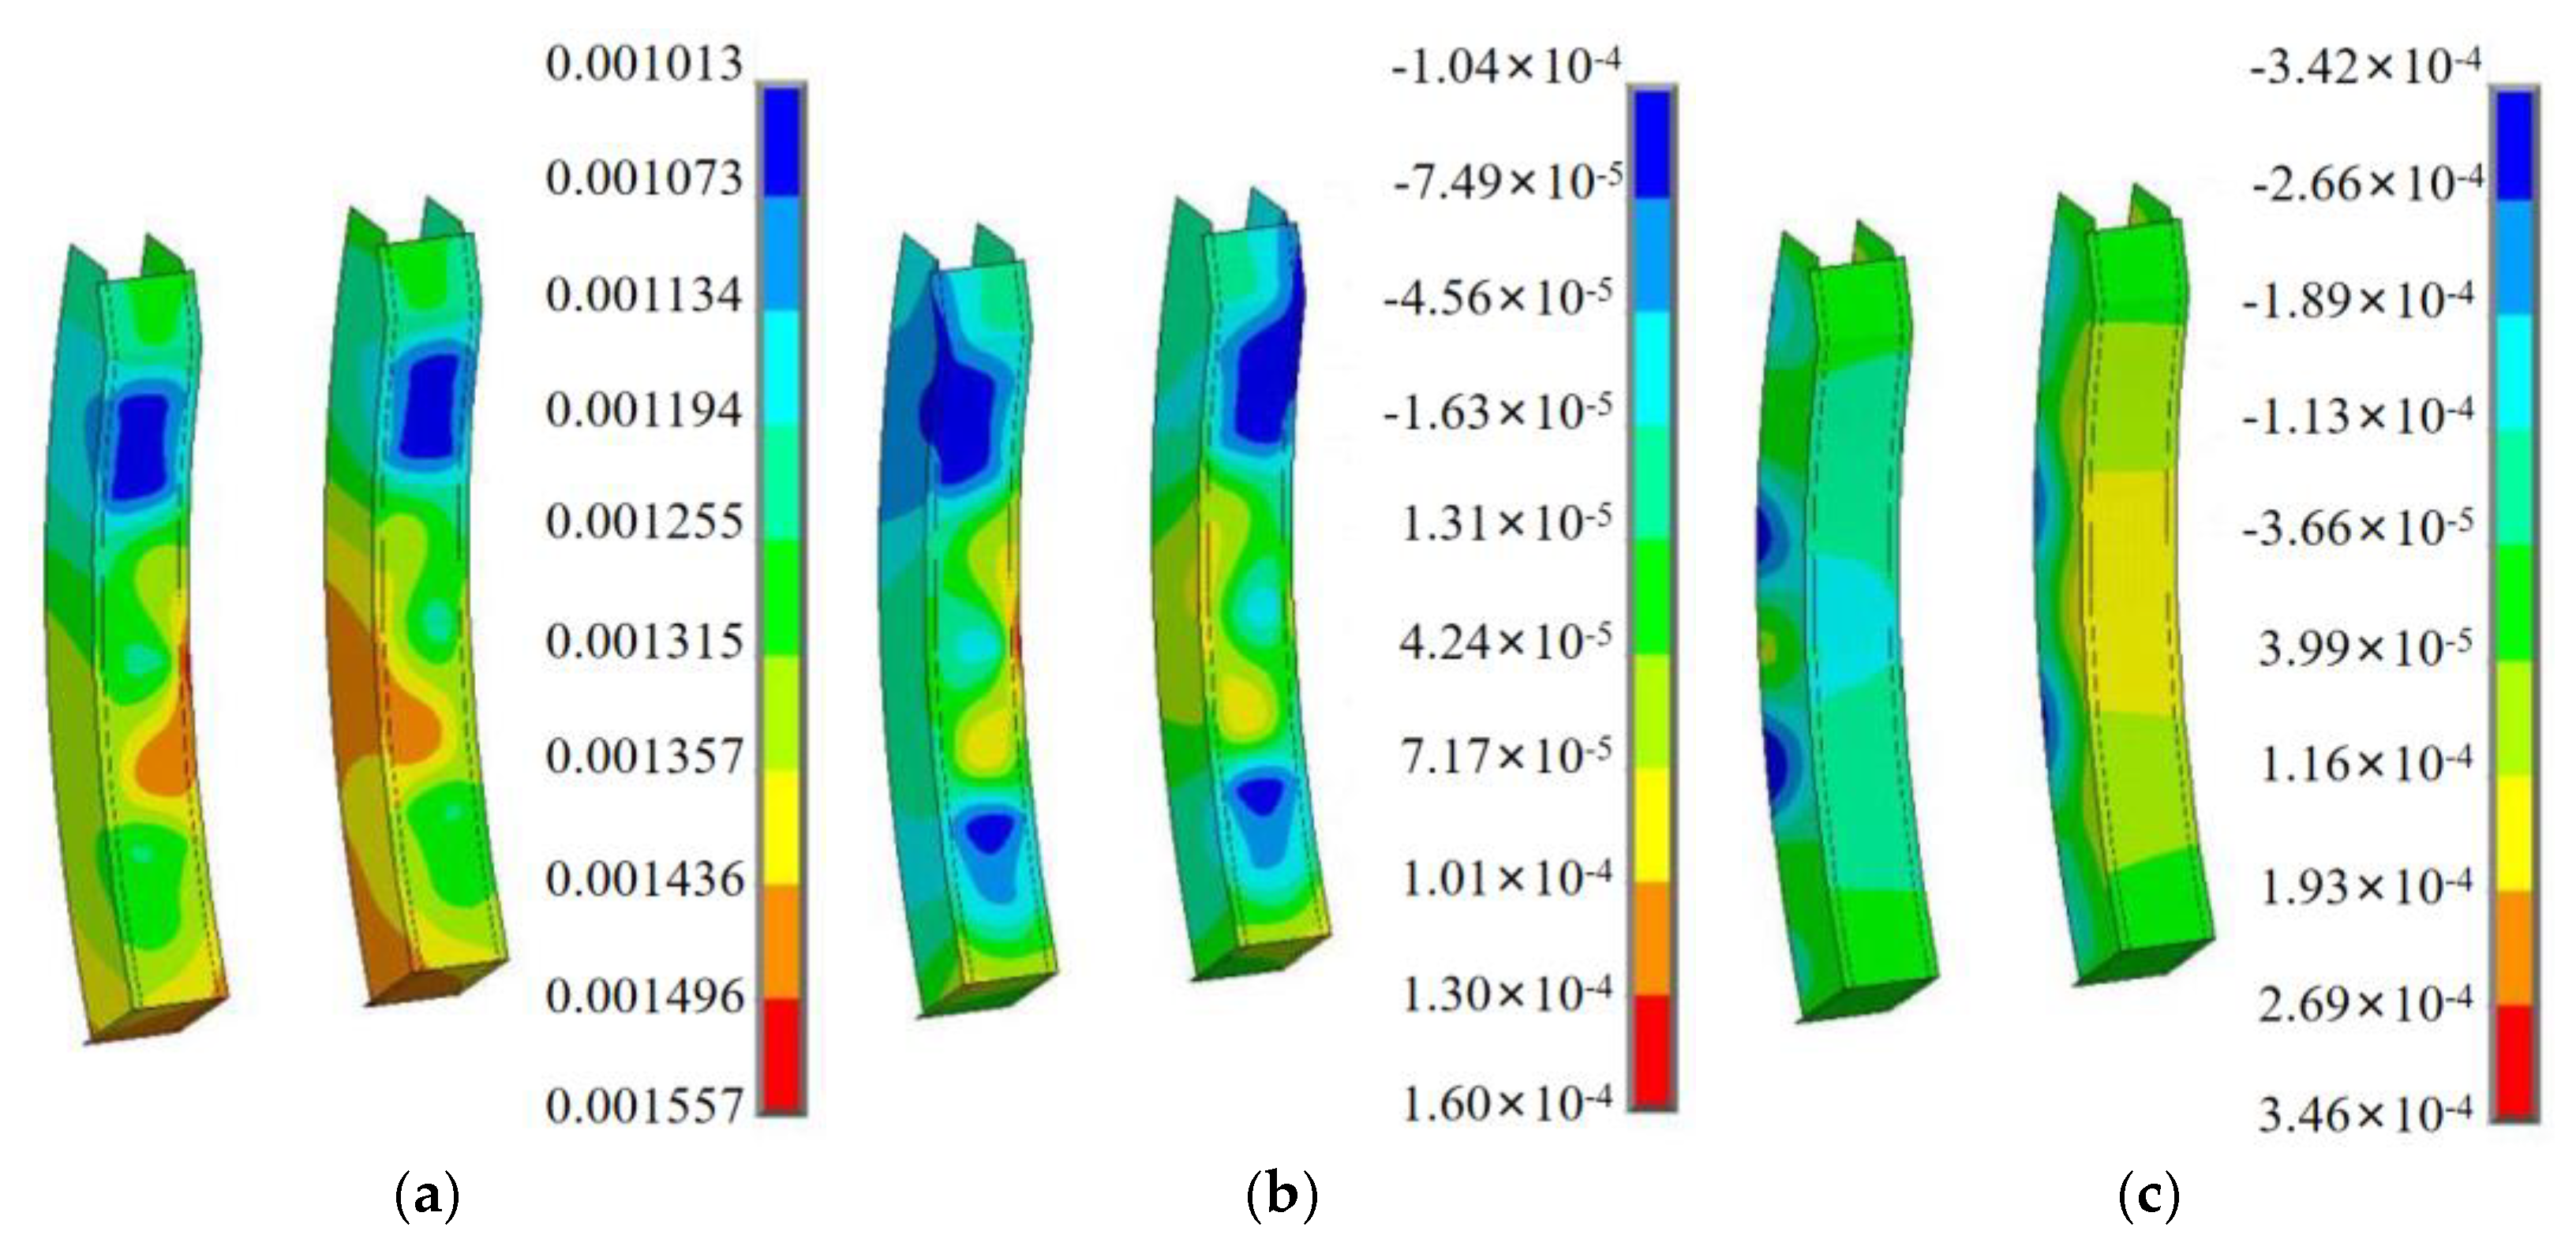
| 2 | Main longitudinal beam | SSM | 1.56 | 0.16 | 0.35 | Figure 12 |
| Prototype test | 1.50 | 0.60 | −0.4 | |||
| 3 | Secondary longitudinal beam | SSM | 1.88 | 0.31 | 0.35 | Figure 13 |
| Prototype test | 1.60 | 1.10 | 0 | |||
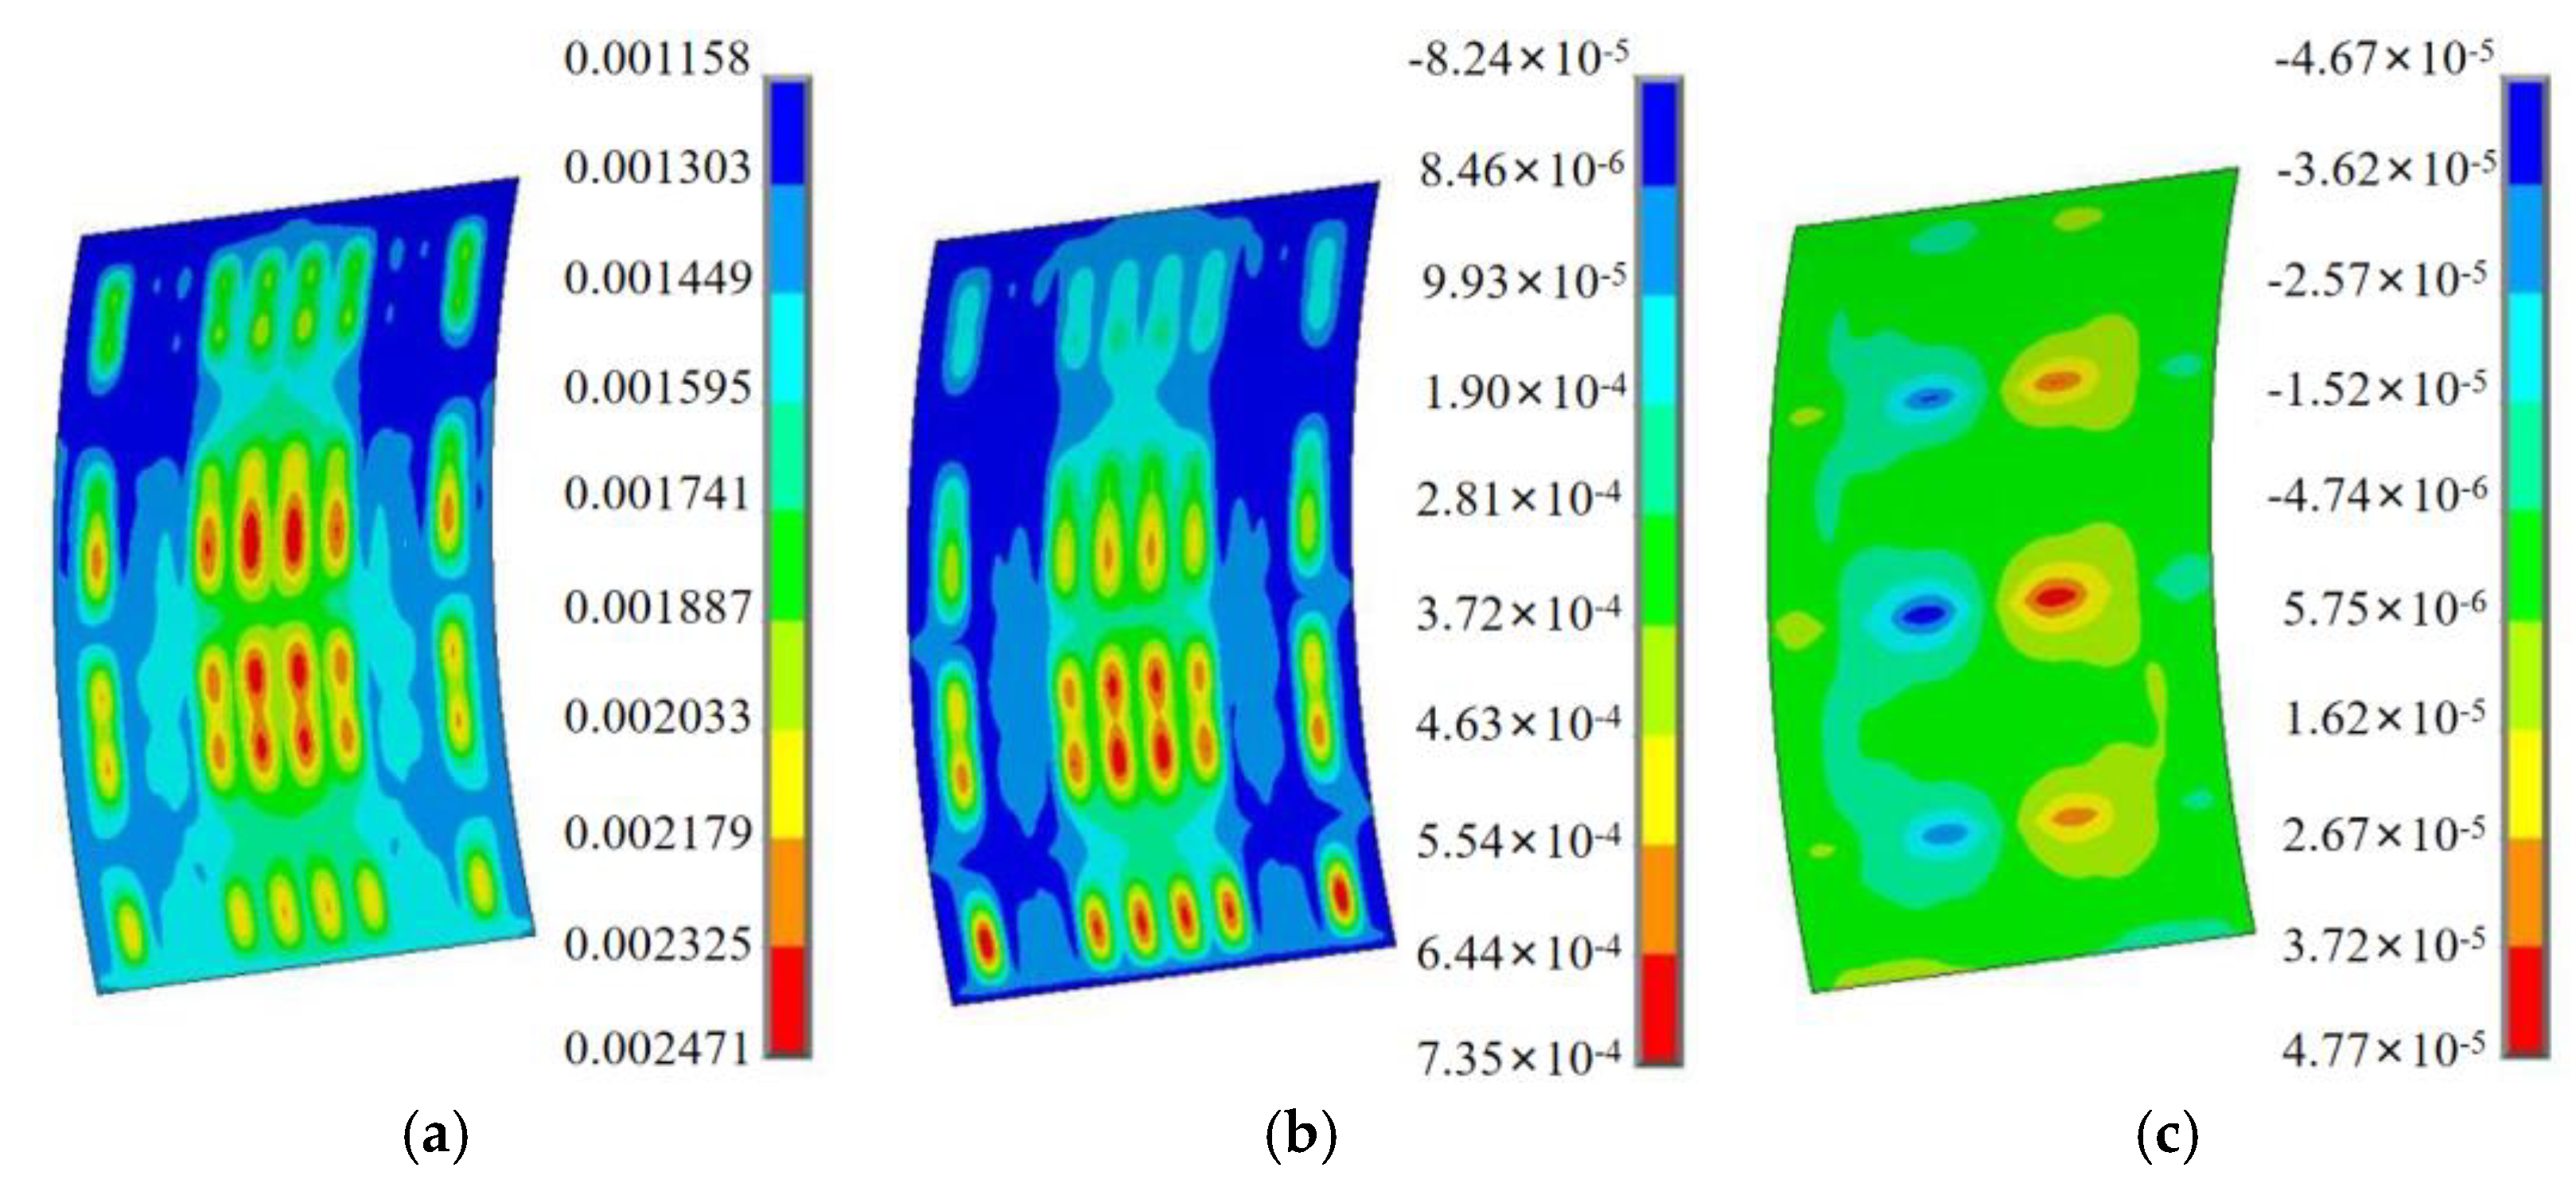
| 4 | Panel | SSM | 2.47 | 0.74 | 0.048 | Figure 14 |
| Prototype test | 1.80 | 0.70 | −0.10 | |||
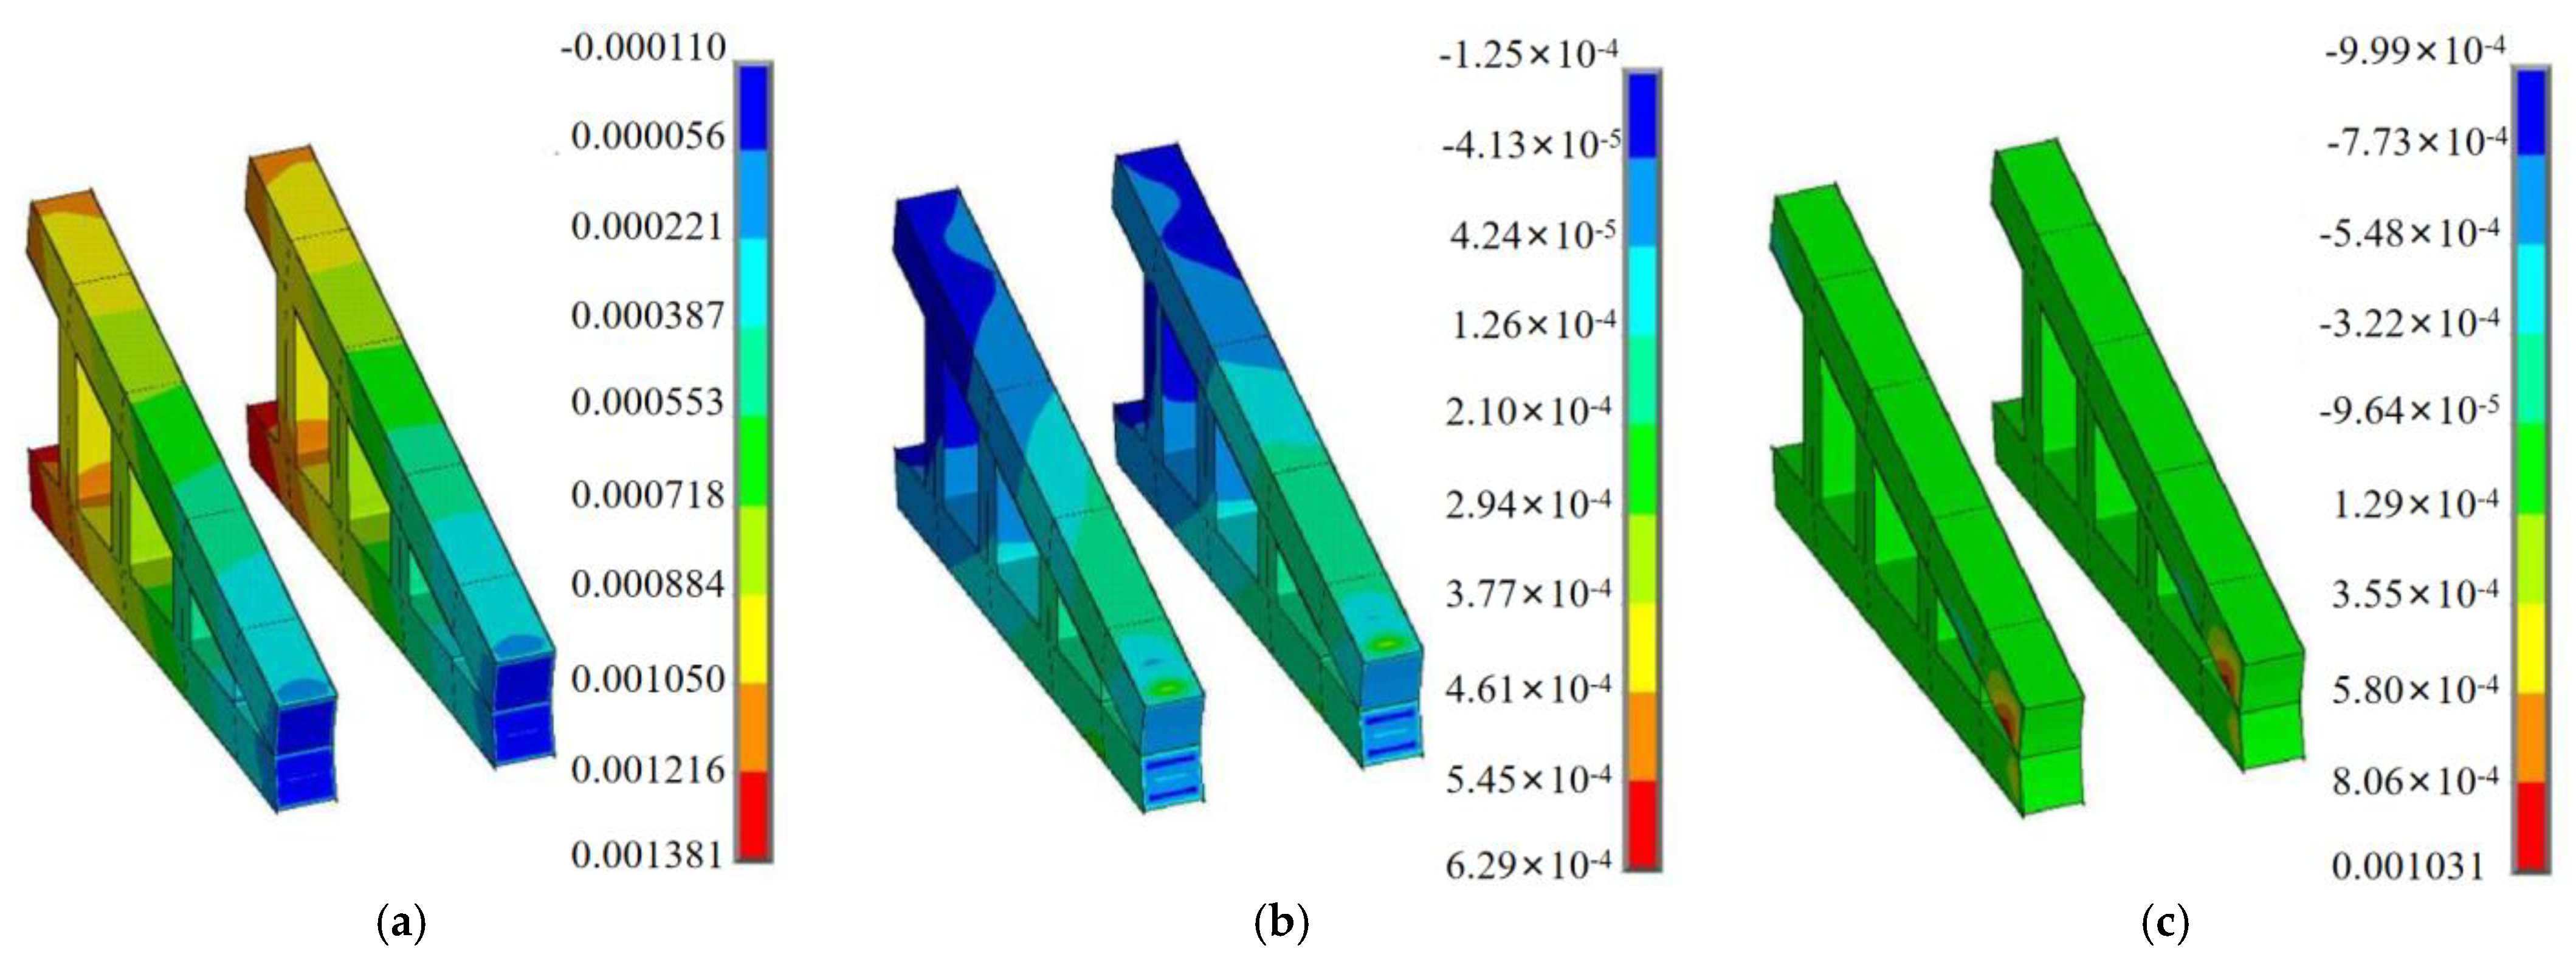
| 5 | Arm | SSM | 1.38 | 0.63 | 1.03 | Figure 15 |
| Prototype test | 1.00 | 0.90 | 0.70 |
| Number | Position | Stress | Results of Prototype Tests (MPa) | Results of SSM (MPa) |
|---|---|---|---|---|
| 1 | Web structure of longitudinal beam | Vertical direction | 4.68 | 4.53 |
| 2 | Flange structure of longitudinal beam | Vertical direction | −19.35 | −20.60 |
| 3 | Connecting flange of lower arm and main beam | Arm direction | −53.55 | −54.70 |
| 4 | Web structure of lower main beam | Horizontal direction | −6.43 | −7.20 |
| 5 | Panel structure | Horizontal direction | 38.10 | 34.60 |
| 6 | Arm structure | Arm direction | −65.60 | −59.10 |
Publisher’s Note: MDPI stays neutral with regard to jurisdictional claims in published maps and institutional affiliations. |
© 2022 by the authors. Licensee MDPI, Basel, Switzerland. This article is an open access article distributed under the terms and conditions of the Creative Commons Attribution (CC BY) license (https://creativecommons.org/licenses/by/4.0/).
Share and Cite
Zhang, X.; Lou, S.; Chen, L.; Wang, Z.; Zhang, F. Study on Analysis Principle of Spatial System Method for a Hydraulic Steel Gate. Sustainability 2022, 14, 14804. https://doi.org/10.3390/su142214804
Zhang X, Lou S, Chen L, Wang Z, Zhang F. Study on Analysis Principle of Spatial System Method for a Hydraulic Steel Gate. Sustainability. 2022; 14(22):14804. https://doi.org/10.3390/su142214804
Chicago/Turabian StyleZhang, Xuecai, Senyuan Lou, Liye Chen, Zhengzhong Wang, and Fufu Zhang. 2022. "Study on Analysis Principle of Spatial System Method for a Hydraulic Steel Gate" Sustainability 14, no. 22: 14804. https://doi.org/10.3390/su142214804
APA StyleZhang, X., Lou, S., Chen, L., Wang, Z., & Zhang, F. (2022). Study on Analysis Principle of Spatial System Method for a Hydraulic Steel Gate. Sustainability, 14(22), 14804. https://doi.org/10.3390/su142214804