Abstract
In recent years, with the continuous deepening of the urbanization process, the problem of urban ruins (URs) has become prominent. This significantly affects the happiness of residents around the URs, the overall image of the city, and the environment, and it has become an important issue in urban construction. At present, the types of urban ruins mainly include industrial ruins, abandoned urban buildings, and war sites. Generally, methods such as demolition and reconstruction of original buildings or upgrading and transformation are used to reuse URs, and some of them have achieved fruitful results. However, the current renovation of URs is based on fragmented renovation strategies for different URs without a systematic and universally applicable renovation methodology. With the development of artificial intelligence, technologies such as Generative Adversarial Network (GAN), Easy DL, and Natural Language Processing (NLP) can provide technical support for urban ruin reconstruction, from design to operation. Specifically in the present study, the ten representative URs in Guangzhou are first evaluated by the Analytic Hierarchy Process and then combined with AI methods, such as the adversarial generative networks and big data applications, into the reuse design of URs. Finally, a complete research system is established to implement URs’ projects, which provides a clearer systematic planning strategy for the reuse of URs in the future.
1. Introduction
URs are the result of past human activity in the urban landscape and usually refer to abandoned buildings and sites, such as remnants of military wars, abandoned hospitals, unfinished buildings, disused factories, and shopping centers. In 2022, China E-House Wisdom Library Center prepared the “2022 national rotten building research report”. The report selected 50 representative cities to calculate the unfinished building rate, unfinished building construction area of up to 71.51 million square meters, and the unfinished building rate of 5%. According to this report, the ratio of unfinished buildings in China for 2022 is 3.85%. In 2022, a search of the Judicial Documents website and law collections using the keyword “unfinished buildings” revealed that there are 10,404 cases related to unfinished buildings [1].
There are many reasons for the formation of URs. On the one hand, the rapid expansion of urban space. The proportion of China’s urban population has soared from 35.39% in 2000 to 64.72% in 2021, which has brought a huge demand for housing land and infrastructure investment, the real estate industry has risen rapidly under this situation. However, since 2020, influenced by COVID -19, the residents’ enthusiasm for buying a house has obviously weakened. Figure 1 is the official data released by the official website of the China Real Estate Association. They searched the People’s Court Bulletin website with “real estate” as the keyword and eliminated duplicates and non-real estate companies from the list. After counting, it was found that approximately 343 real estate companies in China issued relevant bankruptcy instruments in 2021. The number of bankrupt real estate enterprises in Guangdong Province ranked first for three consecutive years, accounting for approximately one fifth of all bankrupt real estate enterprises. On the other hand, due to the influence of multiple factors, such as the structural adjustment of industrial land for industrial upgrading and the decline of the performance of the building itself, the heavy industrial parks in the city center are either closed or relocated to the urban fringe. As a result, numerous industrial buildings have been left in the city center, where land prices are rising, and they are becoming URs.
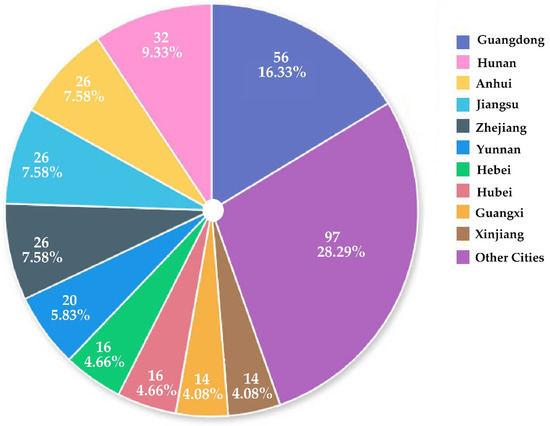
Figure 1.
The number and percentage of provincial and municipal distributions of 343 real estate enterprises filing for bankruptcy in 2021 (Figure source: original drawing).
At present, significant attention is paid to the abandonment of URs due to the multiple impacts of URs, the emergence of some relevant policies, and the real problems faced by cities. People are aware that the reuse of URs is necessary, and their large-scale rehabilitation will obviously be an important part of urban resource rehabilitation, urban economic development, and the promotion of sustainable urban development.
The negative effects of URs are mainly as follows:
- The high population density of the city and low land consumption per capita, thus URs cause the destruction of the local tax base and the waste of scarce land resources;
- A negative impact on the overall image of the city;
- A serious impact on the local environment, endangering people’s health and lowering the happiness index;
- A threat to society and a certain economic burden [2].
Some relevant policies are mainly China’s national environmental strategy of carbon peaking and carbon neutralization proposed in 2020, which aims to address global climate change, promote the implementation of improvements in critical regions and enterprises, and support the overall reform and sustainable development of economic production and life [3]. The environmental impact report of the Guangzhou Construction Waste Disposal Facilities Layout Plan (2021–2035), was published in Guangzhou in 2021. It states that construction waste accounts for one quarter of the total urban waste in Guangzhou and that environmental pollution and ecological damage must be prevented at the root [4]. The biggest practical problem facing cities is that the current carrying capacity of first-tier cities is gradually becoming saturated, especially the shortcomings of housing, education, and medical care are more obvious, and public facilities are facing great pressure. In this situation, it was realized that demolition and reconstruction of building ruins is neither an economically viable nor environmentally friendly solution on a large scale, so it is necessary to address this situation by renovating and retrofitting the existing URs [5]. Therefore, many domestic and international scholars have conducted in-depth research on the optimal allocation of URs as an important issue for sustainable urban development. Since Western countries started industrialization and urbanization earlier, and the environmental, social, and economic problems caused by urban ruins also appeared earlier, the conversion and utilization of urban ruins and related research also started earlier. Research in this regard has developed a relatively mature theory, and there are many successful practical cases.
In terms of methodical strategy research, Monsù Scolaroaims et al. [6] defined a methodology to evaluate alternative interventions for performance upgrading of the building system according to sustainability objectives and considered the downcycling and upcycling of construction materials and components as opportunities to reduce environmental impact. Heesche et al. [7] presented a set of qualifying strategies to guide future URs‘ transformations: porosity, reuse, re-naturing, and open-endedness. In terms of assessment methods, Bottero et al. [8] presented a novel application of the Preference Ranking Organization Method for Enrichment of Evaluations (PROMETHEE) to support the design and implementation of adaptive reuse strategies of abandoned industrial heritage sites in vulnerable contexts and evaluate relative tangible and intangible effects. Domestic research on the reuse of URs has also received more attention in recent years. Wu et al. [9] regarded the city of Nanjing, proposing an operational approach to complex urban dynamics based on a simplified analysis of official statistics, maps, and Geographic Information Science technology and expanding the research perspective of industrial heritage reuse in China, and proposing a clearer systematic planning strategy for the future of industrial heritage in cities. Li et al. [10] focused on the experiences of a landmark project (Xinyi Club) in Guangzhou City, which examined the course of adaptive reuse of industrial land and its repercussions on reshaping the urban renewal strategy of the city.
Through the relevant research of domestic and international scholars, it is apparent that the current research on the reuse of URs mainly focuses on theory, and less so on practice. Neither of these two domestic studies has applied the latest scientific and technological means to the reconstruction of URs to form a complete set of guidance systems. The research purpose of this paper is to effectively integrate the application of new technologies with the reuse design of URs, and form a complete set of solutions to provide a reference for the planning of URs. Specifically, it includes three stages. The first is to extract and collect the rich visual elements of URs in combination with artificial intelligence technology, and build a UR evaluation method that can be widely promoted and applied. The second is to provide reference design strategies for the specific design and implementation stages in combination with the latest computer technology. The third is to put forward specific operation and management methods in the later stage. Due to the limitation of the research scope, this paper chooses Guangzhou, China as an example to study. Compared with the previous research, this study has four main innovations:
- Using hierarchical analysis, we analyze and evaluate ten typical URs in Guangzhou in a comprehensive way, and select one of them for specific design and guidance by integrating various factors affecting URs;
- The digital method of extracting and analyzing public comments on multiple online platforms and over a significant period of time provides more powerful data support and more diverse research opportunities for URs design and construction;
- GAN-based methods to support the renovation and reuse of URs, including extraction of site information, assessment of physical characteristics of the built environment, and development of solutions;
- Smart landscapes and buildings, smart services, and smart management can rejuvenate reused URs and enable truly sustainable and adaptive urban development.
2. Related Research
2.1. Evaluation Criteria
The reuse of URs is gaining prominence in research and on the policy agenda, and there is growing interest in the sustainable development of URs, using a variety of research approaches. The following methods are commonly used in the phase before data collection. The literature review method was used to summarize the information on the reuse of URs. The field research method is used to collect data for this study by conducting field visits and researching the topic to be transformed. Numerous questionnaires are used to determine the transformation intentions of the people around the URs. Data collection on the actual field conditions is mostly undertaken via maps and GIS techniques [11]. In addition to the literature, questionnaires, and field research, the preservation of history and culture is an increasingly important consideration in the reuse of URs, so a thorough assessment is made before implementing a specific plan. In this way, we can determine the characteristics of URs and which URs are of high value and in urgent need of reuse. This provides clear and focused guidance for URs’ subsequent design and renovation.There are some typical and common approaches to synthetical evaluation such as the analytical hierarchy process (AHP) and the technique for order preference by similarity to an ideal solution (TOPSIS) [12]. The AHP method transforms the complex, logical decision-making actions into a mathematical process. By separating the decision-making problem into multiple layers (i.e., target, criterion, indicator, and program), the essence, influencing factors, and intrinsic relationships within the problem are analyzed [13]. To understand the AHP more intuitively, we provide a flowchart of AHP in Figure 2. The first step is to build a hierarchical model of the system problem. In the second step, the judgment matrix is built and the weights are solved. Finally, the consistency test is performed on the judgment matrix. The TOPSIS aims to choose the best alternative to the sorting, which is suitable for dealing with the issue of multi-objective decisions. AHP was used in a study to analyze the tourism benefits of sustainable railroad heritage(RH) development in China [14].
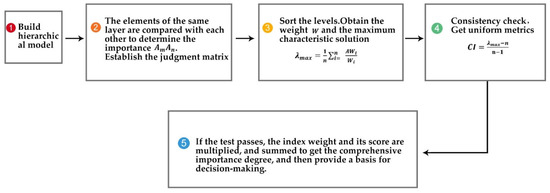
Figure 2.
The flowchart of the analytical hierarchy process (Figure source: original drawing).
2.2. Artificial Intelligence
With the rapid development of new technologies such as Building Information Modeling, the Internet of Things, mobile Internet, Big Data, and artificial intelligence, information technology is gradually penetrating the practical application of urban planning, providing the opportunity to build a green, energy-efficient, and sustainable city [15]. According to the chronological compilation of the research field of artificial intelligence, the rapid development process can be roughly summarized as follows: artificial intelligence (AI), machine learning (ML), and deep learning (DL) are the three main aspects. Figure 3 shows the development and inclusion relationships of these.
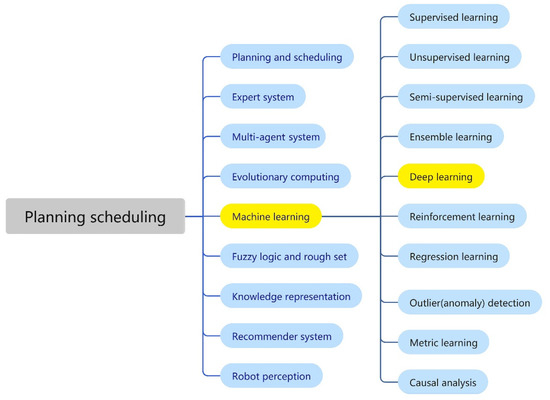
Figure 3.
Concept diagram of artificial intelligence and machine learning (Figure source: original drawing).
AI was developed in the 1950s. Its original goal was to understand and simulate human intelligence, aiming to simulate human intelligence through computer algorithms [16]. It covers a wide range of research areas, including robotics, speech recognition, image recognition, natural language processing, and expert systems. It can be applied in a variety of ways to the day-to-day planning and design of urban landscapes, architectural design, landscape design, and other related professional practices [17]. Among them, ML is one of the many branches of AI and one of the core technologies of AI. ML can learn the existing data through automatic learning strategies and automatically adjusting the structure and parameters of the model to infer the potential regularities of the data and use them effectively [18]. Through accessing numerous quantities of data for independent learning, ML is mining the underlying laws behind the data to achieve effective use of the data. In recent years, the application of ML has been promoted in related design fields, especially in architecture, urban landscape planning, and design, and landscape architecture; specifically involving data, algorithms, and computing power. The planning and design of urban landscapes can be roughly divided into three phases: data extraction in the initial phase, the design of schemes for the analysis and evaluation of design objects, and the actual implementation. ML can quickly identify and classify the collected location data. DL has shown great application potential in analyzing and creating design images and is a branch of ML. DL contains many algorithm models and was used to some extent in the analysis and evaluation phase of the design objective to assist with the analysis. The emotional analysis model, based on the bidirectional encoding representation model of transformers (BERT) from DL, uses the super-strong feature extraction capability of the transformer to learn the bidirectional encoding representation of words. Word coding with contextual information can make better sentiment decisions. DL algorithm-based text sentiment analysis technology provides a solution for quantitative analysis of unstructured and semi-structured network commentary data, overcoming the limitations of information sources, data volume, authenticity, and other aspects of traditional quantitative analysis methods such as questionnaire surveys and expert evaluation. Some scholars have attempted to use sentiment orientation analysis technology for urban public space research, including the quantitative assessment of popularity [19], sentiment information extraction [20], and sentiment difference analysis [21]. With the technology of sentiment orientation analysis, the sentiment investigation of the objects can be incorporated into the design before the actual design implementation to select the best scheme for the design.
In the concrete design and planning phase, the principle of image generation of the GAN of DL in Figure 4a is widely used in the new application scenario of land use recognition and image rendering of the urban landscape plan [22]. In Figure 4b, GAN can tentatively identify the land use of the urban and design plan, which is similar to the designer’s identification and classification of the functional zoning of the design case plan. GAN can achieve the effect of input conditions to generate rendering drawings with one click after learning the planar texture drawing, which is similar to the drafting process of designers on various types of software. After selecting a specific training set for thorough training, GAN can perform layer analysis and rendering, which previously only designers could do. The automatic detection and rendering of GAN have a great potential to improve the work efficiency of designers and spread it in the planning and design of urban landscapes. In addition, GAN can also be applied to terrain generation.
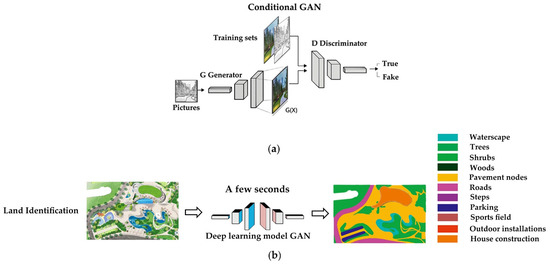
Figure 4.
(a) The image generation principle of GAN; (b) a GAN-based landscape garden plan site identification and automatic rendering (Figure source: original drawing).
3. Ruins of Choice
3.1. Introduction to Guangzhou URs
Guangzhou is the oldest port city for foreign trade in China and the starting point of the maritime Silk Road. The overall economic development of the city has been in the forefront from its beginning. As a result of this rapid development process, the per capita living area of urban residents in Guangzhou will be only 34.28 square meters in 2021, and the permanent population density will be 2512 persons per square kilometer, leading to an increasing shortage of land resources. As Guangzhou enters the era of stockpiling land use, it is necessary to release this potential by reusing URs. To better understand the specific problems and challenges of the reuse strategy for URs in Guangzhou, we selected 10 URs that have attracted much attention in Guangzhou and conducted a specific analysis of their impacts on urban development to provide more comprehensive guidance for a sustainable reuse of urban ruins in Guangzhou.
In 2008, the Guangzhou municipal government proposed the strategy of withdrawing secondary industries from the urban area and developing tertiary industries such as trade and services. Six of these urban ruins, including the Guangzhou Steel Factory (GSF), Guangzhou Paper Mill (GPM), Guangzhou Shipyard (GS), Taikoo Warehouse Wharf (TCW) [23], Pearl River Brewery (PRB), Guangzhou Textile Machinery Factory (GTMF), and Guangdong Water Conservancy and Hydropower Machinery Construction Company (GWH), were formed under such circumstances. They are all located in the center of Guangzhou, in close proximity and in excellent geographical positions. They are the obvious embodiment of the industrial ruins of Guangzhou. They were relocated for the sake of the urban environment. GSF’s main production line was completely shut down in October 2013. GPM, moved to Nansha in 2007. The “Paper City” that stood for decades on Industrial Avenue has gradually disappeared and is now being re-planned as “Guangzhou Paper New City.” GS is located in the central business district of the White Goose Pond in Guangzhou, and the Pearl River to the east is an important hub on the Pearl River Channel. The main business has gradually moved to the original factory of Longxue Shipbuilding Base in Nansha District, which has stopped production. TCW has now been transformed into a “living room of the city” in Guangzhou, integrating cultural creativity, exhibition and trade, sightseeing, entertainment, and other functions based on the preservation of the original history. Currently, the PRB site is divided into three parcels: there are approximately 173,700 square meters of state-owned land in the south, approximately 35,700 square meters of Binjiang in the north have been converted into the Pa Ti Beer Culture and Creative Park, and the remaining 69,100 square meters are reserved by the Pearl River Beer Group [24].GTMFis currently being turned into the T.I.T Creative Park with the theme “fashion, creativity, and technology”. In November 2005, the abandoned factory workshops of GWH were renovated and re-displayed in front of people as a LOFT living area, and were renamed Guangzhou Xinyi International Club [25].
ZSF was abandoned in 1997 owing to rising raw material costs, increased competition, and the manufacturers’ own production and marketing reasons [26]. Now it is transformed into cultural and creative parks with a unique industrial and artistic flavor. The village of Xian (XV) is typically representative of the “village within the city” in the ruins of the city. It is located in the Tianhe district of Guangzhou and is the most central village in Guangzhou. It is the most extensive “cowhide moss” near the Pearl River in New City [27]. ER was created in 1931, gathering the essence of Xiguan arcade architecture. It is the most complete and longest arcade block in Guangzhou, and is praised as the “most beautiful old street in Guangzhou” [28]. With the concentration of dilapidated old houses and the eastward shift of Guangzhou’s urban development center of gravity, ER is declining.
3.2. Evaluation Methods
To evaluate the impact of URs on the development of a city, the factors to be considered mainly include the background conditions, socioeconomic conditions, surrounding environment, and geographical conditions, etc. AHP is used to analyze the impact of URs on urban development and the development potential, to evaluate the URs that need sustainable reuse [29]. Through comprehensive investigation and analysis of the URs that have been reconstructed and reused, the impact of various factors on the reuse of URs is evaluated. Meanwhile, referring to the previous work and the principles of index selection mentioned above, combined with the domestic and foreign methods of the impact evaluation of URs, using AHP to construct the evaluation index system can be found in Table 1. The impact assessment of URs is taken as the target layer (layer A). The selected elements of the middle layer (level B) include background conditions (B1), socioeconomic conditions (B2), surrounding environmental conditions (B3), geographical conditions (B4), and the system layer (level C) includes the year of abandonment (C1), causes of abandonment (C2), capital base (C3), political environment (C4), damage level of hardware facilities (C5), human environment (C6), population density (C7), noise pollution (C8), pollution (C9) site conditions (C10), natural conditions (C11), and traffic conditions (C12).

Table 1.
URs’ importance evaluation index system.
3.3. Weights Calculation
Determining the index weight is the supreme premise that directly determines the scientific rationality of the valuation index system. Here, the index weight is given through a combination of subjective and objective weighting methods [30]. The first is to build a judgment matrix table, take the experts’ opinions, and the experts will judge the relative importance of index factors at each level of the evaluation index system according to the actual decision-making problems and the experts’ own knowledge and experience. These judgments are expressed by numerical values. Finally, the average values of several experts’ judgments were selected as shown in Table 2, and the corresponding weights were calculated to reasonably determine the ranking of each index weight, as shown in Table 3 and Table 4. The situation where the indicator weights were contrary to the actual importance of the indicators was prevented.
Table 2.
Comparative Matrix of Indicator Systems for Comprehensive Evaluation of the Importance of URs.
Table 3.
Ranking weights of intermediate-level elements on decision objectives.
Table 4.
The weighting of elements in the scheme layer to the decision objectives.
3.4. Comprehensive Score Calculations
In constructing the scoring criteria, the value of each indicator in the scheme level is divided by 100 as the total score. The score of each factor is assigned by the expert scoring method, and the value of each factor is set by the fuzzy scoring method. The scoring criteria can be found in Table 5.
Table 5.
URs’ Significance Program Tier Indicator Scoring Criteria.
3.5. Evaluation Model
According to the investigation and research of relevant scholars on twelve experimental objects and based on the above evaluation indicators, the development potential score can be found in Table 6. In this model, the process is as follows: multiply the fuzzy score of the indicator by its weight, which is the comprehensive score; the mathematical model of Rosenberg and Fishbein is then used to calculate and evaluate the results:
Table 6.
The total score of the development potential of 10 urban ruins in Guangzhou.
In Formula (1), S is the comprehensive evaluation value of the development potential of URs; Pi is the evaluation score of the ith evaluation factor; Wi is the weight of the evaluation index; N is the number of evaluation factors.
3.6. Score Levels
According to the total score calculated, the results are divided into four classes: Ⅰ, Ⅱ, Ⅲ, and Ⅳ, which provide some quantitative analysis for the sustainable reuse of URs. However, the construction of URs involves many other uncertain factors. Therefore, in the actual situation, the quantitative analysis and qualitative analysis should be combined to consider the problems, so that the development of potential indicators can be found in Table 7.
Table 7.
Classification of indicator categories.
Through AHP, the importance of the sustainable reuse of 10 typical urban ruins in Guangzhou was evaluated. Using the Rosenberg–Fischbein mathematical model, the PRB was calculated to be the highest scoring, over 90, so the PRB was selected as the specific object of study. The GWH, GPM, ER, and GS with 70~90 points need to be constructed with emphasis, while the GSF, GTMF, TCW, ZSF, and XV with 70 points or fewer need to be guided and constructed reasonably according to conditions. It is more scientific, reasonable, and objective to use this method for the sustainable reuse of URs. Even if the final result is that XV ranks last, it does not mean that XV has lost the chance to be developed or protected. There are many other factors to consider. In other words, the ranking cannot be used as the only criterion to evaluate the value of URs, especially in the aspect of sustainable reuse development. Using the AHP method effectively shows the importance of each indicator and the relationship between them. This provides a solid basis for a comparative analysis of the benefits of each UR, aiming to select the most urgent need for a solution, rather than judging whether it is good or bad.
4. Methodology
The purpose of this study is to develop a complete set of methods to guide the sustainable reuse of URs and to form a solution for the sustainable reuse of URs by combining the residents’ evaluations of URs with the design method based on DL. The method is divided into three stages in Figure 5. The URs are analyzed as a whole, considering various factors, to solve the pain points more effectively as well as the difficulties of the sustainable reuse of URs.
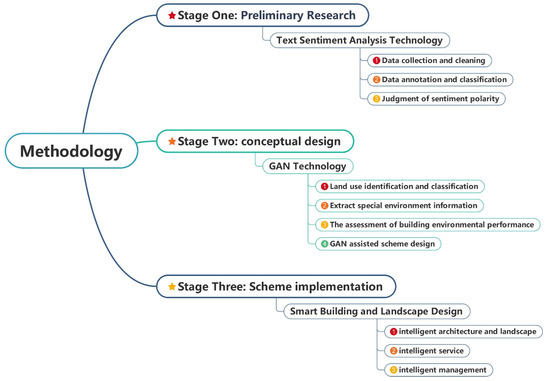
Figure 5.
Flow chart of sustainable approaches to the reuse of urban ruins (Figure source: original drawing).
4.1. Text Sentiment Analysis Technology
For the premise of sustainable reuse of URs, the importance of URs must be considered with the residents as the center, to meet the requirements of residents. Their strong support is needed in the process of sustainable reuse. The DL algorithm can effectively obtain the unstructured text information in social media comments, and achieve the text classification requirements such as the sentiments’ polarity judgment [31]. In the first stage, the text sentiment analysis technology based on the DL algorithm provides a solution for the quantitative analysis of unstructured and semi-structured network comment data, breaking through the limitations of information sources, data volume, authenticity, and other aspects of the traditional quantitative analysis methods such as questionnaires. It provides decision support for the design strategy of the project of sustainable reuse of urban ruins in the later period. In this stage, social media comments are used as the data source, and a deep learning algorithm is used as the support to measure the emotional orientation of residents in the sustainable reuse of urban ruins. The research steps follow.
Data collection and cleaning: with the five Chinese network platforms of Ctrip, Mafengwo, Meituan Peripheral Tour, Qunar.com, and Sina Weibo as the data sources, we use python’s BeautifulSoup, URL-lib, re regular expressions, and sqlite3 to achieve crawling, parsing, and storage of the text comment data, we find one of the time nodes, obtain the text comment dataset, and then conduct data cleaning to ensure the quality of later data research. Firstly, we eliminate the advertisement and other types of data that are completely irrelevant to the required data in the comment data set. Secondly, we delete the data published on an official account that cannot represent personal sentiments or tendencies. Following this, we de-duplicate the duplicate data in the dataset to eliminate some empty text data. Finally, we get the data after the cleaning.
Data annotation and classification: by collecting and cleaning the residents’ comments in the Social big data, and integrating the content and elements of URs that the residents pay the most attention to, the review content on the reuse direction of URs is divided into six categories: urban parks, museums, gymnasiums, cultural and creative parks, residential areas, and shopping malls. Text classification can be divided into two categories: multicategory and multi-label categories. Based on the EASYDL [32] platform under the PaddlePaddle [33] DL framework, this study uses a multi-label text classification model to annotate and classify the text comment data of evaluation categories to evaluate the sentiment tendencies of different content layers. The specific implementation methods are as follows: first, a total of 10,913 pieces of data was obtained through the crawler, and a total of 2906 pieces of valid data was obtained after data pre-processing. Ninety percent of the total dataset was randomly selected as the training set, i.e., 2616 input models for training. Five percent was used as the development set, i.e., 145 pieces of data were used for cross-validation and parameter tuning during the model training. The number of test sets was 5%, and 145 pieces of data were tested on the test set after the model is trained. The multi-label text classification dataset is then created on the EASYDL platform, and the training patterns are manually labeled. Second, the model training is performed for multi-label text classification data, and the model evaluation report and verification results are optimized step by step; finally, after the model training is completed, the model is invoked via the Restful API interface, and the patterns to be classified are classified [34]. The text classification model often takes the accuracy rate , the recall rate , and the value as the evaluation indicators. The accuracy rate is based on the prediction results, which means the actual positive proportion of the samples with a positive prediction: the higher the accuracy rate, the more accurate the model classification. The recall rate is specific to the sample, that is, the number of positive samples in the sample that are correctly predicted. The higher the re-call rate, the wider the coverage of the model, and the less text is missing. The value is a comprehensive indicator that reflects the model’s classification performance. It is the harmonic mean of the accuracy rate and recall rate. The calculation formula of the evaluation index is as follows:
The accuracy rate, recall rate, and value of the macro average are used to evaluate the multi-label text classification model. The calculation formula is as follows:
The final Macro-average accuracy rate P is 96.5% by the text classification model. The recall rate was 84.0%, and was 89.5%. This meets the requirements of an affective propensity analysis for the sample data that have been classified in the follow-up of this study.
The sentiment polarity is judged by the data obtained. The DL algorithm is widely used in the field of natural language processing, and has achieved better results than traditional models. Common deep learning algorithms mainly include Convolutional Neural Networks (CNN) [35], the Long-Term Memory Model (LSTM) [36], the Bidirectional LSTM Structure Model (BI-LSTM) [37], and the Baidu Text Semantic Representation Model (ERNIE2.0) [38]. The review data of the URs are mainly unstructured short texts. Most of the review texts contain the feature words that determine the overall emotional orientation of the text. Using ERNIE2.0, accurate emotional polarity can be determined. By calling the API interface, we can judge the emotional polarity category of the URs’ review data. At the same time, the bidirectional encoder representations from transformers’ BERT text analysis model [39] has been widely used in recent years. The core idea of the BERT model is consistent with the Transformer model. By combining the relationship between each word in the text and other words, the restriction of distance is removed, and the dependency between the current word and other words in the sentence is explicitly expressed: the process is to fully combine the context information of the sentence, which better identifies the semantic information of the sentence, and also achieves the purpose of parallel processing. Its network structure is shown in Figure 6a. The coding process of the model input is the sum of three vectors. The input form is shown in Figure 6b, for the word vector representation, the location information coding, and the paragraph information-marking of each word in the input text, respectively. At the same time, two special symbols [CLS] and [SEP] are added; [CLS] is generally added at the beginning of the text. This feature can be extracted for classification models, and [SEP] represents the sentence-breaking symbol, which is used to break two sentences in the input text. Emotional polarity is divided into three categories: negative (0~0.333), neutral (0.333~0.667), and positive (0.667~1.000), with the corresponding confidence added. By using the deep learning algorithm to calculate the emotional value of the comment data, a lot of manual interpretation time can be saved, and it is universal.
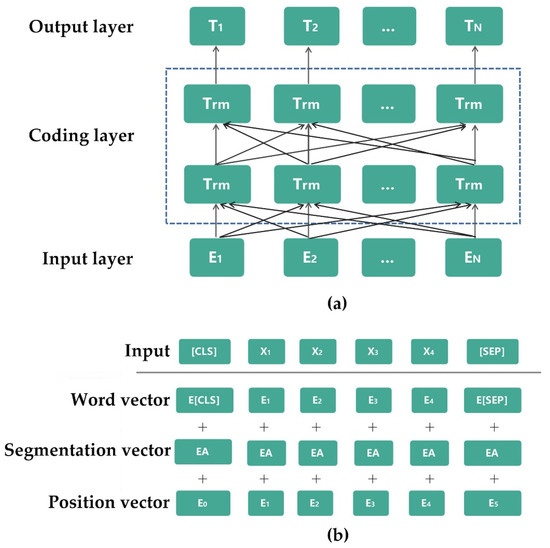
Figure 6.
(a) Structure diagram of the BERT model (Figure source: original drawing); (b) Input sequence (Figure source: original drawing).
4.2. GAN Technology
Through the analysis of the first stage, we can fully understand the tendency of the surrounding residents to the type of sustainable reuse of URs, which is helpful to meet the needs of the residents to the greatest extent after the reuse of URs, so that the URs can be truly activated. Using the GAN approach, the current situation analysis of UR reuse in the second stage is proposed for the renovation strategy based on the results obtained in the first stage, including site information extraction, assessment of the physical properties of the built environment, and design of the renovation plan. Since GAN was first proposed in 2014, the design field has gradually selected GAN to develop new design tools. Its various improved models show the unique advantages of confrontation training methods, which have been widely used in scenes such as picture style migration and picture repair. The emergence of GAN can add competence to some simple and repetitive work such as image recognition and classification, and target detection, etc. It can efficiently process multi-source site information data, sort out the information needed for site analysis, and gradually liberate productivity. Before starting the specific design work, GAN can be used to identify and classify the texture of forest land, construction land, farmland, water areas, mining land, roads, buildings, and other different land uses around the URs according to different classification targets and objects. Furthermore, it can be combined with remote sensing data to extract particular environmental information about the site, such as water turbidity, water body attributes, surface biomass, surface temperature and other climate attributes, and conduct deeper research and improve the ecological optimization of microsites. The assessment of a building’s environmental performance includes the damage degree of the building itself and the surrounding water, energy consumption, and waste generation. The AI is embedded into the possibility of environmental material performance assessment and the optimization at the initial stage of design, and the GAN is proposed in order to combine with environmental performance prediction and form an environmentally intelligent assessment method. Before the specific design scheme is carried out, the ML will be used at this stage to predict the load of the building equipment system and the building energy consumption. The real sample set of building energy consumption will be ex-pressed as , where x represents the input of the neural network, that is, the building energy consumption at the previous moments, and y represents the output value of the neural network, that is, the predicted energy consumption at the next moment.
As a generative model, GAN is seen as a minimal-maximization game whose objective is to improve the generating power of the generator model and the discriminative power of the discriminator model to reach a Nash equilibrium. The specific formula of GAN is shown in Formula (4):
Maintaining consistency with the whole sample set of the building energy consumption, the building energy consumption sample generated by GAN can be expressed as:
where represents the previous moment’s produced building energy consumption, whereas represents the following moment’s expected building energy consumption. Together with the created sample set of the building energy consumption, the actual sample set of the building energy consumption is utilized for training the neural network, accelerating the convergence of the neural network, and optimizing the GAN model using the regularization approach. When the GAN parameters continue to change, and yz are continually updated based on the actual energy consumption sample set, and V approaches a global minimum. The design choice made at the earliest stage of the building design has a significant influence on the environmental performance of the design. In contrast, only a minor cost of design modification is incurred. At this stage, it is also necessary to fully consider the availability of building debris materials, and minimize the generation of construction waste. In the specific scheme design stage, several representative design cases are selected for analysis and reference. With GAN, we can quickly understand the area proportion of various land types of the case, to assist the design and quantitatively analyze the space allocation of the actual project according to the scale of the case, to improve the design efficiency. The model may be used to increase efficiency and reduce drawing time during the design process, particularly when there are a high number of solutions and different solutions. During the design process, we may also evaluate a number of design circumstances, include a number of components, and provide a number of solutions. The design is then coupled with geographical information to summarize public perception and assessment patterns of design solutions. In the scheme design stage, especially in the working scenario of numerous scheme analyses and multi-scheme mapping, the use of this model will help to improve work efficiency and save mapping time. In the process of designing the scheme, we can also weigh various design conditions, synthesize various factors, and obtain a variety of schemes. Furthermore, we can design questionnaires and send them to nearby residents for scoring in combination with the images of the design scheme. By combining spatial information with information on the evaluation of urban ruin reuse design plans by residents, we can effectively guide the planning and design from the perspective of the users’ perceptions by making use of the laws of ML’s perception and evaluation of the design plans.
4.3. Smart Building and Landscape Design
At the same time, in the future knowledge economy society, important production sites will be transformed into intelligent buildings and landscapes. In the future, with the development of architecture and landscape science and technology, we will further focus on protecting the environment, saving resources, reducing energy consumption, and improving the production and living conditions of human society. We will strive to develop and apply high-tech methods and build intelligent, energy-saving, ecological, and other new buildings, and landscapes, and fully meet the needs of society. Intelligent buildings and landscapes are the combination of information technology and architectural technology. The last stage of the sustainable reuse of URs is the specific project implementation stage, which is divided into three dimensions: intelligent architecture and landscape, intelligent service, and intelligent management. The specific project implementation forms a sound operation and ecological monitoring system. At this stage, it is also necessary to focus on the overall analysis of existing buildings, including the residual technical performance and the degree of material degradation, in order to maintain and renovate existing materials as much as possible, minimize the impact of the demolition of old buildings and new construction waste on the environment, and try to use energy-saving and environment-friendly materials in the new buildings.
5. Case Study
According to the comprehensive evaluation of 10 urban ruins by the AHC process, the former site of Guangzhou PRB scored the highest. The sustainable reuse of Guangzhou PRB is taken as the research object. From the overall urban environment of Guangzhou to the landscape function analysis of the park, the performance analysis of the building itself, to the transformation intention of the public, and finally to the introduction of intelligent means to conduct a comprehensive and systematic in-depth study.
5.1. Introduction to PRB
PRB is situated on Pazhou Island, Haizhu District, Guangzhou City, northwest of Pearl River New City, and across the river from International Finance City, less than 2 km from the Guangzhou landmark “Canton Tower.” The former site was built in 1985. It is a modern large-scale enterprise jointly operated by Guangzhou Light Industry Bureau and Guangzhou Farm Administration. It enjoys the reputation of “Pearl River in the South” in China’s beer industry. The PRB witnessed the reform in the 1980s and has carried the development of China’s beer industry. Although it has only 30 years of history, it is still an important “new industrial heritage”. In 2004, Guangzhou PRB Co., Ltd. cooperated with the world’s largest beer producer, Belgium Budweiser InBev Group, to build an international beer culture exhibition place. The Pearl River InBev International Beer Museum is on the east side of PRB. Here, visitors can learn about beer culture and history in the museum and visit the beer production process, laying a good foundation for the subsequent industrial transformation of the brewery. In 2008, the Guangzhou municipal government departments put forward the urban development strategy of “retreat from the second to the third”. The PRB Industrial Zone, located at the south end of the new central axis of Guangzhou, could not meet the requirements of the industrial strategic planning and the functional zoning layout of Guangzhou as a national central city, and began to withdraw from the urban area. The new plant is located in Nansha Economic Development Zone. The headquarters of Pearl Beer adopts the strategy of “moving while producing”, and the production line has gradually moved to Nansha. By December 2015, the headquarters of Guangzhou Zhujiang Brewery had completely stopped production, leaving numerous distinctive industrial buildings and a few craft beer production lines. In the process of relocation, PRB has gradually started its own renovation plan.
5.2. Problem Description
The total land area of the PRB is 27 square hectares. At present, the whole area is divided into three plots, see Figure 7; approximately 17.4 square hectares of the land has been collected and stored by the government in the south. According to the upper-level planning, it will cooperate with the Pazhou CBD to carry out high-density development and construction and gather e-commerce, high-end exhibition and trade, cultural promotion, and other industrial clusters. Approximately 3.6 square hectares north of the Binjiang River has been transformed into the Party Pier Beer Culture and Creative Park, a petite gathering place for exhibitions and cultural leisure in Guangzhou, attracting visitors to target this destination The remaining land is approximately 6.9 square hectares. It is the land reserved by the PRB Group. At present, some of the remains are reserved, including industrial pipelines, coal power plants (coal warehouses and coal conveying corridors, etc.), saccharification and fermentation phases I to IV, sewage treatment plants, packaging workshops, chimneys, water towers, and other original plant facilities and equipment. The former site of Pearl River Brewery is a cultural resource. As an industrial archaeological heritage, it should be further studied and reused for the purpose of sustainability.
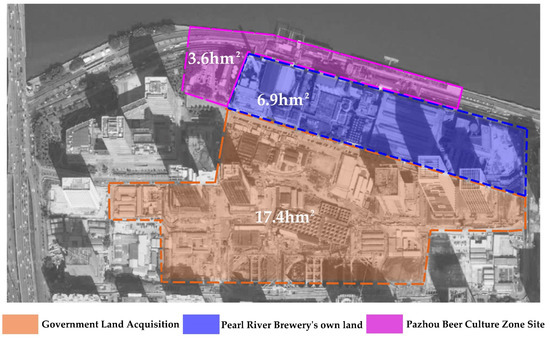
Figure 7.
Pearl River Brewery floor plan (Figure source: original drawing).
PRB has some problems due to its rapid development. The three parts of the brewery plot are developing rapidly, with too many development models and poor integrity. The land collected and stored by the government on the south side is directly managed and led by the government for development, which is biased towards the social public nature. Due to the nature of the land and the requirements of the development intensity, it has been difficult to retain the site. The overall building construction is a modern architectural style of glass-curtain walls, with mainly office buildings and office spaces. The super-high buildings and population density make the public feel the extremely fast pace of life. The Party Pier Beer Culture and Creative Park focuses on building the architectural style of the online celebrity and petty bourgeoisie, including art spaces, bars, catering, clothing, and other leisure industries. The land reserved by the Pearl River Brewery retains many antiquities of the old site, and the office building of the Pearl River Brewery has been transformed. The overall building gives a nostalgic and retro industrial style. The practice of the three types of models on the land used by the PRB General Factory has led to the unsynchronized development of the plot, the fragmentation of the public space functions, the disunity of the architectural appearance, and the poor integrity to some extent. In addition, Figure 8a demonstrates that the landscape greening is insufficient, as only artificial flowers and grasses were used to decorate instead of natural vegetation and trees, the ecological value of the overall waterfront space was disregarded, and the design presented to the public did not adequately account for the needs of the surrounding area. In Figure 8b in terms of architecture, the PRB’s industrial legacy is now closed and decaying, and the quality of the area needs to be enhanced. In Figure 8c, some of the aisles are too lengthy, and temporary structures have been constructed underneath the process area, which lacks a visible link to the nearby malt barn. There is still a great deal of room for renovation in the future sustainable usage of the PRB. The enhancement of the quality of the plant and the space is a significant challenge and an urgent matter for the self-reserved property, and there is still significant scope for renovation.
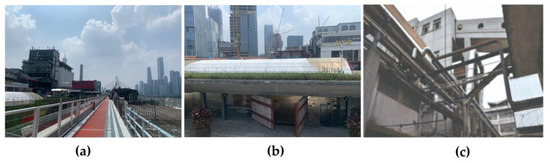
Figure 8.
(a) Pazhou’s surrounding landscape; (b) Vacant stores in Pazhou; (c) Map of the space under the coal conveyor corridor of the coal plant (Figure source: original photo).
5.3. Sentiment Analysis for Pearl River Brewery
Figure 9 collected comment data from five Internet platforms, including Sina Weibo, Ctrip, Ma Hive, Meituan Perimeter Tour, and GoWhere.com, and implemented comment data classification and sentiment polarity judgment based on the EASYDL deep learning platform to obtain public suggestions on the renovation of PRB to guide a more targeted renovation in a later stage. From 1 January 2019, through 31 December 2021, a total of 12,986 text comments about the rebuilding of the historic PRB were gathered. The criticisms were split into six categories based on their frequency and the aspects of PRB’s repair and reuse: architectural landscape, water landscape, business experience, art experience, transportation, and service facilities. Based on the EASYDL platform and the Paddle DL framework, a multi-label text classification model was used to label and classify the text review data of the six evaluation categories of PRB renovation and reuse to assess the emotional tendencies of different content layers. The comment data revealed a positive public sentiment trend, with a mean sentiment polarity of 0.703–6.1896 favorable comments representing65.2%, 545 neutral comments representing18.8%, and 465 bad comments representing 16.0%.
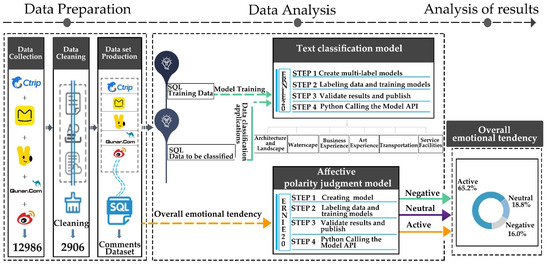
Figure 9.
Sentiment Analysis Technology Roadmap (Figure source: original drawing).
By building the relationships between the review data sources, sentiment polarity, and the six assessment categories, the data structure and proportion are shown in a comprehensive manner. The majority of comments in the categorized sentiment analysis data pertain to architectural landscape, aquatic landscape, and art experience, followed by descriptions of commercial experience and service facilities, and comparatively few comments on traffic conditions. The public has a high overall emotional evaluation of the Party Pier Beer Culture and Creative Park, believing that the art atmosphere of the reformed PRB is very strong and the riverside scenery at night is very beautiful. However, there are also some negative comments such as inconvenient parking, expensive food, a high vacancy rate of stores due to the epidemic, and people working around the area think that there is a lot of noise from the construction work and overall clutter. The overall evaluation of the Pearl River InBev International Beer Museum is general. People have a high evaluation of the art atmosphere of the museum, the layout and site of the old factory, the introduction of beer, and the ability to taste fresh original liquor. However, some people think that the museum facilities are old, the exhibition items are old, the management is backward, and the highlight features have not been brought into play. At present, the construction near the museum is suspended, and only groups with more than eight people can enter. At the same time, it is used as a patriotism education base to promote the study of beer culture. People generally hope that the landscape greening of the whole park will be better in the future transformation process, providing more public green space for people. At the same time, it is hoped that the old heritage and new buildings of the whole park will be well connected. The museum could be updated and transformed by introducing smart design, to improve people’s negative impression of the museum and build it into a popular venue.
5.4. Design Strategies for the Pearl River Brewery
5.4.1. Identification and Extraction of Site Information
According to different classification objectives and objects, firstly, GAN was used to identify and classify different land texture around Pearl River Brewery, such as roads, pedestrian paths, green areas, buildings, factories, parking lots, and landscape nodes. Figure 10 clearly shows the proportion of each site in the total site after DL identification. The next stage is to extract special environmental information from the site by combining with the remote sensing data, such as the properties of the surrounding water bodies, surface biomass, surface temperature and other climatic properties, to carry out deeper research and thus improve the ecological optimization of the microsite. Subsequently, by combining the generation of the confrontation network Pix2pix with the prediction of environmental performance, an environmental-intelligent evaluation method is formed. In combination with the evaluation criteria of technical value, historical value, and practical value, a full range of model simulations and field research are carried out for the PRB Park, including the overall park construction, functional distribution, structural characteristics of buildings, materials, and forms, to form a comprehensive evaluation system of the environmental material performance. According to this result, the sewage treatment plant and saccharification and fermentation plant that were originally planned to be demolished are industrial relics with a conservation value, and the IC reaction tower, sedimentation tank, and aeration tank of the sewage treatment plant reflect the advanced sewage treatment process. The fermentation tank of the saccharification and fermentation plant is the most important place for the formation of beer flavor, and the core part of the regional production function. At the same time, its structure remains intact, and the internal characteristic space has the potential for transformation and utilization. Finally, the optimization of the reuse of urban ruins increases the likelihood of the retention of the sedimentation tank and aeration tank of the sewage plant, as well as the fermentation tank base of the saccharification and fermentation plant and the surrounding pipelines.
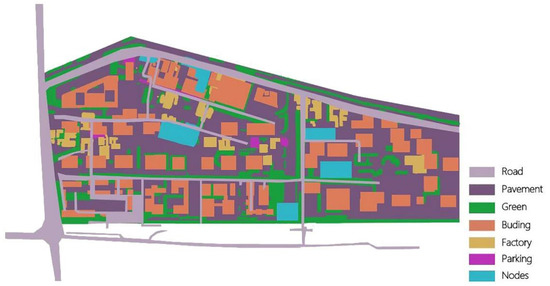
Figure 10.
Identification and extraction of site information (Figure source: original drawing).
5.4.2. Design Strategies
Figure 11 illustrates the transformation strategy process for PRB. In response to the current state of the PRB site, which has too many development modes, public space is fragmented and not integrated, and the building facade is not unified and the integrity is poor, it is necessary to adjust the land use and functional layout in conjunction with the industrial heritage. For the industrial heritage within the scope of government collection, urban design optimization coordinates the demand for heritage preservation and development indicators through the adjustment of the nature of land use and plot division. In the overall land use pattern, the spatial pattern of “dense and sparse” is achieved by increasing the density of municipal public services and efficient and compact land development. Figure 12 uses four landscape axes to connect the four sites (i.e., Smoke Tower Square, Pazhou Square, Jiuquan Square, and Water Tower Square). Smoke Tower Square proposes to unify the architectural style, retaining the chimney and western entrance plaza. Pazhou Square proposes the connection of the riverfront platform, and the transformation of the craft brewery into a restaurant bar. Jiuquan Square proposes the transformation of the packaging workshop inside the building and to retain the Bottom of the fermented portion. Water Tower Plaza proposes the connection of the architectural space with the surrounding park. The full use of the waterfront landscape of the Party Pier District is proposed to guide tourists to separate, gather and disperse, and at the same time strengthen the interrelation of the regional functions in depth, to realize the vitality sharing of regional resources. Based on the overall concept of the site reconstruction planning, and fully considering the current functional structure of the plot, under the premise of protecting the industrial heritage, we will open up a number of waterfront pedestrian corridors, strengthen the connection between the new entertainment and leisure plate along the river and the original industrial renewal plate in depth, and create a dynamic public space while ensuring the high accessibility of the region. “Four axes” means to create a fashion axis with both a modern business atmosphere and an historical sense by vertically combining modern buildings such as the International Beer Headquarter Building and renovated buildings such as the Malt Can Hotel. Relying on many industrial reserved buildings with historical, cultural, and aesthetic values, the dynamic leisure axis full of the flavor of the industrial civilization era is shaped by the transformation of the bottom space and the appropriate functional ratio. In combination with the beer museum, carnival, water tower, and other characteristic buildings, a beer culture axis gathering beer culture is created. In the horizontal direction, the passage between the Smoke Tower and the Malt Can Hotel, and between the Malt Can Hotel and the museum will be opened to form a tourist experience axis connecting various functional areas and connecting ancient and modern cultures.
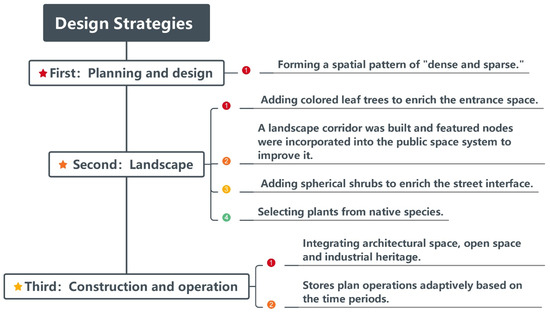
Figure 11.
Pearl River Brewery planning structure (Figure source: original drawing).
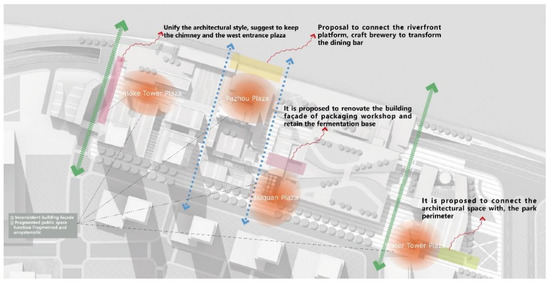
Figure 12.
Pearl River Brewery planning structure (Figure source: original drawing).
Figure 13 shows that there are many problems in the landscape greening of the whole park, which need to be solved urgently. The greening of the entrance space of the park lacks guidance and theme, and colored-leaf trees should be added to enrich the entrance space. The streets and alleys between houses lack greening to provide shade, and the greening level of the public space is only single-layer, lacking vertical change. The municipal greening of external roads is too simple, and spherical shrubs should be added to enrich the interface along the street. The plant species does not match the site environment, which is very abrupt, so local species should be selected. Plants planted too high are close to residential buildings, affecting the lighting of buildings and blocking the view. To solve the above problems, we need to build a landscape corridor and integrate the characteristic nodes into the public space system for improvement [40,41]. Through the extension of the landscape space, the pedestrian connection between the characteristic nodes and the surrounding land and the riverside is strengthened. Full use of the waterfront landscape of Party Pier District is needed and the surrounding urban landmark buildings could be the visual focus. The path, building volume, and plot landscape could be combined to build a sight corridor. Combining the green space system with the water system, the landscape corridor could be built. Through the public space network, the green space of Pazhou Street West Park in the hinterland could be connected with the riverside landscape belt, so that it can be integrated into the public space system of the area. At the same time, the landscape of the entire park will be transformed, designed and reused, which can also effectively connect several large functional areas, increase connections, and promote the synchronous development of the entire park.
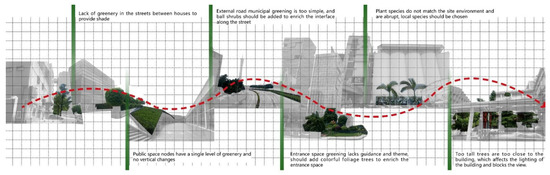
Figure 13.
Landscape Status and Measures (Figure source: original drawing).
In response to the current situation of closed and dilapidated industrial heritage and abandoned stores, we propose a strategy to improve the quality of public space integration and node shaping by combining characteristic buildings and structures. The development of abandoned factories in the direction of primary and tertiary industries will eventually lead to a new type of tourism experience with the industry, tourism, and beer culture [42,43,44]. The base of the fermentation tank, industrial pipelines, packing house, malt silo, coal transfer corridor, water tower, and chimney are all industrial remains with typical characteristics of beer processing production. Especially the malt barn, as malt is the soul of beer, and all the malt used by PRB to make beer for more than 30 years has come out of this malt barn. For many former PRB workers, the malt barn symbolizes the brewery, and its preservation provides them with an essential feeling of historical connection. However, some of the historic structures are now isolated from the new buildings, which poses a significant challenge for the rehabilitation design and eventual usage of the buildings [45,46]. In response to this, an integration plan of architectural space, open space, and industrial legacy was established, as follows. Using a coal power plant as an example, the area’s open space is organized, and the podium of the new headquarters building is opened as a public space, while the southernmost span of the west coal shed is retained as an industrial landscape and combined with the second-floor corridor to form an overall spatial sequence. As a result, while accommodating more three-dimensional greening and ground activities, it also creates a more comfortable space for the preservation of buildings, forming a public activity node with cultural characteristics that integrates the old and the new as a whole. The preservation of the Pearl River Brewery’s historic buildings and structures is basically the preservation of the brewery’s history and culture. Throughout Figure 14, there are several abandoned shops in the park, which is a result of both the park’s general area design and its overall management. The operation of the park can be planned and designed according to different time periods, and various festivals can be planned and designed in advance, so those appropriate strategies can be implemented at the appropriate time to carry out a variety of activities in the park and attract tourist traffic. The park’s functional activities may make full use of the waterfront port and industrial expertise to provide a range of outdoor and indoor experience activities. In addition, it is conceivable to develop a scenic tour APP system for the PRB. The PRB IP brand will be developed via the fluidity of network exposure, and a new model of tourism, cultural development, and the Internet will be implemented. This Internet tool can preserve the original appearance of the factory, improve the tourist experience, provide multiple ways to participate and integrate into the PRB Park, and truly activate the PRB. After a complete set of design schemes are accomplished, they can also be put on various websites to solicit public opinions again, to ensure that the transformed park is what people really need.
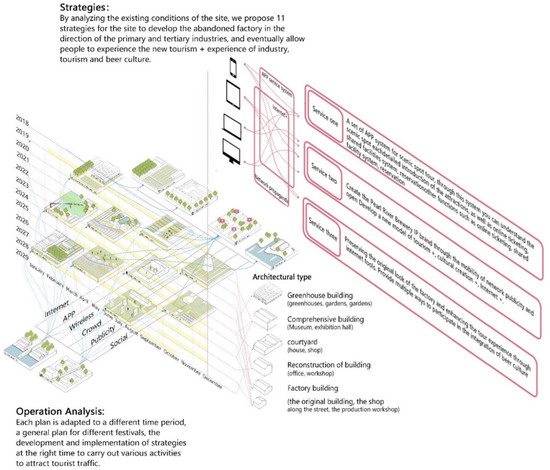
Figure 14.
Pearl River Brewery Operation Planning and Design (Figure source: original drawing).
5.5. Implementation
On the one hand, the Pearl River Brewery Park should retain the previous ruins as much as possible, and on the other hand, to actively respond to the national carbon-neutral “3060” goal, it should attach importance to the green concept of urban culture and ecological environment and develop into a smart life. The PRB Park is an important component of the city, and its architectural and landscape setting is not isolated and separated from the surrounding urban environment. Energy consumption and pollution issues should also be given attention. Under the guidance of ecological civilization construction, PRB landscape space must have ecological characteristics, emphasizing the construction of the ecological foundation and ecological human environment. The pursuit of mechanical aesthetics of intelligent life does not conflict with the concept of cultural ecology. The construction of intelligent architectural landscape has become a popular trend in urban ruins design.
5.5.1. Intelligent Building and Landscape
Under artificial intelligence, the wisdom transformation of the PRB focuses primarily on the transformation of the existing structures and landscapes via the use of high and new technology as well as energy-saving and environmental protection technology. The low-carbon development in the process of building and landscape operation can be achieved by installing energy management and control systems including energy management platforms, energy metering platforms and mobile operation and maintenance platforms in the park. The system can display the basic operation information of the park as a whole, and use AI, the Internet of Things, and other technologies to collect, record, and analyze the energy consumption data of water, electricity, gas, and heat in the park in real-time, as well as realize the visual building energy consumption monitoring and management, to realize the green and low-carbon operation of the park by optimizing resource allocation. The landscape space design of Smart Pearl Beer Park under AI enabling is an intelligent and active perception and adjustment of the necessary conditions for people to use the space. Therefore, the relevant facilities should be arranged in the space for traffic and accommodation, mainly involving the reasonable layout of front-end data collection facilities such as sensors and cameras for air quality, landscape microclimate monitoring, lighting and security; as well as the layout position and mode of relevant reaction facilities, such as a negative ion generator, fog forest, and alarms, etc. The layout of these facilities should follow the principle of intensification and zoning, not occupying too much landscape space, but also ensuring that they can meet the space requirements of different regions [47,48].
Intelligent air monitoring and regulation and intelligent landscape microclimate regulation mainly involve air quality monitoring, various microclimate monitoring sensors, and foggy forest systems. Air quality monitoring sensors and microclimate monitoring sensors can be set up together using a unified data collector to upload air quality monitoring data. This includes laser dust sensors, sulfur dioxide sensors, nitrogen dioxide sensors, carbon monoxide sensors, ozone sensors, negative oxygen ion sensors, air temperature, and humidity sensors, and light and ultraviolet intensity sensors, etc. The sensor adopts the national standard MODBUS communication protocol, with the built-in international standard 485 communication data acquisition modules to automatically identify various types of sensors. Various and flexible power supply modes can be adopted, such as AC/220V mains power supply, built-in lithium battery pack power supply, or solar battery, and wind–solar complementary power supply, to ensure normal operation in case of power failure in rainy weather. The data acquisition host adopts the remote data wireless transmission mode to build in the data wireless transmission DTU module, and can reserve 485 data output ports to selectively connect the LED information display. Due to the limited scope of outdoor functions, the fog forest system should be installed in the space where people gather and stay, such as near the pavilion structures. The fogging system comprises a high-pressure fogging host, atomizing nozzle, electric control part, network control part, and pipeline. The power of the main fogging machine is 3–5.5 KW, the equipment pressure is 1–20 MPa, the atomizing nozzle is a high-pressure ruby firing pin nozzle, the working pressure is 4–7 Mpa, and the copper pipe or stainless steel pipe has an outer diameter of 7–10 mm and an inner diameter of 5–9 mm. The nozzle aperture is 0.15 mm/0.2 mm/0.3 mm. The intelligent lighting control system is divided into two opening modes, namely, the intelligent perception based on ambient light and the intelligent perception based on the presence of no one. The ambient light intensity relates to the lamp controller through the perception of the light intensity sensor. The working voltage of the light intensity sensor is 9–24 V, and the monitoring light range is 0–200 Klux. It is triggered by a human body’s presence through an infrared detection sensor according to the intelligent perception opening mode of no one passing by. When a person enters the sensor sensing range, the lighting facilities will automatically start, and after a person leaves, the switch will automatically close after a delay. The detection range radius of the human body infrared-detection sensor is greater than 10 m, has a 0–10 V dimming output, a 0–3600 s adjustable delay time, a 180–250 V working voltage, the power consumption of the sensor itself is less than 0.016 W, and the load lamp power is 10–200 W. The sensor facilities required by the intelligent security system include smoke sensors, temperature sensors, high-definition surveillance cameras, and pressure sensors. The pressure sensors need to be installed at the bottom of the equipment to be monitored; therefore, other sensors can be set together with the light poles, and the data can be collected and uploaded through a unified data collector, which can ensure more comprehensive coverage and does not occupy the landscape space. In addition, the security system also needs to be equipped with an audible and visual alarm module to send a signal to remind people to react and avoid danger when an emergency occurs. To sum up, the specific layout of facilities related to intelligent space is shown in Figure 15.
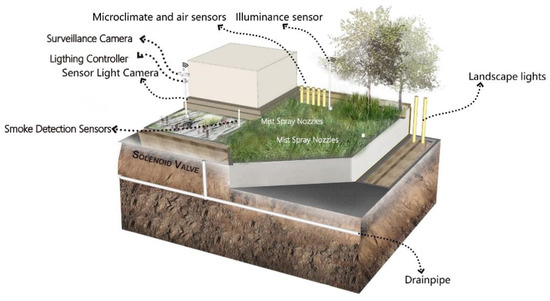
Figure 15.
The specific arrangement of facilities related to intelligent space places (Figure source: original drawing).
5.5.2. Intelligent Service
The basic services of the park are designed with the goal of intelligence and efficiency. In terms of access control services, relying on face recognition, accurate user portraits and 5G and other technical support, it is easy to realize the non-sensory verification of multiple identities, thus effectively enhancing consumers’ technological experience. In terms of navigation services, PRB Park can provide 3D automatic navigation services and information about toilets, restaurants, shops, and other service facilities in the park. The core service personalization of Smart Pearl Beer Park mainly refers to the use of AI, big data, the Internet of Things, and other technologies to change the traditional “one-size-fits-all” approach and achieve personalized and accurate supply of the park. The Smart PRB, enabled by AI, can collect, store, and analyze public consumption data in advance, obtain and predict consumers’ consumption habits and preferences, organize services in advance and transform the post-service into the preservice. Expanding the universality of services means that the Smart PRB will break through the physical limitations of traditional parks through artificial intelligence, big data, the Internet of Things and other technologies to achieve the ubiquitous transformation from traditional battlefield services to new extended services. With the diversification of service models and the digitalization of service scenarios, PRB park supported by artificial intelligence can transfer some basic services to intelligent tools, disseminate beer knowledge, communicate beer culture, advise beer production services and add other content, and gradually form multi-level three-dimensional services. Smart PRB, enabled by artificial intelligence, also needs to better serve special-needs people. The smart sensors installed on the barrier-free facilities are used for real-time monitoring, and Braille signs, and intelligent voice navigation, etc., are used to guide special-needs people to correctly use the barrier-free facilities, providing them with more humane help and care.
5.5.3. Intelligence Management
The intelligent transformation of the PRB under artificial intelligence begins with the light-weighting of personnel management, which will streamline the management of administrative staff and realize the lightweight management of the park, thereby, reducing operating expenses and enhancing operational efficiency. Therefore, firstly, an efficient intelligent ticketing integrated management system in Pearl River-Yingbo Beer Hall can utilize multi-source data precipitation to achieve decentralized storage and sharing of core resources; thereby, providing a one-stop integrated solution for ticket management (including ticket source, ticket price, and ticket inspection and review, etc.), which can effectively reduce the cumbersome operation process of ticket pickup and ticket inspection. Secondly, data management can be made feasible, and the wisdom park management can be led and driven by artificial intelligence, the Internet, big data, and other technologies, actively transforming from a traditional management mode centered on people and things to a three-dimensional system management mode centered on data. With intelligent transformation, the administration of the park will be more effective, and the operation will be more scientific, hence lowering expenses and increasing profitability. Different types of intelligent robots, such as reception robots and photo robots, will appear in the physical or virtual space of the wisdom bead beer park, achieving a high degree of integration and synergy with the intelligent devices in the park, providing real-time intelligent consultation, positioning and navigation, intelligent circulation, and many other functions. Smart Park management can also be effectively integrated with the external management of the city, using technologies such as artificial intelligence to directly circulate and exchange information with various city departments. This not only enables other government departments to access park-related information in real-time, but also opens technical channels for social enterprises, civil organizations, and the public to access the data.
6. Conclusions
This study focuses on the sustainable reuse of URs using AI technology, which can effectively recycle waste materials and reduce resource waste and greenhouse gas emissions. Firstly, we use sentiment analysis techniques to pre-evaluate the public’s willingness around URs and provide the right direction for the reuse of ruins [49]. Secondly, GAN technology is used in the schematic design phase to identify site information and evaluate building performance and value to achieve sustainable reuse of urban ruins. On this basis, the building and landscape, services, and management will be intelligent, making the reuse of urban ruins more energy-efficient, environmentally friendly, and intelligent [50]. As a result, a whole new set of research methods has been developed, from the emotional analysis of residents to the design of solutions and the intelligent use of urban ruins.
Although in-depth research on the sustainable reuse of URs has been conducted using BERT and GAN, the sentiment analysis, program design, and project implementation of urban ruins have also been completed. However, there are still the following issues that need to be addressed:
- The evaluation of the impact caused by urban ruins and the surrounding population depends on various factors, which can produce different results from other factors;
- The sample size of the primeval design scheme of GAN technology is not enough, resulting in sample discrepancies in the design scheme. The sample size needs to be increased to improve the rationality of the scheme that reuses debris;
- GAN also has instability in the process of map recognition, and there will be errors for the identified site information.
In future research, BERT and GAN techniques will be studied more deeply on the topic of the sustainable reuse of URs. On the one hand, the data obtained will be more accurate by increasing the number of preliminary samples. On the other hand, we will conduct a more in-depth practical investigation on URs in Guangzhou and other cities to give more specific sustainable reuse strategies.
Author Contributions
Conceptualization, Q.D.; methodology, Q.D.; software, Q.D.; validation, R.C., Q.D. and L.Q.; investigation, P.S.; resources, L.Q.; data curation, R.C.; writing—original draft preparation, Q.D.; writing—review and editing, L.Q., Q.D.; visualization, P.S.; supervision, L.Q.; funding acquisition, L.Q. All authors have read and agreed to the published version of the manuscript.
Funding
This research received no external funding.
Acknowledgments
We are grateful to the anonymous reviewer for careful reading of the paper and helpful comments and questions.
Conflicts of Interest
The authors declare no conflict of interest.
References
- National Study on Rotten Buildings 2022. Available online: https://posts.careerengine.us/p/62d6d6c6d6856d02e59f3da5 (accessed on 20 August 2022).
- Greffe, X. Is heritage an asset or a liability? J. Cult. Herit. 2004, 5, 301–309. [Google Scholar] [CrossRef]
- High Standard to Promote Carbon Peaking and Carbon Neutral. Available online: http://www.rmlt.com.cn/2021/0830/623468.shtml (accessed on 20 August 2022).
- Guangzhou Construction Waste Disposal Facilities Layout Plan (2021–2035) Environmental Impact Report. Available online: http://cg.gz.gov.cn/attachment/6/6966/6966707/7712766.pdf (accessed on 20 August 2022).
- Pohoryles, D.; Maduta, C.; Bournas, D.; Kouris, L.J.E. Energy performance of existing residential buildings in Europe: A novel approach combining energy with seismic retrofitting. Buildings 2020, 223, 110024. [Google Scholar] [CrossRef]
- Monsù Scolaro, A.; De Medici, S.J.E. Downcycling and upcycling in rehabilitation and adaptive reuse of pre-existing buildings: Re-designing technological performances in an environmental perspective. Energies 2021, 14, 6863. [Google Scholar] [CrossRef]
- Heesche, J.; Braae, E.M.; Jørgensen, G.J.L. Landscape-Based Transformation of Young Industrial Landscapes. Land 2022, 11, 908. [Google Scholar] [CrossRef]
- Bottero, M.; D’Alpaos, C.; Oppio, A.J.S. Ranking of adaptive reuse strategies for abandoned industrial heritage in vulnerable contexts: A multiple criteria decision aiding approach. Sustainability 2019, 11, 785. [Google Scholar] [CrossRef]
- Wu, Y.; Pottgiesser, U.; Quist, W.; Zhou, Q.J.L. The Guidance and Control of Urban Planning for Reuse of Industrial Heritage: A Study of Nanjing. Land 2022, 11, 852. [Google Scholar] [CrossRef]
- Li, Y.; Chen, X.; Tang, B.-s.; Wong, S.W.J.C. From project to policy: Adaptive reuse and urban industrial land restructuring in Guangzhou City, China. Cities 2018, 82, 68–76. [Google Scholar] [CrossRef]
- Malczewski, J. GIS-based land-use suitability analysis: A critical overview. Prog. Plan. 2004, 62, 3–65. [Google Scholar] [CrossRef]
- Tzeng, G.-H.; Huang, J.-J. Multiple Attribute Decision Making: Methods and Applications; CRC press: Boca Raton, FL, USA, 2011. [Google Scholar]
- Deng, X.; Li, J.; Zeng, H.; Chen, J.; Zhao, J. Research on computation methods of AHP weight vector and its applications. Theory 2012, 42, 93–100. [Google Scholar]
- Jiang, P.; Shao, L.; Baas, C.J.S. Interpretation of value advantage and sustainable tourism development for railway heritage in China Based on the analytic hierarchy process. Sustainability 2019, 11, 6492. [Google Scholar] [CrossRef]
- Wang, J.; Chen, R.; He, Z. Traffic speed prediction for urban transportation network: A path based deep learning approach. Transp. Res. Part C Emerg. Technol. 2019, 100, 372–385. [Google Scholar] [CrossRef]
- Dick, S. Artificial Intelligence. HDSR 2019. [Google Scholar] [CrossRef]
- Jordan, M.I.; Mitchell, T.M. Machine learning: Trends, perspectives, and prospects. Science 2015, 349, 255–260. [Google Scholar] [CrossRef] [PubMed]
- Mitchell, T.; Buchanan, B.; DeJong, G.; Dietterich, T.; Rosenbloom, P.; Waibel, A. Machine learning. Annu. Rev. Comput. Sci. 1990, 4, 417–433. [Google Scholar] [CrossRef]
- Plunz, R.A.; Zhou, Y.; Vintimilla, M.I.C.; Mckeown, K.; Yu, T.; Uguccioni, L.; Sutto, M.P.J.L.; Planning, U. Twitter sentiment in New York City parks as measure of well-being. Landsc. Urban Plan. 2019, 189, 235–246. [Google Scholar] [CrossRef]
- Heikinheimo, V.; Tenkanen, H.; Bergroth, C.; Järv, O.; Hiippala, T.; Toivonen, T.J.L.; Planning, U. Understanding the use of urban green spaces from user-generated geographic information. Landsc. Urban Plan. 2020, 201, 103845. [Google Scholar] [CrossRef]
- Park, S.B.; Kim, J.; Lee, Y.K.; Ok, C.M.J.T.M. Visualizing theme park visitors’ emotions using social media analytics and geospatial analytics. Tour. Manag. 2020, 80, 104127. [Google Scholar] [CrossRef]
- Zhou, H.; Liu, H. Artificial intelligence aided design: Landscape plan recongnition and rendering based on deep learning. Chin. Landsc. Archit. 2021, 37, 56–61. [Google Scholar]
- Zhang, C.; Lin, S.; Gao, L. The Role of Community in Industrial Heritage Redevelopment: Evidence from Taigucang Wharf, Guangzhou, China. Asian J. Tour. Res. 2016, 1, 147–166. [Google Scholar] [CrossRef]
- Altrock, U.; Ma, H. Regeneration of derelict industrial sites in Guangzhou and Shenzhen. In Maturing Megacities; Springer: Berlin/Heidelberg, Germany, 2014; pp. 191–217. [Google Scholar]
- Niu, S.; Lau, S.S.Y.; Shen, Z.; Lau, S.S.Y. Sustainability issues in the industrial heritage adaptive reuse: Rethinking culture-led urban regeneration through Chinese case studies. J. Hous. Built Environ. 2018, 33, 501–518. [Google Scholar] [CrossRef]
- Gao, Q.; Zeng, J. Research on the reconstruction and renewal of the landscape space of industrial sites in post-industrial era: A case study of Guangzhou zilintang art town. J. Landsc. Res. 2021, 13, 25–28. [Google Scholar]
- Gu, Z.; Zhang, X. Framing social sustainability and justice claims in urban regeneration: A comparative analysis of two cases in Guangzhou. Land Use Policy 2021, 102, 105224. [Google Scholar] [CrossRef]
- Huang, D. How do people get engaged in civic participation? A case study of citizen activism in rebuilding Enning Road, Guangzhou. Chin. J. Sociol. 2017, 3, 237–267. [Google Scholar] [CrossRef]
- Milošević, M.R.; Milošević, D.M.; Stanojević, A.D.; Stević, D.M.; Simjanović, D.J.J.M. Fuzzy and interval AHP approaches in sustainable management for the architectural heritage in smart cities. Mathematics 2021, 9, 304. [Google Scholar] [CrossRef]
- Saaty, T.L. The Analytic Hierarchy Process: Planning, Priority Settling; McGraw-Hill: New York, NY, USA, 1980. [Google Scholar]
- Xingdong, C.W.L. Sentiment Analysis of Scenic Spot Comments Based on BERT. J. Guizhou Univ. 2021, 38, 57–60. [Google Scholar]
- Yao, T.; Wang, J.; Wan, M.; Xin, Z.; Wang, Y.; Cao, R.; Li, S.; Chi, X. VenusAI: An artificial intelligence platform for scientific discovery on supercomputers. J. Syst. Arch. 2022, 128, 102550. [Google Scholar] [CrossRef]
- Ma, Y.; Yu, D.; Wu, T.; Wang, H. PaddlePaddle: An open-source deep learning platform from industrial practice. Front. Data Comput. 2019, 1, 105–115. [Google Scholar]
- Chen, X.; Ji, Z.; Fan, Y.; Zhan, Y. Restful API architecture based on laravel framework. J. Phys. Conf. Ser. 2017, 910, 012016. [Google Scholar] [CrossRef]
- Gu, J.; Wang, Z.; Kuen, J.; Ma, L.; Shahroudy, A.; Shuai, B.; Liu, T.; Wang, X.; Wang, G.; Cai, J.; et al. Recent advances in convolutional neural networks. Pattern Recognit. 2018, 77, 354–377. [Google Scholar] [CrossRef]
- Sherstinsky, A. Fundamentals of recurrent neural network (RNN) and long short-term memory (LSTM) network. Phys. D Nonlinear Phenom. 2020, 404, 132306. [Google Scholar] [CrossRef]
- Huang, Z.; Xu, W.; Yu, K. Bidirectional LSTM-CRF models for sequence tagging. arXiv 2015, arXiv:1508.01991. [Google Scholar]
- Sun, Y.; Wang, S.; Li, Y.; Feng, S.; Tian, H.; Wu, H.; Wang, H. ERNIE2. 0: Acontinual pre-training framework for language understanding. arXiv 2020, arXiv:1907.12412. [Google Scholar]
- Devlin, J.; Chang, M.-W.; Lee, K.; Toutanova, K. Bert: Pre-training of deep bidirectional transformers for language understanding. arXiv 2018, arXiv:1810.04805. [Google Scholar]
- Lee, J.A.; Chon, J.; Ahn, C. Planning landscape corridors in ecological infrastructure using least-cost path methods based on the value of ecosystem services. Sustainability 2014, 6, 7564–7585. [Google Scholar] [CrossRef]
- Zhang, M.; He, J.; Liu, D.; Huang, J.; Yue, Q.; Li, Y. Urban green corridor construction considering daily life circles: A case study of Wuhan city, China. Ecol. Eng. 2022, 184, 106786. [Google Scholar] [CrossRef]
- Chen, A.H.; Wu, R.Y. Mediating effect of brand image and satisfaction on loyalty through experiential marketing: A case study of a sugar heritage destination. Sustainability 2022, 14, 7122. [Google Scholar] [CrossRef]
- Xie, P.F. A life cycle model of industrial heritage development. Ann. Tour. Res. 2015, 55, 141–154. [Google Scholar] [CrossRef]
- Timothy, D.J. The Heritage Tourist Experience: Critical Essays; Routledge: London, UK, 2017; Volume 2. [Google Scholar]
- Ćopić, S.; Đorđevića, J.; Lukić, T.; Stojanović, V.; Đukičin, S.; Besermenji, S.; Stamenković, I.; Tumarić, A. Transformation of industrial heritage: An example of tourism industry development in the Ruhr area (Germany). Geogr. Pannonica 2014, 18, 43–50. [Google Scholar] [CrossRef]
- Loures, L.; Panagopoulos, T. Sustainable reclamation of industrial areas in urban landscapes. Sustain. Dev. Plan. III 2007, 102, 791–800. [Google Scholar]
- Zhang, J.; Cenci, J.; Becue, V. A preliminary study on industrial landscape planning and spatial layout in Belgium. Heritage 2021, 4, 1375–1387. [Google Scholar] [CrossRef]
- Ouyang, H.Y.; Chen, B.F. Street corner space landscape design. In Applied Mechanics and Materials; Trans Tech Publications Ltd.: Bäch, Switzerland, 2014; Volume 641, pp. 489–492. [Google Scholar]
- Leising, E.; Quist, J.; Bocken, N. Circular Economy in the building sector: Three cases and a collaboration tool. J. Clean. Prod. 2018, 176, 976–989. [Google Scholar] [CrossRef]
- Menzies, G.F. Embodied energy considerations for existing buildings. Tech. Paper 2011, 13, 53–68. [Google Scholar]


Publisher’s Note: MDPI stays neutral with regard to jurisdictional claims in published maps and institutional affiliations. |
© 2022 by the authors. Licensee MDPI, Basel, Switzerland. This article is an open access article distributed under the terms and conditions of the Creative Commons Attribution (CC BY) license (https://creativecommons.org/licenses/by/4.0/).