Review

A Systematic Review of Traffic Incident Detection Algorithms

College of Engineering, American University of Sharjah, Sharjah P.O. Box 26666, United Arab Emirates
*
Author to whom correspondence should be addressed.
Sustainability 2022, 14(22), 14859; https://doi.org/10.3390/su142214859
Submission received: 30 September 2022 / Revised: 2 November 2022 / Accepted: 7 November 2022 / Published: 10 November 2022
(This article belongs to the Section Sustainable Transportation)

Abstract

:
Traffic incidents have negative impacts on traffic flow and the gross domestic product of most countries. In addition, they may result in fatalities and injuries. Thus, efficient incident detection systems have a vital role in restoring normal traffic conditions on the roads and saving lives and properties. Researchers have realized the importance of Automatic Incident Detection (AID) systems and conducted several studies to develop AID systems to quickly detect traffic incidents with an acceptable performance level. An incident detection system mainly consists of two modules: a data collection module and a data processing module. The performance of AID systems is assessed using three performance measures; Detection Rate (DR), False Alarm Rate (FAR) and Mean Time to Detect (MTTD). Based on data processing and incident detection algorithms, AID can be categorized into four categories: comparative, statistical, artificial intelligence-based and video–image processing algorithms. The aim of this paper is to investigate and summarize the existing AID systems by assessing their performance, strengths, limitations and their corresponding data collection and data processing techniques. This is useful in highlighting the shortcomings of these systems and providing potential solutions that future research should focus on. The literature is sought through an extensive review of the existing refereed publications using the Google Scholar search engine and Scopus database. The methodology adopted for this research is a systematic literature review following the Preferred Reporting Items for Systematic Reviews and Meta-Analyses (PRISMA) guidelines. This study can serve as a reference for researchers who are interested in developing new AID systems.

1. Introduction

Traffic congestion is becoming increasingly problematic in many countries and cities due to the increasing demand for the mobility of people and goods. There are several recurring causes of this chronic issue such as oversaturated traffic flow during peak periods. However, traffic incidents are non-recurring events that disrupt or block traffic flow. Incidents can be due to traffic collisions, stopped vehicles, road maintenance or adverse weather conditions [1,2,3,4]. Accordingly, traffic incidents may cause a significant reduction in road capacity and result in unexpected traffic delays, which increase travel costs [5,6,7]. Thus, traffic incidents have negative economic impacts as well as increase shipping and logistics costs and restrict employment opportunities [8,9]. According to the World Health Organization (WHO), traffic collisions cost about 3% of the gross domestic product in most countries [10]. In addition, traffic accidents are major causes of deaths and disabilities. According to the WHO, around 13 million people die every year because of traffic accidents and about 20 to 50 million people suffer from injuries and disabilities [10]. To overcome these negative impacts of incidents, the Traffic Incident Management (TIM) module became a fundamental function in Transportation Management Centers (TMC). One of the objectives of TIM is to detect and locate traffic incidents efficiently and within an acceptable timeframe through an incident detection component. In addition, the TIM proposes some actions that can reduce the negative impacts of incidents [11]. The role of TMC is to manage the traffic operations in the road network and provide the necessary actions to reduce traffic congestion [12]. One of the most efficient methods of addressing this problem is the implementation of incident detection systems. These systems continuously scan the roads for any anomalies in the traffic flow such as congestion or incidents and help TMC operators to have a quick response to restore normal conditions. Accordingly, considerable efforts were devoted to the development of numerous incident detection systems including several data processing algorithms. The purpose of this paper is to provide an overview of the existing incident detection systems, evaluate their strengths and limitations, and assess their performance to highlight the gaps that exist in these systems. This paper also discusses practical solutions that can be used to overcome the shortcomings of existing AID systems and to improve the efficiency and reliability of incident detection systems.

1.1. Research Background

The aim of any incident detection system is to detect the occurrence of any incident instantly and correctly. The development of incident detection systems has attracted the attention of many researchers since the 1970s [13,14,15,16,17,18]. The logic of detecting the occurrence of incidents is that these incidents usually cause abnormal traffic conditions. When a severe incident takes place, it might block one or more lanes of the road, which can create traffic congestion, block the vehicles upstream of the incident, and create a queue of vehicles that propagates backward, as depicted in Figure 1.
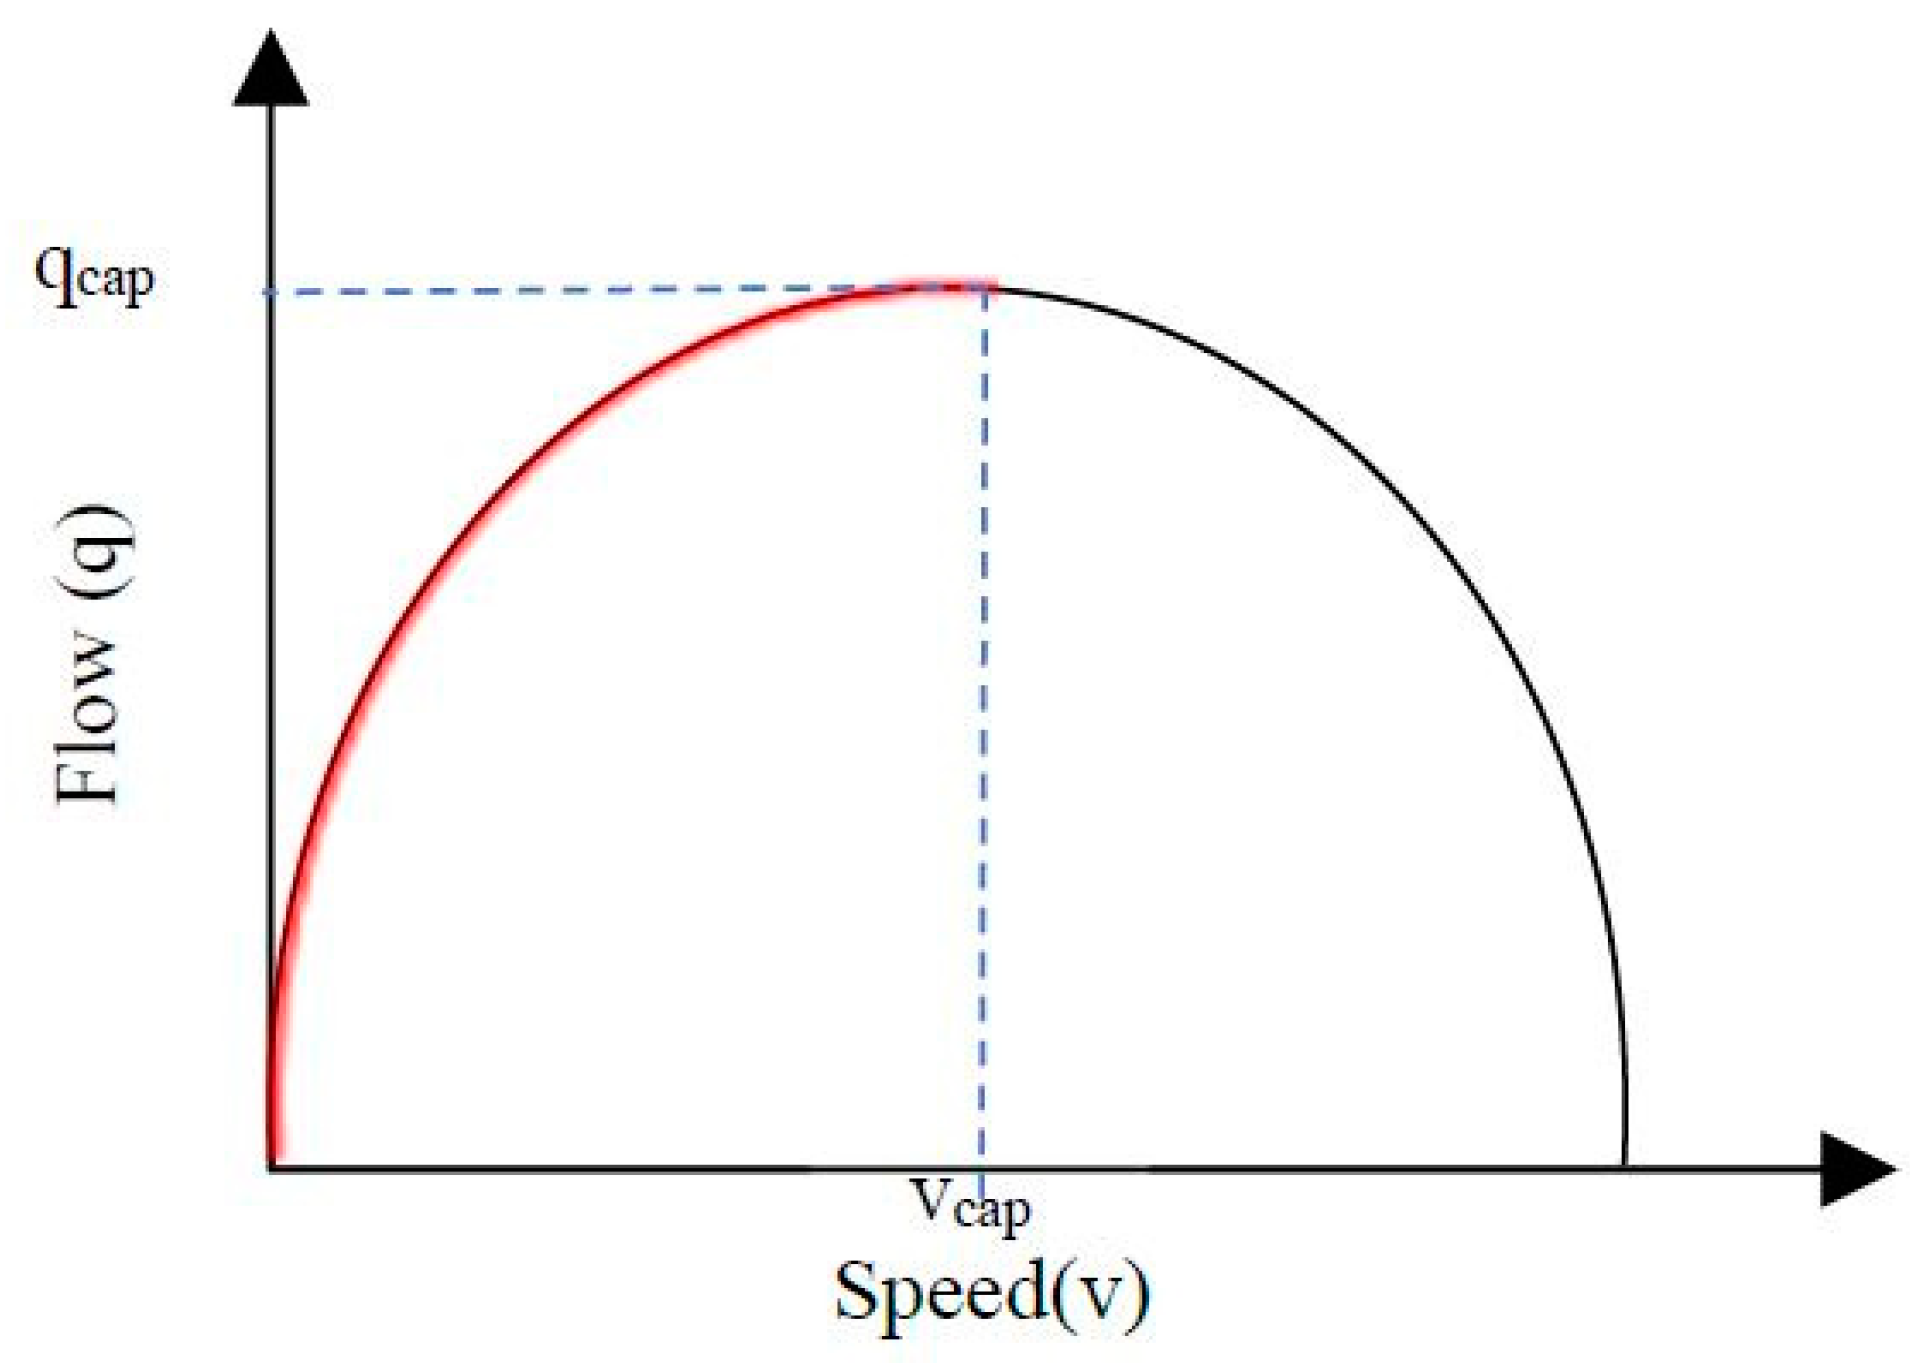
Traffic congestion is usually associated with a significant reduction in the speed of the vehicles in the upstream section and thus reduces traffic flow as well, according to the Greenshields model of the flow–speed relationship, as shown in the red portion of the curve in Figure 2.
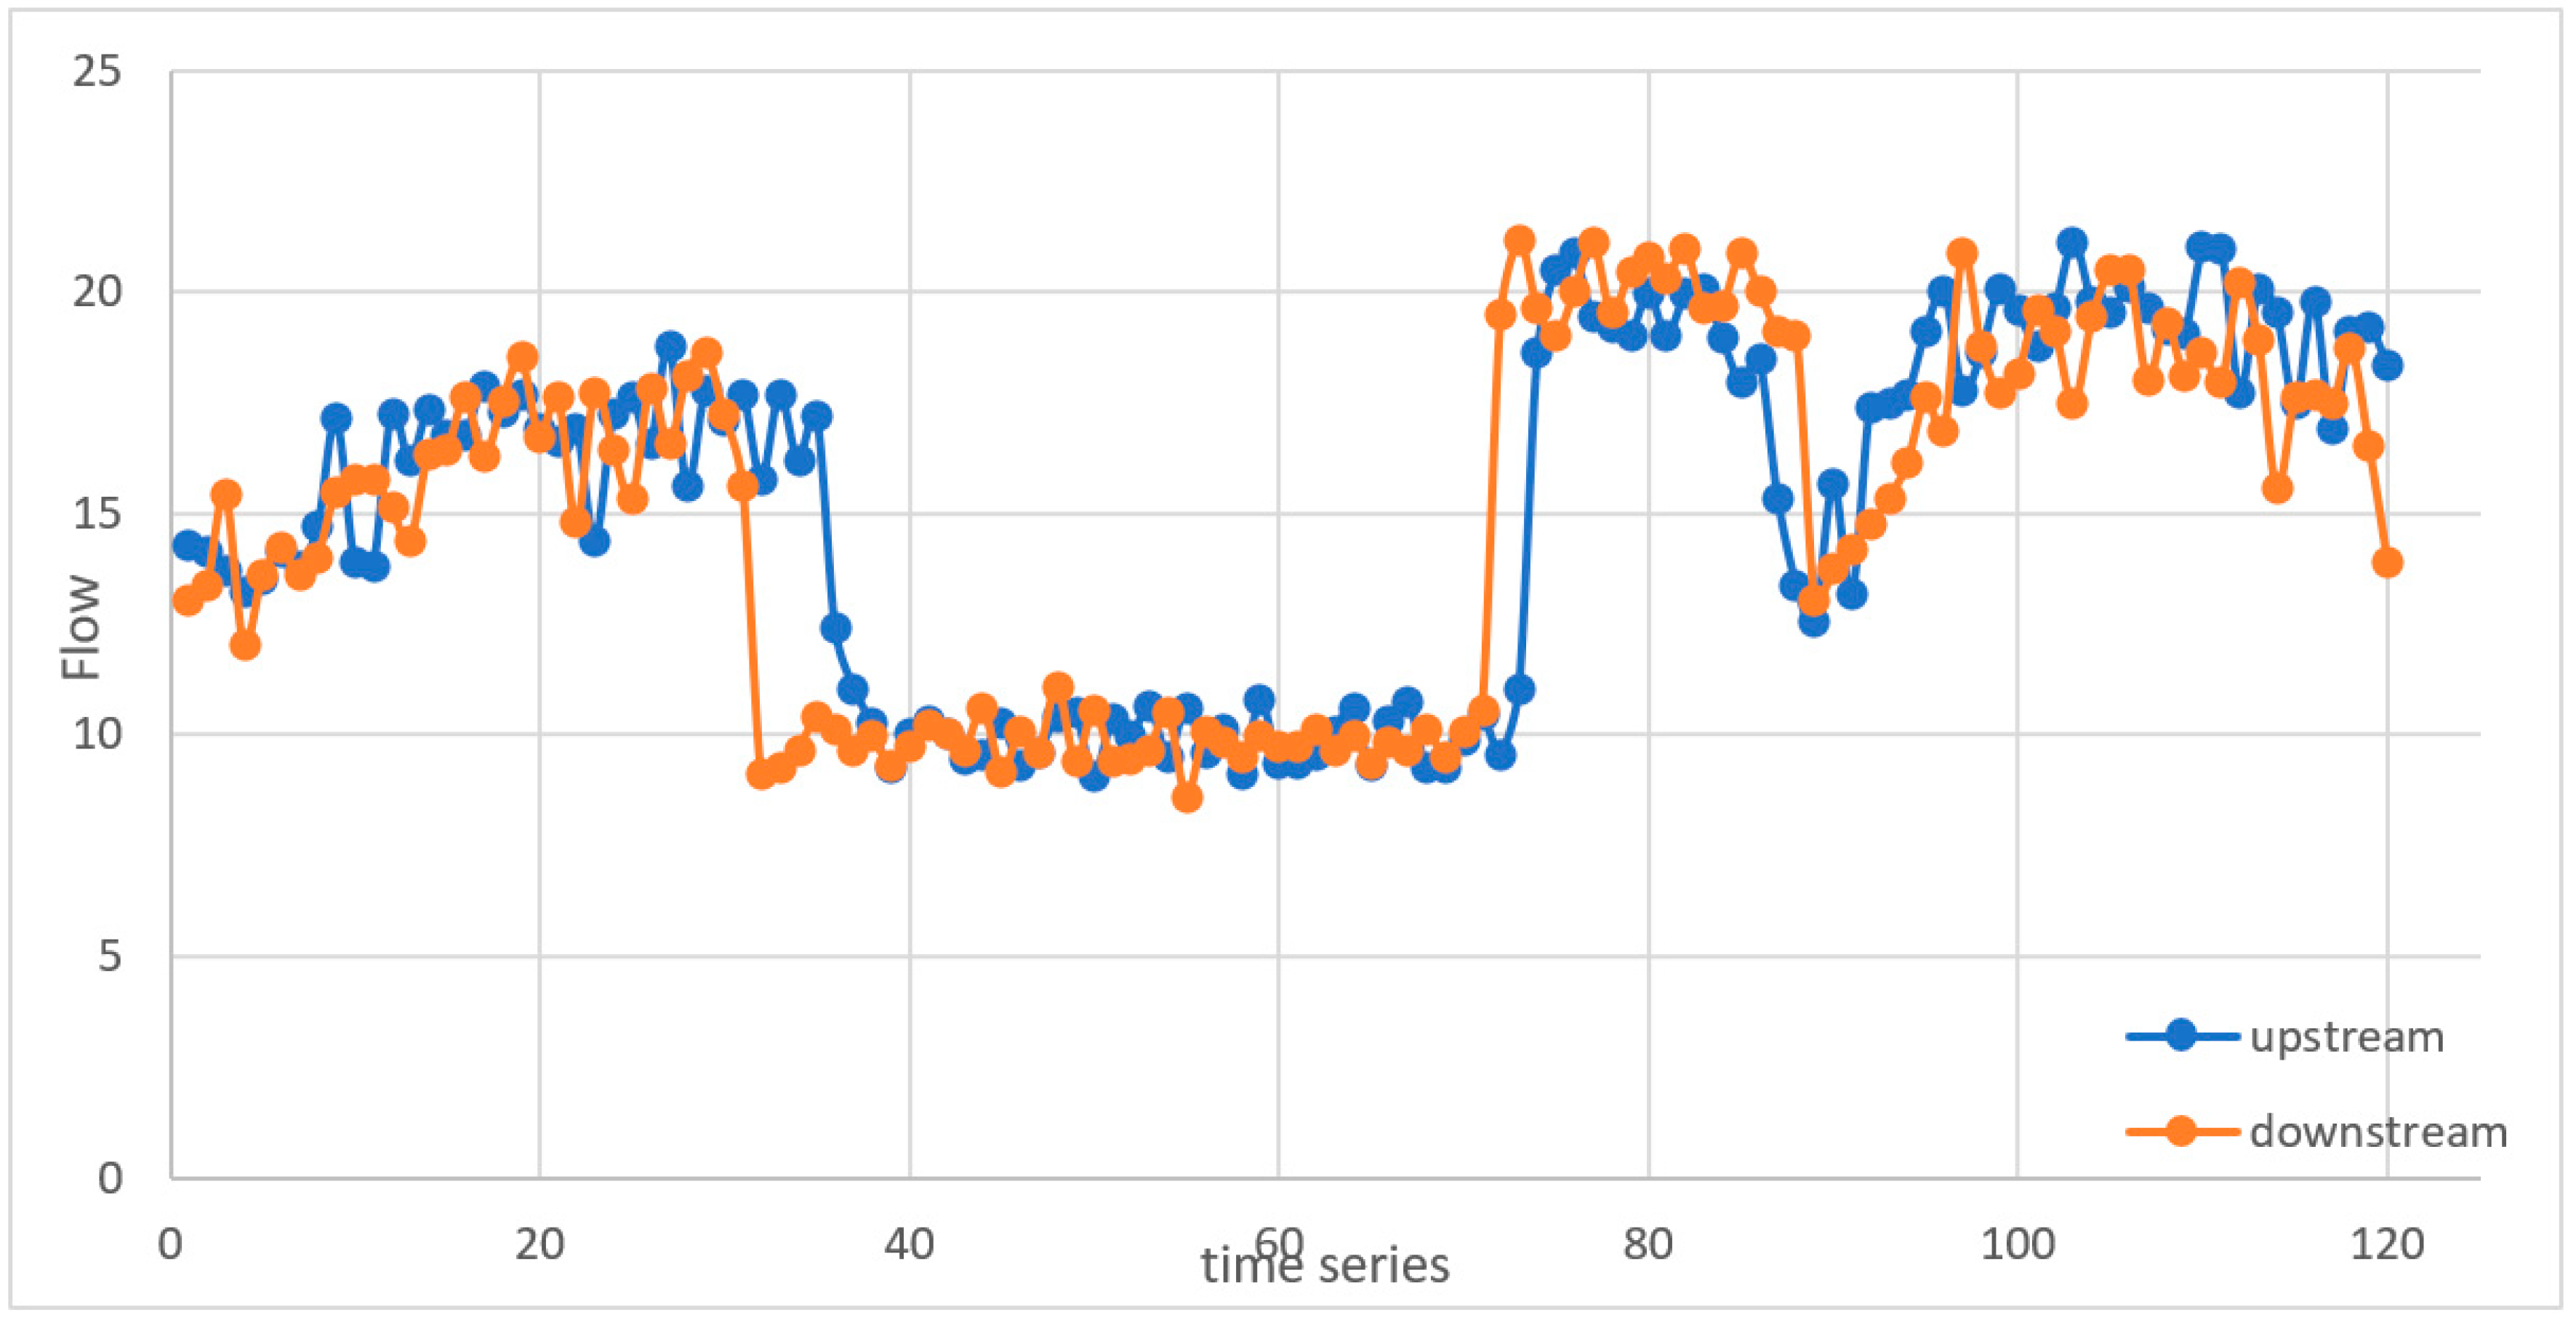
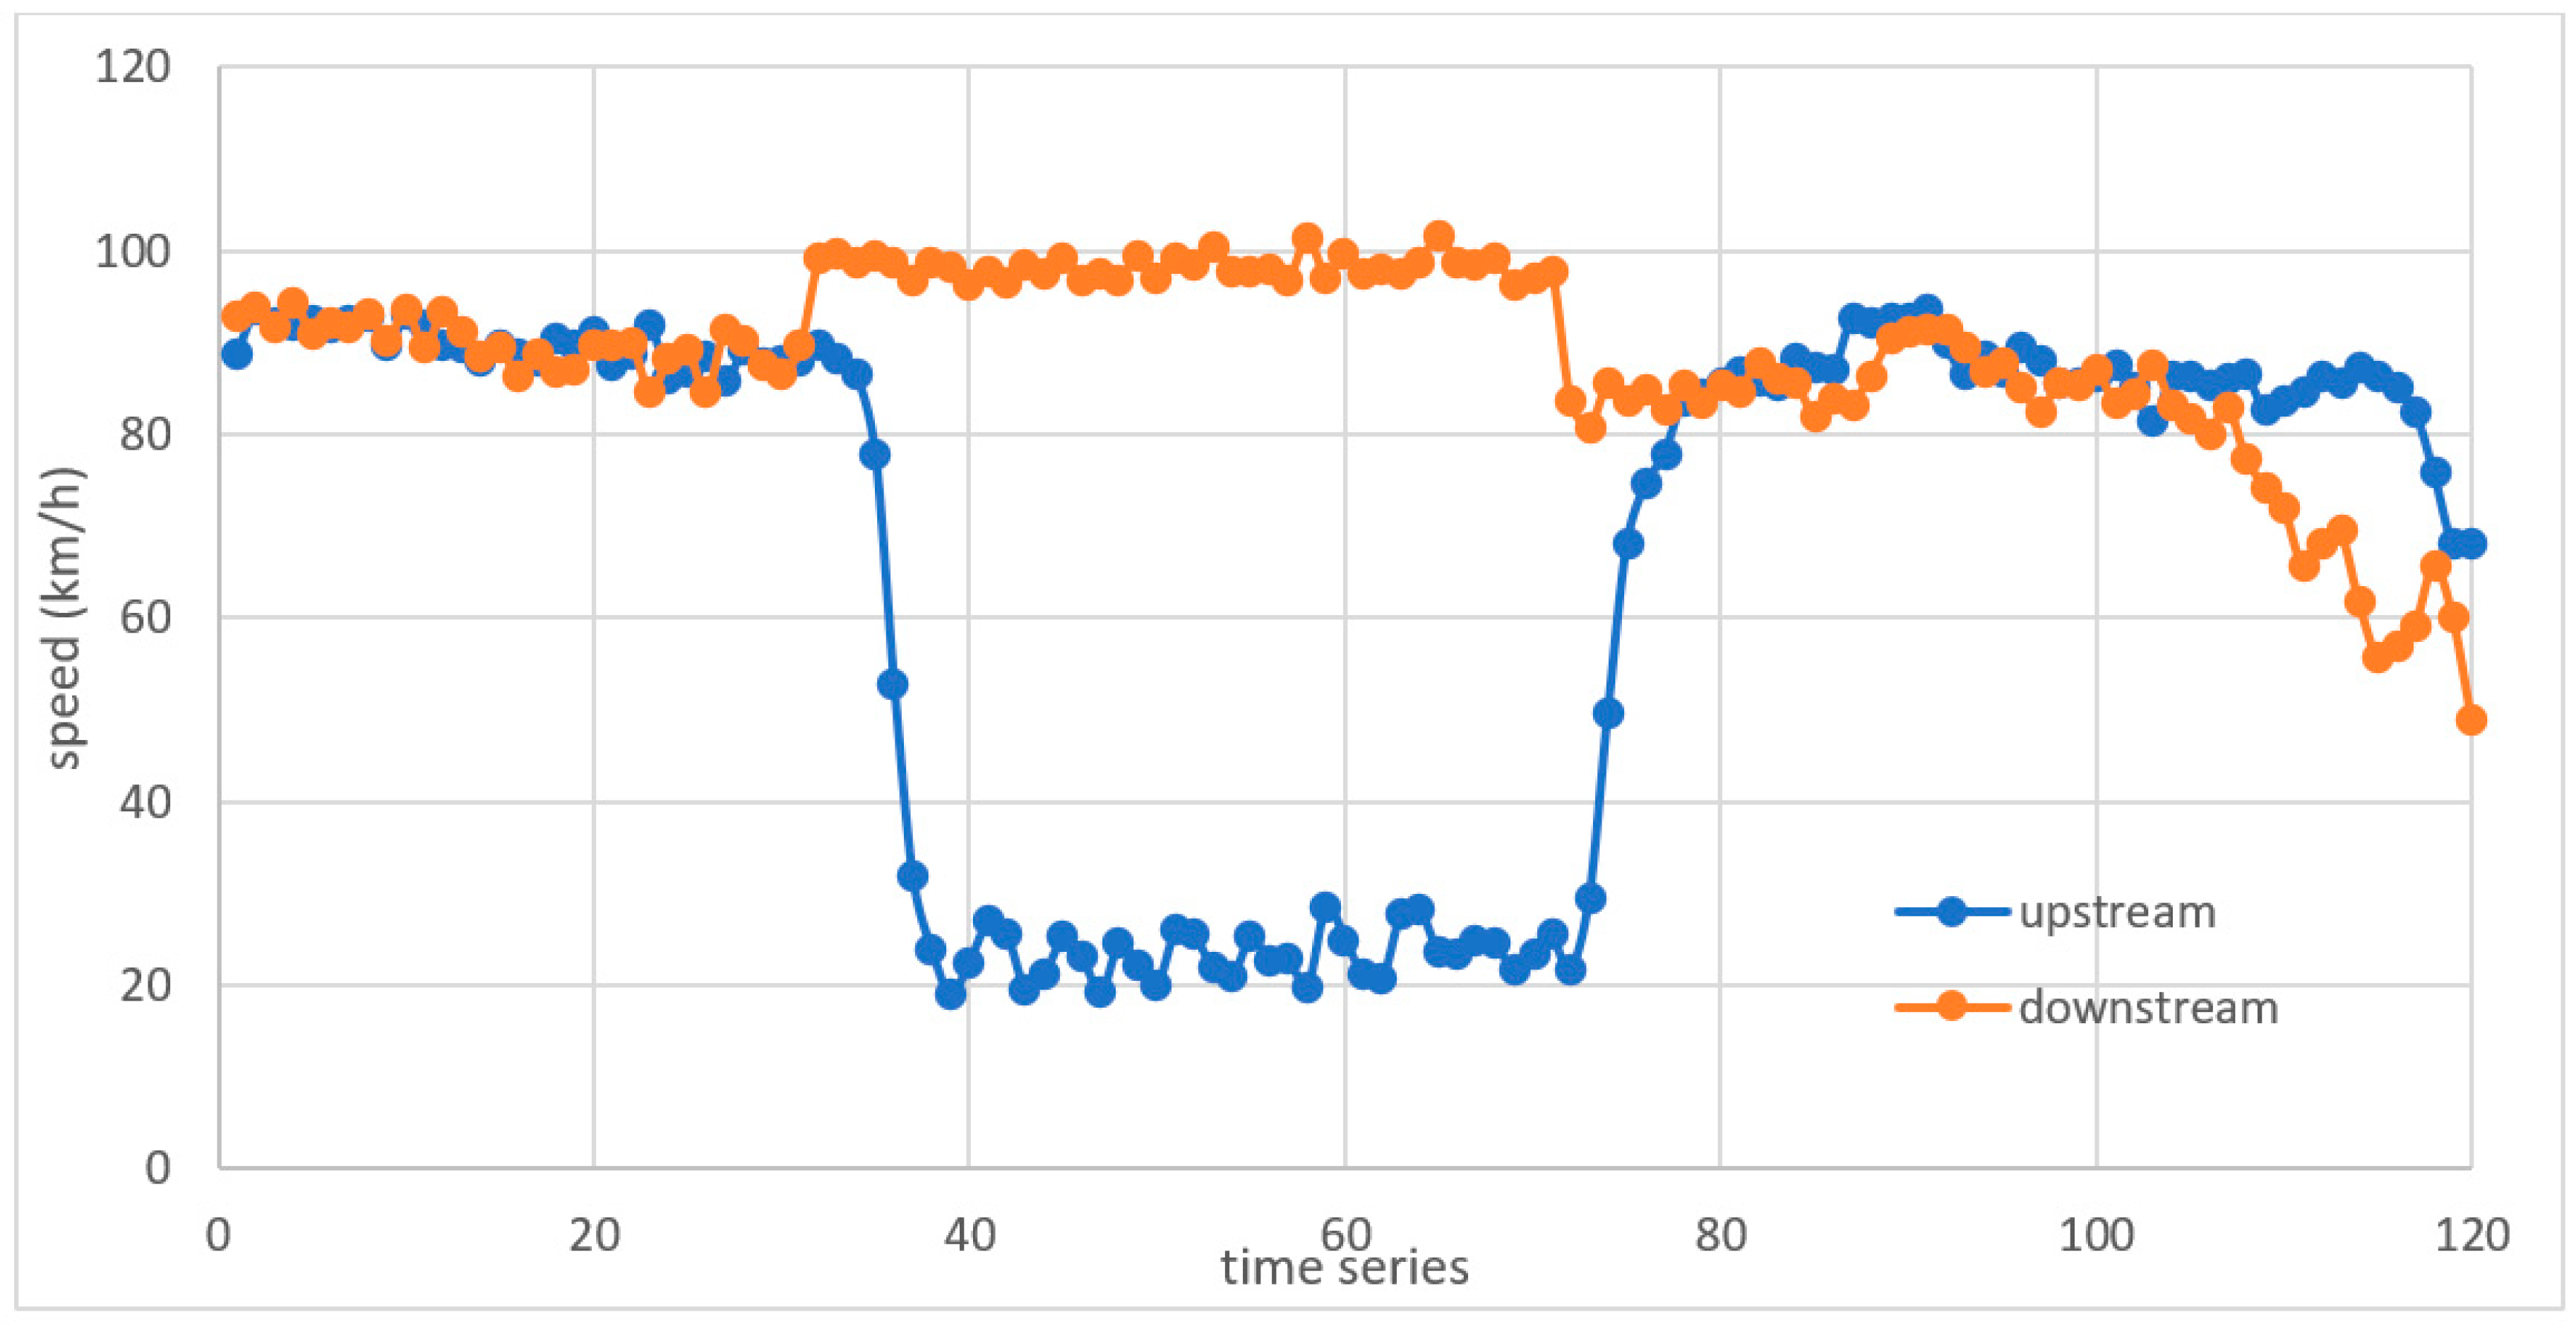
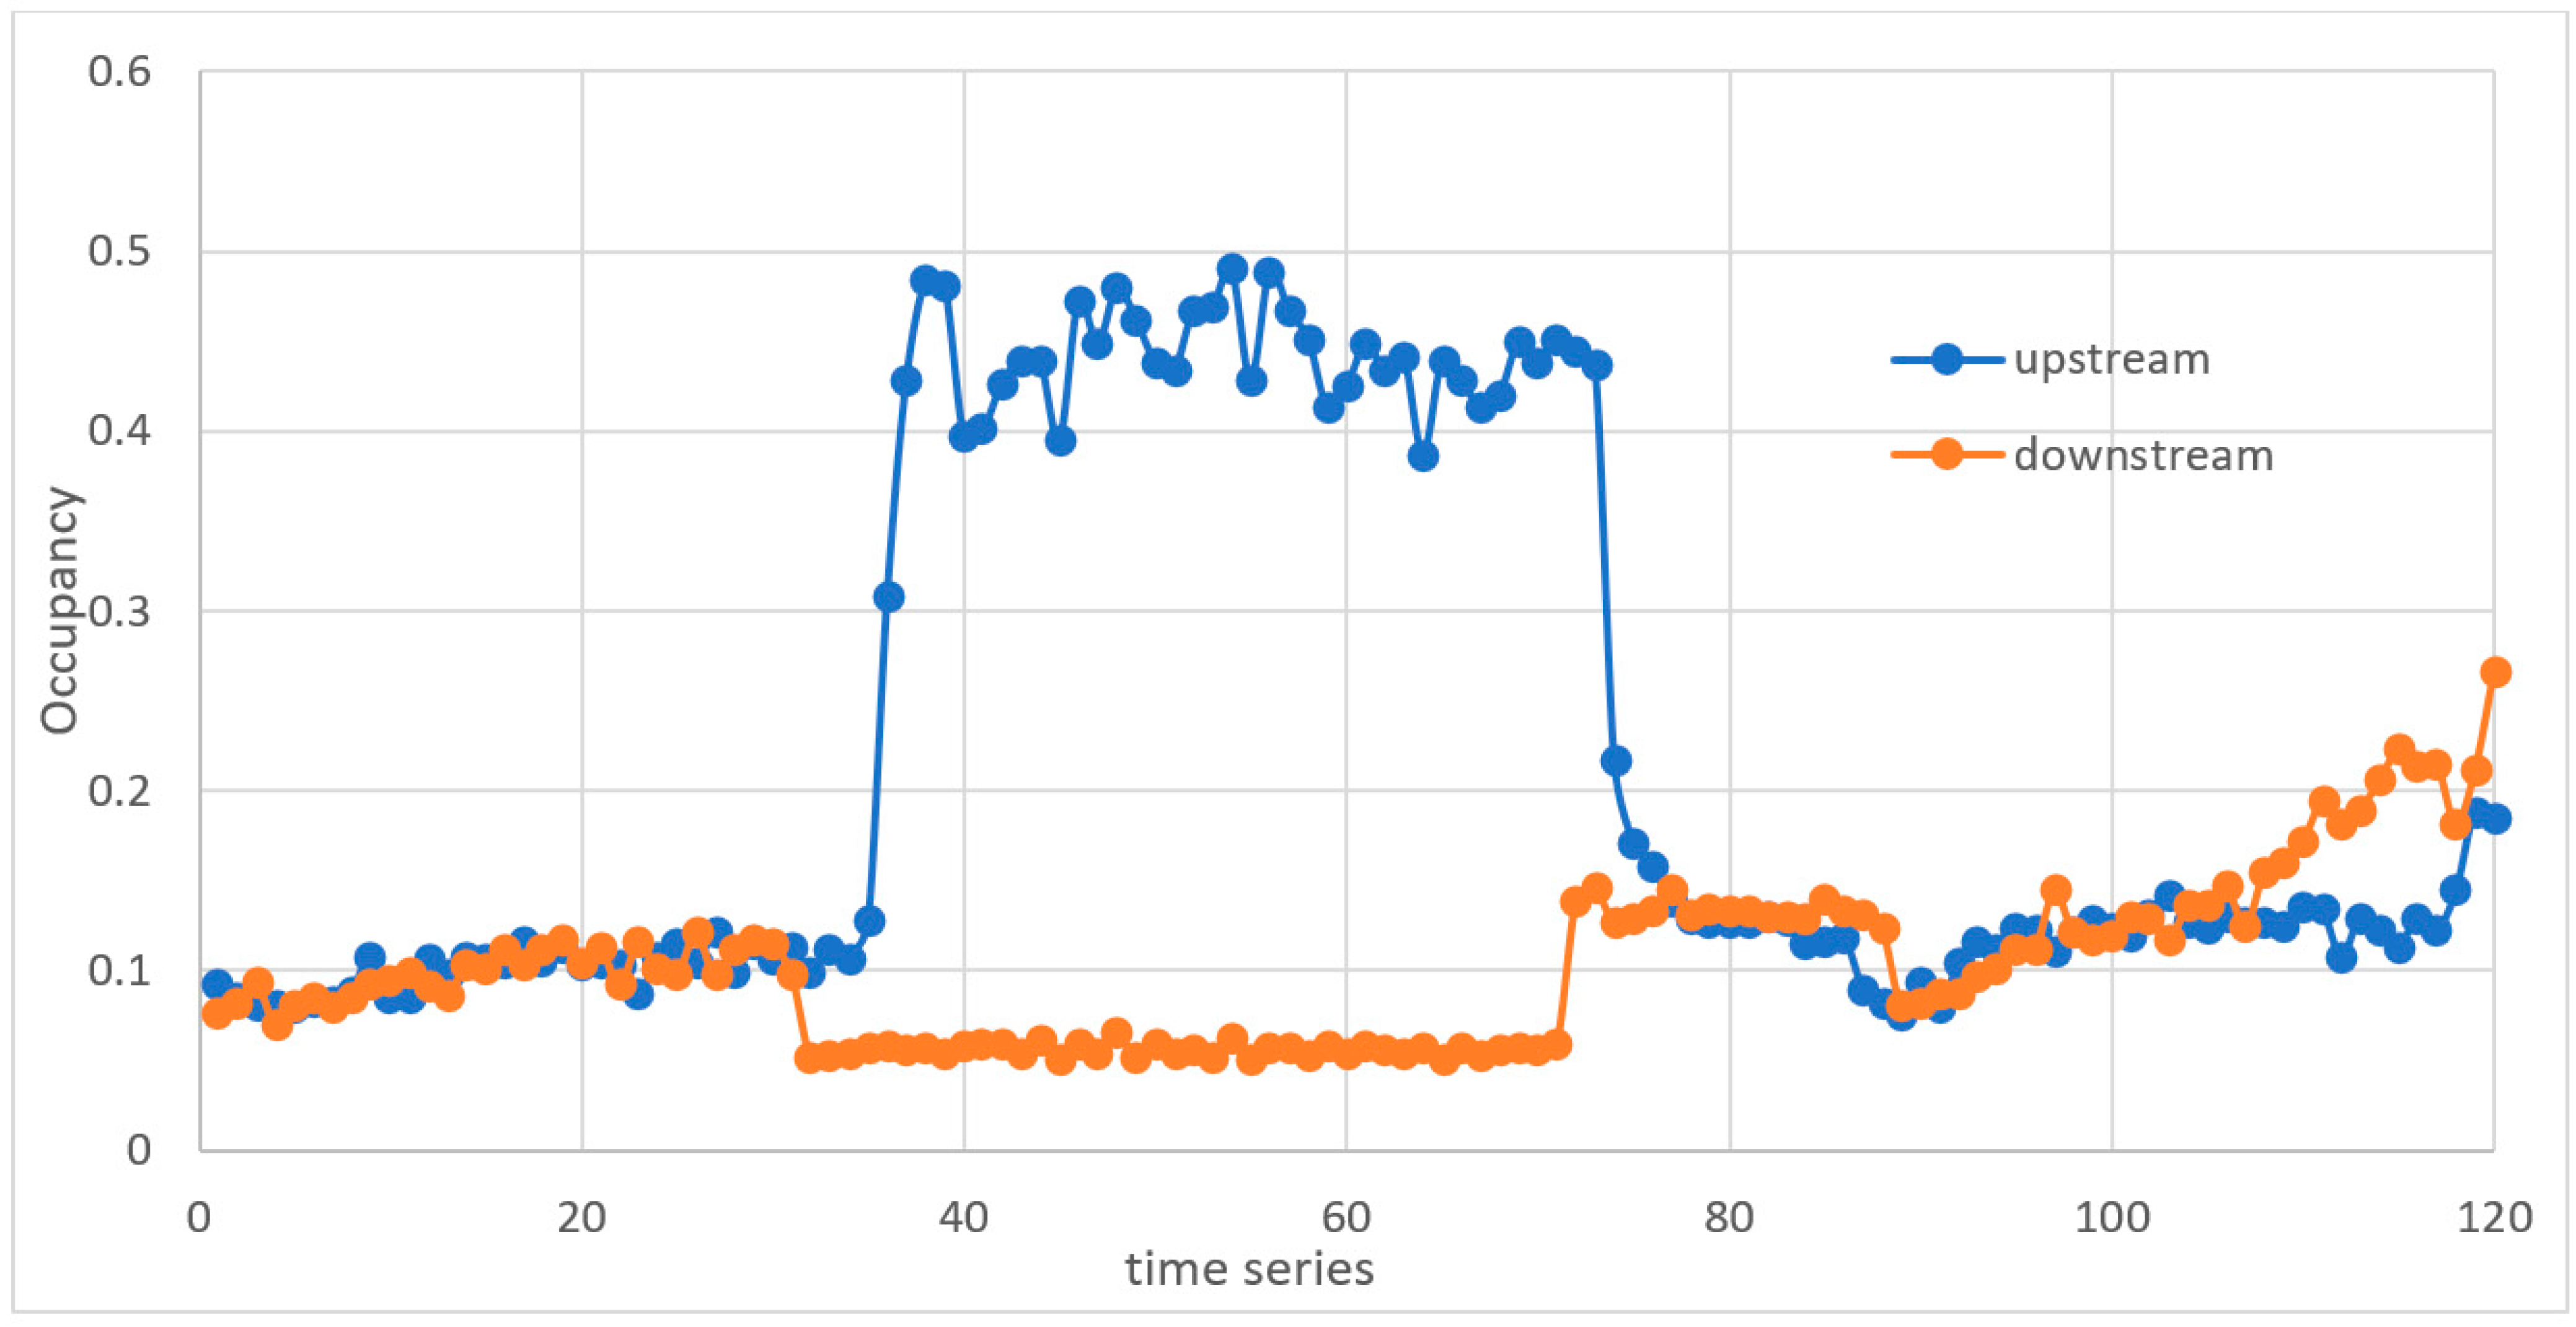
The combined effect of reducing the speed and flow will increase the occupancy rate of the detector in the upstream section [21,22]. On the other hand, the flow of the vehicles in the downstream section will decrease thus more gaps will be available. Based on that the speed of the vehicles will increase and the occupancy rate of the downstream detector will decrease. Thus, the occurrence of a traffic incident can disrupt the traffic and cause a significant difference between upstream and downstream traffic measures. Therefore, incident detection systems monitor traffic flow and any anomalies in traffic flow can be used as an indication of the existence of an incident. As an example of this, the authors are currently creating simulation data of the traffic parameters during normal conditions and incident conditions. Figure 3, Figure 4 and Figure 5 illustrate samples of the impact of the incident on the speed, the flow and the occupancy rate at upstream and downstream sections of the road. The trends in Figure 3, Figure 4 and Figure 5 show a similar pattern to the one discussed in Xie et al. [23].
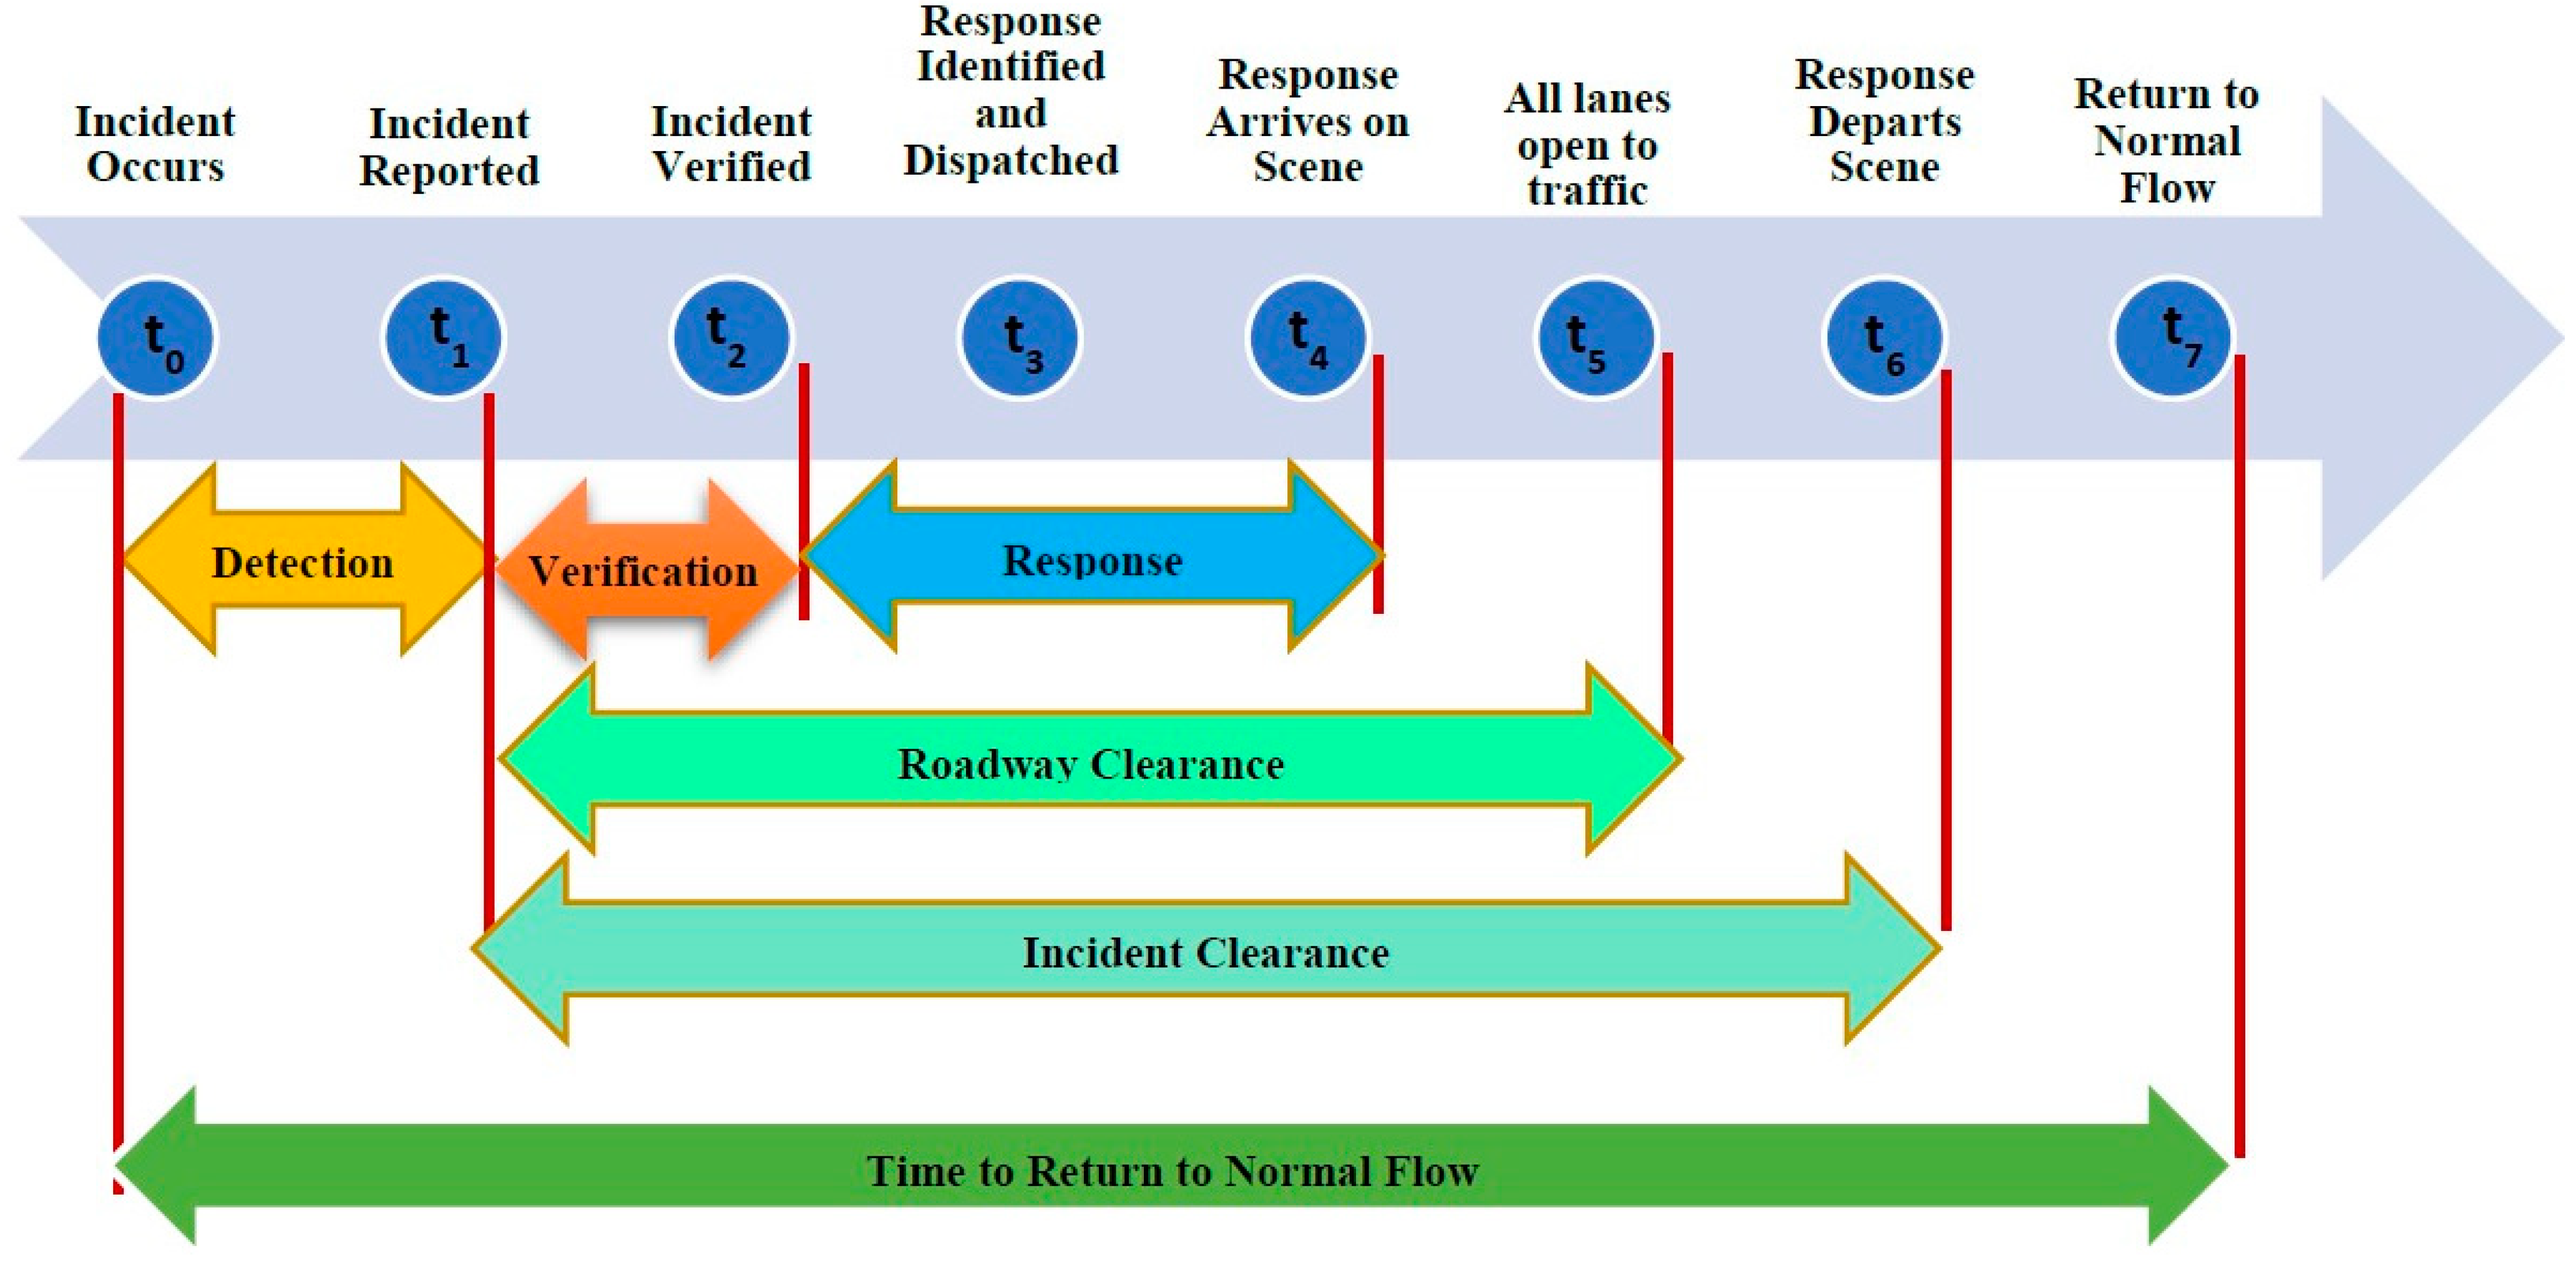
The primary goal of incident detection algorithms is to detect incidents as soon as possible since the impacts of the incident expand further when its duration increases [24]. The duration of the incident is defined as the time from the occurrence of the incident to the time of the clearance of the incident and restoring normal traffic conditions [25,26,27,28,29]. Figure 6 illustrates the timeline of the incident.
Some situations can disrupt traffic flow and exhibit incident-like patterns such as recurring bottlenecks during peak periods or equipment malfunction [19]. These situations can mislead the detection system and cause false alarms. On the other hand, sometimes the system may not detect some incidents due to different reasons, as will be discussed later in this paper.
Incident detection systems mainly consist of two modules: a data collection module and a data processing module [31]. The first module collects traffic data from the roads using several techniques such as inductive loop detectors, radars, surveillance cameras, probe vehicles, wireless magnetometers, GPS trackers or crash sensors [1,32,33,34,35]. The data collected in the first module are used as input to the second module, which processes and analyses the data to detect any deviation from normal traffic conditions. These deviations can be an indication of the existence of an incident. The most known systems are the Automatic Incident Detection (AID) systems because they are fast and robust systems. AID systems, as the name suggests, implement automated detection techniques. Incident alarms are automatically triggered if the collected traffic flow parameters, obtained from the first module, exceed certain thresholds or meet some predefined conditions. These thresholds and predefined conditions are decided based on historical data [31]. Usually, the performance of AID systems is assessed using three performance measures: Detection Rate (DR), False Alarm Rate (FAR) and Mean Time to Detect (MTTD) [36]. The Detection Rate (DR), also called the recall of the system, is the percentage of correctly detected incidents over a period and it is calculated using Equation (1).
DR = t o t a l   n u m b e r   o f   c o r r e c t l y   d e t e c t e d   i n c i d e n t s t o t a l   n u m b e r   o f   i n c i d e n t s   i n   t h e   d a t a s e t  
FAR measures the percentage of false alarms triggered because of incorrectly detected incidents and can be calculated using Equation (2).
FAR = n u m b e r   o f   f a l s e   a l a r m s t o t a l   n u m b e r   o f   a l a r m s  
The MTTD measures the average delay between the occurrence of an incident and its detection. The MTTD is calculated using Equation (3).
MTTD = i = 1 N d e t ( t d t i n c ) N d e t × 100 %
where:
N d e t = the number of incidents detected;
td = the time at which the incident is detected;
and tinc = the time at which the incident occurred.
These three measures are commonly applied to evaluate the effectiveness and efficiency of AID systems. However, the three measures depend on each other. Thus, when developing an AID system, high DR and short MTTD are desirable to be able to detect the majority of incidents as quickly as possible with a minimum rate of false alarms. In addition, increasing the DR may increase the FAR, which is not desirable. Accordingly, trade-offs between the three measures must be made to have satisfactory DR and MTTD with an acceptable FAR. One of the possible solutions to such situations is the persistence test, which is usually applied to decrease FAR by triggering incident alarms only if the incident patterns occurred and continued for a number of successive intervals [37].
AID systems can be classified based on the techniques used to collect traffic information into fixed-based systems and probe-based systems [31]. Alternatively, they can be classified according to the data processing and incident detection algorithms, which is the most common classification method used by researchers. Although some researchers may disagree on the categories and their numbers. The most common categories are comparative, statistical, artificial intelligence-based algorithms and video–image processing algorithms. The features, techniques, advantages and limitations of each category are discussed in Section 3 of this paper.

1.2. Objectives

The purpose of this study is to evaluate existing AID systems and their corresponding data collection and data processing algorithms. Accordingly, a thorough literature review is conducted to identify and investigate their strengths and limitations. Hence, recommendations for improving and developing effective AID systems are presented. The motivations of this study are:
  • Understand the application of AID systems to curb the negative impacts of incidents and increase safety on the roads;
  • Investigate the advantages, challenges and concerns of the existing AID systems and identify solutions to improve them;
  • Investigate the feasibility of applying new emerging technologies such as connected vehicles, Artificial Intelligence (AI) and Machine Learning (ML) in developing AID systems.
This paper provides a comprehensive discussion on this topic that can be of significant help to the researchers and practitioners who are interested in this topic.

1.3. Organization of the Paper

  • The first section provides the background and the objectives of the study;
  • The second section discusses the methodology adopted in this study to evaluate existing AID systems;
  • The third section summarizes the previous studies related to incident detection systems and evaluates their strengths and drawbacks;
  • The fourth section provides the conclusions and the critical findings of the paper;
  • The fifth section presents the recommendations of the paper and proposes some directions for future research.

2. Research Methodology

The methodology adopted in this paper is a systematic literature review and it consists of four stages according to PRISMA guidelines. The first stage is the identification of the research scope. In this paper, the scope is limited to traffic incident detection systems. Then, the databases and the search keywords are selected carefully to yield papers related to the scope of this research. In this paper, the Scopus database and Google Scholar were used to search for relevant studies. For the search keywords, three keywords were used mainly, which are: Traffic Incident Detection Algorithm, Automatic Traffic Incident Detection and Incident Management. Accordingly, a search string is designed and entered in the search box of the databases. The designed search string is a combination of keywords and Boolean operators and it was designed as follows:
“automatic” AND “traffic” AND “incident” AND “detection”.
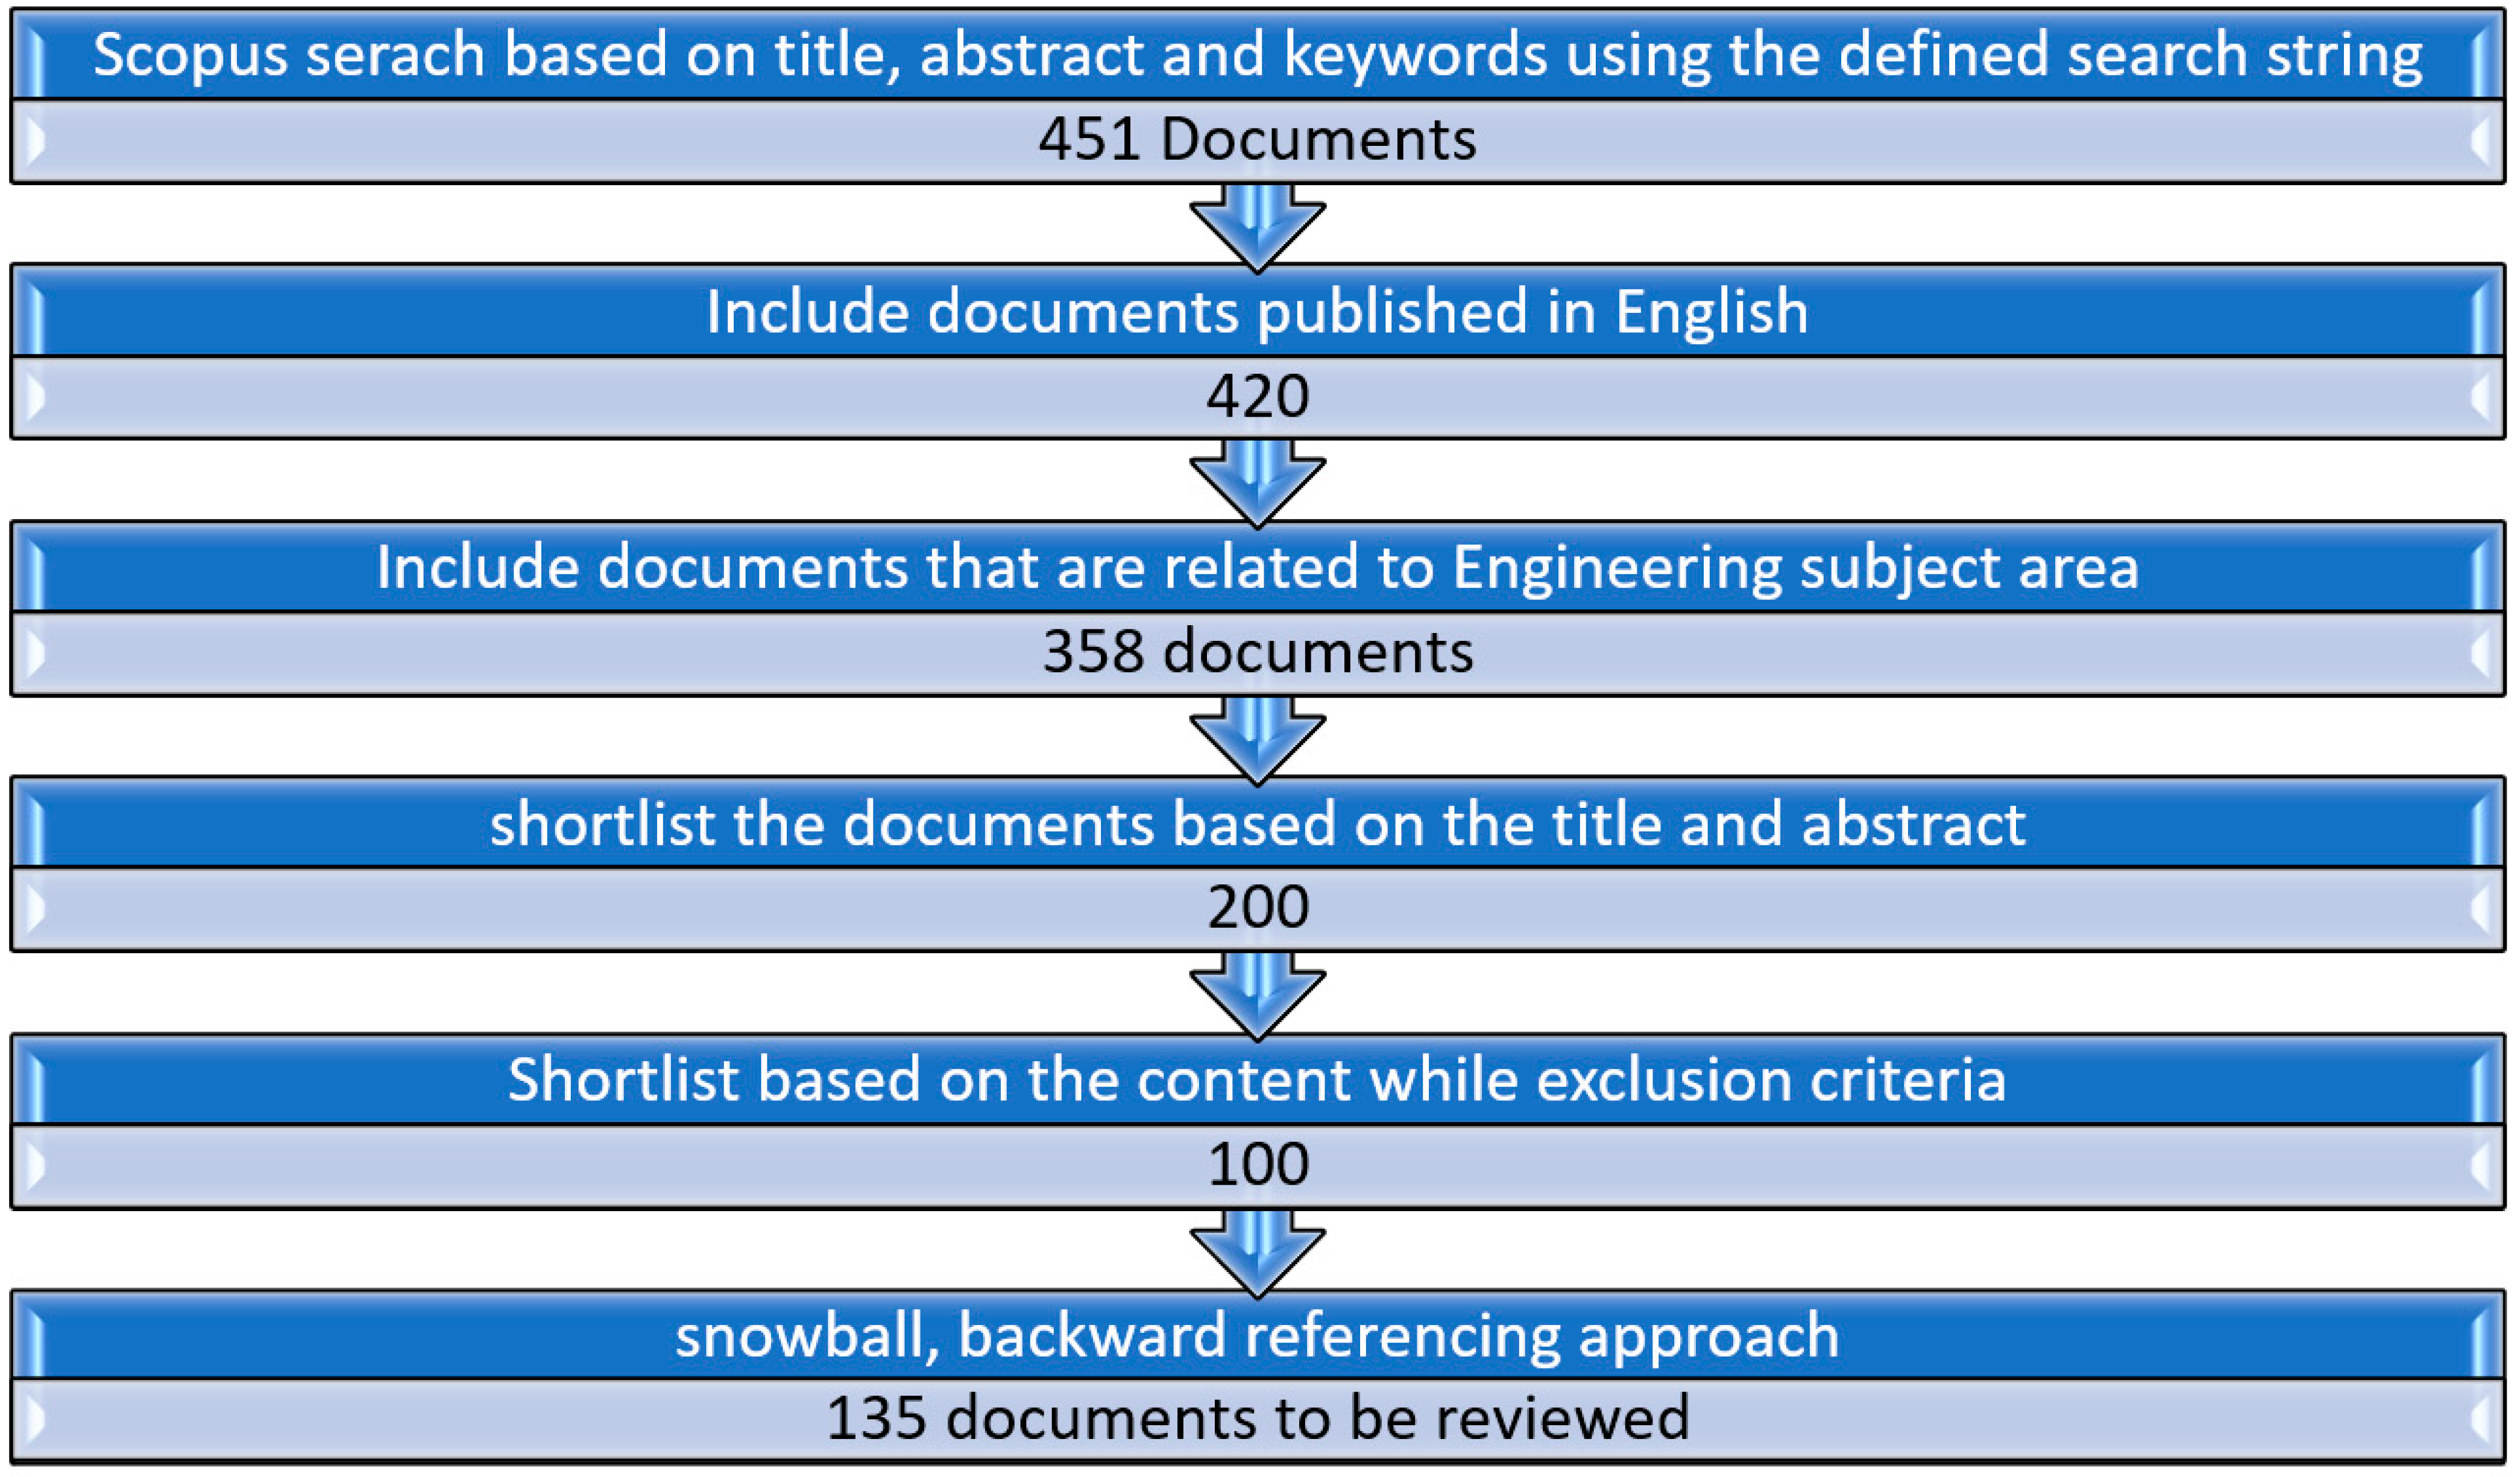
By entering the search string in the search box of the Scopus database, a number of journal articles, conference papers, reports and theses were generated. If the full text of the resource could not be obtained directly from Scopus then Google Scholar search results were used to obtain the full text of this resource. The second stage is the screening of these resources by setting inclusion and exclusion criteria. Resources written in English and published from 1970 to 2022 were included. Some resources were excluded because the full text of the article cannot be found, or it has restricted access. Additionally, the duplicates between the two databases were removed. In the third stage, the eligibility of the collected resources was analyzed. This was achieved by reading and evaluating the abstracts of the collected resources to decide if it was relevant to the scope of this study or not. If it was not related to the scope, the paper was discarded and if it was relevant, the full paper was read to determine the main contributions of each paper and to consider other eligible papers and references from the bibliography of the paper in a snowball, backward referencing approach. The final stage of this methodology was data synthesis and analysis. In this stage, the papers that were collected were classified according to the date of publication, the technique used to collect the traffic data and the data processing and incident detection algorithms. The selected papers were categorized into four categories: comparative, statistical, artificial intelligence-based algorithms and video–image processing algorithms. Some resources did not fit into any of the four categories thus they were removed. Following these stages is beneficial to achieve the purpose of this study; to provide a comprehensive overview of the several types of AID systems and evaluate their strengths and weaknesses. Accordingly, the authors developed some recommendations that future research should focus on to develop efficient and reliable AID systems.
Figure 7 summarizes the selection process of the relevant publications and the screening and filtering rounds of the collected references.

2.1. Descriptive Analysis and Initial Data Statistics

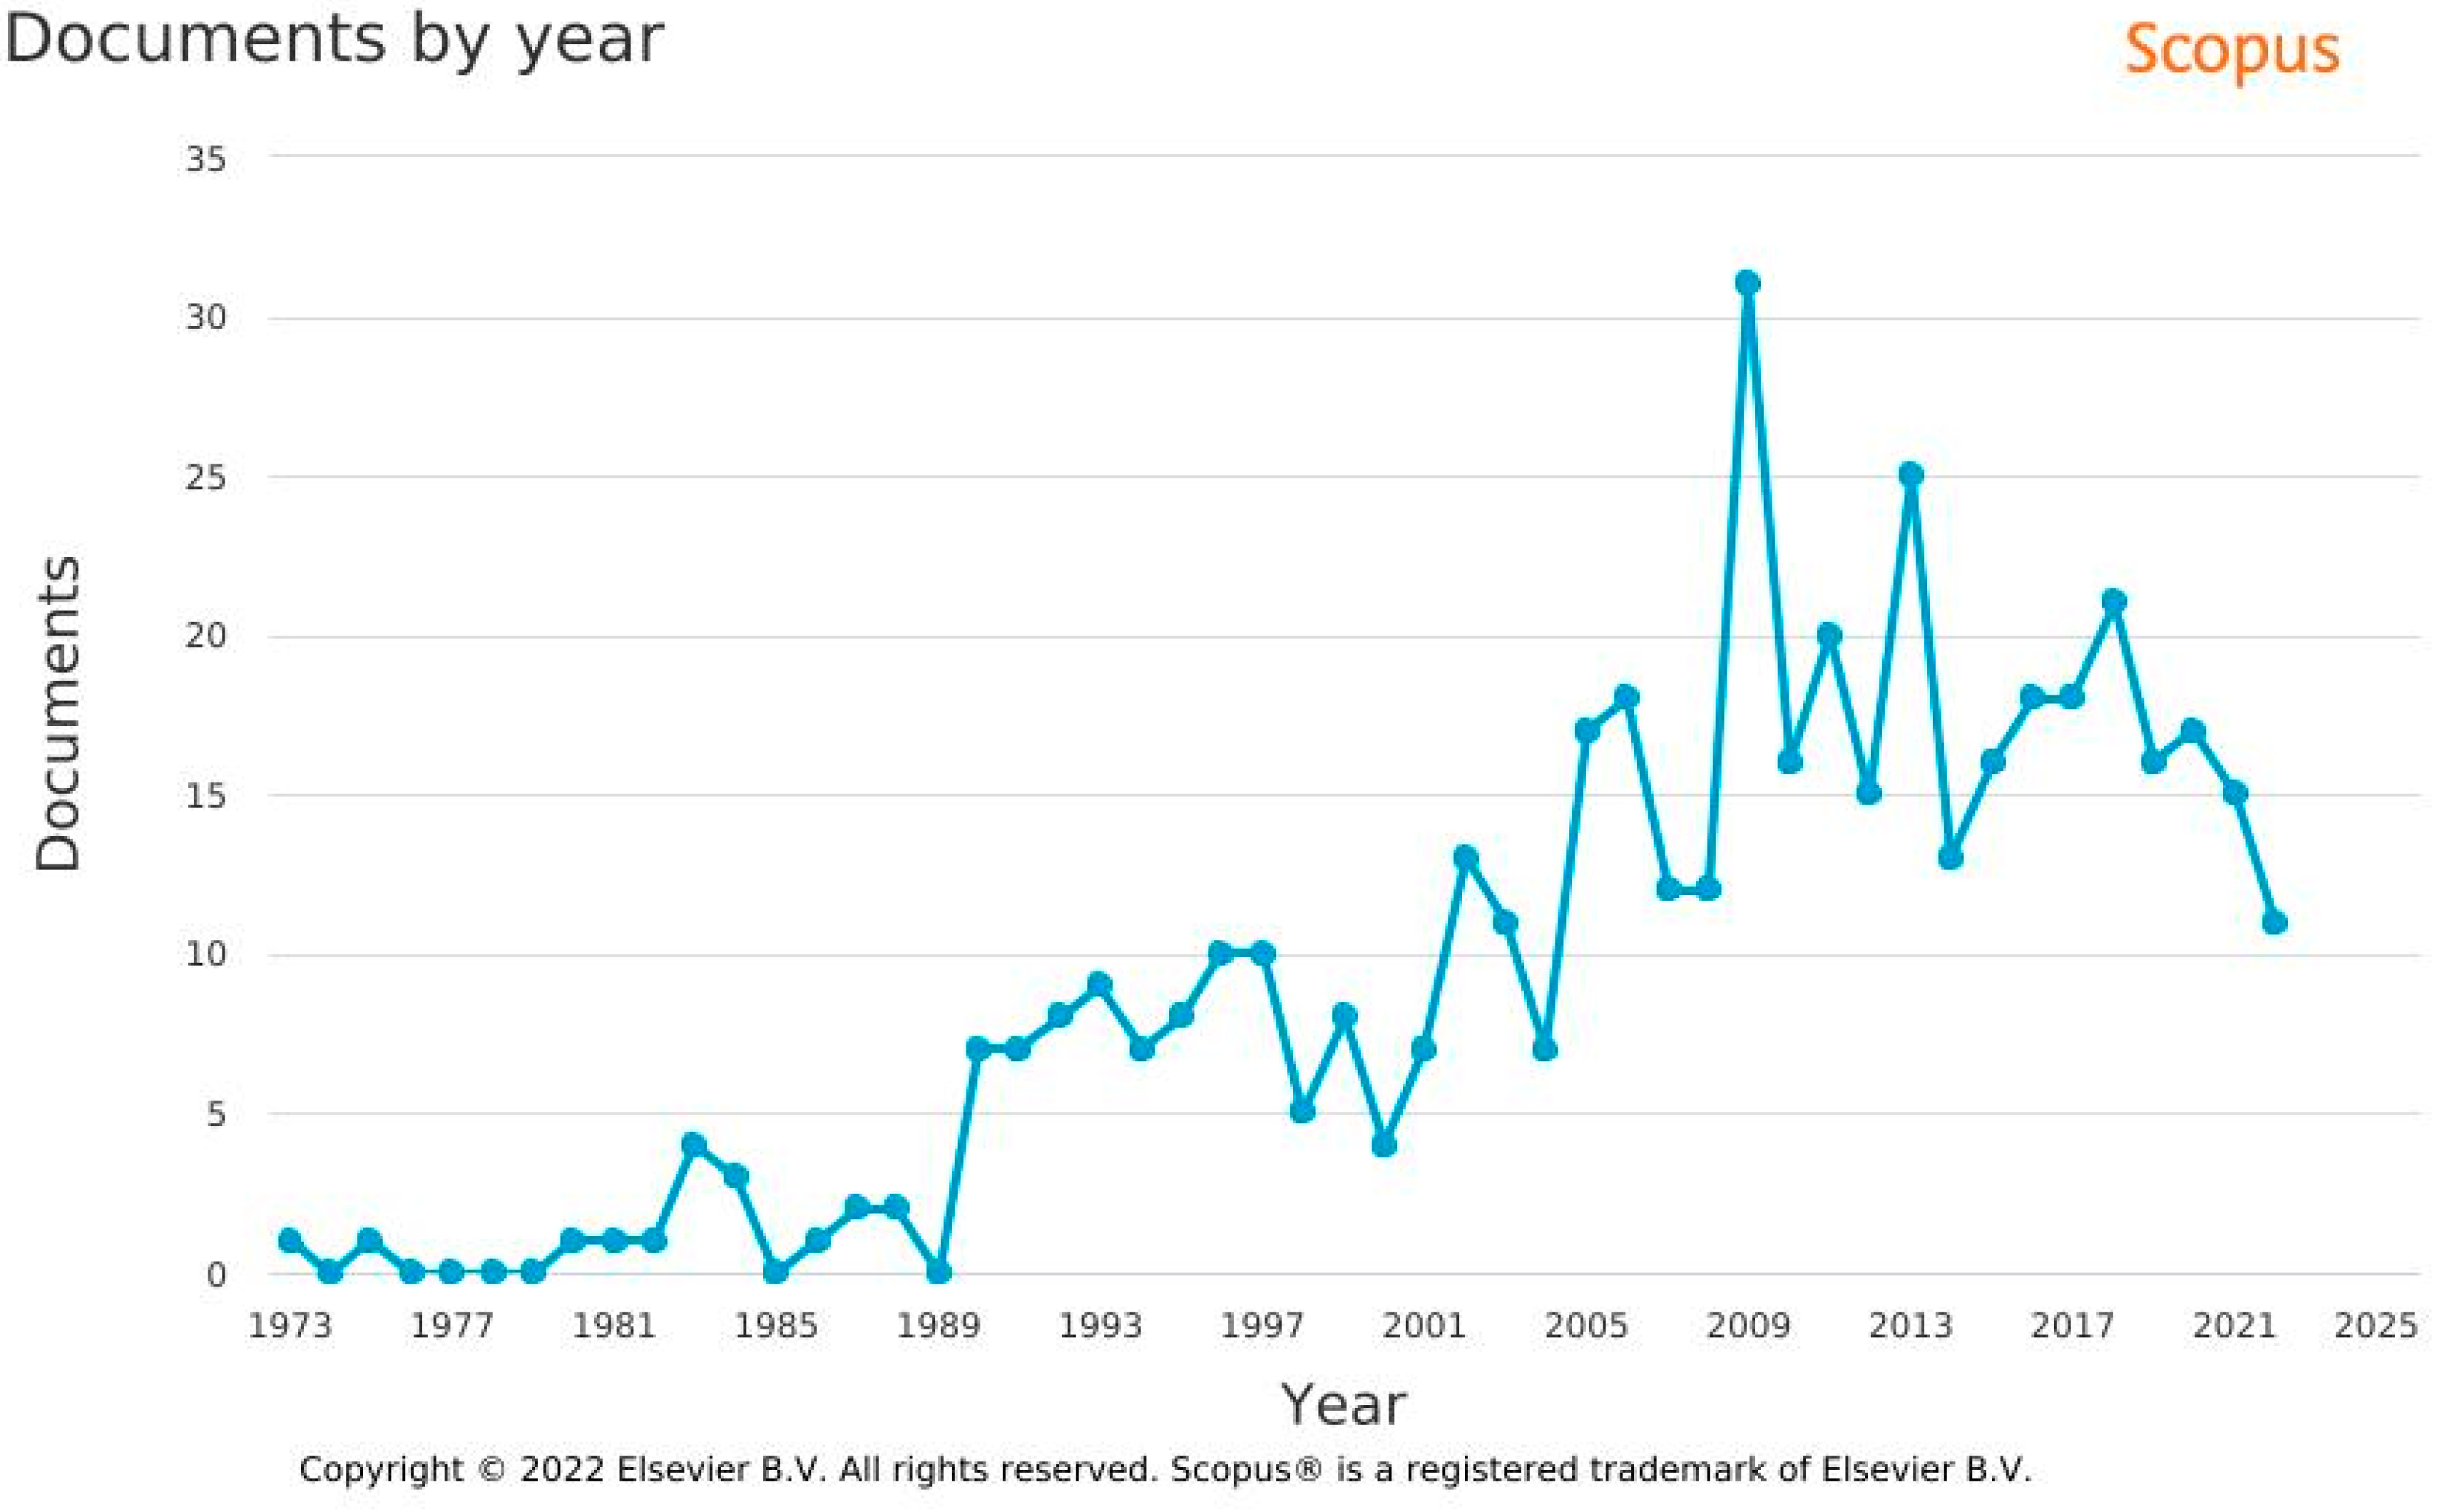
Developing AID systems has been the focus of research since 1970 until now and this topic has witnessed significant growth over this period. Figure 8 shows the evolution of this topic by providing a year-wise publication trend over this period.
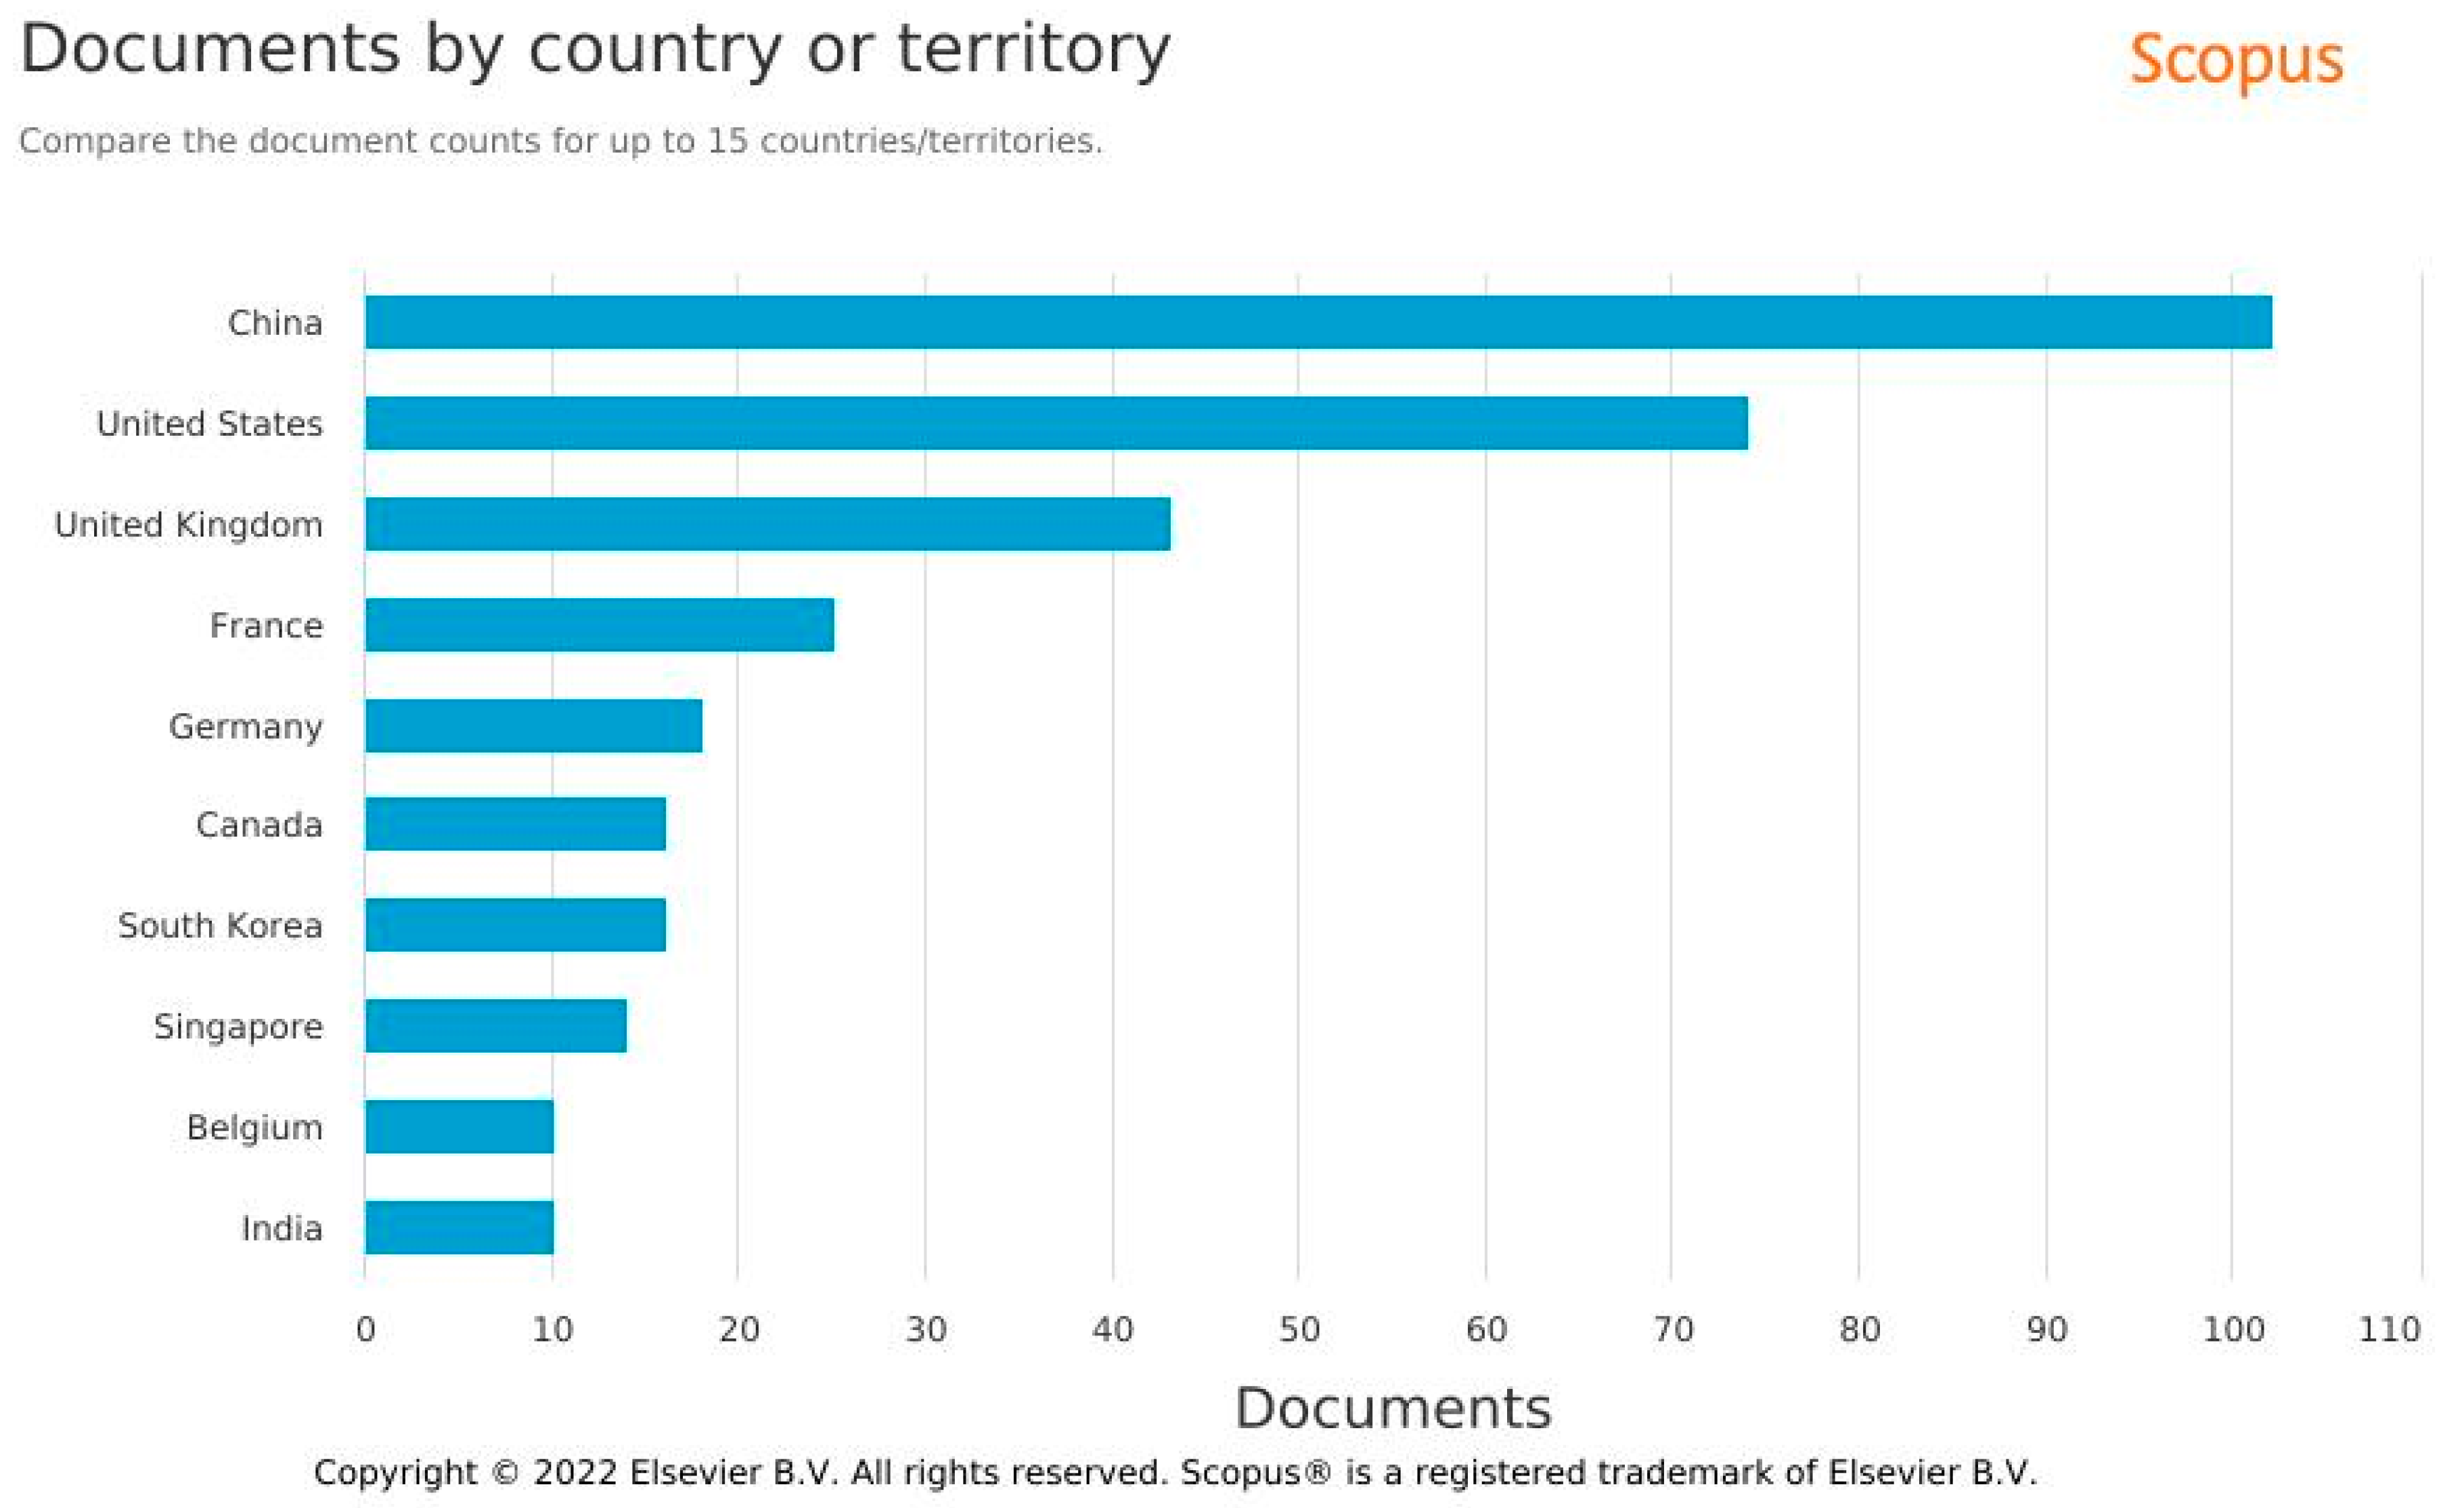
The figure shows that the number of publications started to increase from 1970 until it reached its peak in 2009. After that, it declined and kept fluctuating between 2010 and 2022. Moreover, the top 10 countries in producing documents in this area are illustrated in Figure 9. The figure showed that China is the leading country in the number of published documents followed by the USA.

3. Literature Review

This section provides an overview of AID systems that have been developed since 1970 till the present. For the purpose of this paper, the AID systems are categorized based on the incident detection algorithms into four categories. The features, strengths and limitations of each category are evaluated in the next sub-sections.

3.1. Comparative (Pattern Recognition) Algorithms

The comparative algorithms have predefined thresholds that represent normal traffic conditions. The collected traffic flow parameters (i.e., speed, occupancy and/or flow) are compared against these thresholds. If there are significant deviations from these thresholds, incident alarms are triggered [31,38]. This category includes the California algorithm [16], which is the first and the most known algorithm in this category, the Pattern Recognition (PATREG) algorithm [39], the All Purpose Incident Detection (APID) algorithm [40] and many other algorithms.
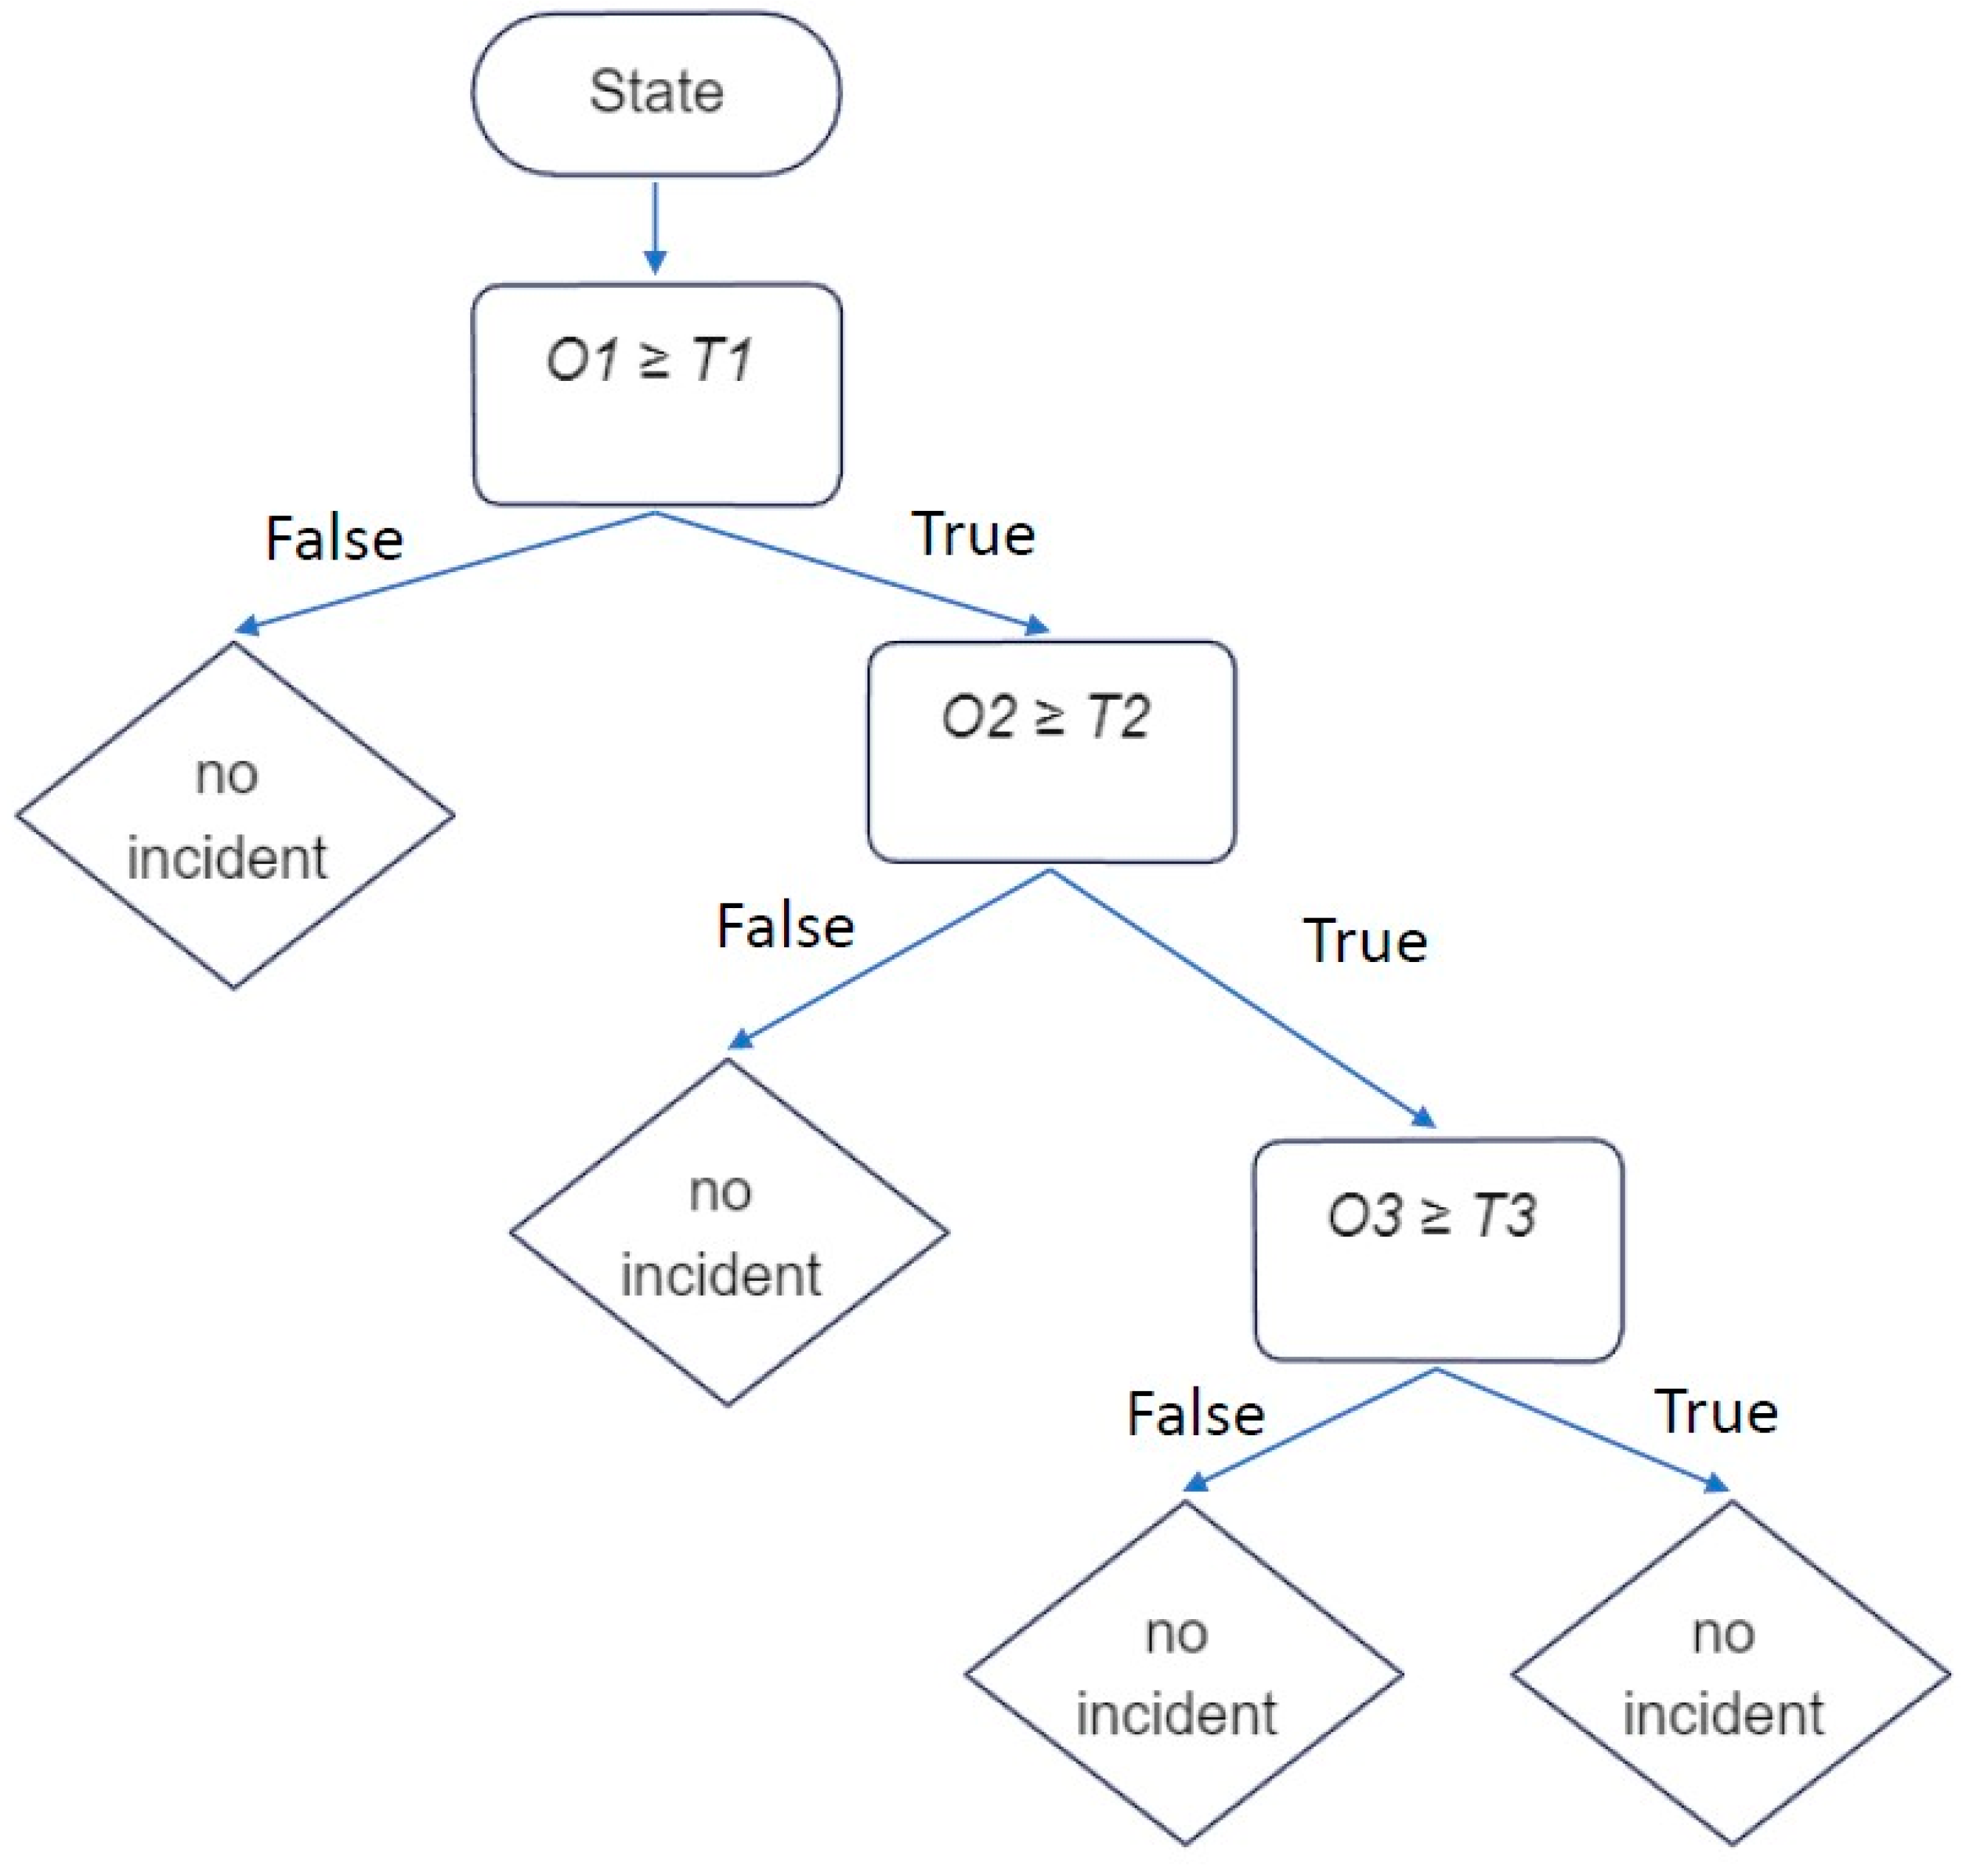
The California algorithm, also known as the Traffic Services Corporation (TSC) algorithm, is one of the pioneering algorithms and one of the most known comparative algorithms. It is based on the concept that the occurrence of traffic incidents significantly increases the occupancy in the upstream section of the road while decreasing the occupancy in the downstream section of the road. Thus, it uses the occupancy measured from two adjacent fixed detectors. Three tests are applied to the measured occupancies by the two detectors and if the values from the three tests surpass predefined thresholds, an alarm of incidents is set off [38,41]. Figure 10 illustrates the scheme of this algorithm.
Here, O1 is the difference between the occupancy of the upstream detector and the occupancy of the downstream detector; O2 is the relative difference between the occupancy of the upstream detector and the occupancy of the downstream detector; O3 is the temporal difference in downstream occupancy; T1, T2 and T3 are the test thresholds [42].
One of the major drawbacks and limitations of this algorithm is that it depends on the readings of the fixed detectors. Thus, the performance of this algorithm will be significantly affected by any breakdowns or defects in the detectors. In addition, the predefined thresholds are determined based on historical data of normal traffic and incident conditions, which may vary from one location to another. Additionally, the algorithm requires extensive calculations [43]. Moreover, in some situations, the traffic might exhibit incident-like patterns even though there is no incident such as the presence of ramps, grade changes or lane drops between detector stations [44]. These situations may cause false alarms and thus impact the performance of the algorithm. The algorithm has a good DR and acceptable FAR but these are achieved at a cost of delays in detecting the occurrence of incidents and a high MTTD that can reach up to 4 min [44]. Payne and Tignor modified the original algorithm to overcome some of its limitations and improve its performance. Based on that, 10 algorithms were developed out of it such as California algorithm #7 and California algorithm #8, which were proved to have the best performance [16,45]. Guo et al. modified the original California algorithm to be able to detect traffic incidents in urban areas instead of freeways [46]. Since traffic flow in urban roads is discontinuous and varies with time unlike freeways, which have stable and continuous traffic flow, they suggested using dynamic thresholds, derived from iterative formulas, instead of constant predefined thresholds.
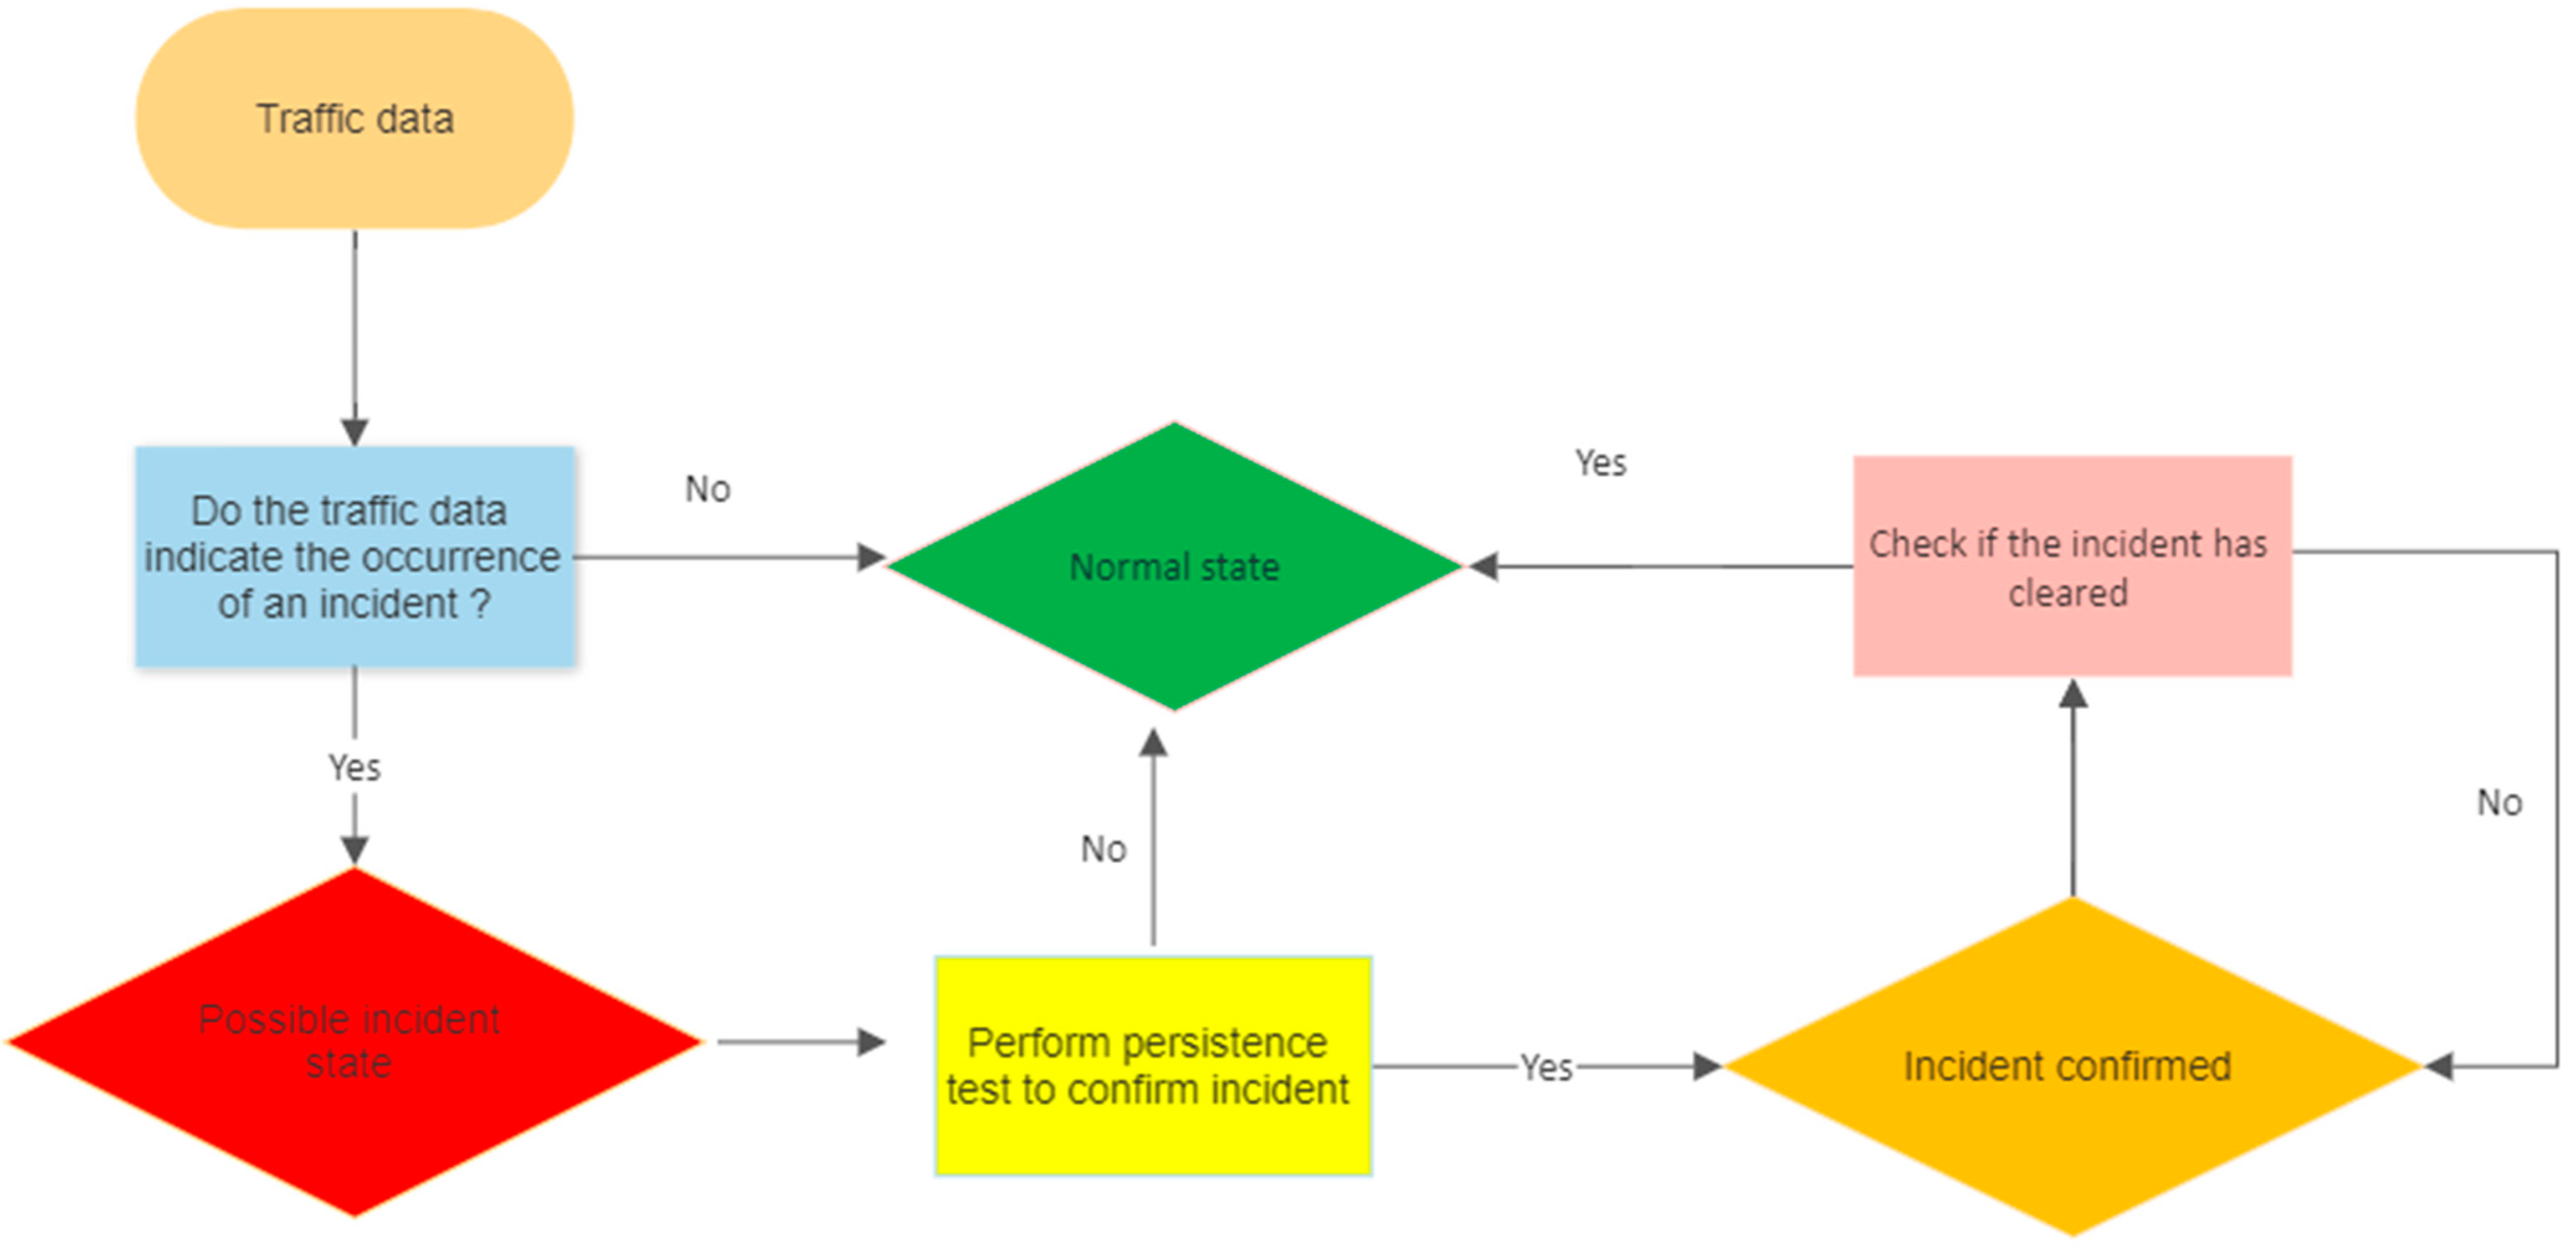
APID algorithm was developed as a component of the COMPASS software, which was designed to be implemented in the traffic management center in Toronto, Canada [40]. This algorithm integrates the elements of the California algorithm and expands it to consider different traffic conditions since it has incident detection algorithms for heavy, medium and low traffic conditions plus an incident termination detection routine, a routine to search for the presence of compression waves and persistence of incident condition testing routine [31,41]. Figure 11 illustrates the scheme of the APID algorithm.
Moreover, the McMaster algorithm was developed to overcome some of the limitations of the California algorithm [47,48]. Instead of using occupancy only as the input parameter, this algorithm considers the flow, occupancy, and speed from a single station as input parameters. The detection algorithm analyzes the changes in three parameters simultaneously. If a sudden and sharp change in one of the three variables is observed, while the change in the remaining variables is smooth and continuous, this can indicate the occurrence of an incident [48]. The algorithm utilizes historical data of normal and incident conditions to develop flow–occupancy–speed charts and sets boundaries between the normal and incident conditions. If the observed traffic parameters exceed the normal condition threshold for consecutive periods, an alarm is triggered to indicate the occurrence of an incident. Using the three parameters together instead of using the occupancy only leads to the main advantage of this algorithm, which is a high incident detection rate compared to the California algorithm. Therefore, this algorithm has higher DR and lower MTTD, compared to the California algorithm. In addition, this algorithm depends on the data obtained from a single station instead of two adjacent stations. Hence, the number of false alarms triggered by the normal variations that mimic incident-like patterns is reduced. However, the major flaw of this algorithm is that the weather conditions can impact its detection capability. The algorithm was assessed during a snowstorm and the FAR was increased significantly because during snowstorms, vehicles had to decrease their speeds sharply and drive more cautiously. This reduction was incorrectly detected as incidents thus the number of FAR was increased in this situation [47,48].
To alleviate the issue of the random fluctuations that may cause false alarms in the California algorithm, in 1993, Stephanedes and Chassiakos developed the Minnesota algorithm [49]. The algorithm collects the occupancy from two adjacent detector stations upstream and downstream over 30 s intervals. The algorithm calculates the average of the spatial occupancy difference between the two stations over six intervals (three minutes). This process is called short-term time averaging. Then, the algorithm inspects the discontinuity in the spatial occupancy difference over the past three minutes. If the spatial difference exceeds certain thresholds, this will trigger an incident alarm. The advantage of using short-term time averaging is to smooth up the random fluctuations in the data, filter the data, and remove the noise that triggers false alarms that affect the detection capability of the algorithm [37]. The performance of this algorithm was compared to the performance of the California, Standard Deviation, and Double Exponential algorithms (these will be discussed in the following subsection). This comparison showed that the Minnesota algorithm achieved the highest DR and produced the lowest FAR compared to the other three algorithms [49]. However, the main weakness of this algorithm is the detection time, which can be three minutes or more since it collects and evaluates the average spatial occupancy difference over three minutes. In addition, this algorithm depends only on occupancy as the input variable to detect the occurrence of an incident. This may cause undesirable incident alarms especially during low traffic flow. If the flow of the vehicles over the detector stations is low thus the occupancy will be low as well, which may be misclassified as an incident.
The Technical University of Munich developed an AID system using Bluetooth detectors instead of an inductive loop as part of a project called iRoute [50]. These detectors were used to measure the actual travel time of the vehicles and then the speed of the vehicles between two consecutive detector stations, with known distances, can be calculated. A considerable increase in travel time and decrease in speed can be used as a sign of the existence of an incident on the road. The advantage of this system is that it uses Bluetooth detectors instead of inductive loop detectors, which are less expensive, have low installation and maintenance costs, and also have high scanning and detection range compared to inductive loops. Thus, a low number of detectors can provide a wider coverage area. Additionally, their power consumption is very low and the collected data can be easily transferred via The Global System for Mobile Communications (GSM), which has low service costs. Nevertheless, the performance of this system is highly affected by the distance between the Bluetooth detectors since the DR decreases with the increase in the distance between the detectors as the incidents can be smoothed quickly before their impacts reach the downstream detectors [51].
As mentioned before, some AID systems exploit data collected from fixed sensors on the road or from moving sensors installed in the vehicle. Using fixed sensors to collect traffic data has several drawbacks and flaws. For instance, the cost of the equipment is high and they also have high installation and maintenance costs. Additionally, they are vulnerable to failures and they need frequent calibration, which affects their detection accuracy [52]. In addition, they might not perform well under severe weather conditions such as rain or fog [53]. Moreover, they have limited coverage of the roads depending on the locations at which they are situated. Alternatively, the Floating Car Data (FCD) approach is usually applied to collect real-time traffic data that can help in detecting the occurrence of incidents and congestion. The floating car approach uses probe vehicles that act as moving sensors and they are equipped with onboard sensors and communication devices. The FCD includes the spatial and temporal traffic variables of the vehicles (e.g., their speeds, coordinates, acceleration etc.). This data is sent to a TMC to monitor traffic and compare traffic parameters against normal conditions to detect any abnormal conditions [54]. The TMC detects traffic congestion and incidents and distributes traffic information to travelers to alleviate congestion and increase safety on the roads. Several researchers considered FCD as input for their AID systems. These systems showed good performance in terms of DR, FAR and MTTD when compared to the results of inductive loop detectors and Closed-Circuit Television (CCTV) monitoring systems [55,56,57,58,59]. Although it is an economical method due to the low cost of the equipment, the insufficient penetration rate of the probe vehicles on the road can affect the accuracy and the quality of collected data, which is the main limitation of this method.
Furthermore, some AID systems exploit real-time GPS data collected from GPS trackers in the vehicles and drivers’ smartphones to establish GPS traces of the vehicles. These traces contain their location coordinates, travel directions and their speeds over time. The AID systems utilize, analyze, and place these GPS traces on the road map to determine the spatial and temporal characteristics of the traffic flow on the roads. These traffic flow values are compared with the normal traffic flow to identify possible incidents or congestions [1,52]. These systems have low cost and provide wide coverage of the road networks compared to the traditional inductive loop detectors. However, the performance of these systems is affected by the accuracy of the GPS devices (onboard sensors or smartphones) used to collect the GPS traces. Accuracy errors can result in some missing GPS points. Additionally, connectivity problems (e.g., when the vehicle crosses a tunnel) can also affect the accuracy of the collected GPS points.
Moreover, Vehicles-to-Vehicles (V2V) and Vehicles-to-Infrastructure (V2I) communication systems were availed to develop many AID systems such as e-NOTIFY, eCALL, COMeSafety2, OnStar, and Campus Vehicular Test Bed [60,61,62,63,64,65]. These systems provide live spatial and temporal traffic data of the vehicles but they require the vehicles to be equipped with an On-Board Unit (OBU) to facilitate communications. The OBU collects and processes data from the in-vehicle sensors, such as the speed sensor, airbag sensor, horizontal tilt sensor or accelerometers, to determine if an incident occurred. The OBU reports to the nearest Roadside Unit (RSU) and the OBUs of the surrounding vehicles. These incident reports are collected and sent to an external Control Unit (CU). The CU analyzes these reports to evaluate the severity of the incident and based on that, sends the required emergency services [60].

3.2. Statistical Algorithms

These algorithms use statistical techniques to estimate traffic characteristics and compare them with the observed traffic data obtained from the road to determine if there is a statistical difference between them, which indicates potential incidents [31,41]. The contributions and the limitations of these algorithms are discussed in this subsection.
In 1974, the Texas Transportation Institute (TTI) developed the Standard Normal Deviate (SND) Algorithm and applied it on the Houston Gulf Freeway (I-45) [14]. This algorithm uses historical data on the traffic parameters and calculates the mean ( x 0 ) and the standard deviation ( σ ) of these variables and then compares them to the current values of the variables collected from the field to calculate the SND using Equation (4).
S N D = | x k x 0 | σ
where x k is the current value and x 0 is the mean and σ is the standard deviation.
The incident detection logic for this algorithm is that a significant deviation of the traffic variable from its mean is a sign of the occurrence of an incident [39]. Therefore, if the calculated SND exceeded a certain threshold, this will trigger an incident alarm [31,41]. This algorithm was tested and it achieved a high DR of about 92% and FAR of 1.3% and MTTD of around 1 min [31]. Nevertheless, the SND has two main shortcomings. First, calculating the mean and the standard deviation of the variables and determining the thresholds is tedious and time-consuming. Second, the presence of outliers in the data has a significant impact on the performance of the algorithm since they can inflate the mean and the standard deviation of the variables and hence reduce the DR. This phenomenon is called masking [66].
To overcome the masking problem in the SND algorithm, Pranamesh et al. established a new algorithm based on the Inter-Quartile Distance (IQD) to investigate irregularities in the observed traffic speed that can indicate the presence of an incident [67,68]. The difference between this algorithm and the SND algorithm is that it uses the median or the second quartile instead of the mean and the Inter-Quartile score Q instead of the standard deviation to calculate IQD. The Inter-Quartile score Q is the difference between the third quartile and the first quartile of the values divided by 1.35 [68]. The IQD is used to measure the deviation from the normal condition and if it is less than a certain threshold, this indicates the existence of an incident. Although this algorithm alleviates the masking phenomenon, it suffers from another phenomenon called swamping. This phenomenon occurs when most of the values (more than 50%) are close to each other hence the first and third quartiles will be almost equal, and therefore the IQD will be approximately zero. Consequently, any measured speed from the field that is different than the median value will be an outlier and incorrectly detected as an incident, thus the FAR will be high. However, the Federal Highway Administration (FHWA) recommended that if the average speed of the freeways is less than 45 mph, this is a sign of the occurrence of congestion. Therefore, by following FHWA guidelines, incident alarms should be triggered only if the average speed of the freeway falls below 45 mph [69]. This algorithm has achieved a DR of about 97% and a FAR of 4.8% [68].
Additionally, some researchers utilized some smoothing and filtering techniques to smooth the data, average out the random fluctuations, and refine the noises in the data thus reducing the FAR. Double Exponential Smoothing (DES) is one of the smoothing techniques used to remove the noise or the fluctuations of normal traffic data that masks the underlying trends and produces false alarms [31,70]. Cook et al. developed an incident detection algorithm using DES [71]. This algorithm uses recent and past observations of some of the traffic parameters such as volume, occupancy and speed to perform short-term prediction of traffic conditions and assumes that they represent normal traffic conditions. The algorithm weighs past and recent traffic observations differently by using a double exponential smoothing function, which assigns higher weights to the most recent observation. A tracking signal, which is the errors between the predicted and observed traffic parameters, is calculated to detect incidents.
Time series algorithms are considered by some researchers as a subset of statistical algorithms [41,72]. These algorithms assume that normal traffic follows a predictable pattern over time, which can be predicted by using time series models. Incidents are detected if the measured traffic significantly deviates from the predicted conditions of the time series model [31]. The most common algorithms in this category are the Autoregressive Integrated Moving-Average (ARIMA) model [70,73,74] and the High Occupancy (HIOCC) algorithm [39].
Li et al. developed incident detection using a lengthways time series of traffic parameters, which shows the weekly traffic parameters at a specific site. Lengthways time series have higher stability than transverse time series, which show the daily traffic parameters at a specific site. Because of that, lengthways time series can be used to have a good estimation of traffic parameters for normal traffic conditions at any moment, which form the basis of the comparisons. When an incident happens, it causes a sharp decrease in traffic volume and speed while the occupancy increases. The lengthways time series predicts the traffic parameters under normal traffic conditions at any moment using the moving range method. Then, the observed traffic parameters are compared against normal traffic parameters obtained from lengthways time series and, if there is a significant difference between them, this indicates abnormal traffic status and a potential incident [75,76].

3.3. Artificial Intelligence Algorithms

With the development of computational intelligence, AI and ML are used extensively in the transportation sector [77,78,79]. They are used in managing and controlling traffic volume [80], predicting the traffic flow of autonomous vehicles [81], traffic management and planning [82,83] and detecting traffic incidents [35,84,85,86]. Artificial Intelligence algorithms apply AI and ML models to identify the normal and abnormal traffic patterns and then classify the given input data as either incident or normal conditions [87]. These algorithms include Artificial Neural Networks (ANNs), fuzzy logic, random forest, decision trees, support vector machine (SVM) and a combination of these models [31,41].

3.3.1. Artificial Neural Network Algorithms

ANN is a data process technique that was developed by Warren McCulloch and Walter Pitts in 1943 [88,89]. ANN mimics the cognitive skills of the human brain and consists of a number of processing elements called neurons with parallel interconnections called weights [90,91,92]. The data is fed into the network and transferred between layers of neurons and goes through several computations until outputs are formed. ANN can be used for data classification, pattern recognition, clustering problems and fitting problems. Incident detection is considered a binary classification problem, where there are two classes: incident and non-incident classes. Because of its learning and ease of implementation, ANN is widely used to develop AID systems [31]. The ANN input is the traffic data collected from the field during the incident and normal conditions and the data are labeled as either incident or normal traffic conditions [19,37]. This trains the model to learn the difference between the two patterns. Accordingly, if new unlabeled data are fed into the network, the model can classify these as either incident or non-incident. There are several types of ANN that have distinct characteristics and advantages. These various ANN types were used to develop AID systems such the multilayer feedforward ANN [37,93,94,95,96], Long and Short Term Memory (LSTM) network [97,98] and constructive probabilistic ANN [99]. Using ANN to develop AID systems showed encouraging results in terms of high DR, low FAR and MTTD.
The objective of any ANN is to find an approximate target function that can correctly map input variables to output variables. The network learns the target function from the training data and generalizes it to new data. However, if the model is not well trained using enough of a training dataset that contains various cases, this will lead to deficient performance of the developed network. This is one of the main challenges for developing ANN to detect traffic incidents; the imbalance of incident and non-incident cases in real-world traffic data. Usually, real traffic data contain more non-incident cases thus the developed network will not be able to recognize and classify incident cases. To solve this problem, Lin et al. used Generative Adversarial Networks (GNAs), which are a type of ANN, to generate new incident cases from the features of a real traffic training dataset [100]. Based on that, the training dataset contains a balanced combination of non-incident and incident cases (generated using GNAs) and the diversity of the training dataset increased. Accordingly, an SVM classifier, which is a class of machine learning algorithms, was constructed and trained from the generated dataset. Using GNAs to improve the diversity of the training dataset increased the DR of the model from about 90% to around 92% and reduced the FAR from about 12.7% to 7% [100,101]. Although ANN is widely used in AID systems due to its superior performance, the performance of such networks depends mainly on the structure and the parameters of the networks. The structure and parameters need optimization and tunning, which is obtained through a trial and error process.

3.3.2. Fuzzy Logic Algorithms

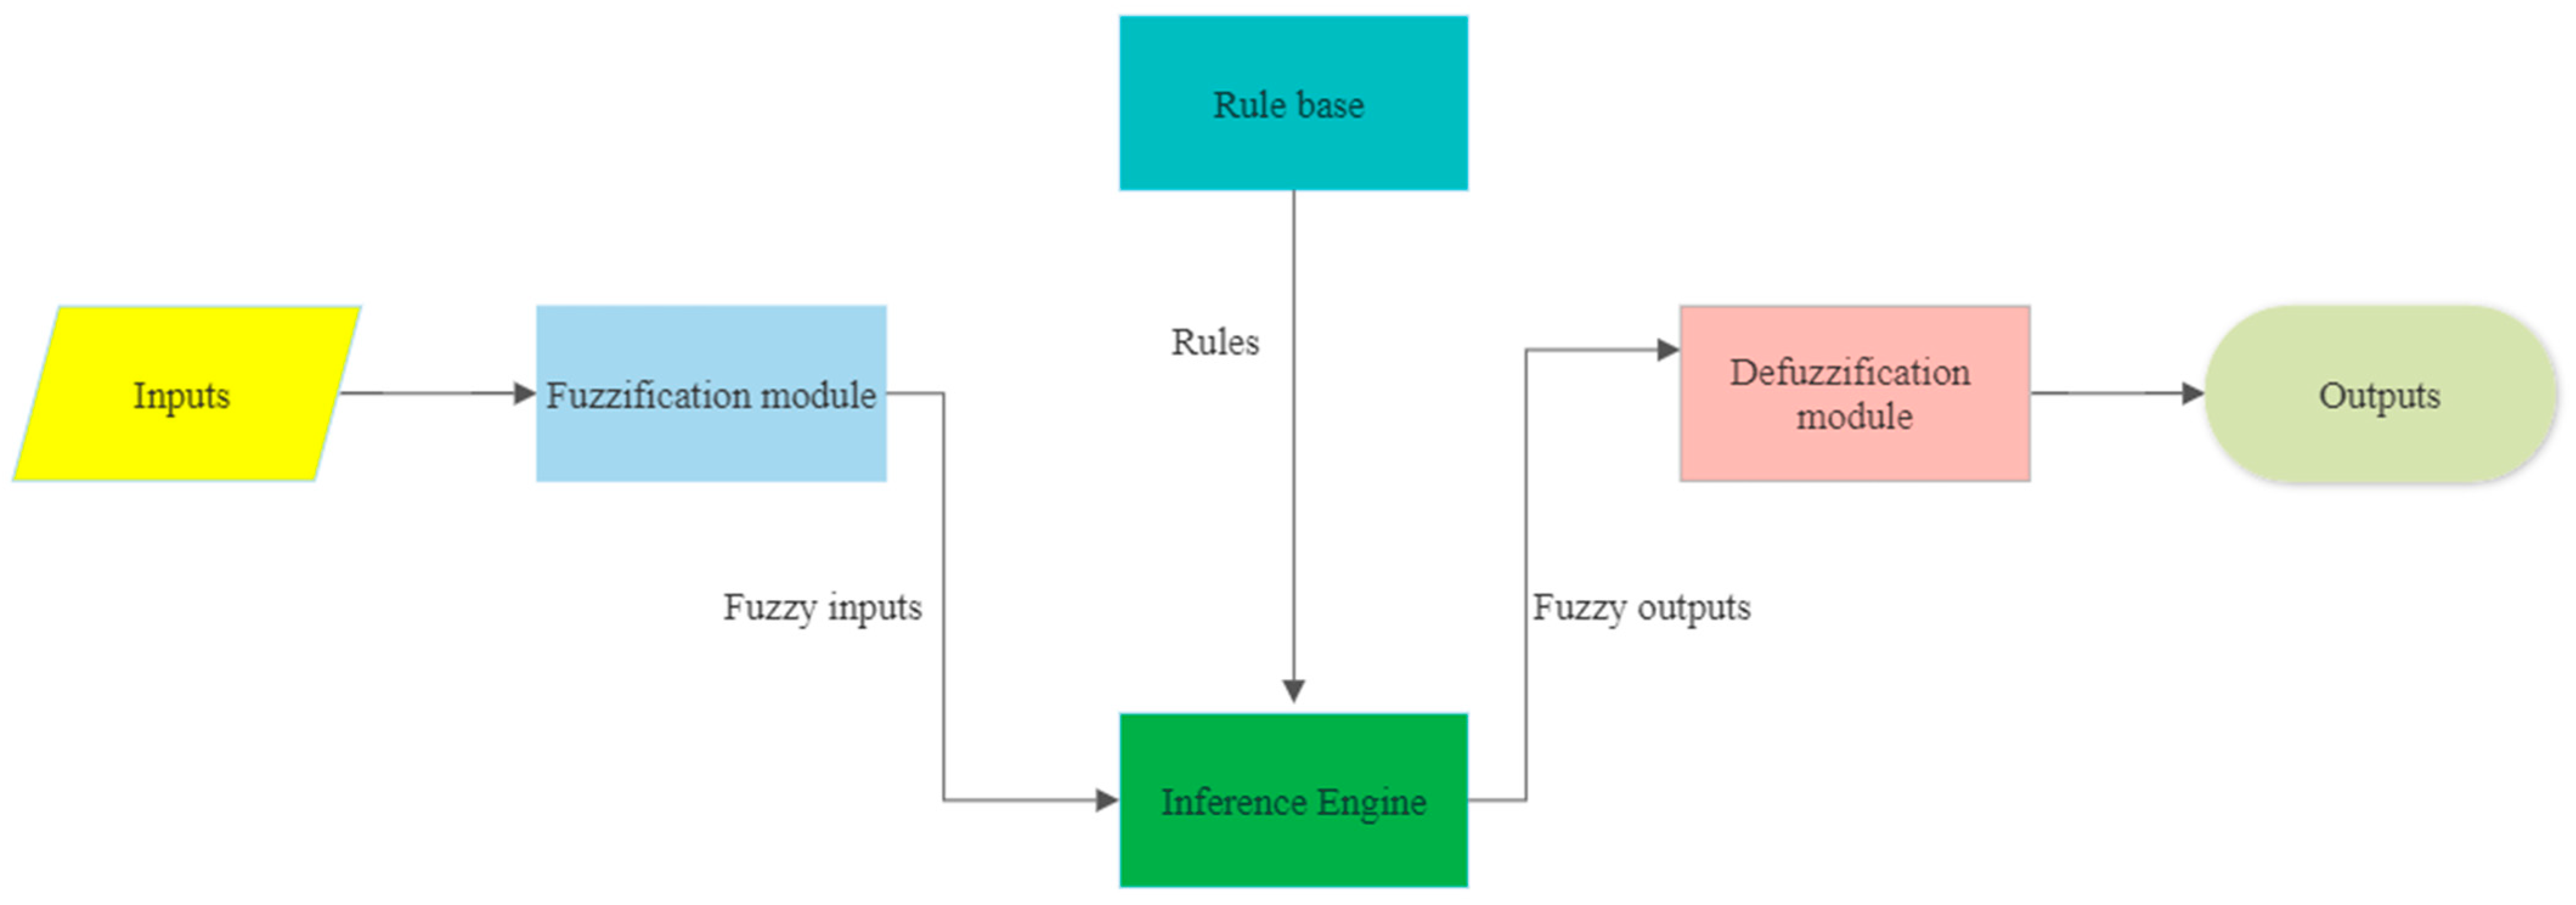
Fuzzy logic (FL) is an approach that was invented and developed by Lotfi Zadeh in the 1960s [102,103,104,105] to deal with the concept of partial truth. In FL, the truth value of variables can be any real number between 0 and 1, unlike Boolean logic, in which the values of the variables are either true or false, either 1 or 0 [106,107]. FL imitates human reasoning and makes decisions based on knowledge and experience [106,108,109]. Likewise, FL converts incomplete, ambiguous, distorted or inaccurate inputs through three main stages and produces acceptable outputs based on a set of rules that form a Fuzzy Inference System (FIS), as illustrated in Figure 12 [110,111,112].
The FL is used to handle the complexity and randomness of the traffic variables and can be utilized to construct AID systems or to monitor traffic congestion [52,114]. FL was applied in several algorithms to determine the likelihood or the probability of the occurrence of an incident from input traffic data using membership functions even in case of missing or inaccurate data [115,116,117,118]. The main limitation of FL is that the performance of the algorithm depends mainly on the rules that are set to construct the inference system. These rules are derived from human knowledge and expertise in this issue.

3.3.3. Support Vector Machine Algorithms

Support Vector Machine (SVM) is a supervised machine learning technique that can be used for classification problems [119,120]. As a result, SVM models were used for incident detection [35,121] because of their capability to produce a computationally efficient classifier that can classify traffic patterns as either incident or non-incident conditions and overcome the overfitting problems of ANN [122]. Motamed utilized an SVM classifier to detect traffic incidents using real traffic data from traffic control centers in Dallas and Miami that includes speed, volume and occupancy of the vehicles at upstream and downstream sections [21]. To evaluate and verify the developed model, data for a new site was utilized and the model achieved good DR at about 89% and low FAR of around 7%. Alike, Yuan and Cheu developed two SVM models for arterial and freeway incident detection [123]. The performance measures of these two models were compared against two ANN models that were developed based on the same data. The two SVM models achieved a lower Misclassification Rate (MCR), higher DR, Lower FAR and MTTD relative to the two ANNs. The results supported the claim that SVM can be used successfully for incident detection. Nevertheless, the performance of SVM depends mainly on the kernel function used. However, selecting good kernel functions is a complicated procedure. If inappropriate kernel function is selected, this might complicate the model and increase the training time. In addition, SVM is extremely sensitive to the noise in the data and it will not perform well when the data has too much noise. Additionally, SVM is not suitable for large datasets because it will require a significant time in the training process.

3.3.4. Ensemble Learning Algorithms

Ensemble learning combines multiple machine learning models to build a powerful prediction model that has better predictive performance than any constituent machine learning model alone [124]. The common types of ensembles are Random Forest (RF) and Stacking models.
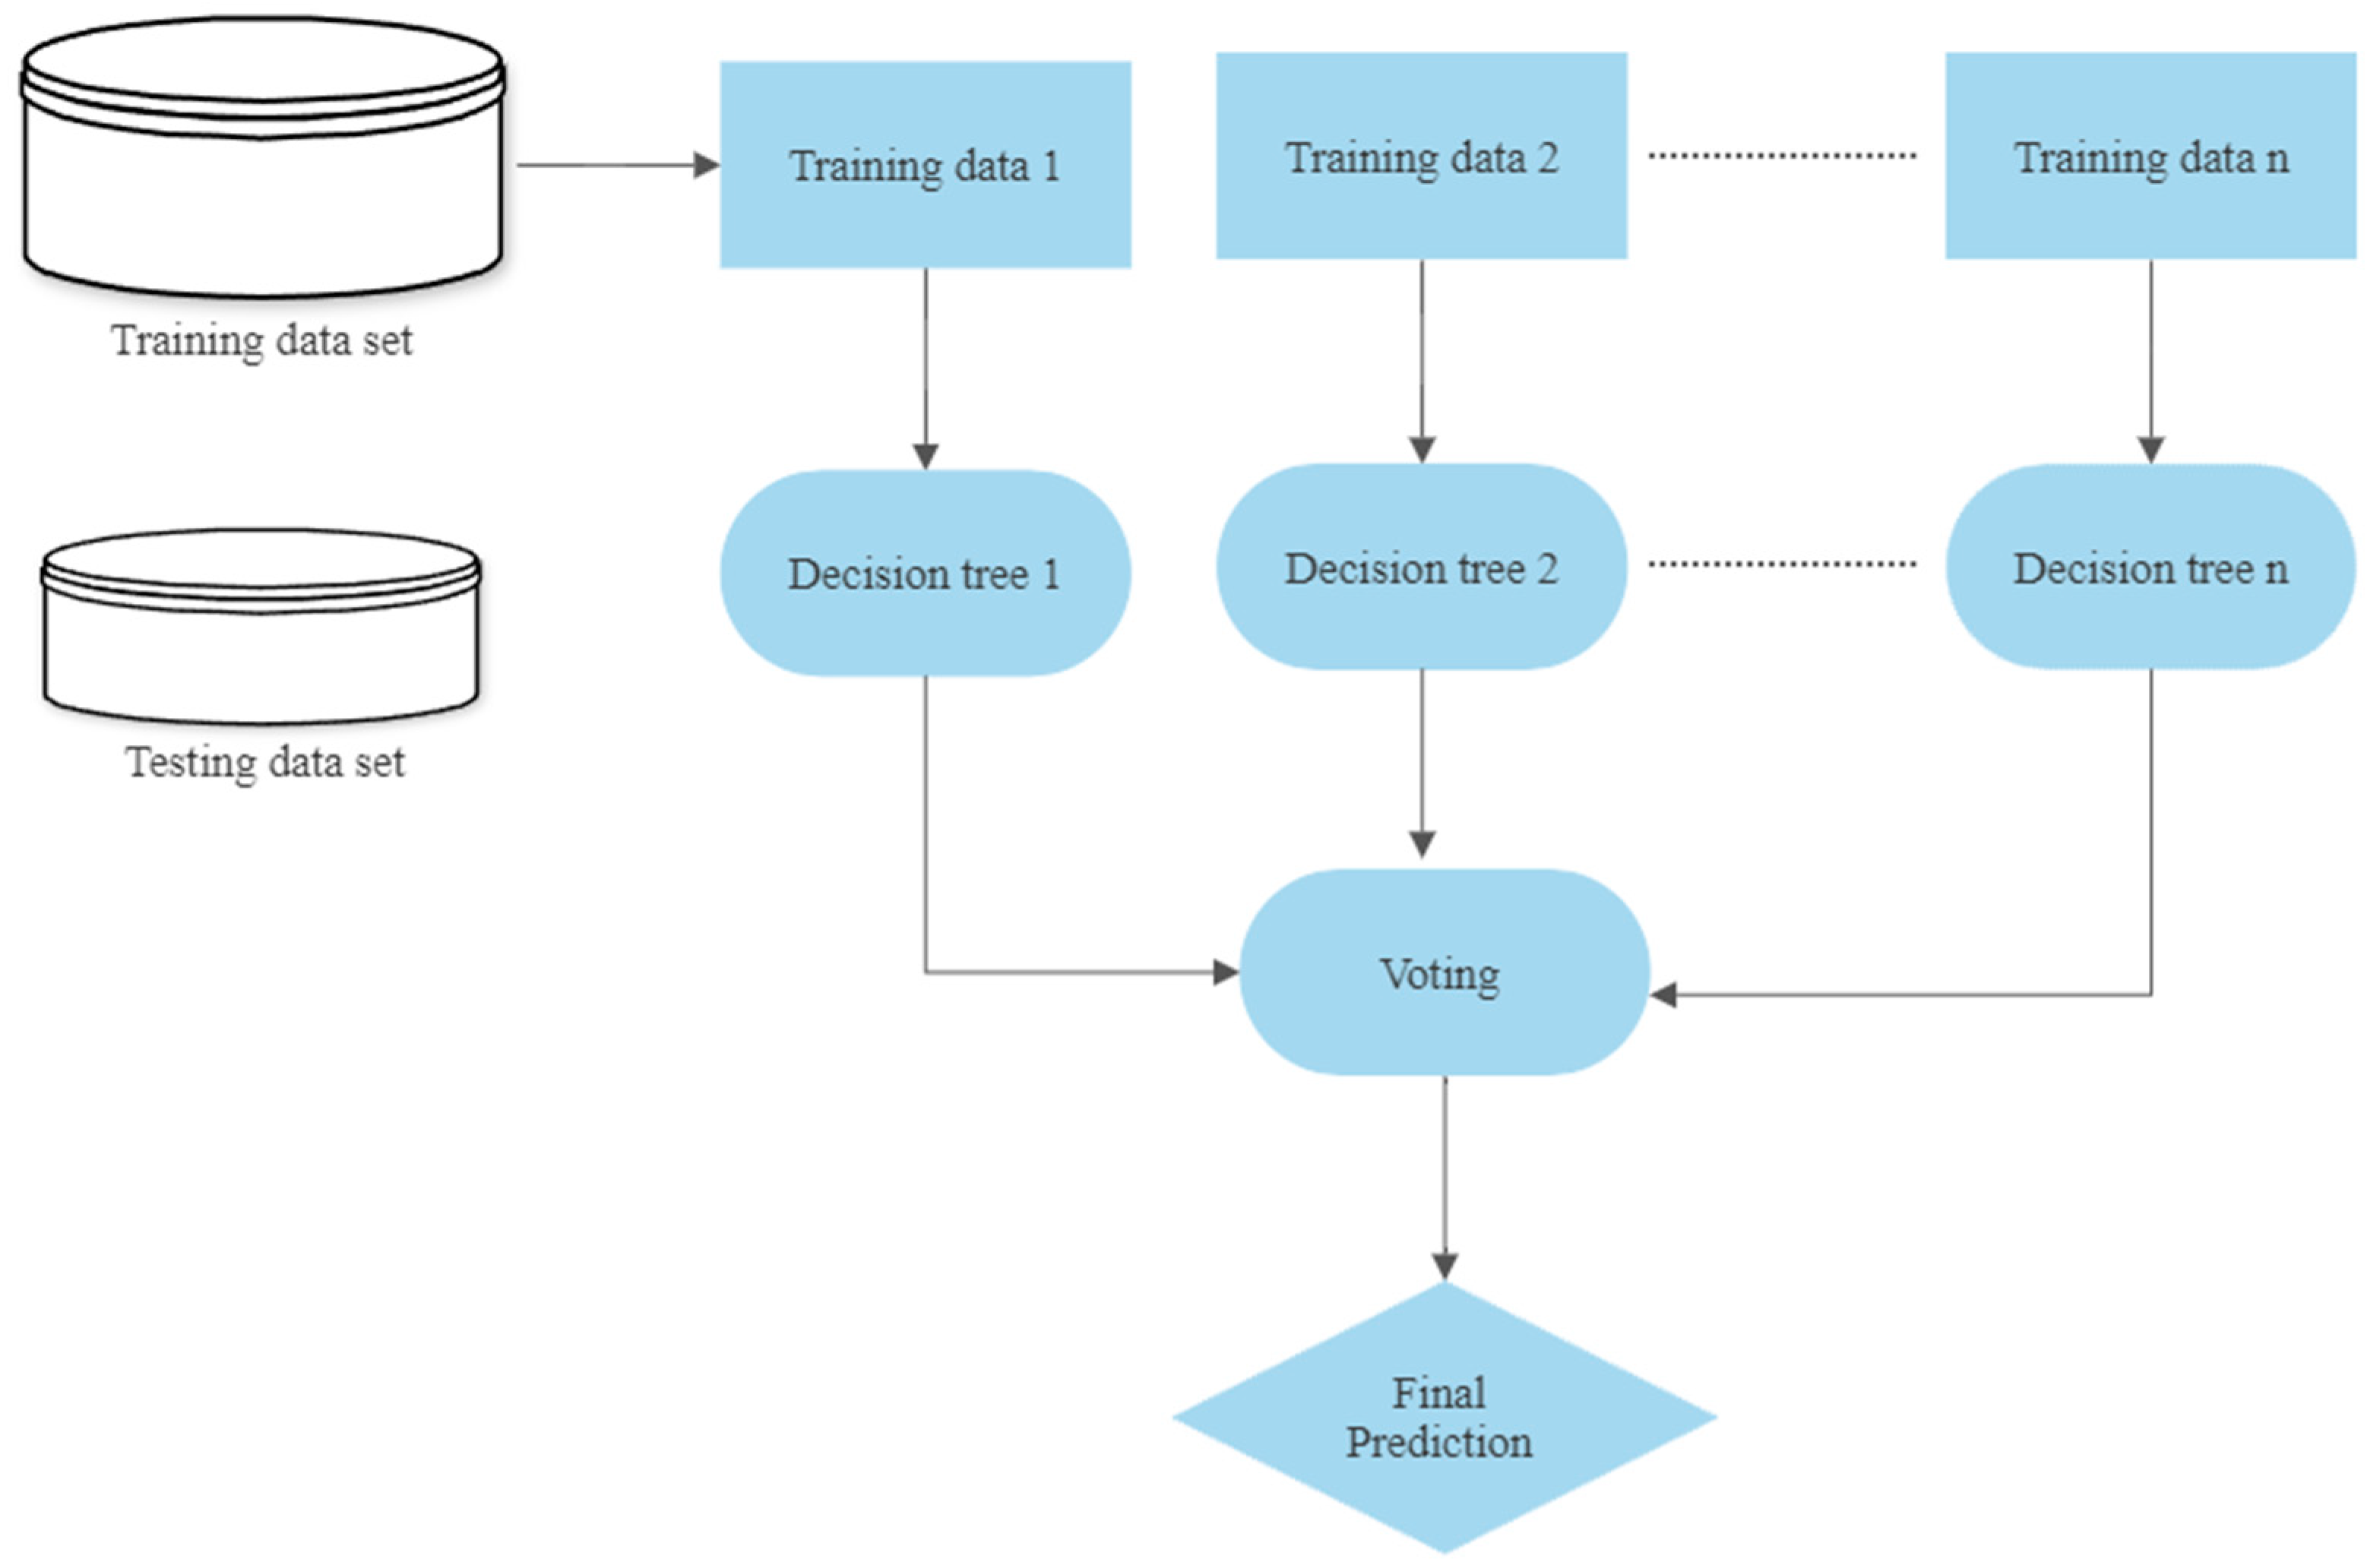
Random Forest (RF) classifier consists of a forest of decision trees that operate as an ensemble and can be used for classification or regression problems [125,126]. During the training phase, a bootstrapped dataset is generated. This dataset is developed by taking samples from the original data with replacement and maintaining the same number of observations in each sample [127]. In the testing phase, RF takes the prediction from each decision tree and performs a voting mechanism called bagging to decide the final prediction [126]. Figure 13 depicts the structure of RF.
The advantage of RF is that it combines various uncorrelated decision trees and chooses the most voted prediction. Therefore, it has superior performance than any single decision tree. Because of that, RF was widely used to develop AID systems with high DR and FAR [23,35]. In 2018, Ahuja employed RF to detect incidents and congestion in freeways using speed and occupancy data collected from the field. This system consisted of 50 decision trees and the performance of this algorithm was compared to the performance of one decision tree, SND and IQD using the same dataset. The RF model achieved significantly better DR and FAR than the other three algorithms [66].
Stacking is another ensemble learning model that combines multiple models to improve the prediction of the model. In 2021, Iqbal et al. exploited a stacking model that consisted of two classifiers to detect incidents and classify their types and severities [129]. Three incident types and three associated severity levels were considered, resulting in a total of nine pairs. The stacking model consists of two levels; at the first level, the nine pairs are fed into the model so that the severity level is predicted. The labeled output of the first level is used as input to the second level, where the incident type is predicted. Therefore, the final output of the stacking model is the type of incident and its associated severity level [129].
Although combining multiple machine learning algorithms can yield a model that has better predictive performance, these models have to be selected carefully. Any inappropriate selection of the models’ combination can lower the predictive performance of the model. In addition, the ensemble can be complex and difficult to interpret. Additionally, the ensemble can take more time to create and train.

3.4. Video–Image Processing Algorithms

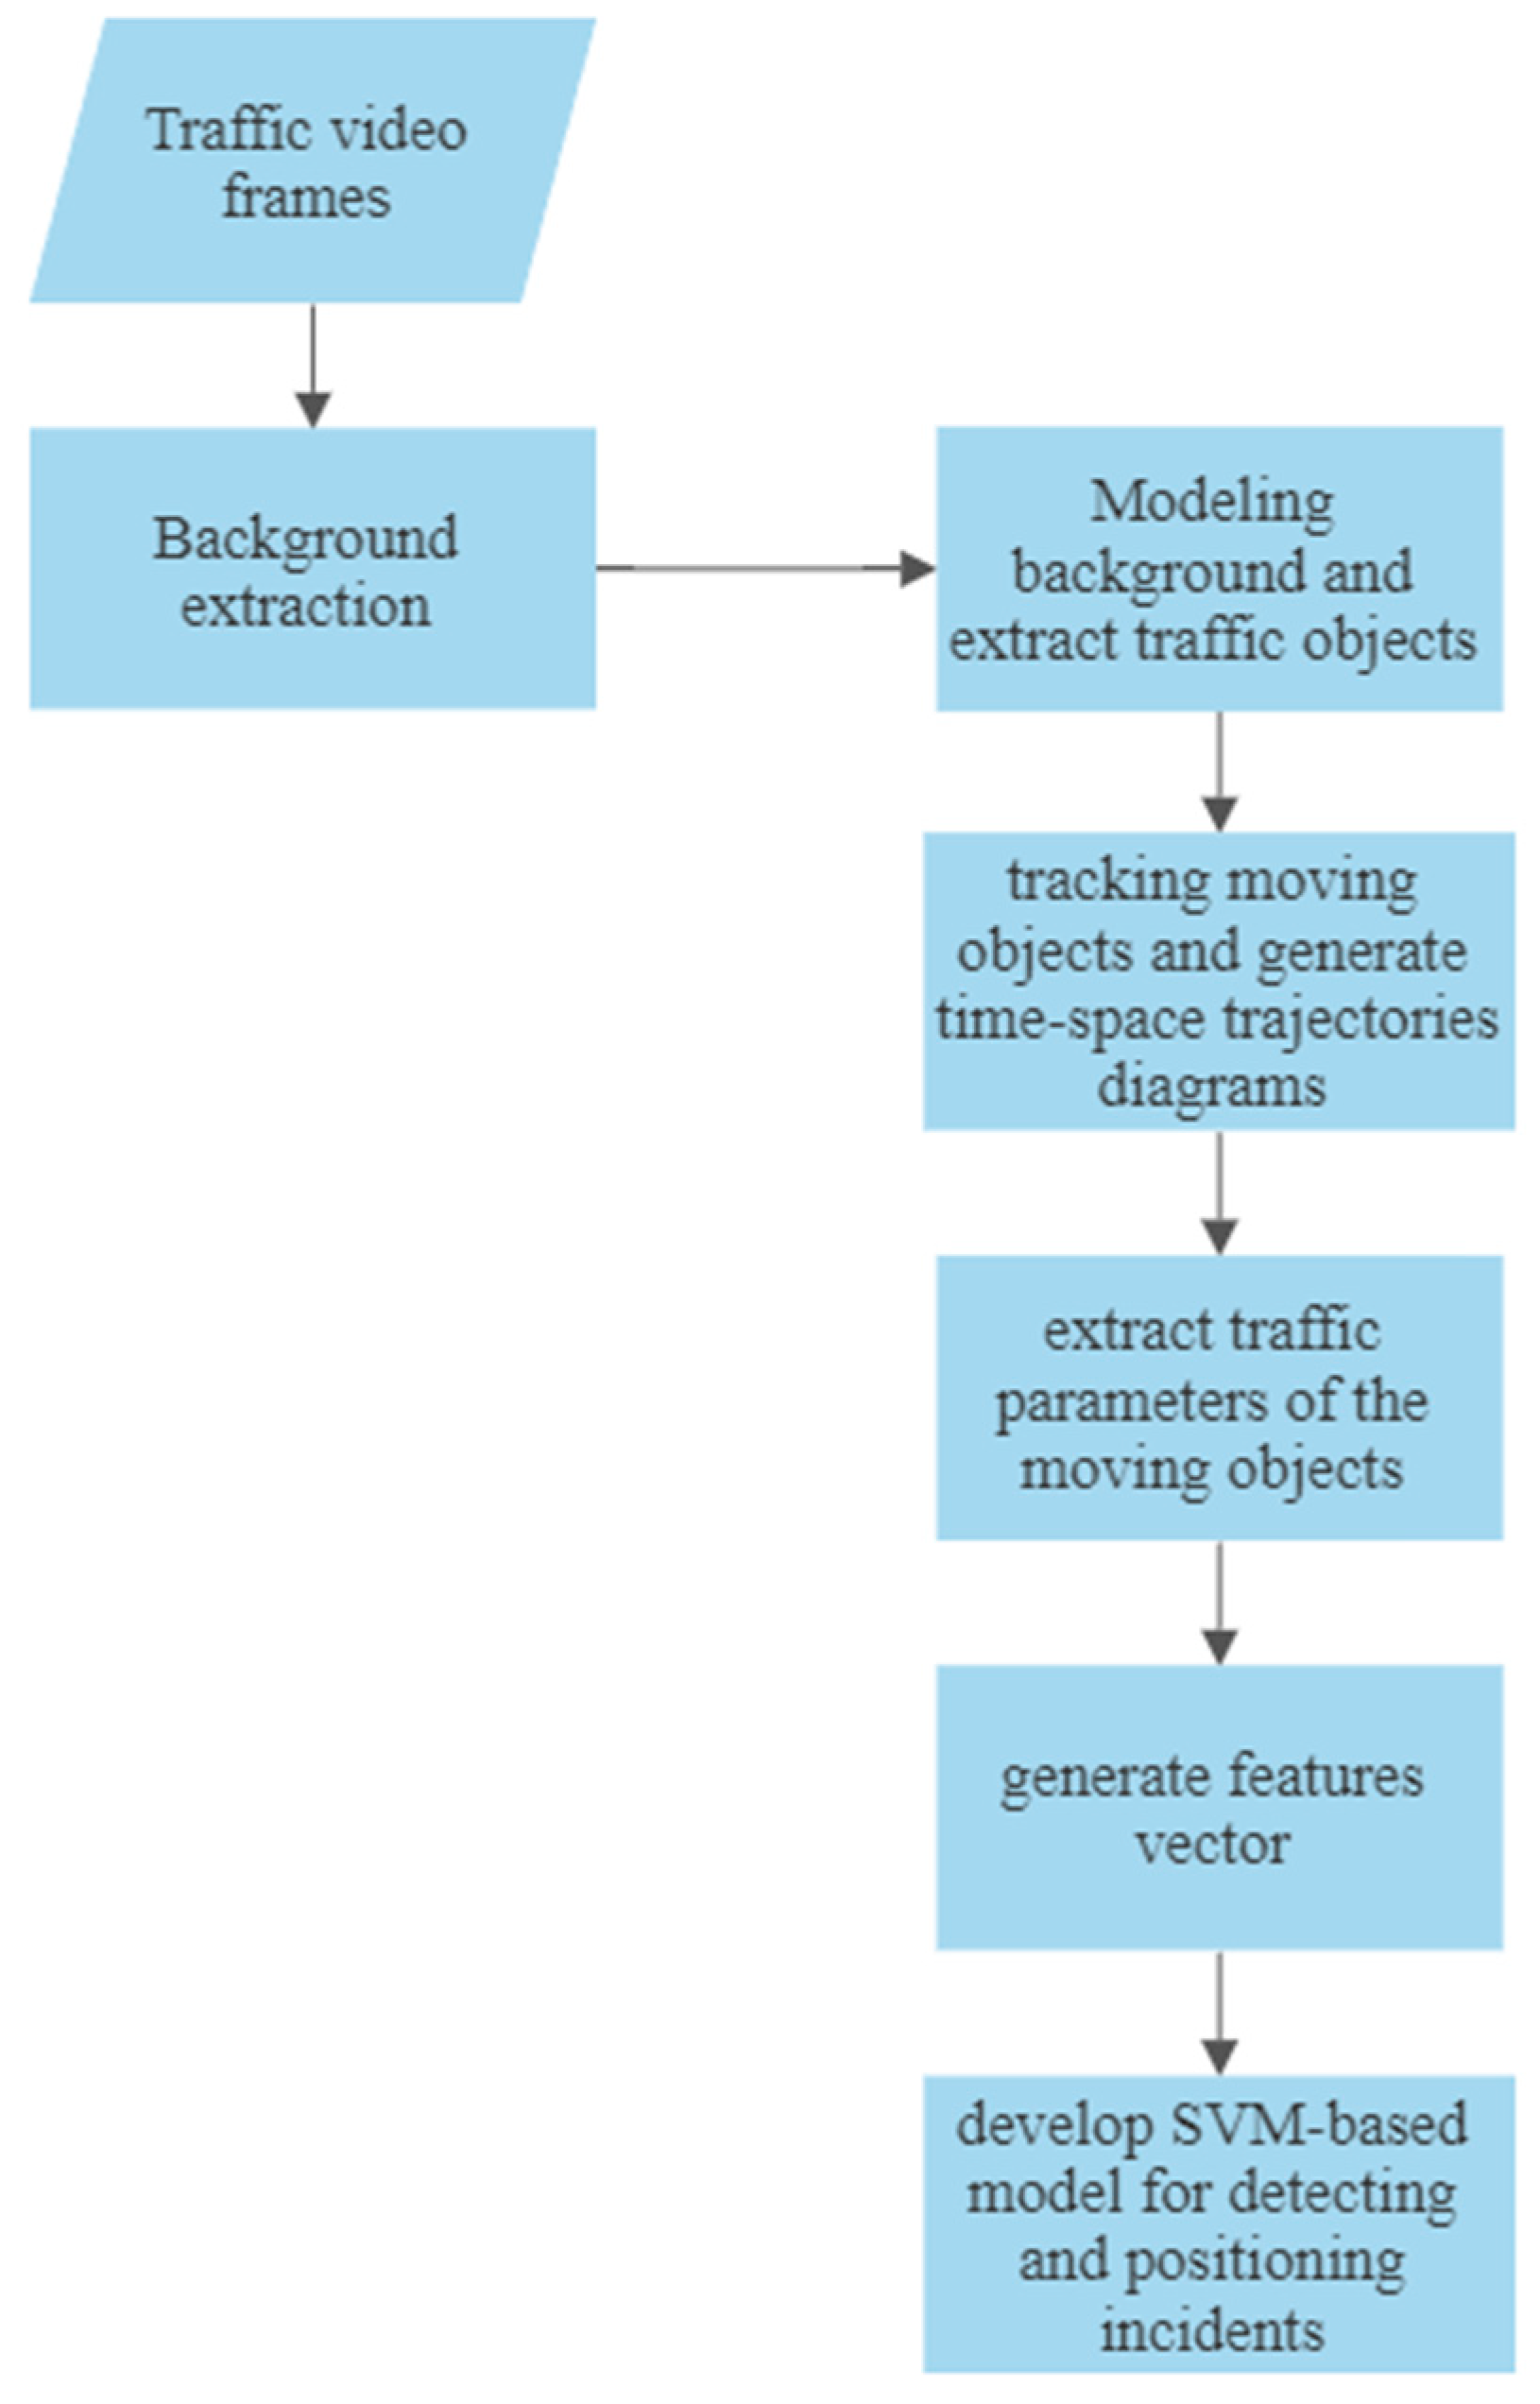
CCTV cameras are used for traffic management on roadways. The video–image processing algorithms use traffic videos captured from CCTV cameras installed on the roads to detect traffic incidents [31,72,130]. They break the recorded videos into a sequence of image frames and then extract the background roads and subtract moving vehicles from them. These frames are analyzed by video–image processing algorithms that track the moving vehicles to determine the spatial-temporal characteristics of the traffic variables and then analyze these to identify incident or incident-free states [131,132]. Figure 14 shows the steps of video–image processing incident detection algorithms.
The Autoscope Incident Detection Algorithm (AIDA) is one of the video–image processing-based incident detection algorithms that analyze spatial-temporal characteristics of the traffic variables. It looks for a sharp decrease in speed or a substantial increase in occupancy to detect traffic incidents [134,135].
The performance of these algorithms will degrade as the visibility decreases. Thus, severe weather conditions (rain, snow, fog, and/or lighting) and the cameras’ position can have a significant impact on the detection capability of these algorithms [41].
Table 1 summarizes the advantages and disadvantages of the aforementioned categories of incident detection systems.

4. Conclusions

Traffic incidents are among the leading causes of death globally and one of the major causes of pollution. In addition, they have negative impacts on the traffic flow and negative economic consequences. Therefore, an AID system is an integral part of any transportation system to save lives, increase safety on the roads and mitigate other negative consequences.
AID systems can be categorized based on their data processing and incident detection algorithms into four categories: comparative, statistical, artificial intelligence-based and video–image processing algorithms. Usually, the performance of incident detection algorithms can be evaluated through three measures: DR, FAR and MTTD. This research provides a comprehensive review of the existing incident detection algorithms and evaluates their benefits and advantages as well as their limitations and drawbacks. Table 1 summarizes the evaluation of the above-mentioned AID systems. The literature review showed that various data collection and analysis techniques have emerged and based on that, various AID systems have been established and developed since the beginning of the 1970s till now. It can be observed that ML and AI are utilized extensively in developing AID systems because of their flexibility and their superior performance in detecting traffic incidents.
The contribution of this paper is as follows:
  • It illustrates the importance of an incident detection system’s role in traffic management and in increasing safety on the roadways;
  • It presents an extensive review of the development of incident detection systems from the beginning of the 1970s until now;
  • It investigates the advantages of the existing AID systems and highlights their drawbacks and limitations and the gaps that exist in the literature, which are useful for future development.

5. Recommendations and Research Direction

This section summarizes the research gaps that can be identified based on the literature review. It also provides some proposed solutions for future research to overcome these research gaps.

5.1. Recommendations

It can be concluded that most AID systems have some advantages and disadvantages and every developed AID system attempted to overcome some of the disadvantages of the previous systems or models. Despite this huge development, there are some gaps in these systems. The main gaps that can be observed from the literature review are:
  • Some of the AID systems depend on one traffic variable (such as the California algorithm) to detect the occurrence of the incidents. This might result in a high FAR and a low DR. Hence, AID systems should consider multiple traffic variables such as occupancy, flow and speed simultaneously to enhance the detection performance of the model;
  • The literature review identified some factors that can have a substantial impact on the performance of the model. An example of these factors is the spacing between the detectors, as mentioned before in Section 2.1, which has a major impact on the detection ability of the system. Alternatively, the coverage range of CCTV or other sensors can also impact the detection ability of the system. In addition, the traffic conditions are a key factor. During high traffic flow periods, any incident, even a minor incident, can be detected because its impact will intensify and will be easily detected. However, at low traffic volumes, the detection of the incidents is difficult because their impacts may not be significant. Another crucial factor is the severity of the incident. The severity of the incident affects its detectability. Moreover, weather conditions are a crucial factor that not only affects the performance of AID algorithms but can also be a major cause of incidents and traffic disruption [136,137]. Further, the road conditions and the geometry of the road can cause false alarms and undermine the performance of the AID system, as mentioned in Section 3.1.
The main limitation of this study is that the references were collected mainly from Google Scholar and Scopus databases only. Searching for references in other databases would provide a more comprehensive review. In addition, the study focused on references published in English only.
Based on the review presented in this study, the following recommendations are proposed to improve the performance of AID, enhance safety on the roadways, and reduce the number of traffic incidents in future research:
(1)
Based on the gaps that are identified from the literature review, there is a need for a comprehensive and generic AID system that considers all possible factors that can impact the detection of incidents;
(2)
According to the National Highway Transportation Safety Administration (NHTSA), more than 90% of traffic incidents are due to human error such as speeding, texting, drunk drivers and distracted drivers [138,139,140]. Thus, implementing AID systems is not enough to reduce the number of incidents. There is a need for strict driving and traffic laws that suppress violators and careless drivers and hence enhance road safety. In addition, utilizing new emerging technologies such as connected and autonomous vehicles can reduce these errors and the number of traffic incidents [141].
(3)
The study focused on the role of AID systems in mitigating the problem of traffic incidents. Yet there are some other factors that have a vital role in roadway safety such as road conditions and vehicle maintenance [142]. Thus, proper maintenance of the road infrastructure and vehicles is essential. Moreover, intelligent transportation systems (ITS) are a crucial component that can improve safety and improve traffic performance on roadway networks [77].
(4)
The study illustrates the importance of utilizing AI and ML models in incident detection based on their superior performance in terms of DR, FAR and MTTD. Additionally, these are used in almost every aspect of the transportation sector due to their promising future of providing safer, more efficient and sustainable transportation [143]. Thus, the applications of AI and ML in transportation should be the focus of future research to evaluate their benefits and the challenges facing them.

5.2. Research Direction

In light of the gaps identified, the following directions are proposed for future research:
  • All the factors mentioned in Section 5.1 should be considered when developing AID systems;
  • Future studies should focus on the usability of some of the emerging technologies in developing AID systems, for instance, utilizing autonomous vehicles in the FCD approach;
  • Future studies should conduct a more in-depth analysis of the application of AI and ML models in the transportation sector, the feasibility of using these models in detecting and even predicting the occurrence of traffic incidents and the potential issues and challenges that may arise from using these models.

Author Contributions

The manuscript was written through the contributions of all authors. O.E. and A.A. were responsible for the conceptualization of the topic; article gathering and sorting were carried out by O.E. and A.A.; manuscript writing and original drafting and formal analysis were carried out by O.E. and A.A.; the writing of reviews and editing were carried out by O.E. and A.A. led the overall research activity. All authors have read and agreed to the published version of the manuscript.

Funding

This research was funded by the American University of Sharjah through a Graduate Research Assistantship (GTA) Provided by the Office of Research and Graduate Studies as part of the support to the PhD Program in Engineering Systems Management.

Institutional Review Board Statement

Not applicable.

Informed Consent Statement

Not applicable.

Data Availability Statement

Not applicable.

Acknowledgments

The work in this paper was supported, in part, by the Open Access Program from the American University of Sharjah. This paper represents the opinions of the author(s) and does not mean to represent the position or opinions of the American University of Sharjah.

Conflicts of Interest

The authors declare no conflict of interest.

References

  1. Kamran, S.; Haas, O. A Multilevel Traffic Incidents Detection Approach: Identifying Traffic Patterns and Vehicle Behaviours Using Real-Time GPS Data. In Proceedings of the 2007 IEEE Intelligent Vehicles Symposium, Istanbul, Turkey, 13–15 June 2007; pp. 912–917. [Google Scholar] [CrossRef]
  2. Srinivasan, D.; Jin, X.; Cheu, R.L. Evaluation of Adaptive Neural Network Models for Freeway Incident Detection. IEEE Trans. Intell. Transp. Syst. 2004, 5, 1–11. [Google Scholar] [CrossRef]
  3. Srinivasan, D.; Jin, X.; Cheu, R.L. Adaptive Neural Network Models for Automatic Incident Detection on Freeways. Neurocomputing 2005, 64, 473–496. [Google Scholar] [CrossRef]
  4. Saini, M. Survey On Vision Based On-Road Vehicle Detection. Int. J. u- e-Serv. Sci. Technol. 2014, 7, 139–146. [Google Scholar] [CrossRef] [Green Version]
  5. Farradyne, P.B. Traffic Incident Management. In Encyclopedia of Transportation: Social Science and Policy; SAGE Publications, Inc.: Thousand Oaks, CA, USA, 2014. [Google Scholar] [CrossRef]
  6. Knoop, V.L.; Hoogendoorn, S.P.; van Zuylen, H.J. Capacity Reduction at Incidents: Empirical Data Collected from a Helicopter. Transp. Res. Rec. 2008, 2071, 19–25. [Google Scholar] [CrossRef] [Green Version]
  7. Yang, H.; Wang, Z.; Xie, K. Impact of Connected Vehicles on Mitigating Secondary Crash Risk. Int. J. Transp. Sci. Technol. 2017, 6, 196–207. [Google Scholar] [CrossRef]
  8. Khattak, A.J.; Fan, Y.; Teague, C. Economie Impact of Traffic Incidents on Businesses. Transp. Res. Rec. 2008, 2067, 93–100. [Google Scholar] [CrossRef]
  9. Jan, K.A. Economic Impact of Traffic Incidents on North Carolina’s Interstate Facilities. Transp. Res. Rec. 2008, 92, 99. [Google Scholar]
  10. World Health Organization. Road Traffic Injuries. Available online: https://www.who.int/news-room/fact-sheets/detail/road-traffic-injuries (accessed on 21 December 2021).
  11. Tantillo, M.J.; Roberts, E.; Mangar, U. Roles of Transportation Management Centers in Incident Management on Managed Lanes; FHWA Report no: FHWA-HOP-14-022; Vanasse Hangen Brustlin, Inc. (VHB): Tysons, VA, USA, 2014. [Google Scholar]
  12. Jin, X.; Zhang, Z.; Gan, A. Traffic Management Centers: Challenges, Best Practices, and Future Plans; National Center for Transportation Systems Productivity and Management (US): Atlanta, GA, USA, 2014. [Google Scholar]
  13. Cook, A.R.; Cleveland, D.E. Detection of Freeway Capacity-Reducing Incidents By Traffic-Stream Measurements. Transp. Res. Rec. 1970, 495, 1–11. [Google Scholar]
  14. Dudek, C.L.; Messer, C.J.; Nuckles, N.B. Incident Detection on Urban Freeways. Transp. Res. Rec. 1974, 495, 12–24. [Google Scholar]
  15. Payne, H. Freeway Incident Detection Based upon Pattern Classification. In Proceedings of the 1975 IEEE Conference on Decision and Control Including the 14th Symposium on Adaptive Processes, Houston, TX, USA, 10–12 December 1975; pp. 688–692. [Google Scholar] [CrossRef]
  16. Payne, H.J.; Tignor, S. Freeway Incident-Detection Algorithms Based on Decision Trees With States. In Proceedings of the 57th Annual Meeting of the Transportation Research Board, Washington, DC, USA, 16–20 January 1978. [Google Scholar]
  17. Dudek, C.L.; Weaver, G.D.; Ritch, G.P.; Messer, C.J. Detecting Freeway Incidents under Low-Volume Conditions; Texas A&M University: College Station, TX, USA, 1975. [Google Scholar]
  18. Levin, M.; Krause, G.M. Incident Detection: A Bayesian Approach. Transp. Res. Rec. 1978, 682, 52–58. [Google Scholar]
  19. Ki, Y.-K.; Kim, J.-H.; Kim, T.-K.; Heo, N.-W.; Choi, J.-W.; Jeong, J.-H. Method for Automatic Detection of Traffic Incidents Using Neural Networks and Traffic Data. In Proceedings of the 2018 IEEE 9th Annual Information Technology, Electronics and Mobile Communication Conference (IEMCON), Vancouver, BC, Canada, 1–3 November 2018; pp. 184–188. [Google Scholar] [CrossRef]
  20. Elefteriadou, L. An Introduction to Traffic Flow Theory, 17th ed.; Springer optimization and its applications; Springer: New York, NY, USA, 2014; Volume 84, Available online: https://aus.on.worldcat.org/oclc/863640178 (accessed on 15 December 2021). [CrossRef]
  21. Motamed, M. Developing a Real-Time Freeway Incident Detection Model Using Machine Learning Techniques. Ph.D. Thesis, University of Texas at Austin, Austin, TX, USA, 2016. [Google Scholar] [CrossRef]
  22. Motamed, M.; Machemehl, R. Real Time Freeway Incident Detection; Center for Transportation Research University of Texas at Austin: Austin, TX, USA, 2014; Volume 7. [Google Scholar]
  23. Xie, T.; Shang, Q.; Yu, Y. Automated Traffic Incident Detection: Coping With Imbalanced and Small Datasets. IEEE Access 2022, 10, 35521–35540. [Google Scholar] [CrossRef]
  24. Sheikh, M.S.; Liang, J.; Wang, W. An Improved Automatic Traffic Incident Detection Technique Using a Vehicle to Infrastructure Communication. J. Adv. Transp. 2020, 2020, 1–14. [Google Scholar] [CrossRef] [Green Version]
  25. Li, R.; Pereira, F.C.; Ben-Akiva, M.E. Overview of Traffic Incident Duration Analysis and Prediction. Eur. Transp. Res. Rev. 2018, 10, 22. [Google Scholar] [CrossRef]
  26. Chimba, D.; Kutela, B.; Ogletree, G.; Horne, F.; Tugwell, M. Impact of Abandoned and Disabled Vehicles on Freeway Incident Duration. J. Transp. Eng. 2014, 140, 4013013. [Google Scholar] [CrossRef]
  27. Valenti, G.; Lelli, M.; Cucina, D. A Comparative Study of Models for the Incident Duration Prediction. Eur. Transp. Res. Rev. 2010, 2, 103–111. [Google Scholar] [CrossRef] [Green Version]
  28. National Academies of Sciences, Engineering, and Medicine. Highway Capacity Manual 7th Edition: A Guide for Multimodal Mobility Analysis; National Academies Press: Washington, DC, USA, 2022. [Google Scholar] [CrossRef]
  29. Shah, V.; Hatcher, G.; Greer, E.; Fraser, J.; Franz, M.; Sadabadi, K. Guidelines for Quantifying Benefits of Traffic Incident Management Strategies; National Academies Press: Washington, DC, USA, 2022. [Google Scholar] [CrossRef]
  30. Haule, H.J.; Sando, T.; Lentz, R.; Chuan, C.H.; Alluri, P. Evaluating the Impact and Clearance Duration of Freeway Incidents. Int. J. Transp. Sci. Technol. 2019, 8, 13–24. [Google Scholar] [CrossRef]
  31. Parkany, E.; Xie, C. A Complete Review of Incident Detection Algorithms & Their Deployment: What Works and What Doesn’t; Report No: NETCR37; The New England Transportation Consortium: Mansfield Center, CT, USA, 2005. [Google Scholar]
  32. Calderoni, L.; Maio, D.; Rovis, S. Deploying a Network of Smart Cameras for Traffic Monitoring on a “City Kernel”. Expert Syst. Appl. 2014, 41, 502–507. [Google Scholar] [CrossRef]
  33. Cheng, H.Y.; Gau, V.; Huang, C.W.; Hwang, J.N. Advanced Formation and Delivery of Traffic Information in Intelligent Transportation Systems. Expert Syst. Appl. 2012, 39, 8356–8368. [Google Scholar] [CrossRef]
  34. Wen, W. An Intelligent Traffic Management Expert System with RFID Technology. Expert Syst. Appl. 2010, 37, 3024–3035. [Google Scholar] [CrossRef]
  35. Dogru, N.; Subasi, A. Traffic Accident Detection Using Random Forest Classifier. In Proceedings of the 2018 15th Learning and Technology Conference (L&T), Jeddah, Saudi Arabia, 25–26 February 2018; pp. 40–45. [Google Scholar] [CrossRef]
  36. Chen, S.; Wang, W.; van Zuylen, H. Construct Support Vector Machine Ensemble to Detect Traffic Incident. Expert Syst. Appl. 2009, 36, 10976–10986. [Google Scholar] [CrossRef]
  37. Cheu, R.L.; Ritchie, S.G. Automated Detection of Lane-Blocking Freeway Incidents Using Artificial Neural Networks. Transp. Res. Part C 1995, 3, 371–388. [Google Scholar] [CrossRef]
  38. Imani, H.N. The Use of Real-Time Connected Vehicles and HERE Data in Developing an Automated Freeway Incident Detection Algorithm. Master’s Thesis, University of North Florida, Jacksonville, FL, USA, 2019. Available online: https://digitalcommons.unf.edu/etd/929 (accessed on 12 April 2022).
  39. Collins, J.F.; Hopkins, C.M.; Martin, J.A. Automatic Incident Detection: TRRL Algorithms HIOCC and PATREG; Transport and Road Research Laboratory: Crowthorne, UK, 1979. [Google Scholar]
  40. Masters, P.H.; Lam, J.K.; Wong, K. Incident Detection Algorithms for COMPASS—An Advanced Traffic Management System. In Proceedings of the Vehicle Navigation and Information Systems Conference, Troy, MI, USA, 20–23 October 1991; Volume 2, pp. 295–310. [Google Scholar] [CrossRef]
  41. Martin, P.T.; Perrin, J.; Hansen, B.; Kump, R.; Moore, D. Incident Detection Algorithm Evaluation; MPC-01-122; Utah Department of Transportation: Taylorsville, UT, USA, 2001. [Google Scholar]
  42. Liu, Q.; Chung, E.; Zhai, L. Fusing Moving Average Model and Stationary Wavelet Decomposition for Automatic Incident Detection: Case Study of Tokyo Expressway. J. Traffic Transp. Eng. 2014, 1, 404–414. [Google Scholar] [CrossRef] [Green Version]
  43. Bakioğlu, G.; Silgu, M.A.; Özcanan, S.; Gökaşar, I.; Büyük, M.; Çelikoğlu, H.B.; Osman, A. Incident Detection Algorithms: A Literature Review. In Proceedings of the 1st IRF Europe & Central Asia Regional Congress & Exhibition, Istanbul, Turkey, 15–18 September 2015. [Google Scholar]
  44. Lyall, B. Performance Evaluation of the Mc Master Incident Detection Algorithm. Ph.D. Thesis, McMaster University, Hamilton, ON, Canada, 1991. [Google Scholar]
  45. Cohen, S.; Ketselidou, Z. A Calibration Process for Automatic Incident Detection Algorithms. In Microcomputers in Transportation; ASCE: Reston, VA, USA, 1993; pp. 506–515. [Google Scholar]
  46. Guo, W.; Wang, Z.; Wang, W.; Bubb, H. Traffic Incident Automatic Detection Algorithms by Using Loop Detector in Urban Roads. Recent Patents Comput. Sci. 2015, 8, 41–48. [Google Scholar] [CrossRef]
  47. Athol, P. Interdependence of Certain Operational Characteristics within a Moving Traffic Stream. Highw. Res. Rec. 1965, 72, 58–87. [Google Scholar]
  48. Persaud, B.N.; Hall, F.L. Catastrophe Theory and Patterns in 30-Second Freeway Traffic Data—Implications for Incident Detection. Transp. Res. Part A Gen. 1989, 23, 103–113. [Google Scholar] [CrossRef]
  49. Stephanedes, Y.J.; Chassiakos, A.P. Application of Filtering Techniques for Incident Detection. J. Transp. Eng. 1993, 119, 13–26. [Google Scholar] [CrossRef]
  50. Margreiter, M.; Spangler, M.; Zeh, T.; Carstensen, C. Bluetooth-Measured Travel Times for Dynamic Re-Routing. In Proceedings of the Annual International Conference on ACE 2015 Singapore, Singapore, 13–14 April 2015. [Google Scholar] [CrossRef]
  51. Karatsoli, M.; Margreiter, M.; Spangler, M. Bluetooth-Based Travel Times for Automatic Incident Detection—A Systematic Description of the Characteristics for Traffic Management Purposes. Transp. Res. Procedia 2017, 24, 204–211. [Google Scholar] [CrossRef]
  52. Nikolaev, A.B.; Sapego, Y.S.; Ivakhnenko, A.M.; Mel’nikova, T.E.; Stroganov, V.Y. Analysis of the Incident Detection Technologies and Algorithms in Intelligent Transport Systems. Int. J. Appl. Eng. Res. 2017, 12, 4765–4774. [Google Scholar]
  53. Sun, Z.; Bebis, G.; Miller, R. On-Road Vehicle Detection: A Review. IEEE Trans. Pattern Anal. Mach. Intell. 2006, 28, 694–711. [Google Scholar] [CrossRef]
  54. Li, Y.; McDonald, M. Motorway Incident Detection Using Probe Vehicles. Proc. Inst. Civ. Eng. Transp. 2005, 158, 11–15. [Google Scholar] [CrossRef]
  55. Asakura, Y.; Kusakabe, T.; Nguyen, L.X.; Ushiki, T. Incident Detection Methods Using Probe Vehicles with On-Board GPS Equipment. Transp. Res. Part C Emerg. Technol. 2017, 81, 330–341. [Google Scholar] [CrossRef]
  56. Houbraken, M.; Logghe, S.; Schreuder, M.; Audenaert, P.; Colle, D.; Pickavet, M. Automated Incident Detection Using Real-Time Floating Car Data. J. Adv. Transp. 2017, 2017, 1–13. [Google Scholar] [CrossRef] [Green Version]
  57. Liang, Z.; Chen, H.; Song, Z.; Zhou, Y.; Zhang, B. Traffic Congestion Incident Detection and Dissipation Algorithm for Urban Intersection Based on FCD. In Proceedings of the 2017 3rd IEEE International Conference on Computer and Communications (ICCC), Chengdu, China, 13–16 December 2017; pp. 2578–2583. [Google Scholar] [CrossRef]
  58. Han, X.; Grubenmann, T.; Cheng, R.; Wong, S.C.; Li, X.; Sun, W. Traffic Incident Detection: A Trajectory-Based Approach. In Proceedings of the 2020 IEEE 36th International Conference on Data Engineering (ICDE), Dallas, TX, USA, 20–24 April 2020; IEEE: Piscataway, NJ, USA, 2020; pp. 1866–1869. [Google Scholar] [CrossRef]
  59. Asakura, Y.; Kusakabe, T.; Long, N.X.; Ushiki, T. Incident Detection Methods Using Probe Vehicles with On-Board GPS Equipment. Transp. Res. Procedia 2015, 6, 17–27. [Google Scholar] [CrossRef]
  60. Fogue, M.; Garrido, P.; Martinez, F.J.; Cano, J.; Calafate, C.T.; Manzoni, P. Automatic Accident Detection: Assistance Through Communication Technologies and Vehicles. IEEE Veh. Technol. Mag. 2012, 7, 90–100. [Google Scholar] [CrossRef]
  61. Fernandes, B.; Gomes, V.; Ferreira, J.; Oliveira, A. Mobile Application for Automatic Accident Detection and Multimodal Alert. In Proceedings of the 2015 IEEE 81st Vehicular Technology Conference (VTC Spring), Glasgow, UK, 11–14 May 2015; pp. 1–5. [Google Scholar] [CrossRef]
  62. Bossom, R.; Brignolo, R.; Ernst, T.; Evensen, K.; Frötscher, A.; Höfs, W.; Jeftic, Z.; Jääskeläinen, J.; Kompfner, P.; Kosch, T.; et al. D31 European ITS Communication Architecture-Overall Framework–Proof of Concept Implementation; FP6-027377; BMW Group Research and Technology: München, Germany, 2009. [Google Scholar]
  63. Cesana, M.; Fratta, L.; Gerla, M.; Giordano, E.; Pau, G. C-VeT the UCLA Campus Vehicular Testbed: Integration of VANET and Mesh Networks. In Proceedings of the 2010 European Wireless Conference (EW), Lucca, Italy, 12–15 April 2010; pp. 689–695. [Google Scholar] [CrossRef]
  64. Welcome to OnStar. Available online: https://www.onstar.com/us/en/home/ (accessed on 15 April 2021).
  65. Grzeszczyk, R.; Merkisz, J.; Bogus, P.; Kaminski, T. Methods and Procedures for Testing the E-Call in-Vehicle Unit for the Purpose of Its Performance Assessment and Certification. In Proceedings of the 21st International Technical Conference on the Enhanced Safety of Vehicles (ESV), Stuttgart, Germany, 15–18 June 2009. [Google Scholar]
  66. Ahuja, L. Automatic Incident Detection (AID). Master’s Thesis, Iowa State University, Ames, IA, USA, 2018. [Google Scholar]
  67. Chakraborty, P.; Hegde, C.; Sharma, A. Data-Driven Parallelizable Traffic Incident Detection Using Spatio-Temporally Denoised Robust Thresholds. Transp. Res. Part C Emerg. Technol. 2019, 105, 81–99. [Google Scholar] [CrossRef] [Green Version]
  68. Chakraborty, P.; Sharma, A.; Knickerbocker, S.; Hess, J. Outlier Mining Based Traffic Incident Detection Using Big Data Analytics. In Proceedings of the 96th Annual Meeting Transportation Research Board, Washington, DC, USA, 8–12 January 2017. [Google Scholar]
  69. Federal Highway Administration. Traffic Congestion and Reliability: Trends and Advanced Strategies for Congestion Mitigation; FHWA-HOP-05-064; Federal Highway Administration: Washington, DC, USA, 2005. [Google Scholar]
  70. Ahmed, S.A.; Cook, A. Application of Time-Series Analysis Techniques to Freeway Incident DETECTION. Transp. Res. Rec. 1982, 841, 19–21. [Google Scholar]
  71. Cook, A.R.; Cleveland, D.E. The Detection of Freeway Capacity Reducing Incidents by Traffic Stream Measurements; HSRI Report No. TrS-1; The University of Michigan: Ann Arbor, MI, USA, 1970; Volume 138. [Google Scholar] [CrossRef]
  72. Deniz, O.; Celikoglu, H.B. Overview to Some Existing Incident Detection Algorithms: A Comparative Evaluation. Procedia Soc. Behav. Sci. 2011, 2, 153–168. [Google Scholar]
  73. Ahmed, S.A.; Cook, A.R. Time Series Models for Freeway Incident Detection. Transp. Eng. J. ASCE 1980, 106, 731–745. [Google Scholar] [CrossRef]
  74. Ahmed, M.S.; Cook, A.R. Analysis of Freeway Traffic Time-Series Data by Using Box-Jenkins Techniques. Transp. Res. Rec. 1997, 722, 1–9. [Google Scholar]
  75. Li, H.; Li, S.; Zhu, H.; Zhao, X.; Zhang, X. Automated Detection Algorithm for Traffic Incident in Urban Expressway Based on Lengthways Time Series. In Green Intelligent Transportation Systems; Springer: Singapore, 2019; Volume 503, pp. 625–633. [Google Scholar] [CrossRef]
  76. Niu, S.-F.; Jiang, G.-Y.; Li, H.-W.; Jiang, H. Automated Detection Algorithm for Traffic Incident in Urban Expressway Based on Lengthways Time Series of Traffic Parameters. Ha’erbin Gong Ye Da Xue Xue Bao 2011, 43, 144–148. [Google Scholar]
  77. Olugbade, S.; Ojo, S.; Imoize, A.L.; Isabona, J.; Alaba, M.O. A Review of Artificial Intelligence and Machine Learning for Incident Detectors in Road Transport Systems. Math. Comput. Appl. 2022, 27, 77. [Google Scholar] [CrossRef]
  78. Yuan, T.; Rocha Neto, W.; Rothenberg, C.E.; Obraczka, K.; Barakat, C.; Turletti, T. Machine Learning for Next-generation Intelligent Transportation Systems: A Survey. Trans. Emerg. Telecommun. Technol. 2022, 33, 1–35. [Google Scholar] [CrossRef]
  79. Šusteková, D.; Knutelská, M. How Is the Artificial Intelligence Used in Applications for Traffic Management. Mach. Technol. Mater. 2015, 9, 49–52. [Google Scholar]
  80. Olayode, O.I.; Tartibu, L.K.; Okwu, M.O. Application of Artificial Intelligence in Traffic Control System of Non-Autonomous Vehicles at Signalized Road Intersection. Procedia CIRP 2020, 91, 194–200. [Google Scholar] [CrossRef]
  81. Rusyaidi, M.; Ibrahim, Z. A Review: An Evaluation of Current Artificial Intelligent Methods in Traffic Flow Prediction. IOP Conf. Ser. Mater. Sci. Eng. 2020, 917, 012063. [Google Scholar] [CrossRef]
  82. Gamel, S.A.; Saleh, A.I.; Ali, H.A. Machine Learning-Based Traffic Management Techniques for Intelligent Transportation System: Review. Nile J. Commun. Comput. Sci. 2021, 1, 9–18. [Google Scholar]
  83. Nama, M.; Nath, A.; Bechra, N.; Bhatia, J.; Tanwar, S.; Chaturvedi, M.; Sadoun, B. Machine Learning-based Traffic Scheduling Techniques for Intelligent Transportation System: Opportunities and Challenges. Int. J. Commun. Syst. 2021, 34, e4814. [Google Scholar] [CrossRef]
  84. Sharma, S.; Harit, S.; Kaur, J. Traffic Accident Detection Using Machine Learning Algorithms. In Proceedings of Third International Conference on Sustainable Computing SUSCOM-2021; Springer: Jaipur, India, 2021; pp. 501–507. [Google Scholar] [CrossRef]
  85. Mani, D.; Amrith, P.; Umamaheswari, E.; Ajay, D.M.; Anitha, R.U. Smart Detection of Vehicle Accidents Using Object Identification Sensors with Artificial Intelligent Systems. Int. J. Recent Technol. Eng. 2019, 7, 375–379. [Google Scholar]
  86. Huang, T.; Wang, S.; Sharma, A. Highway Crash Detection and Risk Estimation Using Deep Learning. Accid. Anal. Prev. 2020, 135, 105392. [Google Scholar] [CrossRef]
  87. Jin, X.; Srinivasan, D.; Cheu, R.L. Classification of Freeway Traffic Patterns for Incident Detection Using Constructive Probabilistic Neural Networks. IEEE Trans. Neural Netw. 2001, 12, 1173–1187. [Google Scholar] [CrossRef]
  88. McCulloch, W.S.; Pitts, W.H. A Logical Calculus of the Ideas Immanent in Nervous Activity. Bull. Math. Biophys. 1943, 5, 115–133. [Google Scholar] [CrossRef]
  89. Hardesty, L. Explained: Neural Networks. MIT News|Massachusetts Institute of Technology. Available online: https://news.mit.edu/2017/explained-neural-networks-deep-learning-0414 (accessed on 27 December 2021).
  90. What Are Neural Networks? Available online: https://www.ibm.com/cloud/learn/neural-networks (accessed on 27 December 2021).
  91. Wang, L.; Zhao, J.; Mortier, R. Neural Network. In OCaml Scientific Computing; Springer: Cham, Switzerland, 2022; pp. 219–242. [Google Scholar] [CrossRef]
  92. Hopfield, J.J. Neural Networks and Physical Systems with Emergent Collective Computational Abilities. Proc. Natl. Acad. Sci. USA 1982, 79, 2554–2558. [Google Scholar] [CrossRef] [PubMed] [Green Version]
  93. Cheu, R.L.; Ritchie, S.G.; Recker, W.W.; Bavarian, B. Investigation of a Neural Network Model for Freeway Incident Detection; National Academies Press: Washington, DC, USA, 1991. [Google Scholar]
  94. Dia, H.; Rose, G. Development and Evaluation of Neural Network Freeway Incident Detection Models Using Field Data. Transp. Res. Part C Emerg. Technol. 1997, 5, 313–331. [Google Scholar] [CrossRef]
  95. Abdulhai, B.; Ritchie, S.G. Enhancing the Universality and Transferability of Freeway Incident Detection Using a Bayesian-Based Neural Network. Transp. Res. Part C Emerg. Technol. 1999, 7, 261–280. [Google Scholar] [CrossRef]
  96. Zyryanov, V.V. Incidents Detection on City Roads. IOP Conf. Ser. Mater. Sci. Eng. 2020, 913, 42065. [Google Scholar] [CrossRef]
  97. Gupta, G.; Singh, R.; Singh Patel, A.; Ojha, M. Accident Detection Using Time-Distributed Model in Videos. In Proceedings of the Fifth International Congress on Information and Communication Technology, London, UK, 20–21 February 2020; Yang, X.-S., Sherratt, S., Dey, N., Joshi, A., Eds.; Springer: Singapore, 2021; pp. 214–223. [Google Scholar]
  98. Hochreiter, S.; Schmidhuber, J. Long Short-Term Memory. Neural Comput. 1997, 9, 1735–1780. [Google Scholar] [CrossRef]
  99. Jin, X.; Cheu, R.L.; Srinivasan, D. Development and Adaptation of Constructive Probabilistic Neural Network in Freeway Incident Detection. Transp. Res. Part C Emerg. Technol. 2002, 10, 121–147. [Google Scholar] [CrossRef]
  100. Lin, Y.; Li, L.; Jing, H.; Ran, B.; Sun, D. Automated Traffic Incident Detection with a Smaller Dataset Based on Generative Adversarial Networks. Accid. Anal. Prev. 2020, 144, 105628. [Google Scholar] [CrossRef]
  101. Li, L.; Lin, Y.; Du, B.; Yang, F.; Ran, B. Real-Time Traffic Incident Detection Based on a Hybrid Deep Learning Model. Transp. A 2022, 18, 78–98. [Google Scholar] [CrossRef]
  102. Zadeh, L.A. Fuzzy Logic = Computing with Words. IEEE Trans. Fuzzy Syst. 1996, 4, 103–111. [Google Scholar] [CrossRef] [Green Version]
  103. Zadeh, L.A. Fuzzy Algorithms. Inf. Control 1968, 12, 94–102. [Google Scholar] [CrossRef] [Green Version]
  104. Zadeh, L.A. Fuzzy Sets. Inf. Control 1965, 8, 338–353. [Google Scholar] [CrossRef] [Green Version]
  105. Zadeh, L.A. Fuzzy Sets and Systems. Int. J. Gen. Syst. 1990, 17, 129–138. [Google Scholar] [CrossRef]
  106. Mendel, J.M. Fuzzy Logic Systems for Engineering: A Tutorial. Proc. IEEE 1995, 83, 345–377. [Google Scholar] [CrossRef]
  107. Hüllermeier, E. Does Machine Learning Need Fuzzy Logic? Fuzzy Sets Syst. 2015, 281, 292–299. [Google Scholar] [CrossRef]
  108. Klir, G.J. Fuzzy Logic. IEEE Potentials 1995, 14, 10–15. [Google Scholar] [CrossRef]
  109. Albertos, P.; Sala, A.; Olivares, M. Fuzzy Logic Controllers. Methodology. Advantages and Drawbacks. In Proceedings of the Congreso Español Sobre Tecnologías y Lógica Fuzzy, Sevilla, Spain, 20–22 September 2000; pp. 1–11. [Google Scholar]
  110. Jantzen, J. Foundations of Fuzzy Control: A Practical Approach: Second Edition; Wiley Online Library: Chichester, UK, 2013. [Google Scholar] [CrossRef]
  111. Bai, Y.; Wang, D. Fundamentals of Fuzzy Logic Control—Fuzzy Sets, Fuzzy Rules and Defuzzifications. In Advanced Fuzzy Logic Technologies in Industrial Applications; Springer: London, UK, 2006. [Google Scholar] [CrossRef]
  112. Nedjah, N.; de Macedo Mourelle, L. Fuzzy Systems Engineering: Theory and Practice; Springer Science & Business Media: Berlin, Germany, 2005; Volume 181. [Google Scholar]
  113. Reshaping the World with Fuzzy Logic Reshaping the World with Fuzzy Logic. Available online: http://www.weareworldquant.com (accessed on 21 November 2021).
  114. Nguyen, D.-B.; Dow, C.-R.; Hwang, S.-F. An Efficient Traffic Congestion Monitoring System on Internet of Vehicles. Wirel. Commun. Mob. Comput. 2018, 2018, 1–17. [Google Scholar] [CrossRef]
  115. Mustafa, F.W.F. An Application of Fuzzy Logic in Urban Traffic Incident Detection. Master’s Thesis, United Arab Emirates University, Al Ain, United Arab Emirates, 2015. [Google Scholar]
  116. Rossi, R.; Gastaldi, M.; Gecchele, G.; Barbaro, V. Fuzzy Logic-Based Incident Detection System Using Loop Detectors Data. Transp. Res. Procedia 2015, 10, 266–275. [Google Scholar] [CrossRef]
  117. Ahmed, F.; Hawas, Y.E. A Fuzzy Logic Model for Real-Time Incident Detection in Urban Road Network. In Proceedings of the 5th International Conference on Agents and Artificial Intelligence, Barcelona, Spain, 15–18 February 2013; Volume 2, pp. 465–472. [Google Scholar] [CrossRef]
  118. Lee, S.; Krammes, R.A.; Yen, J. Fuzzy-Logic-Based Incident Detection for Signalized Diamond Interchanges. Transp. Res. Part C Emerg. Technol. 1998, 6, 359–377. [Google Scholar] [CrossRef]
  119. Cortes, C.; Vapnik, V. Support-Vector Networks. Mach. Learn. 1995, 20, 273–297. [Google Scholar] [CrossRef]
  120. Jeyakumar, V.; Li, G.; Suthaharan, S. Support Vector Machine Classifiers with Uncertain Knowledge Sets via Robust Optimization. Optimization 2014, 63, 1099–1116. [Google Scholar] [CrossRef]
  121. Bharath Kumar, M.; Basit, A.; Kiruba, M.B.; Giridharan, R.; Keerthana, S.M. Road Accident Detection Using Machine Learning. In Proceedings of the 2021 International Conference on System, Computation, Automation and Networking (ICSCAN), Puducherry, India, 30–31 July 2021; pp. 2–6. [Google Scholar] [CrossRef]
  122. Hsu, C.-W.; Chang, C.-C.; Lin, C.-J. A Practical Guide to Support Vector Classification; University of National Taiwan: Taipei, Taiwan, 2003. [Google Scholar]
  123. Yuan, F.; Cheu, R.L. Incident Detection Using Support Vector Machines. Transp. Res. Part C Emerg. Technol. 2003, 11, 309–328. [Google Scholar] [CrossRef]
  124. Ruppert, D. The Elements of Statistical Learning: Data Mining, Inference, and Prediction, 2nd ed.; Springer: New York, NY, USA, 2004; Volume 99. [Google Scholar] [CrossRef]
  125. Ho, T.K. Random Decision Forests. In Proceedings of the International Conference on Document Analysis and Recognition, ICDAR, Montreal, QC, Canada, 14–16 August 1995; Volume 1, pp. 278–282. [Google Scholar] [CrossRef]
  126. Sharda, R.; Voß, S.; Suthaharan, S. Machine Learning Models and Algorithms for Big Data Classification; Thinking with Examples for Effective Learning; Springer: New York, NY, USA, 2019; ISBN 978-1-4899-7641-3. [Google Scholar]
  127. Breiman, L. Random Forests. Mach. Learn. 2001, 45, 5–32. [Google Scholar] [CrossRef] [Green Version]
  128. Random Forest Algorithm. Available online: https://www.simplilearn.com/tutorials/machine-learning-tutorial/random-forest-algorithm?tag=randomforest (accessed on 8 May 2021).
  129. Iqbal, Z.; Khan, M.I.; Hussain, S.; Habib, A. An Efficient Traffic Incident Detection and Classification Framework by Leveraging the Efficacy of Model Stacking. Complexity 2021, 2021, 1–17. [Google Scholar] [CrossRef]
  130. Mahmassani, H.S.; Haas, C.; Zhou, S.; Peterman, J. Evaluation of Incident Detection Methodologies; FHWA/TX-00/1795-1; University of Texas at Austin: Austin, TX, USA, 1999. [Google Scholar]
  131. Bao, L.; Wang, Q.; Qu, W.; Mo, X. Research on Highway Traffic Event Detection Method Based on Image Processing. IOP Conf. Ser. Earth Environ. Sci. 2021, 791, 012193. [Google Scholar] [CrossRef]
  132. Mimbela, L.E.Y.; Klein, L.A. Summary Of Vehicle Detection And Surveillance Technologies Used in Intelligent Transportation Systems; Joint Program Office for Intelligent Transportation Systems; U.S. Department of Transportation: Washington, DC, USA, 2000. [Google Scholar]
  133. Ren, J.; Chen, Y.; Xin, L.; Shi, J.; Li, B.; Liu, Y. Detecting and Positioning of Traffic Incidents via Video-Based Analysis of Traffic States in a Road Segment. IET Intell. Transp. Syst. 2016, 10, 428–437. [Google Scholar] [CrossRef]
  134. Michalopoulos, P.G. Vehicle Detection Video Through Image Processing: The Autoscope System. IEEE Trans. Veh. Technol. 1991, 40, 21–29. [Google Scholar] [CrossRef]
  135. Michalopoulos, P.G.; Jacobson, R.D.; Anderson, C.A.; DeBruycker, T.B. Automatic Incident Detection through Video Image Processing. Traffic Eng. Control 1993, 34, 66–75. [Google Scholar]
  136. Hall, F.L.; Barrow, D. Effect of Weather on the Relationship between Flow and Occupancy on Freeways. Transp. Res. Rec. 1988, 1194, 55–63. [Google Scholar]
  137. Potash, C.B.; Brown, J.R. Fog Mitigation Update: Fog Mitigation Measures as Applied to Highway Bridge Structures. Transp. Res. Rec. 1988, 1172, 74–77. [Google Scholar]
  138. Evans, L. The Dominant Role of Driver Behavior in Traffic Safety. Am. J. Public Health 1996, 86, 784–786. [Google Scholar] [CrossRef] [PubMed]
  139. National Highway Transportation Safety Administration (NHTSA). 2016 Fatal Motor Vehicle Crashes: Overview; DOT HS 812 456; NHTSA’s National Center for Statistics and Analysis: Washington, DC, USA, 2017. [Google Scholar]
  140. Liu, W.; Li, H.; Zhang, H. Dangerous Driving Behavior Recognition Based on Hand Trajectory. Sustainability 2022, 14, 12355. [Google Scholar] [CrossRef]
  141. Elsahly, O.; Abdelfatah, A. Effects of Automated Vehicles on Freeway Traffic Performance. Wulfenia J. 2020, 27, 83–107. [Google Scholar]
  142. Bottlinger, J. How Poor Vehicle Maintenance Leads to Traffic Accidents. Available online: https://www.bottlingerlaw.com/blog/how-poor-vehicle-maintenance-leads-to-traffic-accidents/ (accessed on 22 October 2022).
  143. Lopez Conde, M.; Twinn, I. How Artificial Intelligence Is Making Transport Safer, Cleaner, More Reliable and Efficient in Emerging Markets; World Bank Group, International Finance Corporation: Washington, DC, USA, November 2019. [Google Scholar]
Figure 1. Roadway segments during a traffic incident. Adapted from [19].
Sustainability 14 14859 g001
Figure 2. Flow–speed relationship model. Adapted from [20].
Sustainability 14 14859 g002
Figure 3. Incident’s impact on the flow at the upstream and downstream sections.
Sustainability 14 14859 g003
Figure 4. Incident’s impact on the traffic speed at the upstream and downstream sections.
Sustainability 14 14859 g004
Figure 5. Incident’s impact on the occupancy at the upstream and downstream sections.
Sustainability 14 14859 g005
Figure 6. Incident’s timeline. Adapted from [30].
Sustainability 14 14859 g006
Figure 7. Resource selection process.
Sustainability 14 14859 g007
Figure 8. Year-wise publication trend.
Sustainability 14 14859 g008
Figure 9. Number of documents per country.
Sustainability 14 14859 g009
Figure 10. Diagram of California algorithm. Adopted from [42].
Sustainability 14 14859 g010
Figure 11. APID algorithm scheme. Adopted from [40].
Sustainability 14 14859 g011
Figure 12. Architecture of fuzzy logic system. Adopted from [113].
Sustainability 14 14859 g012
Figure 13. Random Forest algorithm. Adopted from [128].
Sustainability 14 14859 g013
Figure 14. Flowchart of video–image incident detection [133].
Sustainability 14 14859 g014
Table 1. Advantages and disadvantages of incident detection algorithms.
CategoryContributions and Advantages Limitations and Drawbacks
Comparative algorithmsCalifornia algorithms Look for discrepancies in traffic parameters between adjacent loop detectors to identify the presence of an incident [16,38,41,42,43,44,45,46].
It has good DR and a tolerable FAR.
It has a long MTTD that can reach about 4 min [44].
The performance of the algorithm is affected by any malfunction in any detector.
Some factors can cause incident-like patterns and increase the number of false alarms.
McMaster algorithmsOvercome the weaknesses of the California algorithm series [47,48].
It uses the data from a single detector station instead of two adjacent stations and considers the relationship between speed, flow and occupancy.
It is sensitive to severe weather conditions such as rain or snow, which may result in an increase in the number of false alarms.
Minnesota algorithmInvestigates the discontinuity in the average spatial occupancy difference between the two stations over six intervals. The algorithm uses short-term time averages to smooth up the random fluctuations in the data, filter the data, and remove the noise that triggers false alarms, which affects the detection capability of the algorithm [37,49].The detection time can be three minutes or more.
It depends on the occupancy only to detect incidents, which can cause false alarms during low traffic conditions.
Bluetooth based algorithmsUses Bluetooth detectors instead of an inductive loop, which provides a reliable, cost-efficient and fast method for detecting traffic incidents or congestion [50,51].Some factors such as detectors spacing, operating conditions, duration and severity of the incident and the location of the incident relative to the detectors can impact the performance of the algorithm.
GPS-based algorithmsUtilizes driver’s mobile phones or GPS trackers in the vehicles to establish spatio-temporal traces of the vehicles to detect traffic congestion and incidents [52,53].The range and the placement of the sensors can affect the efficiency of the sensors or may cause false alarms.
FCD-based algorithmsUses probe vehicles to collect real-time traffic data and detect the occurrence of incidents.
Cost-effective method that can be used instead of fixed detectors [54,55,56,57,58,59].
Penetration rate of the tracked vehicles on the road and data latency affect the performance of the algorithm.
V2V- and V2I-based algorithmsUse V2V and V2I communications to monitor traffic and detect incidents and congestion [60,61,62,63,64,65].Impacted by the availability of the communications protocols among different entities (vehicles and infrastructure).
Statistical AlgorithmsSND algorithmEvaluates the deviation of a variable from the means to identify potential incidents [14,31,39,41,66].Sensitive to the presence of outliers, which can cause the masking phenomenon.
IQD-based algorithm Overcomes the masking phenomenon in the SND algorithm by using the median or the second quartile instead of the mean and Inter-Quartile score Q instead of the standard deviation to calculate IQD [67,68,69].It is prone to swamping phenomenon, which can increase FAR.
DES algorithmRemoves the noise and heterogeneity from the traffic data to clarify the true traffic patterns to help the system to detect incidents easily and reduce false alarms [30,70,71].It predicts the traffic variables under normal traffic conditions and assumes that the traffic will follow the predicted pattern over time. Additionally, it requires extensive computational efforts.
Time Series AlgorithmsUses historical data of traffic variables to employ statistical short-term forecasting of normal traffic conditions. Significant deviations between the observed and predicted conditions indicate the existence of incidents [39,41,70,72,73,74,75,76].Time-consuming and require extensive computational efforts. Additionally, they assume the traffic follows a predictable pattern over time.
Artificial Intelligence AlgorithmsANN algorithmsUses machine learning to classify the provided traffic data as incident or non-incident situations [19,31,37,93,94,95,96,97,98,99,100,101].The accuracy of the algorithm depends on the performance of the model which needs optimization and tuning.
There is no rule to determine the structure of the network, the appropriate structure is achieved through trial and error.
Fuzzy logic algorithmsDeal with the complex and stochastic nature of traffic variables. They provide the likelihood for an incident [52,114,115,116,117,118].The performance depends on the rules and membership functions that are set.
They completely depend on human knowledge and expertise.
It does not give a clear signal of incident or no incident.
Support Vector MachineProvides a computationally efficient nonlinear classifier that can be used in real-time incident detection [21,35,119,120,121,122,123].The accuracy of the model is highly dependent on the kernel function used. Nevertheless, selecting the appropriate kernel function is complex.
SVM is suitable for large datasets because this will make the training process very time-consuming.
Ensemble Learning AlgorithmsCombine multiple machine learning models to build a powerful prediction model that has better predictive performance than any constituent machine learning model alone [25,35,66,129].The models should be selected carefully to improve the predictive performance of the model.
The ensemble can be complex and less interpretable and can cost more time during creating and training.
Video–image Processing Algorithms Analyze videos of real-time traffic captured by surveillance cameras to detect traffic congestions and incidents [31,41,72,130,131,132,133,134,135].The lighting conditions, extreme weather conditions and coverage range of the camera that is used to capture traffic video have a major impact on the algorithm’s performance [41].
Publisher’s Note: MDPI stays neutral with regard to jurisdictional claims in published maps and institutional affiliations.