Article

A Summary Analysis of Groundwater Vulnerability to Climate Variability and Anthropic Activities in the Haouz Region, Morocco

1
Laboratory of Sciences Applied to the Environment and Sustainable Development, Cadi Ayyad University, Essaouira 20000, Morocco
2
International Water Research Institute, Mohammed VI Polytechnic University, Ben Guerir 43150, Morocco
3
Laboratory of Georesources, Geo-Environments, and Civil Engineering, Cadi Ayyad University, Marrakech 40000, Morocco
*
Author to whom correspondence should be addressed.
Sustainability 2022, 14(22), 14865; https://doi.org/10.3390/su142214865
Submission received: 30 August 2022 / Revised: 5 October 2022 / Accepted: 11 October 2022 / Published: 10 November 2022

Abstract

:
The Haouz aquifer is undergoing climatic aridity and anthropic pressure largely related to the agricultural sector. In this study, special attention was given to the main factors that have a direct impact on the fluctuations of the piezometric level (PL). Different statistical analyses (cross-correlations, PCA, cascading analysis) of the relationship between these factors were applied here. The results identify three distinct groundwater operating systems. The first is manifested in areas dominated by groundwater irrigation. The correlation is insignificant between the PL and surface water (R ≤ ±0.3). The natural balance of the water cycle is then disturbed causing a pronounced deficit in the PL. The second system is perceptible in areas dominated by irrigation from surface water, while the third system is noticeable in Bour areas, cultivated in rainfed mode. For both systems, the hydrological cycle is preserved, and the contribution of surface water to groundwater recharge is noticeable (±0.4 ≤ R ≤ ±1). Drought transfer between the water cycle components occurs in a cascading process for both systems. These results can help decision-makers to identify the risks related to groundwater vulnerability to climatic variability and overexploitation in the Haouz region, allowing for the promotion of efficient groundwater management.

1. Introduction

The scarcity of water resources constitutes a real constraint for the economic and environmental development of countries in the world [1,2]. Unequal access to water can be the source of potential conflicts [3], which require prevention, and sustainable and reasoned management. The Mediterranean is among the regions of the world most affected by drought [4,5], facing increasing social and environmental pressures, thus impacting the current and future water sustainability of the entire area [6].
For several decades, Morocco has known multiple drought episodes resulting in significant rainfall deficits [7]. These periods have significantly increased in frequency, severity and spatial coverage [8], and are contributing to the degradation of the environment and the living conditions of the populations [9,10]. Arid and semi-arid areas are the most affected by drought and climate change effects in Morocco [7,11,12]. These areas suffer from an increasing rainfall deficit and a lack of water stocks [13], which leads to excessive use of water resources, in order to satisfy the growing water requirements of all sectors [14]. This climate situation is compounded by the effect of climate change. According to the fifth report of the Intergovernmental Panel on Climate Change (IPCC), the so-called intermediate (Representative Concentration Pathway) RCP 4.5 and RCP 6.0 emission scenarios, predict a decrease in annual precipitation ranging from 10% to 20% by 2050, associated with an increase in temperatures of up to 2 °C in Morocco [12,15,16]. This trend of decreasing precipitation and increasing temperatures, favoring the effect of evapotranspiration [5,17], along with an increase in water demand, constitutes a real threat to surface water resources, and eventually to the natural recharge of aquifers. As a result, the country’s groundwater has experienced a serious situation of imbalance between supply and discharge in the last 30 years, causing a dramatic drop ranging from 20 to 65 m [18].
Within the same context, the Haouz plain has been suffering for several years from recurrent periods of drought [11,19,20,21], impacting the availability of surface water in dams and watercourses [19] and leading to a decrease in groundwater supplies [22]. This critical situation is compounded by the degradation of the Haouz groundwater quality [18] and the major use of traditional irrigation systems over modern techniques, causing significant water losses [23]. Therefore, the groundwater balance is becoming increasingly deficient according to local water management authorities, rising from an average of −111 Mm3/year in the reference period of 2002–2011 to −297 Mm3/year by 2030, and leading to an estimated decline of −70.1 cm/yr [24]. In order to remedy this deficit, an inter-basin water transfer is made from the Oum Er Rbia basin, intended for agriculture and drinking water supply. This transfer was made without taking into consideration the water stress situation of the Oum Rbia basin, which can be a serious factor of conflict, particularly in periods of drought [10]. The current and future deficit related to this groundwater resource, largely used for irrigation [25], is likely to threaten the sustainability of the agricultural sector, and consequently, will have an indirect economic and social impact [26].
Several studies have been conducted to assess the overexploitation of the Haouz aquifer [19,27,28]. Many others have studied drought occurring in the Haouz plain using statistical techniques, remote sensing datasets and drought-monitoring indexes, to relate meteorological drought to either hydrological, groundwater or agricultural drought [11,20,21,29,30,31,32,33,34,35], which leads to overexploitation of the groundwater. However, previous studies have not considered the cascading effects of drought propagation throughout the water cycle, including the depletion of groundwater reserves. Hence, the present study aims to analyze the interactions between several terrestrial components of the hydrological cycle and their impact on groundwater dynamics and to infer the effects of drought propagation from meteorological to hydrological, agriculture and groundwater through the cascading analysis. This will enable us to better understand the factors that interact in water management and to derive more perspectives in terms of climate change mitigation and water resources management, especially groundwater, using simple, economical and rapid methods, suitable for different types of terrains, aquifers, and areas dimensions. This study helps also to understand the utility of reanalyzed data in conducting efficient analyses and studies, especially in regions with data scarcity such as arid and semi-arid regions. The paucity of data led us to combine remote sensing and ground observation data, related to precipitation, runoff, vegetation development and piezometric level (PL).

2. Study Area

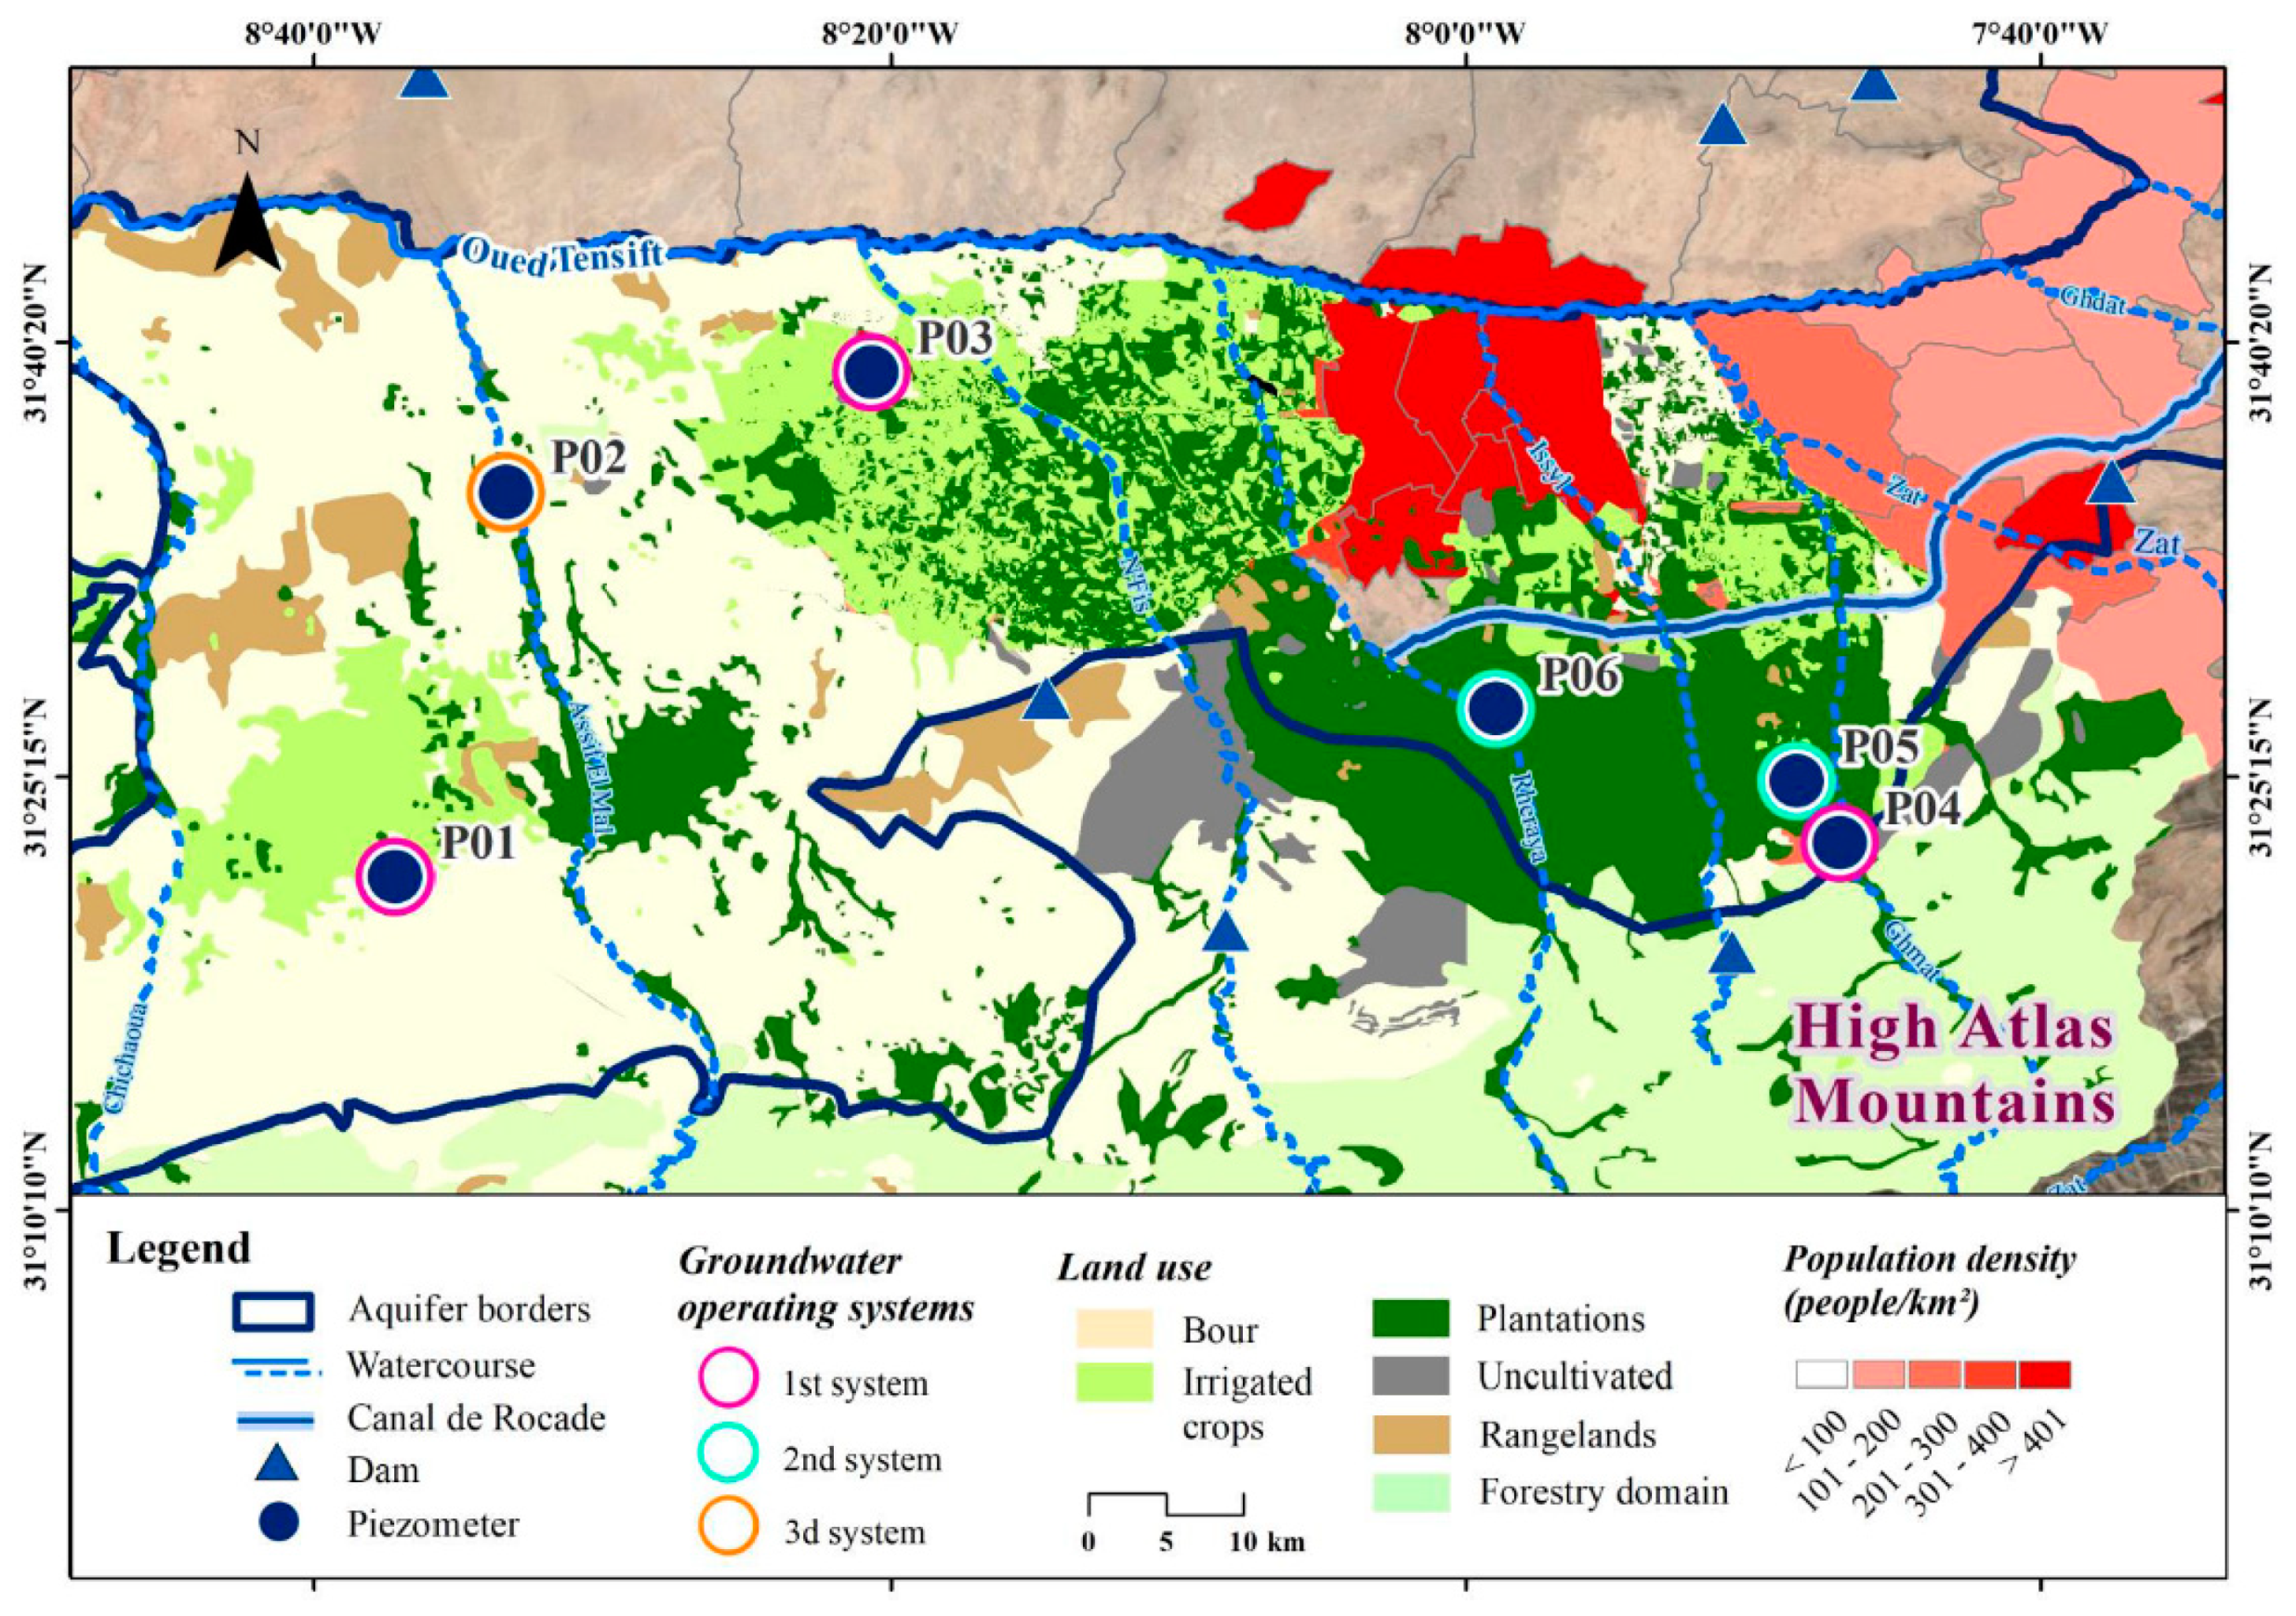
The study area is a part of the central and western Haouz, located at the margin of the High Atlas Mountains. It is bounded to the north by the Tensift River (Oued Tensift), to the south by the High Atlas Mountains, to the east by Oued Ghmat and to the west by Oued Chichaoua (Figure 1). It takes the form of an alluvial depression formed from the Neogene to the recent Quaternary, filled with continental and fluvial detrital formations following the dismantling of the Atlas Mountains, thus covering the primary, secondary and tertiary formations [36]. This has allowed the establishment of a superficial and generalized aquifer that hosts the Haouz groundwater table, on an area of 6859 km² [37]. The groundwater circulation traces a flow going from south to north [38], and varies between 4 m near the watercourses and 80 m away from the rivers [39].
The Haouz Plain is endowed with a dense urban area and a developed rainfed agricultural activity (Figure 2) despite being part of an arid to semi-arid region. The annual rainfall is characterized by a significant spatiotemporal variability not exceeding 350 mm/year [40], and temperatures vary significantly from 5 °C in winter to 38 °C in summer [41]. Irrigated agriculture is also one of the main socio-economic activities of the plain [19], essentially constituted of large hydraulics, small and medium hydraulics, and private irrigation perimeters. Agricultural production consists mainly of arboriculture, cereals, forage crops, and market gardening [42], each with very specific water needs. More than 50% of the irrigated land area and irrigation water demand is devoted to plantations. Forages, consisting mainly of alfalfa, are characterized by a very high water demand [19,43,44], presenting 15% of the total irrigated land area and an irrigation water demand of 28%. Cereals, cultivated mainly in Bour areas, and irrigated in rainfed mode, represent 21% of the surface area for only 13% of the irrigation water demand. Market gardening accounts for 9% of water requirements for 8% of the total area of irrigated land.
As for surface water, the Haouz plain has multiple High Atlas mountain streams that drain into the Oued Tensift, and several large capacity structures that mobilize surface water for irrigation and drinking water supply (Lalla Takerkoust, Yacoub Al Mansour and Abou Abbas Sebti), as well as small dams and hill lakes. All this surface water is unevenly distributed and is mostly affected by drought, except during periods of torrential rains or snowmelt [39]. Therefore, the central part of the plain benefits from a transfer of water from the Oum Er Rbia basin, via the Rocade canal (Canal de Rocade), which remains insufficient to meet the water needs of the agricultural sector, putting pressure on groundwater, that contributes to about half of the irrigation water requirement in a normal year, rising to much higher rates in a dry year [42].

3. Datasets and Methods

3.1. Rainfall and Temperature

Hourly rainfall and temperature data, converted to monthly data for this analysis, are provided by two sources: observed data from the Marrakech station, belonging to the National Met Office (Direction Générale de la Météorologie, DGM), and ERA5 reanalysis data, belonging to the fifth generation of atmospheric global climate reanalyzes produced by the European Centre for Medium-Range Weather Forecasts (ECMWF). The said product provides a globally comprehensive and consistent data set by combining observational and reanalysis data, leading to hourly estimates of a large number of atmospheric, land and ocean climate variables. The reanalysis data were used because of their high spatial resolution of about 30 km and the availability of a long data series ranging from 1979 to the present. However, these data need to be compared and validated with the ground data in order to assess their usefulness for simulating the observed data in the study area.
Indeed, the study conducted by [45] on the evaluation of the performance of multi-source satellite products in the simulation of observed precipitation in the Tensift basin, has shown that the performance of reanalysis products is good in lowland or low altitude areas. This translates into correlation coefficients (R) that increase in low-altitude areas. For three stations in the Haouz plain (Agdal 489 m, Grawa 550 m and Agafay 487 m), the ERA5 data is the best product for estimating daily precipitation.

3.2. Piezometric Level and Surface Water Flow

Monthly piezometric level and surface runoff data were collected from the Tensift Hydraulic Basin Agency. Six piezometers were selected because of their good distribution in the study area, as well as for the availability of long data series that could give rise to detailed analysis (Table 1). The choice of flow measurement stations was based on their proximity to the six piezometers selected for this study.

3.3. Evapotranspiration (ETP)

Evapotranspiration is one of the main components of the water balance [46,47]. It can be defined as the loss of water through the soil and plant surface [48], combining two water transfer processes: Evaporation which is the transfer of water between all types of water surfaces and the atmosphere, and transpiration which constitutes the transfer of water between the plant and the atmosphere [49]. It is the link between water and energy balance at the soil-plant-atmosphere interface [50]. Its knowledge is governed by great importance in water management, especially for arid and semi-arid regions [51].
The monthly evapotranspiration data used for this analysis are from the 6th version of the MODIS product (MOD16A2). They cover the period from 2001 to the present, with a spatial resolution of 500 m and an interval period of 8 days. The algorithm used for this product is based on the Penman-Monteith equation [52], which uses daily weather reanalysis data as inputs as well as the 8-day remotely sensed data [53].

3.4. Normalized Difference Vegetation Index (NDVI) and Leaf Area Index (LAI)

NDVI is one of the most widely used and studied vegetation indices in agriculture [54]. It is based on red and infrared band information [55] to provide insights into plant health and the photosynthetic capacity of the vegetation cover [56]. NDVI values range from 0.1 for bare soil to 0.9 for a dense, fully green canopy [29].
The monthly NDVI data used for this analysis are from the sixth version of the MODIS product (MOD13Q1). They cover the period from 2000 to the present with a spatial resolution of 250 m and an interval period of 16 days. The points selected for the NDVI are the same as the points selected for the piezometers.
Leaf Area Index is defined as the sum of the area of a single green leaf per unit area [57]. It is a dimensionless index that varies according to species type, plant growth, and plant development stage [58]. The monthly LAI data used for this study is a calculated average value for the entire study area obtained from SPOT-Vegetation satellite data of 1 km spatial resolution and 10 days interval period.

4. Statistical Analyses

This study aims to analyze the interactions between several terrestrial components of the hydrological cycle and their impact on groundwater dynamics and to derive the cascading effects of drought propagation from meteorological to hydrological, agricultural and groundwater drought. To do so, we combined satellite and ground observation data related to rainfall, surface runoff, vegetation development and piezometric level. The study is conducted as follows:
  • The first step is to evaluate the ERA5 product, in order to check its utility for simulating the observed rainfall and temperature data in the study area.
  • The second step is to provide a rationale for the choice of the time period selected for the analysis.
  • The third step relates to the principal component analysis of the six selected piezometers, in order to identify those that show the same behavior.
  • The fourth step consists in measuring the information between the time series related to each factor, and drawing their similarities according to the offset of one from the other, through cross-correlation. This method allows us to compare the different time series and determine the lag at which the series are best correlated. The correlation is maximum when the value of the correlation coefficient approaches +1 and −1. A positive correlation indicates that the values of the two factors tend to increase together, while a negative correlation means that the values of one variable tend to increase as the other decreases. The lead-lag effect means that an advanced series is correlated with another lagged series. Time series approaches have been widely used to assess aquifer recharge based on their simplicity and cost efficiency, as well as for their applicability to all types of terrains, climates and aquifers. The cross-correlation method has already been used in a drought-prone region in India to delineate the groundwater recharge zone in hard rock terrains, which was consistent with the result of GIS and remote sensing techniques [59]. It was also used in Korea to analyze the responses of the groundwater to the river stage fluctuations [60] to estimate the relationship between precipitation and water levels [61], and to analyze the influence of precipitation and river stage on groundwater levels [62]. In the Mediterranean, it was used in southern Italy to analyze the relation between karst spring discharge and rainfall [63], and in the Middle Atlas region of Morocco to assess the responses of karst springs to recharge [64].
  • The fifth step consists of analyzing the temporal coevolution of the parameters of rainfall, runoff, vegetation development and piezometric level, in order to identify the presence or absence of a cascading effect between said factors. In fact, drought is one of the limiting factors that impact several aspects of the hydrological cycle [65]. Its propagation is usually felt in one hydrological process before reaching another [66]. In semi-arid regions, a drought episode that results in a precipitation deficit can lead to a reduction in vegetation cover, which in turn will lead to an increase in surface albedo for instance [67]. This was demonstrated by [68], illustrating the propagation of precipitation perturbations through different aspects of the hydrological cycle, leading to a cascading effect. This means that a precipitation deficit leads to a decrease in the runoff, soil moisture, stream flow and piezometric level. This method was applied in California to capture the cascading nature of the hydrological cycle and to make quantitative assessments of the evolution of each hydrological process [66].
The set of points (piezometers, flow measurement stations) for which the correlation was studied is mentioned by the same identifier in Figure 1.

5. Results

5.1. Evaluation of the ERA5 Product

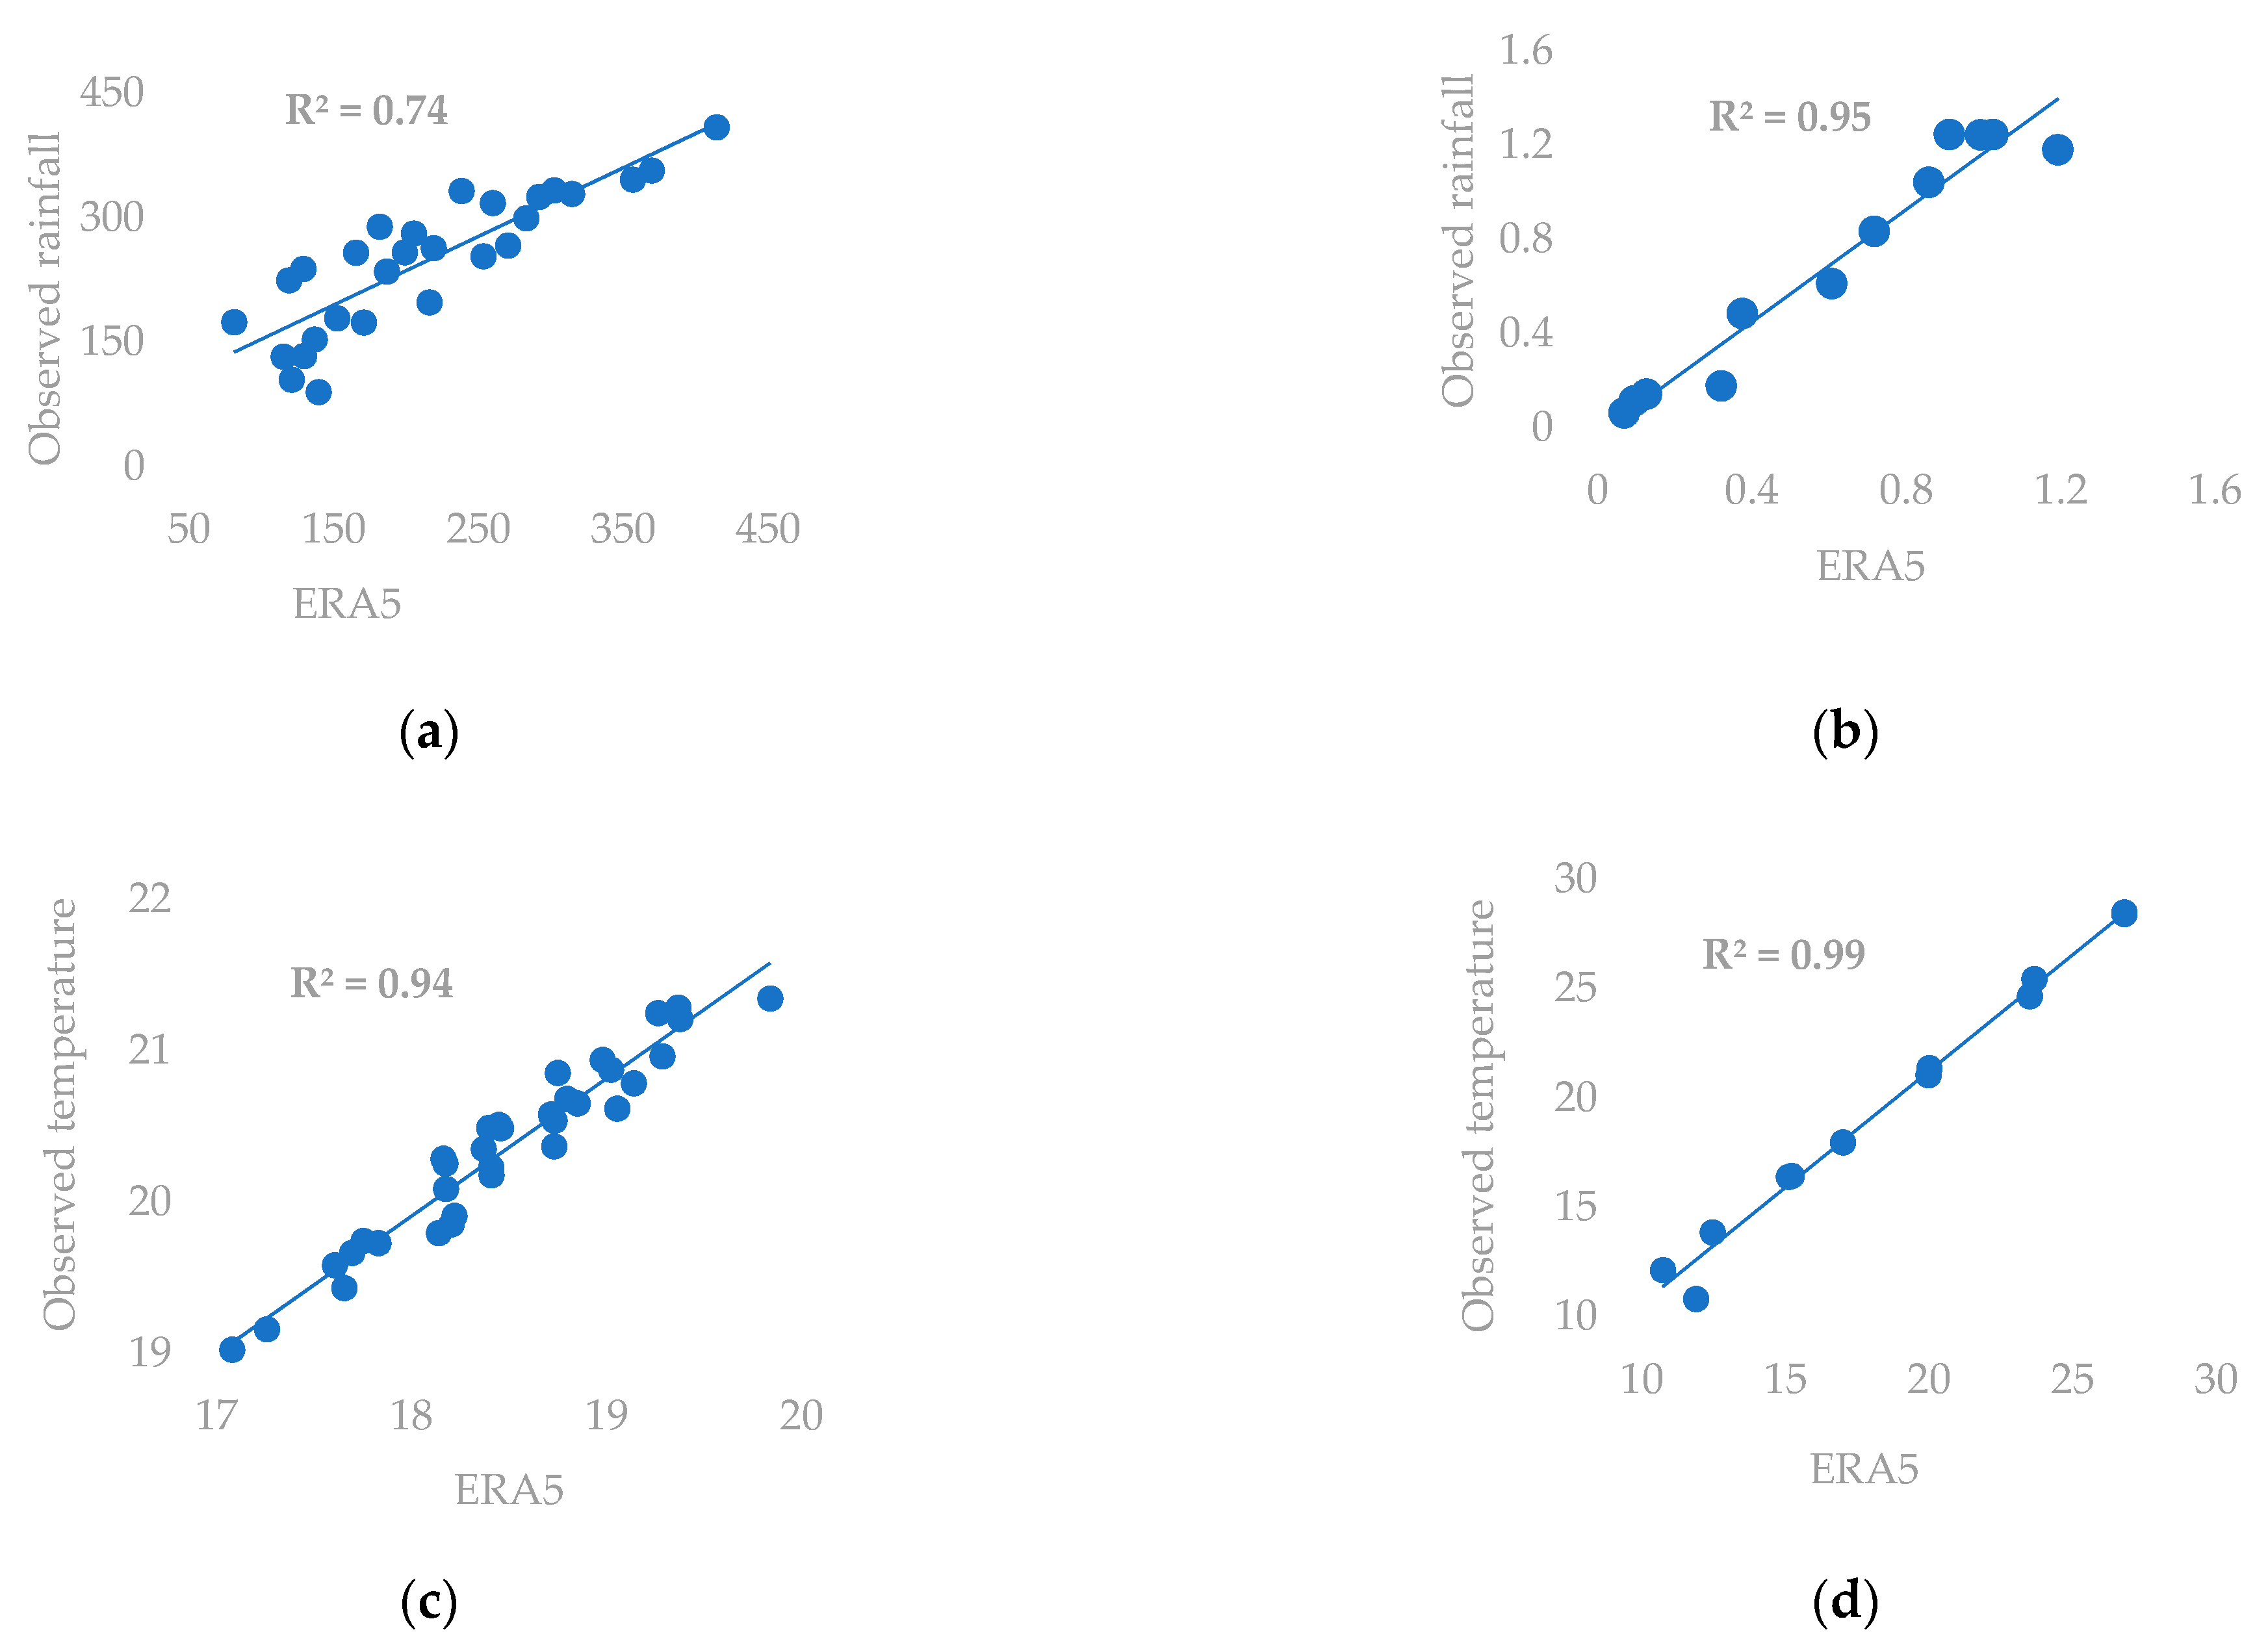
The comparison between observed precipitation and temperature against ERA5 reanalysis over the period 1979–2012 shows overall good correlations (Figure 3), this finding is in parallel with [45], especially for precipitation. The intermonthly averages are calculated as the average of the entire time series for each month. The coefficients of determination are 0.95 for precipitation and 0.99 for temperature. The annual data have coefficients of determination of 0.74 for precipitation and 0.94 for temperature. Therefore, due to the lack of observed data, we considered the reanalysis product for precipitation and temperature in order to spatially represent the two parameters.

5.2. Selection of the Analysis Period

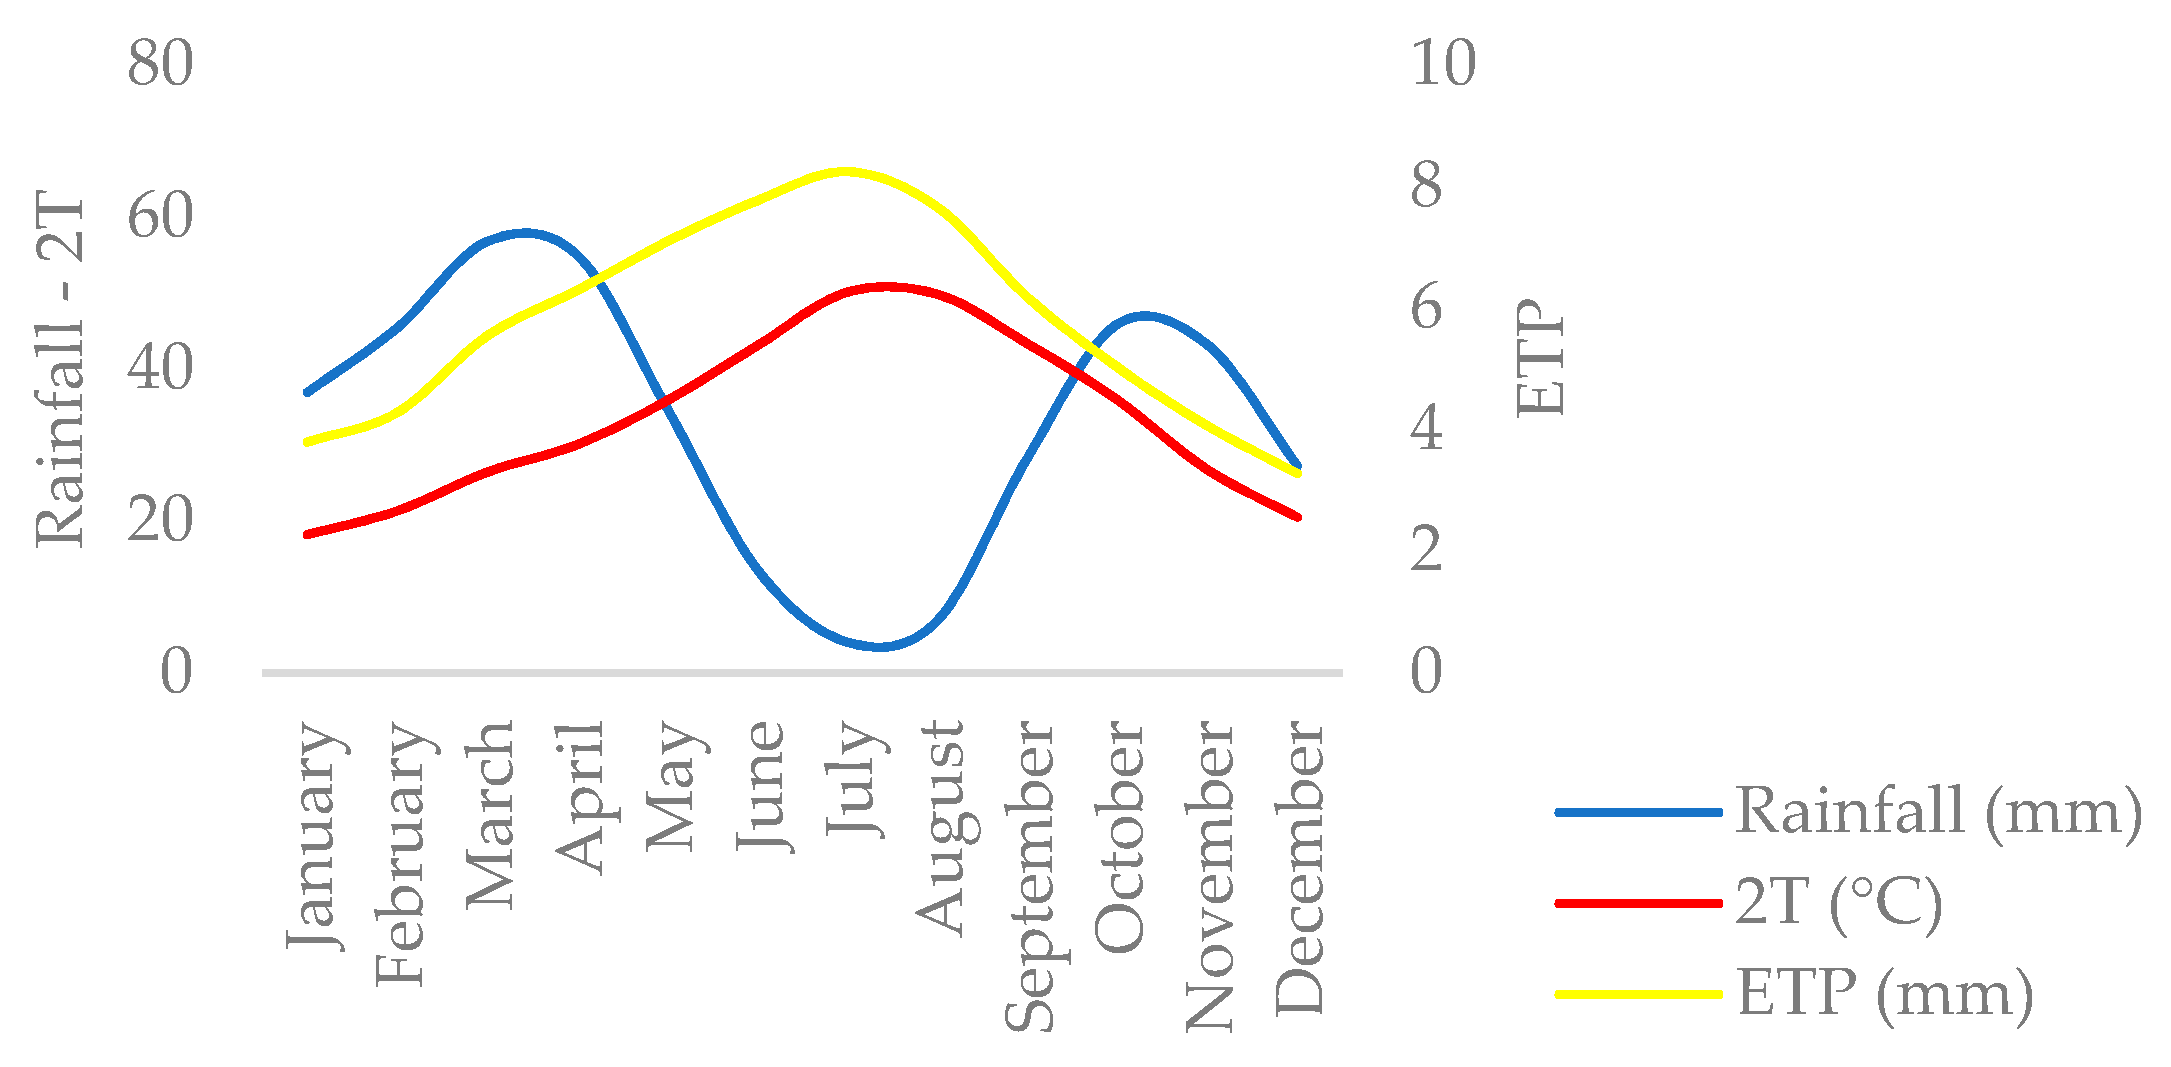
The selected period for the analysis corresponds to the wet season going from November to April. This period was chosen based on the umbrothermal diagram (Figure 4) relating to the study area, on which the evapotranspiration curve line was projected. The remaining months of the year were not taken into consideration because of the importance of evapotranspiration and the scarcity of precipitation during the summer season. These months are considered a source of noisiness that could alter the analysis of the relationship between rainfall and groundwater. However, it is important to underline that flood events that occurred during the autumn and summer seasons play an important role in the water resources availability in the region [29]. The consideration of these restricted events is challenging since we are working on a monthly time step.

5.3. Behavior Analysis of Different Datasets

5.3.1. Principal Component Analysis (PCA)

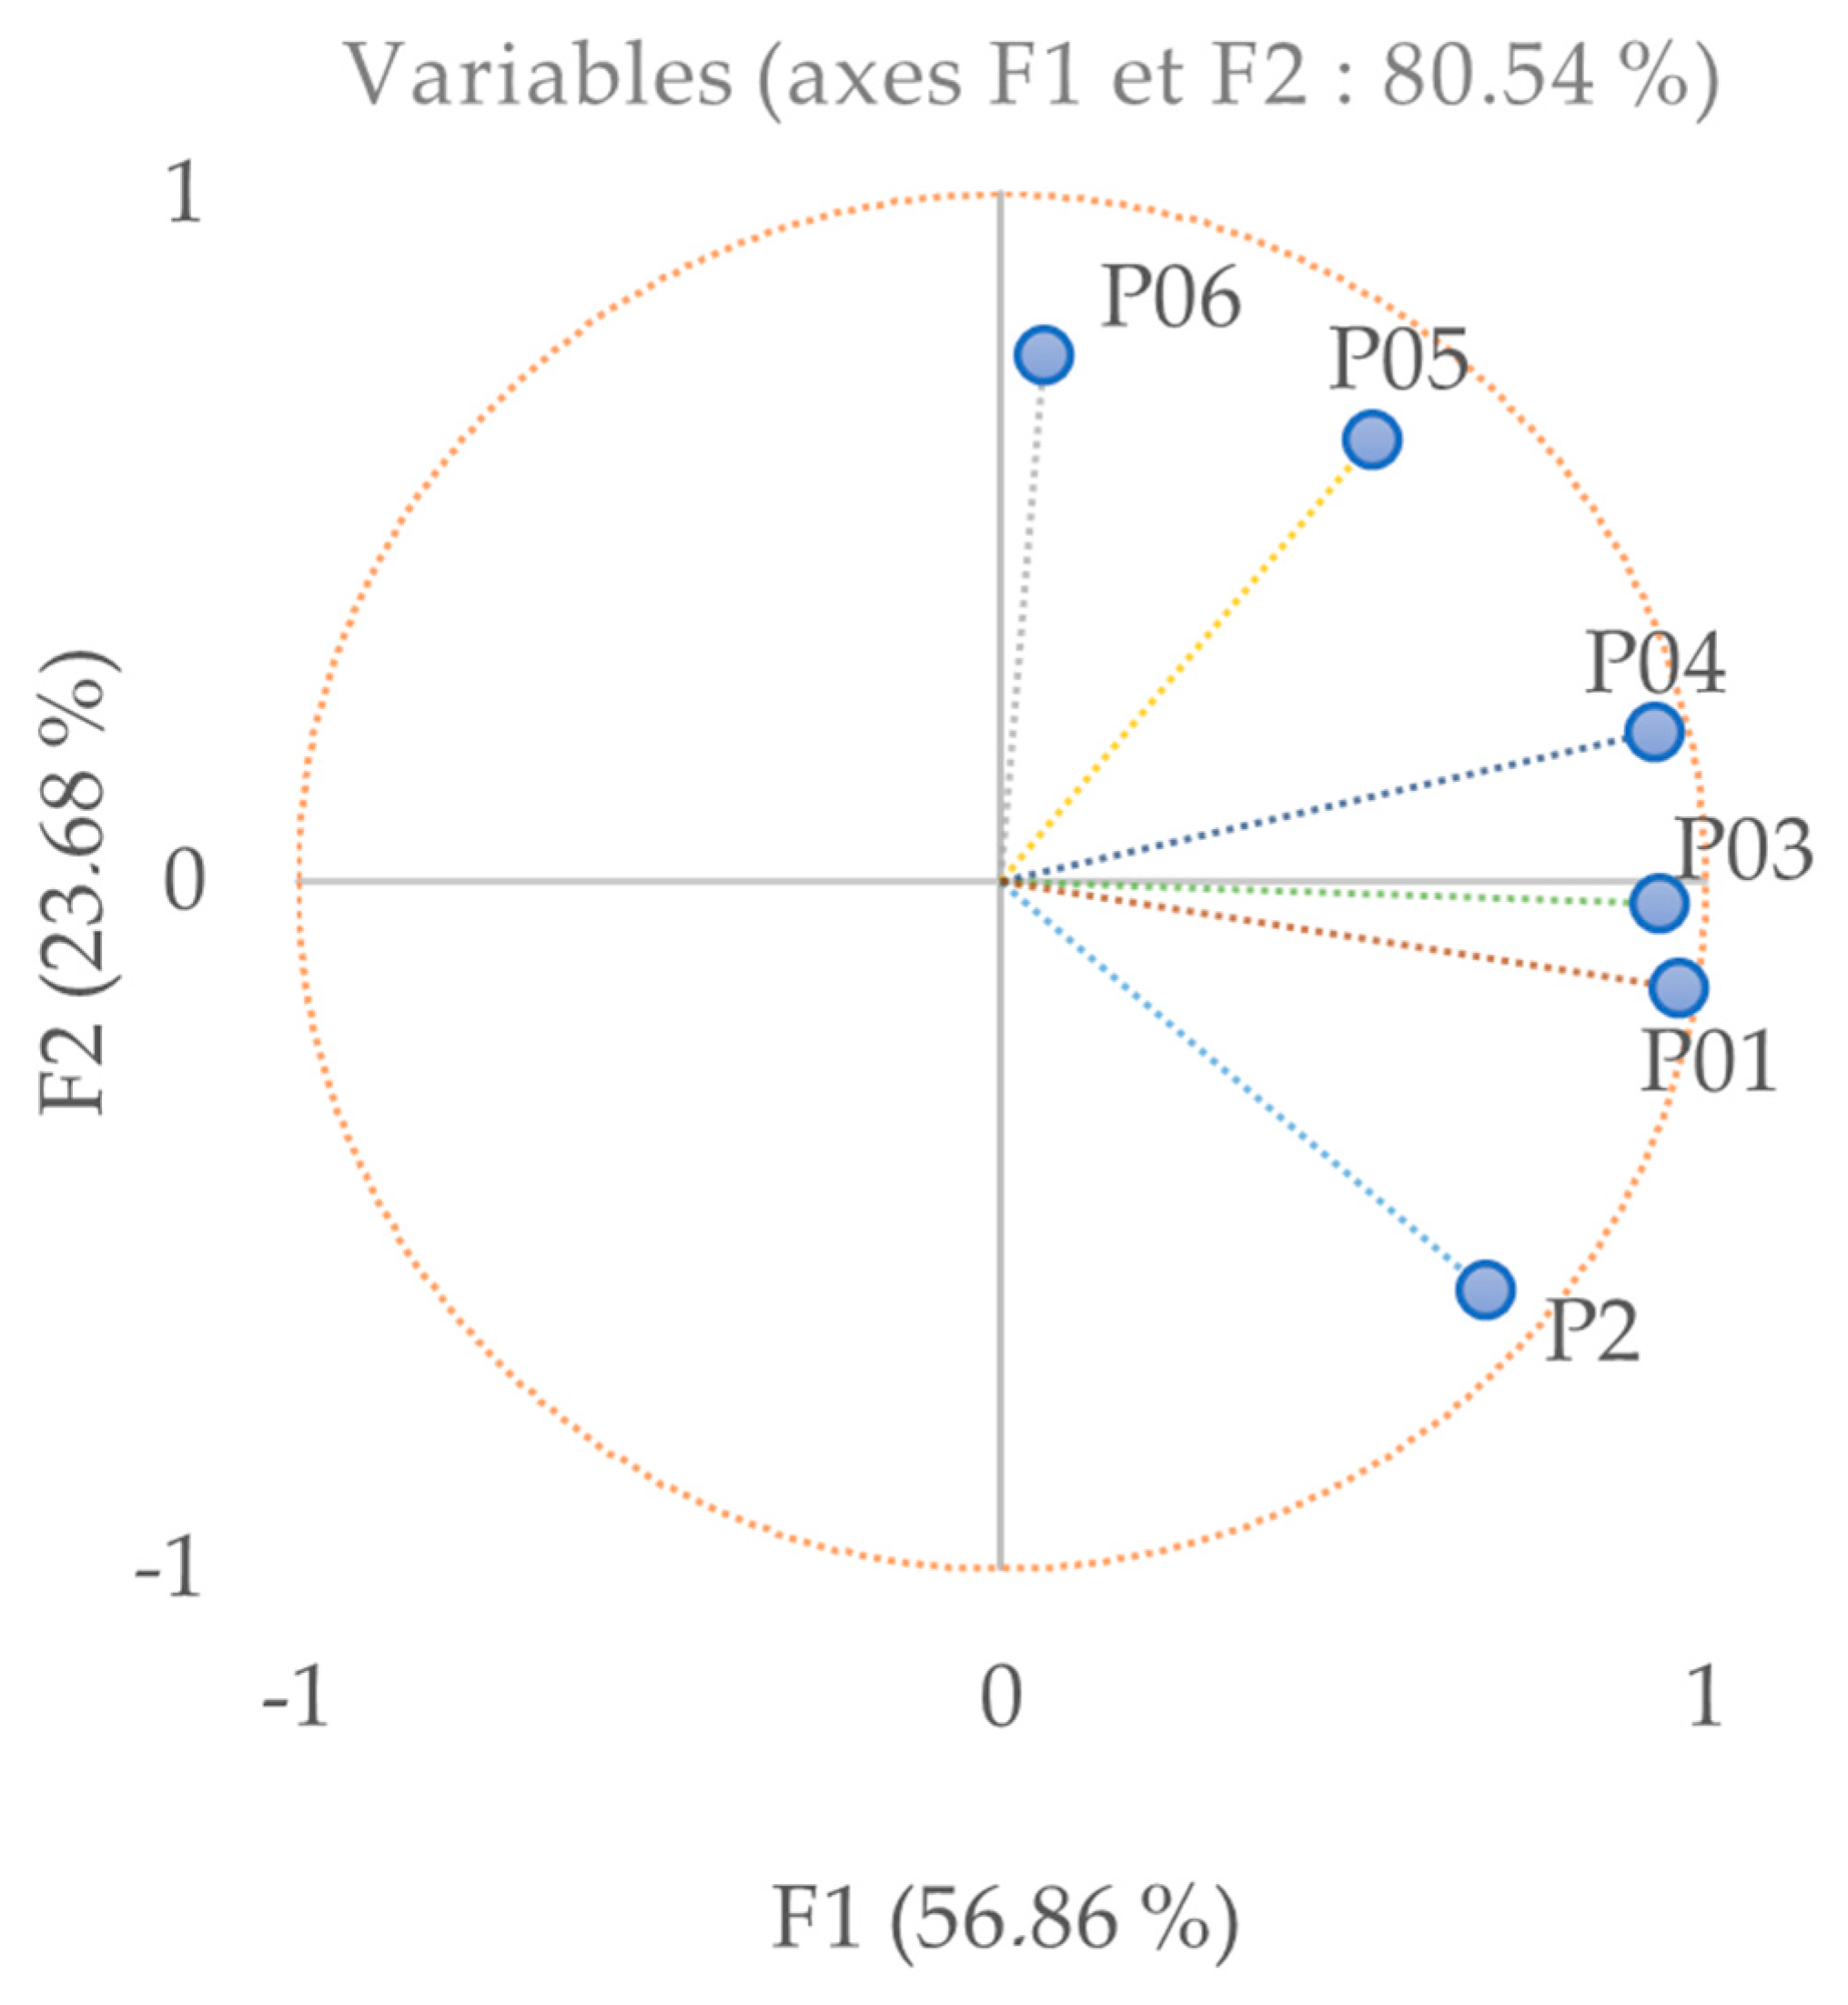
The PCA results (Figure 5) show two distinct groups of piezometers having the same behavior, the first group is made up of piezometers P05 and P06, and the second group is composed of piezometers P01, P03 and P04, whereas piezometer P02 fluctuations show a unique behavior different from the two groups.

5.3.2. Cross-Correlation

The cross-correlation analyses (Table 2) indicate the presence of a significant relationship between the water table level and vegetation. The correlation coefficient can be positive or negative, strong (R ≥ ±0.5) or weak (R ≤ ±0.3), depending on the piezometer location. The results also show the presence of three operating systems of the water table, in accordance with the PCA results. Each of the three systems presents a homogeneous behavior towards the vegetation developed in the whole area, while it differs locally from one point to another.
The first operating system is noticeable at piezometers P01, P03 and P04, where a disruption of the natural balance of the water cycle is noted. This is reflected in a low or non-existent correlation of piezometric level with rainfall and runoff. For this group, the contribution of surface water infiltration toward the water table is low. This group is also characterized by a strong and negative correlation between the piezometric level and vegetation (Table 2), except for P04, where the correlation with the local NDVI is positive. The response time of the water table varies from 1 to 3 months for the average LAI, and from 4 to 5 months for the local NDVI.
The second system occurs in piezometers P05 and P06. This group is characterized by the presence of a natural balance in the hydrological cycle. The correlation is positive between the piezometric level, runoff and rainfall. Groundwater recharge is strongly influenced by surface water at P06 and a little less at P05. Unlike the first group, the correlation is positive between the piezometric level and the vegetation indices. It is strong for the average LAI, whereas for the local NDVI, it is very strong at P06 and lower at P05. The response time of the groundwater to recharge phenomena varies from 3 to 4 months for rainfall and from 2 to 4 months for runoff, while it is instantaneous for the vegetation indices.
The last system consists of piezometer P02. The PCA reveals that this piezometer shows a unique behavior compared to the two other groups. As shown in Table 2, P02 has an instantaneous response to rainfall and runoff. The correlation is positive between groundwater level, rainfall and runoff, which means that surface water contributes significantly to groundwater recharge. As for vegetation, P02 correlates well with the average LAI, while for local NDVI, the correlation is insignificant.

5.3.3. Cascade Analysis

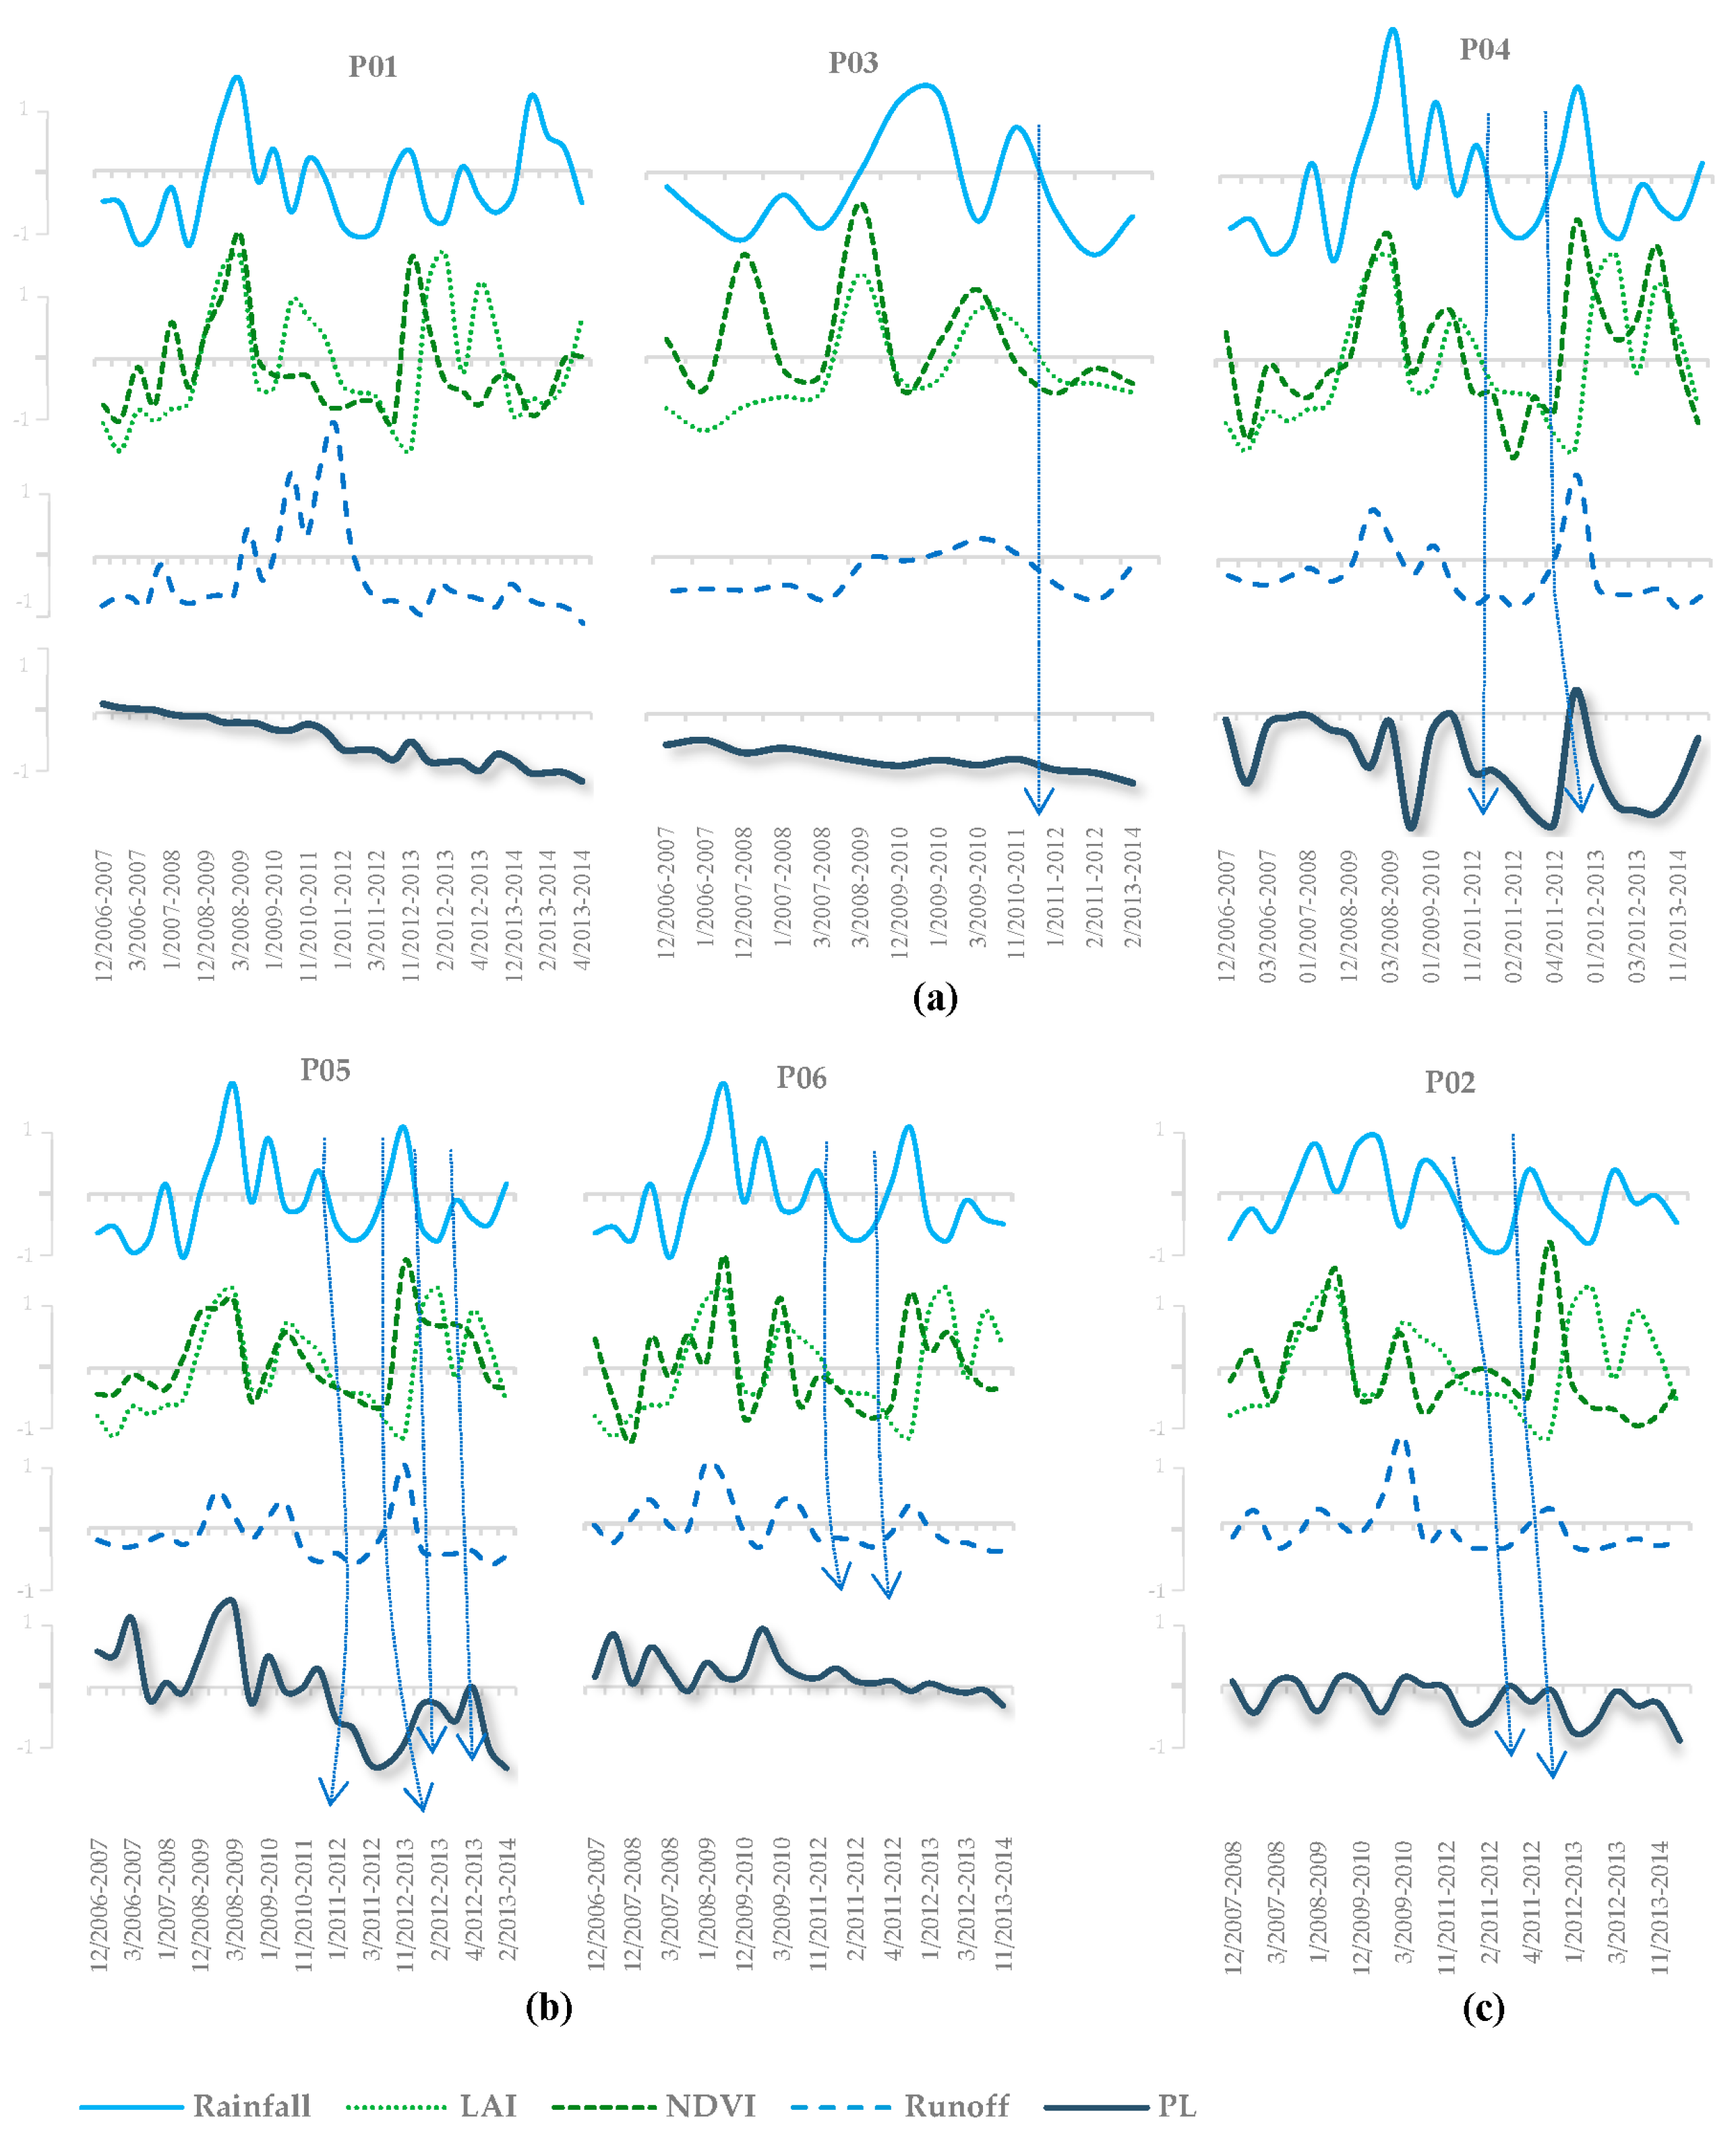
In this part, the temporal coevolution of the parameters of rainfall, runoff, vegetation development and piezometric level relative to each piezometer were analyzed, with the aim of identifying the presence or absence of a cascading effect This part of the analysis covers the period 2006–2014.
As shown in Figure 6, all piezometers exhibit a trend of declining water levels, showing a decrease during dry periods and a slight recovery during wet periods. Piezometers P03, P01 and P06 are the most affected by the drop, with an average annual decrease of 2.7 m/year, 1.4 m/year and 0.8 m/year, respectively. The piezometers P05, P04 and P02 show a less important decrease, respectively of 0.4 m/year, 0.3 m/year and 0.2 m/year. As for the surface flow, the average interannual flow recorded varies from 1.4 m3/s for station 06 to 3 m3/s at stations 02 and 04/05. As for the average annual rainfall, it shows a temporal and spatial variability strongly influenced by altitude. Stations 04/05 and 06 located in relatively high altitudes (982, 1069 m, respectively) exceed 410 mm/year for the period 2006–2014, while station 02 located in the lowest altitudes (255 m) does not exceed 150 mm/year for the same period.
For the first group of piezometers (P01, P03 and P04), the opposing behavior of the water table regarding the vegetation development is very noticeable for P03 and a little less for P01. For P04, the effect of drought is transferred from the surface runoff to the water table.
The cascading effect is more pronounced in the second and the third systems (P05 and P06, P02), where the variations in runoff, water table level and vegetation are mostly concomitant with those of the rain. The impact of drought can be transmitted from the rain to all the parameters, resulting in a complete cascade, as well as not reaching one or more parameters leading to an incomplete cascade.

6. Discussion

In this research, the interactions between several terrestrial components of the hydrological cycle and their impact on groundwater dynamics were analyzed, which allowed us to infer the effects of drought propagation from meteorological to hydrological, agriculture and groundwater in the Haouz region.
Therefore, this study started with the PCA in order to derive similar behaviors of the studied piezometers, and then opted for the cross-correlation to assess groundwater recharge in relation to temporal variation in climatic, hydrological and vegetation factors. To investigate this further, the temporal coevolution of the said factors was studied by performing a cascading analysis, to derive the cascading effects of drought propagation.
The results of this study allowed for the identification of three operating systems of the water table in the Haouz region (Figure 6), as shown by the PCA (Figure 5) and the cross-correlation analysis (Table 2). The first system is noticeable at piezometers P01, P03 and P04, the second occurs in piezometers P05 and P06, while the third consists of piezometer P02. Indeed, the PCA and cross-correlation have already been applied in the semi-arid Sfax region of Tunisia in order to analyze the shallow aquifer sensitivity to pluviometry and air temperature [69], and they offered substantial information to help understand the interactions between different environmental and hydrological components (e.g., precipitation, groundwater table level and air temperature).
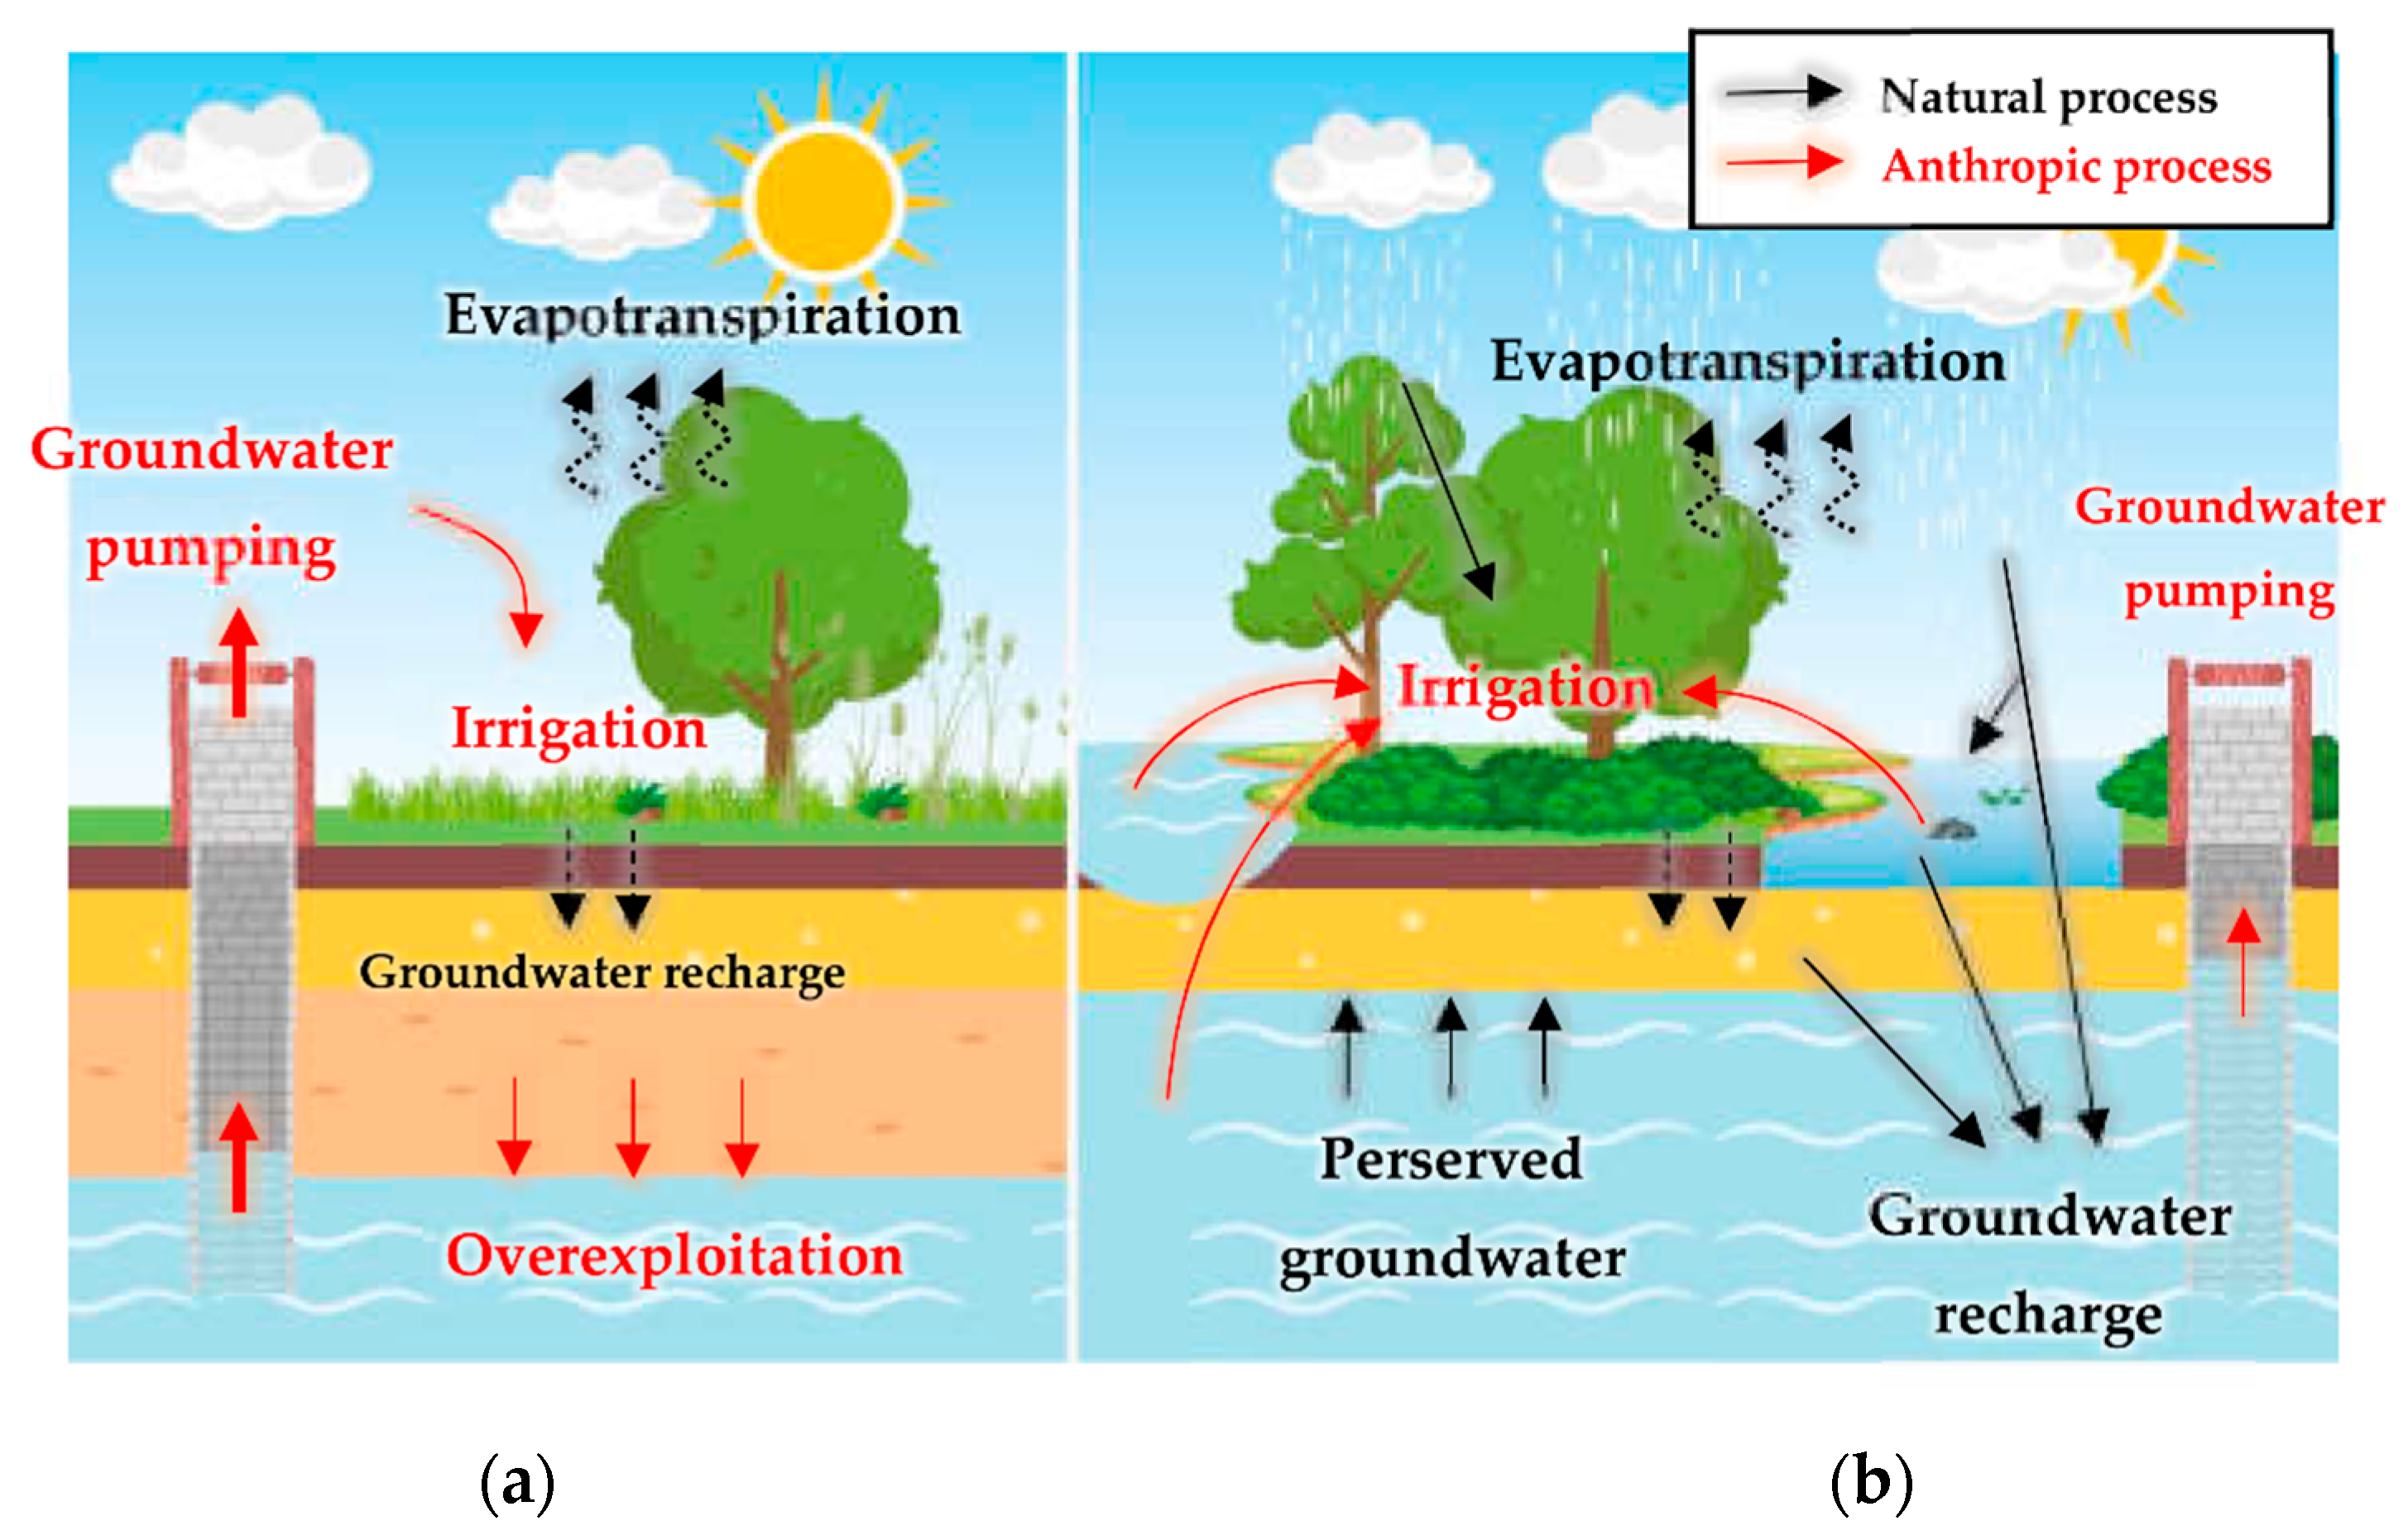
Our results indicate that the disruption of the natural balance of the water cycle is noted in the first operating system of the water table (P01, P03 and P04), as shown in Table 2. This system is characterized by a prolonged and very pronounced piezometric level deficit, particularly noticeable at P01 and P03 (Figure 7a). Periods of recovery when rain occurs could not allow for groundwater replenishment. This owes to the lack of groundwater recharge and the piezometers location in areas dominated by irrigated crops. As shown in the land use map of the Haouz plain (Figure 2), P01 is located in the Chichaoua sub-basin, where there is a significant development of crops irrigated from the water table. P03 is located in the Small and Medium Hydraulic perimeter of the N’Fis sub-basin, where irrigation is often carried out through unregulated water resources. P04 is also located in the Small and Medium Hydraulics perimeter of the Ourika sub-basin, dominated by plantations and close to the forest area. As a result, the correlation is negative between the piezometric level and the vegetation indices (Table 2), except for P04, where the correlation with the local NDVI is positive. This can be explained by a low pumping at P04 due to its proximity to the Rocade Canal. For this piezometer, the drought period in the watercourses coincides with the least rainy year of the study period, which is 2011–2012. This year matches the period when the piezometric level is at its lowest, giving rise to a complete cascade.
As for the second operating system of the water table (P05 and P06), the natural balance in the hydrological cycle is preserved due to the location of the piezometers in areas with low pumping. Piezometers P05 and P06 are located in a plantation-dominated area of the Rheraya-Issyl sub-basin (Figure 2), close to the Rocade canal. The stress of the water table begins to be felt in this group from 2011–2012 (Figure 7b), which can be explained by the minimum recharge episodes recorded this year [70]. Piezometer P05 remains the most affected by drought this year, giving rise to a complete cascade, followed by another one the year after, while P06 shows an incomplete cascade not reaching the piezometric level. Regarding the third system, piezometer P02 shows a complete cascade during 2011–2012 (Figure 7c). It is located in the Assif El Mal sub-basin, dominated by Bour lands (Figure 2) and cultivated in rainfed mode, with the presence of some plantation areas. The negligible correlation between groundwater and local vegetation at P02 (Table 2) means that for this point located in Bour crops, groundwater is relatively less exploited for agricultural purposes compared to the two other groups.
On the other hand, the piezometers that show a correlation between the piezometric level and runoff (Table 2) are located near the watercourses (Figure 1), which suggests that the watercourses are a potential area for groundwater recharge. Moreover, this observation was corroborated by the study conducted by Abourida (2007) [25] on the recharge of the Haouz water table, who found this same result.

7. Conclusions

This work was carried out to analyze the interactions between the different terrestrial components of the hydrological cycle and their impact on groundwater dynamics, and deriving the cascading effects of drought by combining data from satellites and ground observation. The study focuses on six piezometers and five factors including rainfall, runoff and two vegetation indices. The analysis was done by combining several methods including principal component analysis, cross-correlation and cascading analysis. The first results show a relationship between the piezometric level and the vegetation indices throughout the study area, which is reflected by a positive or negative, strong or weak correlation coefficient, depending on the location of the studied point. The PCA and cross-correlation highlight three groundwater functioning systems. The first is seen in piezometers located in areas dominated by groundwater irrigation. The correlation is negative between the water table and vegetation indices, and low or absent between the piezometric level and surface water. This indicates a low contribution of surface water to groundwater recharge at these points, associated with groundwater overexploitation to meet crop water needs. The natural balance of the water cycle is thus disturbed. As a result, the piezometers are characterized by a prolonged and very pronounced piezometric level deficit.
The second system corresponds to piezometers located in areas dominated by irrigation from surface water. The correlation is generally positive between the piezometric level, surface water and vegetation indices. The hydrological cycle is then preserved and shows cascading effects in all its components. This means that the impact of the temporal dynamics of rainfall is transmitted to the runoff and the piezometric level, and a bit less to the development of vegetation due to the practice of irrigation from surface water in these areas.
The third system occurs at the piezometer belonging to Bour lands and is cultivated in rainfed mode. The correlation between groundwater and local vegetation is negligible, which means that for this point located in Bour crops, groundwater is relatively less exploited for agricultural purposes compared to the other groups.
The results also show that the watercourses constitute potential recharge areas for the Haouz water table, which was corroborated by the study conducted by Abourida (2007).
This study allowed us to show that all components of the hydrological cycle must be taken into consideration when defining a drought period. The cascading effect of drought means that its impact can last for months and years even when precipitation occurs because one or more components of the hydrological cycle have not had the opportunity to be replenished. This means that a drought period does not end as soon as precipitation occurs. It also helped to allow us to understand the utility of reanalyzed data in conducting efficient analyses and studies, especially in regions with data scarcity such as arid and semi-arid regions.
Such studies can help scientists and water managers to understand and evaluate the cascading effects of drought and their impacts on the water cycle components as well as groundwater recharge and sustainability, using simple and economical methods that are suitable for different types of terrains, aquifers and area dimensions. However, these methods may have limitations that can be manifested in the requirement of several types of validated data with long data series, which are in most cases unavailable, especially in arid and semi-arid regions. The use of reanalysis data is very useful but requires prior validation, which is not necessarily easy. It may also be necessary to argue the results using other techniques such as GIS and remote sensing, or even through more demanding methods such as hydrochemical and isotopic assessments.

Author Contributions

Conceptualization, I.E.B., Y.A.B. and E.M.E.K.; formal analysis, I.E.B.; funding acquisition, Y.A.B.; investigation, I.E.B. and E.M.E.K.; methodology, I.E.B., Y.A.B. and E.M.E.K.; project administration, Y.A.B. and E.M.E.K.; supervision, Y.A.B. and E.M.E.K.; validation, E.M.E.K.; visualization, I.E.B.; writing—original draft, I.E.B.; writing—review and editing, I.E.B., Y.A.B., E.M.E.K., A.N. and B.B. All authors have read and agreed to the published version of the manuscript.

Funding

This research was funded by the starting grant of Yassine Ait Brahim at Mohammed VI Polytechnic University.

Institutional Review Board Statement

Not applicable.

Informed Consent Statement

Not applicable.

Data Availability Statement

Not applicable.

Conflicts of Interest

The authors declare no conflict of interest.

References

  1. Yang, H.; Zehnder, A.J.B. Water Scarcity and Food Import: A Case Study for Southern Mediterranean Countries. World Dev. 2002, 30, 1413–1430. [Google Scholar] [CrossRef]
  2. Madulu, N.F. Linking Poverty Levels to Water Resource Use and Conflicts in Rural Tanzania. Phys. Chem. Earth Parts A/B/C 2003, 28, 911–917. [Google Scholar] [CrossRef]
  3. Lasserre, F. Conflits Hydrauliques et Guerres de l’eau: Un Essai de Modélisation. Rev. Int. Strat. 2007, 66, 105–118. [Google Scholar] [CrossRef]
  4. Tramblay, Y.; Hertig, E. Modelling Extreme Dry Spells in the Mediterranean Region in Connection with Atmospheric Circulation. Atmos. Res. 2018, 202, 40–48. [Google Scholar] [CrossRef]
  5. El Khalki, E.M.; Tramblay, Y.; Hanich, L.; Marchane, A.; Boudhar, A.; Hakkani, B. Climate Change Impacts on Surface Water Resources in the Oued El Abid Basin, Morocco. Hydrol. Sci. J. 2021, 66, 2132–2145. [Google Scholar] [CrossRef]
  6. Iglesias, A.; Garrote, L.; Flores, F.; Moneo, M. Challenges to Manage the Risk of Water Scarcity and Climate Change in the Mediterranean. Water Resour. Manag. 2007, 21, 775–788. [Google Scholar] [CrossRef]
  7. Sebbar, A.; Badri, W.; Fougrach, H.; Hsaine, M.; Saloui, A. Étude de La Variabilité Du Régime Pluviométrique Au Maroc Septentrional (1935–2004). Sci. Changements Planétaires/Sécheresse 2011, 22, 139–148. [Google Scholar]
  8. Stour, L.; Agoumi, A. Sécheresse climatique au Maroc durant les dernières décennies. Hydroécol. Appl. 2008, 16, 215–232. [Google Scholar] [CrossRef] [Green Version]
  9. Bijaber, N.; Rochdi, A. Télédétection Spatiale Pour l’évaluation Du Risque de Sécheresse Au Maroc. Rev. Int. Géomatique 2017, 27, 203–221. [Google Scholar] [CrossRef]
  10. Strohmeier, S.; López López, P.; Haddad, M.; Nangia, V.; Karrou, M.; Montanaro, G.; Boudhar, A.; Linés, C.; Veldkamp, T.; Sterk, G. Surface Runoff and Drought Assessment Using Global Water Resources Datasets-from Oum Er Rbia Basin to the Moroccan Country Scale. Water Resour Manag. 2020, 34, 2117–2133. [Google Scholar] [CrossRef]
  11. Hadri, A.; Saidi, M.E.; Boudhar, A. Multiscale Drought Monitoring and Comparison Using Remote Sensing in a Mediterranean Arid Region: A Case Study from West-Central Morocco. Arab. J. Geosci. 2021, 14, 118. [Google Scholar] [CrossRef]
  12. Ait-Brahim, Y.; Saidi, M.E.; Khaoula, K.; Sifeddine, A.; Bouchaou, L. Analysis of Observed Climate Trends and High Resolution Scenarios for the 21st Century in Morocco. J. Mater. Environ. Sci. 2017, 8, 1375–1384. [Google Scholar]
  13. Nouaceur, Z.; Murărescu, O.; Muratoreanu, G. Climatic Changes in the Maghreb Region: The Evolution of the Pluviometric Parameters in the Middle Atlas and at Its Margins (Morocco) and Its Relation to the North Atlantic Oscillation. Air Water Pollut. 2013, 2013, 285–292. [Google Scholar]
  14. Ouhamdouch, S.; Bahir, M.; Ouazar, D.; Carreira, P.; Zouari, K. Evaluation of Climate Change Impact on Groundwater from Semi-Arid Environment (Essaouira Basin, Morocco) Using Integrated Approaches. Environ. Earth Sci. 2019, 78, 449. [Google Scholar] [CrossRef]
  15. Sinan, M.; Belhouji, A. Impact du changement climatique sur le climat et les ressources en eau du Maroc aux horizons 2020, 2050 et 2080 et mesures d’adaptation. La Houille Blanche 2016, 4, 32–39. [Google Scholar] [CrossRef]
  16. Tuel, A.; Kang, S.; Eltahir, E.A. Understanding Climate Change over the Southwestern Mediterranean Using High-Resolution Simulations. Clim. Dyn. 2021, 56, 985–1001. [Google Scholar] [CrossRef]
  17. Abtew, W.; Melesse, A. Evaporation and Evapotranspiration: Measurements and Estimations; Springer Science & Business Media: Berlin/Heidelberg, Germany, 2012; ISBN 978-94-007-4737-1. [Google Scholar]
  18. Hssaisoune, M.; Bouchaou, L.; Sifeddine, A.; Bouimetarhan, I.; Chehbouni, A. Moroccan Groundwater Resources and Evolution with Global Climate Changes. Geosciences 2020, 10, 81. [Google Scholar] [CrossRef] [Green Version]
  19. Abourida, A.; Simonneaux, V.; Errouane, S.; Sighir, F.; Berjami, B.; Sgir, F. Estimation Des Volumes d’eau Pompés Dans La Nappe Pour l’irrigation (Plaine Du Haouz, Marrakech, Maroc). Comparaison d’une Méthode Statistique et d’une Méthode Basée Sur l’utilisation de Données de Télédétection. J. Water Sci./Rev. Des Sci. De L’eau 2008, 21, 489–501. [Google Scholar]
  20. Fniguire, F.; Laftouhi, N.-E.; Saidi, M.E.; Markhi, A. Some Aspects of Climate Variability and Increasing Aridity in Central Morocco over the Last Forty Years: Case of Tensift Basin (Marrakech-Morocco). J. Environ. Earth Sci. 2014, 4, 42–51. [Google Scholar]
  21. Bennani, O.; Ait-Brahim, Y.; Saidi, M.E.; Fatima, F. Variability of Surface Water Resources and Extreme Flows under Climate Change Conditions in Arid and Mediterranean Area: Case of Tensift Watershed, Morocco. J. Biodivers. Environ. Sci. 2016, 9, 165–174. [Google Scholar]
  22. Aitelmekki, O.; Laftouhi, N.-E.; Hanich, L. Estimate of Regional Groundwater Recharge Rate in the Central Haouz Plain, Morocco, Using the Chloride Mass Balance Method and a Geographical Information System. Appl. Water Sci. 2015, 7, 1679–1688. [Google Scholar] [CrossRef] [Green Version]
  23. Belaqziz, S.; Khabba, S.; Er-Raki, S.; Jarlan, L.; Le Page, M.; Kharrou, M.H.; Adnani, M.E.; Chehbouni, A. A New Irrigation Priority Index Based on Remote Sensing Data for Assessing the Networks Irrigation Scheduling. Agric. Water Manag. 2013, 119, 1–9. [Google Scholar] [CrossRef]
  24. Ahmed, M.; Aqnouy, M.; Stitou El Messari, J. Sustainability of Morocco’s Groundwater Resources in Response to Natural and Anthropogenic Forces. J. Hydrol. 2021, 603, 126866. [Google Scholar] [CrossRef]
  25. Abourida, A. Approche Hydrogéologique de La Nappe du HAOUZ (Maroc) Par Télédétection, Isotopie, SIG et Modélisation; Faculté des Sciences Semlalia, Université Cadi Ayyad: Marrakech, Morocco, 2007. [Google Scholar]
  26. Mishra, A.K.; Singh, V.P. A Review of Drought Concepts. J. Hydrol. 2010, 391, 202–216. [Google Scholar] [CrossRef]
  27. Ruf, T.; Kleiche-Dray, M. Les Eaux d’irrigation Du Haouz de Marrakech: Un Siècle de Confrontations Des Modèles de Gestion Publics, Privés et Communautaires. EchoGéo 2018, 43, 42. [Google Scholar] [CrossRef] [Green Version]
  28. Tanouti, O.; Molle, F. Réappropriations de l’eau Dans Les Bassins Versants Surexploités. Le Cas Du Bassin Du Tensift (Maroc). Études Rural. 2013, 192, 79–96. [Google Scholar] [CrossRef]
  29. Zkhiri, W.; Tramblay, Y.; Hanich, L.; Jarlan, L.; Ruelland, D. Spatiotemporal Characterization of Current and Future Droughts in the High Atlas Basins (Morocco). Theor. Appl. Climatol. 2019, 135, 593–605. [Google Scholar] [CrossRef]
  30. Meliho, M.; Khattabi, A.; Jobbins, G.; Sghir, F. Impact of Meteorological Drought on Agriculture in the Tensift Watershed of Morocco. J. Water Clim. Chang. 2019, 11, 1323–1338. [Google Scholar] [CrossRef]
  31. Habitou, N.; Morabbi, A.; Ouazar, D.; Bouziane, A.; Hasnaoui, M.D.; Sabri, H. CHIRPS Precipitation Open Data for Drought Monitoring: Application to the Tensift Basin, Morocco. J. Appl. Remote Sens. 2020, 14, 034526. [Google Scholar]
  32. Analy, M.; Laftouhi, N.-E. Groundwater Depletion in an Urban Environment under Semiarid Climate and Persistent Drought–City of Marrakesh (Morocco). Water 2021, 13, 3253. [Google Scholar] [CrossRef]
  33. Cotti, D.; Harb, M.; Hadri, A.; Aboufirass, M.; Chaham, K.R.; Libertino, A.; Campo, L.; Trasforini, E.; Krätzschmar, E.; Bellert, F.; et al. An Integrated Multi-Risk Assessment for Floods and Drought in the Marrakech-Safi Region (Morocco). Front. Water 2022, 4, 75. [Google Scholar] [CrossRef]
  34. Houmma, I.; Mansouri, L.; Gadal, S.; Mansour Badamassi, M.B.; Hadria, R. Prospective Analysis of Spatial Heterogeneity Influence on the Concordance of Remote Sensing Drought Indices: A Case of Semi-Arid Agrosystems in Morocco (Moulouya and Tensift Watersheds). Geocarto Int. 2022, 37, 1–21. [Google Scholar] [CrossRef]
  35. Houmma, I.; Mansouri, L.; Hadria, R.; Anas, E.; Chehbouni, A. Retrospective Analysis and Version Improvement of the Satellite-Based Drought Composite Index. A Semi-Arid Tensift-Morocco Application. Geocarto Int. 2020, 37, 1–22. [Google Scholar] [CrossRef]
  36. Moukhchane, M. Contribution à L’étude des Réservoirs Aquifères Profonds de la Bordure Nord de l’Atlas Entre Demnat et Imin’Tanout (Maroc). Ph.D. Thesis, Université de Franche-Comté, Besançon, France, 1983. [Google Scholar]
  37. Sinan, M. Méthodologie d’identification, d’évaluation et de Protection Des Ressources En Eau Des Aquifères Régionaux Par La Combinaison Des SIG, de La Géophysique et de La Géostatistique: Application à l’aquifère Du Haouz de Marrakech (Maroc). Ph.D. Thesis, Université Mohammed V, Ecole Mohammedia des Ingénieurs, Rabat, Morocco, 2000. [Google Scholar]
  38. Rmiki, A.; El Achheb, A.; Ennih, N. Hydrogeological and Geochemical Approach in the Study of Groundwater Salinity of Central Haouz. Eur. J. Sci. Res. 2021, 154, 328–344. [Google Scholar]
  39. Aitelmekki, O.; Laftouhi, N.-E. Combination of a Geographical Information System and Remote Sensing Data to Map Groundwater Recharge Potential in Arid to Semi-Arid Areas: The Haouz Plain, Morocco. Earth Sci. Inform. 2016, 9, 465–479. [Google Scholar] [CrossRef]
  40. Ghazali, F.E.E.; Laftouhi, N.-E.; Fekri, A.; Randazzo, G.; Benkirane, M. Enhancing the Success of New Dams Implantation under Semi-Arid Climate, Based on a Multicriteria Analysis Approach: Case of Marrakech Region (Central Morocco). Open Geosci. 2021, 13, 1494–1508. [Google Scholar] [CrossRef]
  41. Er-Raki, S.; Chehbouni, A.; Khabba, S.; Simonneaux, V.; Jarlan, L.; Ouldbba, A.; Rodriguez, J.C.; Allen, R. Assessment of Reference Evapotranspiration Methods in Semi-Arid Regions: Can Weather Forecast Data Be Used as Alternate of Ground Meteorological Parameters? J. Arid. Environ. 2010, 74, 1587–1596. [Google Scholar] [CrossRef] [Green Version]
  42. Montginoul, M.; Molle, F. Modernisation Des Périmètres Irrigués Au Maroc: Une Solution Aux Effets Contrastés Pour Les Agriculteurs et La Ressource En Eau. Le Cas d’un Périmètre Du N’Fis-Haouz; Irstea; IRD-Institut de Recherche Pour le Developpement; UMR G-Eau: Montpellier, France, 2019; p. 47. [Google Scholar]
  43. Ge, J.; Jun, F.; Yuan, H.; Yang, X.; Jin, M.; Wang, S. Soil Water Depletion and Restoration under Inter-Conversion of Food Crop and Alfalfa with Three Consecutive Wet Years. J. Hydrol. 2020, 585, 124851. [Google Scholar] [CrossRef]
  44. Acharya, B.; Sandhu, D.; Ferreira, J.F.S. Physiological, Morphological, Biochemical, and Genetic Responses of Alfalfa to Salinity; Springer: Cham, Switzerland, 2021; pp. 145–157. ISBN 978-3-030-74465-6. [Google Scholar]
  45. Salih, W.; Chehbouni, A.; Epule, T.E. Evaluation of the Performance of Multi-Source Satellite Products in Simulating Observed Precipitation over the Tensift Basin in Morocco. Remote Sens. 2022, 14, 1171. [Google Scholar] [CrossRef]
  46. Abdullahi, J.; Elkiran, G. Prediction of the Future Impact of Climate Change on Reference Evapotranspiration in Cyprus Using Artificial Neural Network. Procedia Comput. Sci. 2017, 120, 276–283. [Google Scholar] [CrossRef]
  47. Papadavid, G.; Diofantos, H. Integrated Approach of Remote Sensing and Micro-Sensor Technology for Estimating Evapotranspiration in Cyprus. Agric. Eng. Int. CIGR J. 2010, 12, 1–11. [Google Scholar]
  48. Mjejra, M.; Dubreuil, V.; Hénia, L. Suivi de la Sécheresse Agro-Climatique à Partir du Déficit D’évaporation Dans le Bassin Versant de Mejerda (Tunisie). In Proceedings of the XXVIIIe Colloque de l’Association Internationale de Climatologie; 2015; p. 369. Available online: http://climatologie.be/aic/colloques/actes/ACTES_AIC2015/5%20Variabilites%20et%20aleas%20climatiques/070-CARMELLO-439-444.pdf (accessed on 29 August 2022).
  49. Tanner, C.; Jury, W. Estimating Evaporation and Transpiration from a Row Crop during Incomplete Cover 1. Agron. J. 1976, 68, 239–243. [Google Scholar] [CrossRef]
  50. HAMIMED, A.; Menaa, R.; Benslimane, M.; Bouabdellah, L. Cartographie de l’évapotranspiration Réelle Journalière Dans Les Conditions Semi-Arides En Algérie à Partir Des Données Satellitaires Aster. Sci. Changements Planetaires-Secher. 2008, 19, 293–300. [Google Scholar] [CrossRef]
  51. Gao, Y.; Zhao, C.; Ashiq, M.W.; Wang, Q.; Rong, Z.; Liu, J.; Mao, Y.; Zhaoxia, G.; Wang, W. Actual Evapotranspiration of Subalpine Meadows in the Qilian Mountains, Northwest China. J. Arid. Land 2019, 11, 371–384. [Google Scholar] [CrossRef] [Green Version]
  52. Running, S.W.; Mu, Q.; Zhao, M.; Moreno, A. MODIS Global Terrestrial Evapotranspiration (ET) Product (NASA MOD16A2/A3) NASA Earth Observing System MODIS Land Algorithm; NASA: Washington, DC, USA, 2017.
  53. Mu, Q.; Zhao, M.; Running, S. MODIS Global Terrestrial Evapotranspiration (ET) Product (NASA MOD16A2/A3) Collection 5. NASA Headquarters; Numerical Terradynamic Simulation Group Publications: Macau, China, 2013. [Google Scholar]
  54. Costa, L.; Nunes, L.; Ampatzidis, Y. A New Visible Band Index (VNDVI) for Estimating NDVI Values on RGB Images Utilizing Genetic Algorithms. Comput. Electron. Agric. 2020, 172, 105334. [Google Scholar] [CrossRef]
  55. Escadafal, R.; Huete, A. Etude Des Propriétés Spectrales Des Sols Arides Appliquée à l’amélioration Des Indices de Végétation Obtenus Par Télédétection. Comptes Rendus De L’académie Des Sci. Sér. 2 Méc. Phys. Chim. Sci. De L’univers Sci. De La Terre 1991, 312, 1385–1391. [Google Scholar]
  56. Solly, B.; Oumar, S.; Jarju, A.M.; Tidiane, S. Détection Des Zones de Dégradation et de Régénération de La Couverture Végétale Dans Le Sud Du Sénégal à Travers l’analyse Des Tendances de Séries Temporelles MODIS NDVI et Des Changements d’occupation Des Sols à Partir d’images LANDSAT. Rev. Fr. Photogramm. Télédétect. 2021, 223, 1–15. [Google Scholar] [CrossRef]
  57. Liang, L.; Huang, T.; Di, L.; Geng, D.; Yan, J.; Wang, S.; Wang, L.; Li, L.; Chen, B.; Kang, J. Influence of Different Bandwidths on LAI Estimation Using Vegetation Indices. IEEE J. Sel. Top. Appl. Earth Obs. Remote Sens. 2020, 13, 1494–1502. [Google Scholar] [CrossRef]
  58. Shinzato, P.; Duarte, D. Microclimatic Effect of Vegetation for Different Leaf Area Index-LAI. In Proceedings of the 28th Conference, Opportunities, Limits & Needs towards an Environmentally Responsible Architecture, Lima, Peru, 7–9 November 2012. [Google Scholar]
  59. Mondal, N.; Singh, V. A New Approach to Delineate the Groundwater Recharge Zone in Hard Rock Terrain. Curr. Sci. 2004, 87, 658–662. [Google Scholar]
  60. Ha, K.; Ko, K.-S.; Koh, D.-C.; Yum, B.-W.; Lee, G. Time Series Analysis of the Responses of the Groundwater Levels at Multi-Depth Wells According to the River Stage Fluctuations. Econ. Environ. Geol. 2006, 39, 269–284. [Google Scholar]
  61. Lee, J.M.; Park, J.H.; Chung, E.; Woo, N.C. Assessment of Groundwater Drought in the Mangyeong River Basin, Korea. Sustainability 2018, 10, 831. [Google Scholar] [CrossRef] [Green Version]
  62. Kim, I.; Park, D.; Kyung, D.; Kim, G.; Kim, S.; Lee, J. Comparative Influences of Precipitation and River Stage on Groundwater Levels in Near-River Areas. Sustainability 2016, 8, 1. [Google Scholar] [CrossRef]
  63. Fiorillo, F.; Doglioni, A. The Relation between Karst Spring Discharge and Rainfall by the Cross-Correlation Analysis. Hydrogeol. J. 2010, 18, 1881–1895. [Google Scholar] [CrossRef]
  64. Howell, B.; Fryar, A.; Benaabidate, L.; Bouchaou, L.; Farhaoui, M. Variable Responses of Karst Springs to Recharge in the Middle Atlas Region of Morocco. Hydrogeol. J. 2019, 27, 1693–1710. [Google Scholar] [CrossRef]
  65. Pointet, T. To Be Resilient to Drought. La Houille Blanche 2020, 106, 45–50. [Google Scholar] [CrossRef]
  66. Massoud, E.; Turmon, M.; Reager, J.; Hobbs, J.; Liu, Z.; David, C.H. Cascading Dynamics of the Hydrologic Cycle in California Explored through Observations and Model Simulations. Geosciences 2020, 10, 71. [Google Scholar] [CrossRef] [Green Version]
  67. Entekhabi, D.; Rodriguez-Iturbe, I.; Bras, R.L. Variability in Large-Scale Water Balance with Land Surface-Atmosphere Interaction. J. Clim. 1992, 5, 798–813. [Google Scholar] [CrossRef]
  68. Changnon, S.A. Detecting Drought Conditions in Illinois. Circ. No. 169. 1987. Available online: https://www.isws.illinois.edu/pubdoc/C/ISWSC-169.pdf (accessed on 29 August 2022).
  69. Triki, I.; Trabelsi, N.; Hentati, I.; Zairi, M. Groundwater Levels Time Series Sensitivity to Pluviometry and Air Temperature: A Geostatistical Approach to Sfax Region, Tunisia. Environ. Monit. Assess. 2014, 186, 1593–1608. [Google Scholar] [CrossRef]
  70. Hajhouji, Y. Modélisation Hydrologique Du Bassin Versant de l’oued Rheraya et Sa Contribution à La Recharge de La Nappe Du Haouz (Bassin Du Tensift, Maroc); Université Paul Sabatier-Toulouse III: Toulouse, France, 2018. [Google Scholar]
Figure 1. Location map of the study area, showing the selected piezometers and surface water flow measurement stations used in this study.
Sustainability 14 14865 g001
Figure 2. Land use map of the Haouz basin, showing the borders of the Haouz aquifer.
Sustainability 14 14865 g002
Figure 3. Correlation between ERA5 product and observed data. (a) Annual average rainfall (mm); (b) intermonthly average rainfall (mm); (c) annual average temperature (°C); (d) intermonthly average temperature (°C).
Sustainability 14 14865 g003
Figure 4. Umbrothermal diagram and evapotranspiration curve line of the study area.
Sustainability 14 14865 g004
Figure 5. Principal component analysis of the six piezometers selected for the analysis.
Sustainability 14 14865 g005
Figure 6. Temporal dynamics of rainfall, runoff, vegetation and piezometric level. (a) The first system is composed of piezometers P01, P03, and P04. (b) The second system is composed of piezometers P05 and P06, (c) The third system is composed of piezometer 02, as described in the text.
Sustainability 14 14865 g006
Figure 7. A simplified explanatory figure of the found results. (a) First groundwater operating system: disturbed hydrological cycle; (b) Second and third groundwater operating system: preserved hydrological cycle.
Sustainability 14 14865 g007
Table 1. Piezometers selected for the study.
IdPiezometerXYPeriods of
Records
Time Step
P011133/52−8.62002731.3630851998–2020Monthly data
P023590/53−8.55646331.5856871998–2020Monthly data
P034442/45−8.34444731.6550311998–2020Monthly data
P04766/53−7.7832331.3826111986–2020Monthly data
P052701/53−7.80798231.4185411979–2020Monthly data
P062700/53−7.98237831.4606881984–2020Monthly data
Table 2. Cross-correlation between piezometric level, rainfall, surface water flow and vegetation indices.
First SystemSecond SystemThird System
P01
(Irrigated
Cultures)
P03
(Irrigated
Cultures)
P04
(Plantations)
P05
(Plantations)
P06
(Plantations)
P02 (Bour)
Rainfall
(leads, negative lags)
0.40
(lag = −4)
1.00
(lag = −3)
0.65
(lag = 0)
Local NDVI (leads, positive lags)−0.67
(lag = −4)
−0.79
(lag = −5)
0.98
(lag = −4)
0.40
(lag = 0)
1.00
(lag = 0)
Average LAI (leads, positive lags)−0.86
(lag = −2)
−0.96
(lag = −3)
−0.88
(lag = −1)
0.90
(lag = 0)
1.00
(lag = 0)
0.50
(lag = 0)
Runoff
(leads, positive lags)
0.40
(lag = 1)
0.40
(lag = −4)
0.82
(lag = 2)
0.92
(lag = 0)
Publisher’s Note: MDPI stays neutral with regard to jurisdictional claims in published maps and institutional affiliations.