Article

Analysis and Research on Temporal and Spatial Variation of Color Steel Tile Roof of Munyaka Region in Kenya, Africa

1
School of Surveying and Land Information Engineering, Henan Polytechnic University, Jiaozuo 454003, China
2
School of Resouce and Civil Engineering, Liaoning Institute of Science and Technology, Benxi 117004, China
*
Author to whom correspondence should be addressed.
Sustainability 2022, 14(22), 14886; https://doi.org/10.3390/su142214886
Submission received: 26 September 2022 / Revised: 3 November 2022 / Accepted: 8 November 2022 / Published: 10 November 2022

Abstract

:
In Africa, the distribution of color steel tile roof (CSTR) can reflect the living standard of residents, and the analysis of its temporal and spatial changes can reflect the local changes in local living conditions. It is helpful to analyze the change of the local economic level. By using the satellite remote sensing image processing method to obtain the temporal and spatial change characteristics of CSTR and to analyze the changes in residents’ living conditions in Munyaka, Eldoret, Kenya, Africa, the model of multifeature decision tree method (DTM) extraction was established. The Normalized Difference Vegetation Index (NDVI) and Normalized Difference Building Index (NDBI) were used to remove farmland from the difference of the CSTR. The Normalized Difference Surface Index (NCSI) was constructed, and the texture features were analyzed to eliminate wasteland and bare land, respectively. The research results show that the Kappa coefficient is 0.9223, and the user precision and mapping precision are 97.79% and 91.10%, respectively. At the same time, combined with the Erdoret municipal road project, the changes of CSTR before and after the project in 2016–2020 are studied. Compared the area change of CSTR in 2016–2018 with that in 2018–2020, the annual growth rate before the construction of the municipal road project is about 3.47%. After the completion of the project, the annual growth rate is 7.29%, more than twice the rate before the construction. This method can realize the dynamic monitoring of CSTR, reflect the changes of the residents’ living environment in the region, help analyze the improvement of poverty in Africa, and help understand the changes of African economic conditions.

1. Introduction

The United Nations Development Summit focuses on solving the problem of global poverty through the world sustainable development agenda, which is a severe test for developing countries [1,2]. Countries around the world have conducted in-depth research to solve the major issues of economic and social development in Africa, which has attracted wide attention from many international institutions and organizations [3]. The Republic of Kenya is located south of the Sahara desert. The proportion of poor people exceeds 50%, which is far higher than the average level of developing countries. Many countries, including China, support Africa’s economic and social development free of charge and have carried out a large amount of transportation infrastructure construction for this purpose [4]. Several municipal roads and high-grade highways have been built by large Chinese enterprises for the urban area of Munyaka in Kenya, strengthening the construction of transportation infrastructure in this area [5]. Transportation infrastructure construction is the premise of regional economic development. Its main role is to promote the interconnection of people, materials and information, accelerate the optimal allocation of resources, and improve the speed of economic development [6]. For the economic development of each region, transportation infrastructure is an important channel for its external relations. A perfect and mature transportation system will directly affect the regional economic growth and promote the sustainable and healthy development of the regional economy [7]. In the past, the quality of life of rural residents in Africa was low, and most of their houses were thatched cottages. With the improvement of living standards, the living environment began to change from thatched cottage to color steel tile roof (CSTR) and gradually formed a residential area dominated by CSTR. As a symbol of the change of the living environment, the CSTR reflects the economic development and residential environment change of the region to a certain extent. Through remote sensing [8], we can obtain CSTR information and then analyze and study the change of Kenya’s residential environment and economic development. This is a very interesting and valuable, feasible topic. The spatiotemporal change information of CSTR in Africa is obtained by remote sensing, and the impact of road infrastructure construction on regional economic development and its important driving role are retrieved.
At present, the traditional building extraction methods at home and abroad are mainly divided into two categories: The one is the extraction method based on the characteristics of building remote sensing images. Wang [9] and others used the SVM classification method to extract the main construction land in North Korea and analyzed the spatial–temporal change characteristics by using the annual growth and annual growth rate of the regional area. Lin [10] and others proposed a hierarchical extraction method of building information from high-resolution remote sensing images based on the combination of object-oriented and morphology. Shackelford [11] and others used an object-oriented fuzzy classification based on knowledge rules and used simple spatial rules and other features to classify and map buildings in the regular grid urban area. The second method combined with the building extraction method of auxiliary features. Wang [12] and others proposed an urban building extraction method that comprehensively utilizes high-resolution images and airborne LiDAR data. Zhang [13] and others used a method of the support vector machine (SVM) to recognize and classify buildings from remote sensing images. However, there is plenty of research on the classification and extraction of buildings with cement roofs, while there is little literature on the remote sensing extraction of the spatial distribution of buildings with CSTRs and the study of spatiotemporal change rules. Li [14] and others performed multiscale segmentation on the images of the study area and established an object-oriented classification model based on knowledge rules to extract the color steel shed in the urban area. Ma [15] and others analyzed the color steel shed in the study area by using the remote sensing images of two scenes in different years and realized research on the regional stability, aggregation, and space–time transformation law of the color steel shed. Therefore, the method of using remote sensing to obtain the CSTR is feasible.
With the improvement of rural economic conditions and living conditions, CSTR, as a new type of building roof material, will become more and more popular because of its cheap price and convenient construction. Taking the CSTR as a new research object, a new remote sensing index is constructed based on the spectral curve characteristics of CSTR. The texture features are selected according to the relative difference and coefficient of variation, and a multifeature decision tree method (DTM) extraction model is established. We analyze the temporal and spatial changes of CSTR before and after the completion of the municipal road infrastructure project in Eldoret, Kenya, and discuss the impact of transportation infrastructure construction on the living environment in rural Kenya, Africa. We consider the impact of transportation infrastructure construction on the building structure in Africa and the quality of life of local residents, and then analyze the impact of road infrastructure construction on local economic development. Therefore, this paper first studies the feasibility and accuracy of the remote sensing information extraction method of CSTR and then analyzes the temporal and spatial changes of CSTR in Munyaka, Kenya, from 2016 to 2020. According to the research results, we analyze the impact and changes of road infrastructure construction on the rural areas, and then monitor the impact of municipal road infrastructure construction on people’s living conditions and try to achieve remote sensing monitoring of economic development in Kenya, Africa.

2. Study Area and Data
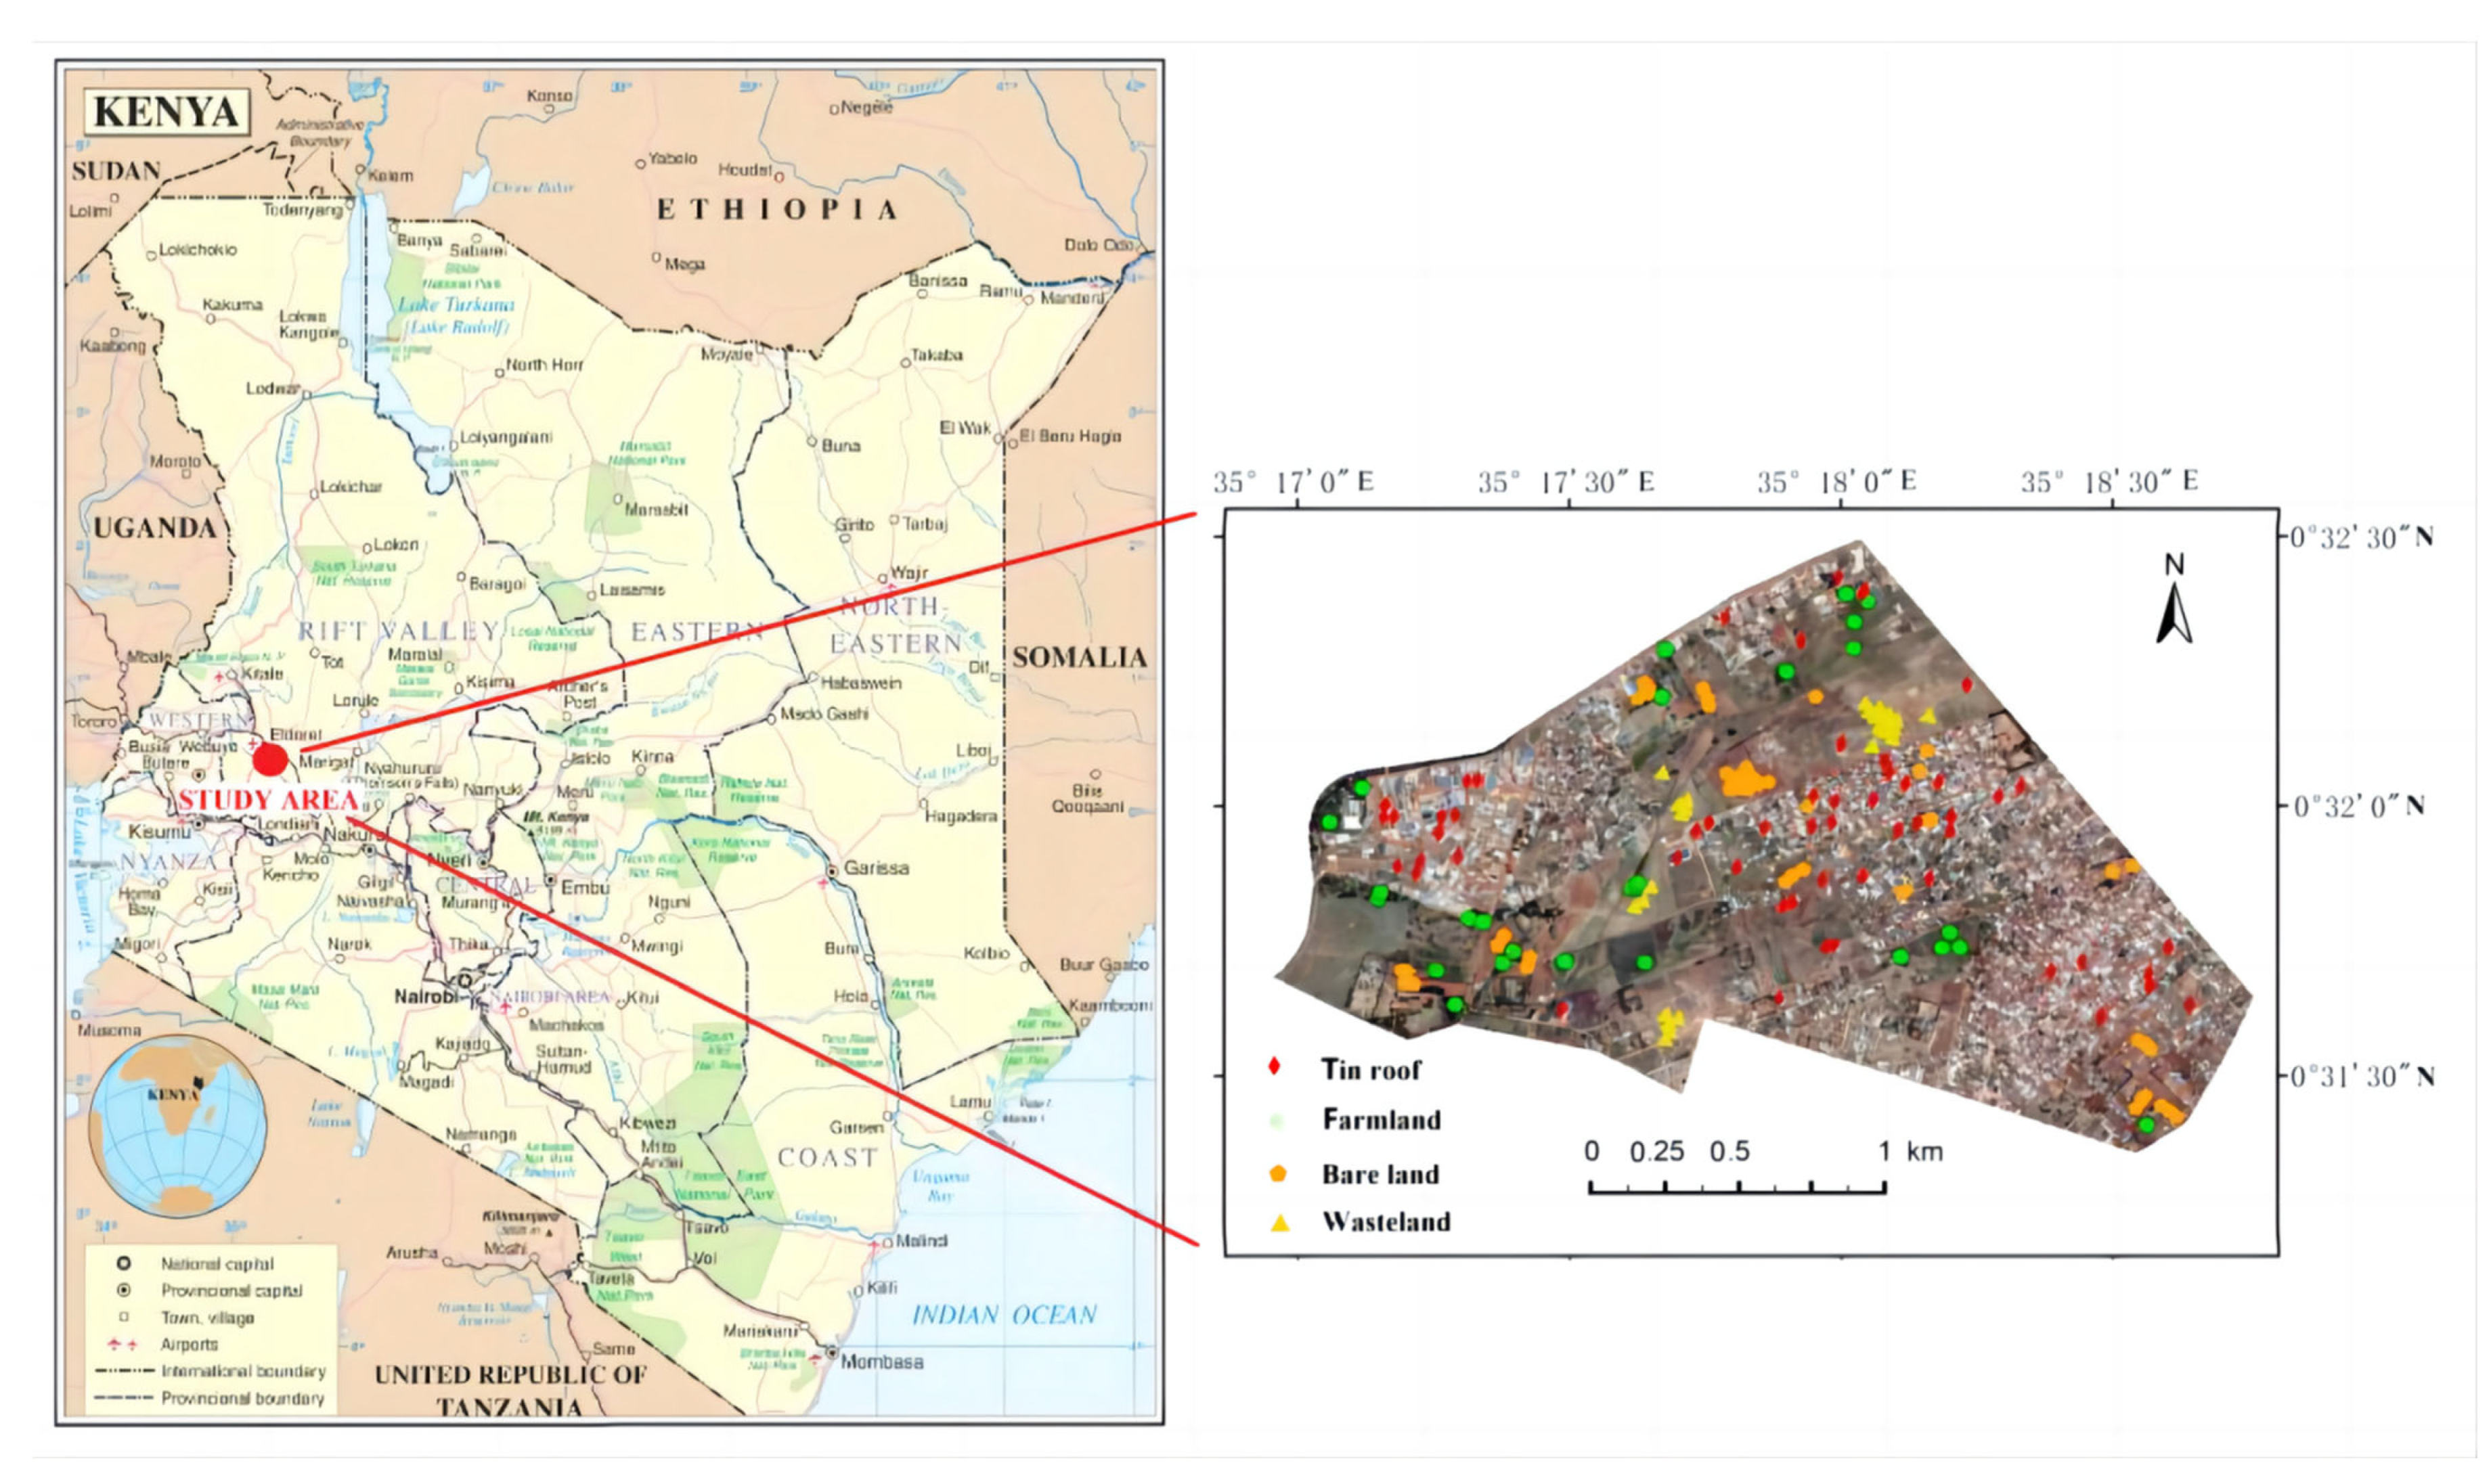
2.1. The Study Area

The study area is located in the southwest of the Republic of Kenya, with a tropical savanna climate. The study area is the Munyaka area of Eldoret (35°17′ E, 0°31′ N), which is a principal town in the Rift Valley region of Kenya and serves as the capital of Uasin Gishu County. It lies south of the Cherangani Hills, and the local elevation varies from about 2100 m at the airport to more than 2700 m in nearby areas (7000–9000 feet). Munyaka is a rural area, mainly agricultural, with a low income. The composition of the ground features in the study area is quite simple, mainly composed of four types of ground features: farmland (mainly including green crops), wasteland (uncultivated land containing a small amount of weeds; the color in the image is light yellow), bare land (mainly including fallow land and bare land, which is slightly darker than the wasteland), and CSTR (bright color in the image, regional distribution, and better identification). The geographical location of the study area and the selection of sample points for various features are shown in Figure 1.

2.2. Data

In this paper, the remote sensing data of Sentinel-2 satellite are selected as the remote sensing data source for the spatiotemporal change analysis. The Sentinel-2 image download address is the official website of ESA (https://scihub.copernicus.eu/ (accessed on 10 March 2020)). The Sentinel-2 images data download from ESA is a high-resolution multispectral image satellite, carrying a multispectral imager (MSI) with 13 spectral bands for land monitoring [16]. Sentine-2 is divided into two satellites, 2A and 2B. The revisit period of one satellite is 10 days, and the revisit period of two satellites is 5 days or less. The highest spatial resolution of the Sentinel-2 satellite image is 10 m. It has the advantages of free access, high spatial resolution, wide coverage, and rich spectral bands information [17]. For land monitoring, it can provide images of vegetation, wasteland, bare land, water area, river course, and construction land [18]. The product grades of Sentinel images are divided into level-1C and level-2A. Level-1 C is the data only subject to radiometric correction and sub-pixel geometric fine correction, and level-2A is the atmospheric bottom layer reflectance data subject to atmospheric correction on the basis of level-1V [19]. In this paper, level-2A data are selected for effective analysis of eight bands, including visible light, near-infrared and short-wave infrared sensitive to soil land, CSTR, and other content. Before 2019, level-2A data was produced by using level-1C data through the SEN2COR plug-in in SNAP [20]. The bands’ parameters of the Sentinel-2 image are shown in Table 1.

3. Methods and Materials

The decision tree method (DTM) is a mathematical method to classify data by inductive learning through a certain amount of training samples to generate corresponding decision rules in the process of remote sensing classification and information extraction [21]. In recent years, because of its high robustness, easy-to-understand and intuitive classification rules, high classification accuracy, and high computational efficiency, DTM has been widely used in ground object recognition and extraction based on remote sensing images [22]. Using the training samples to analyze the spectrum features, index features, and texture features of various ground objects, according to the feature differences between the CSTR and the surrounding ground objects, the features of the CSTR were obtained by the DTM. The process of Sentinel 2 image extraction CSTR based on DTM is shown in Figure 2.

3.1. Characteristic Analysis

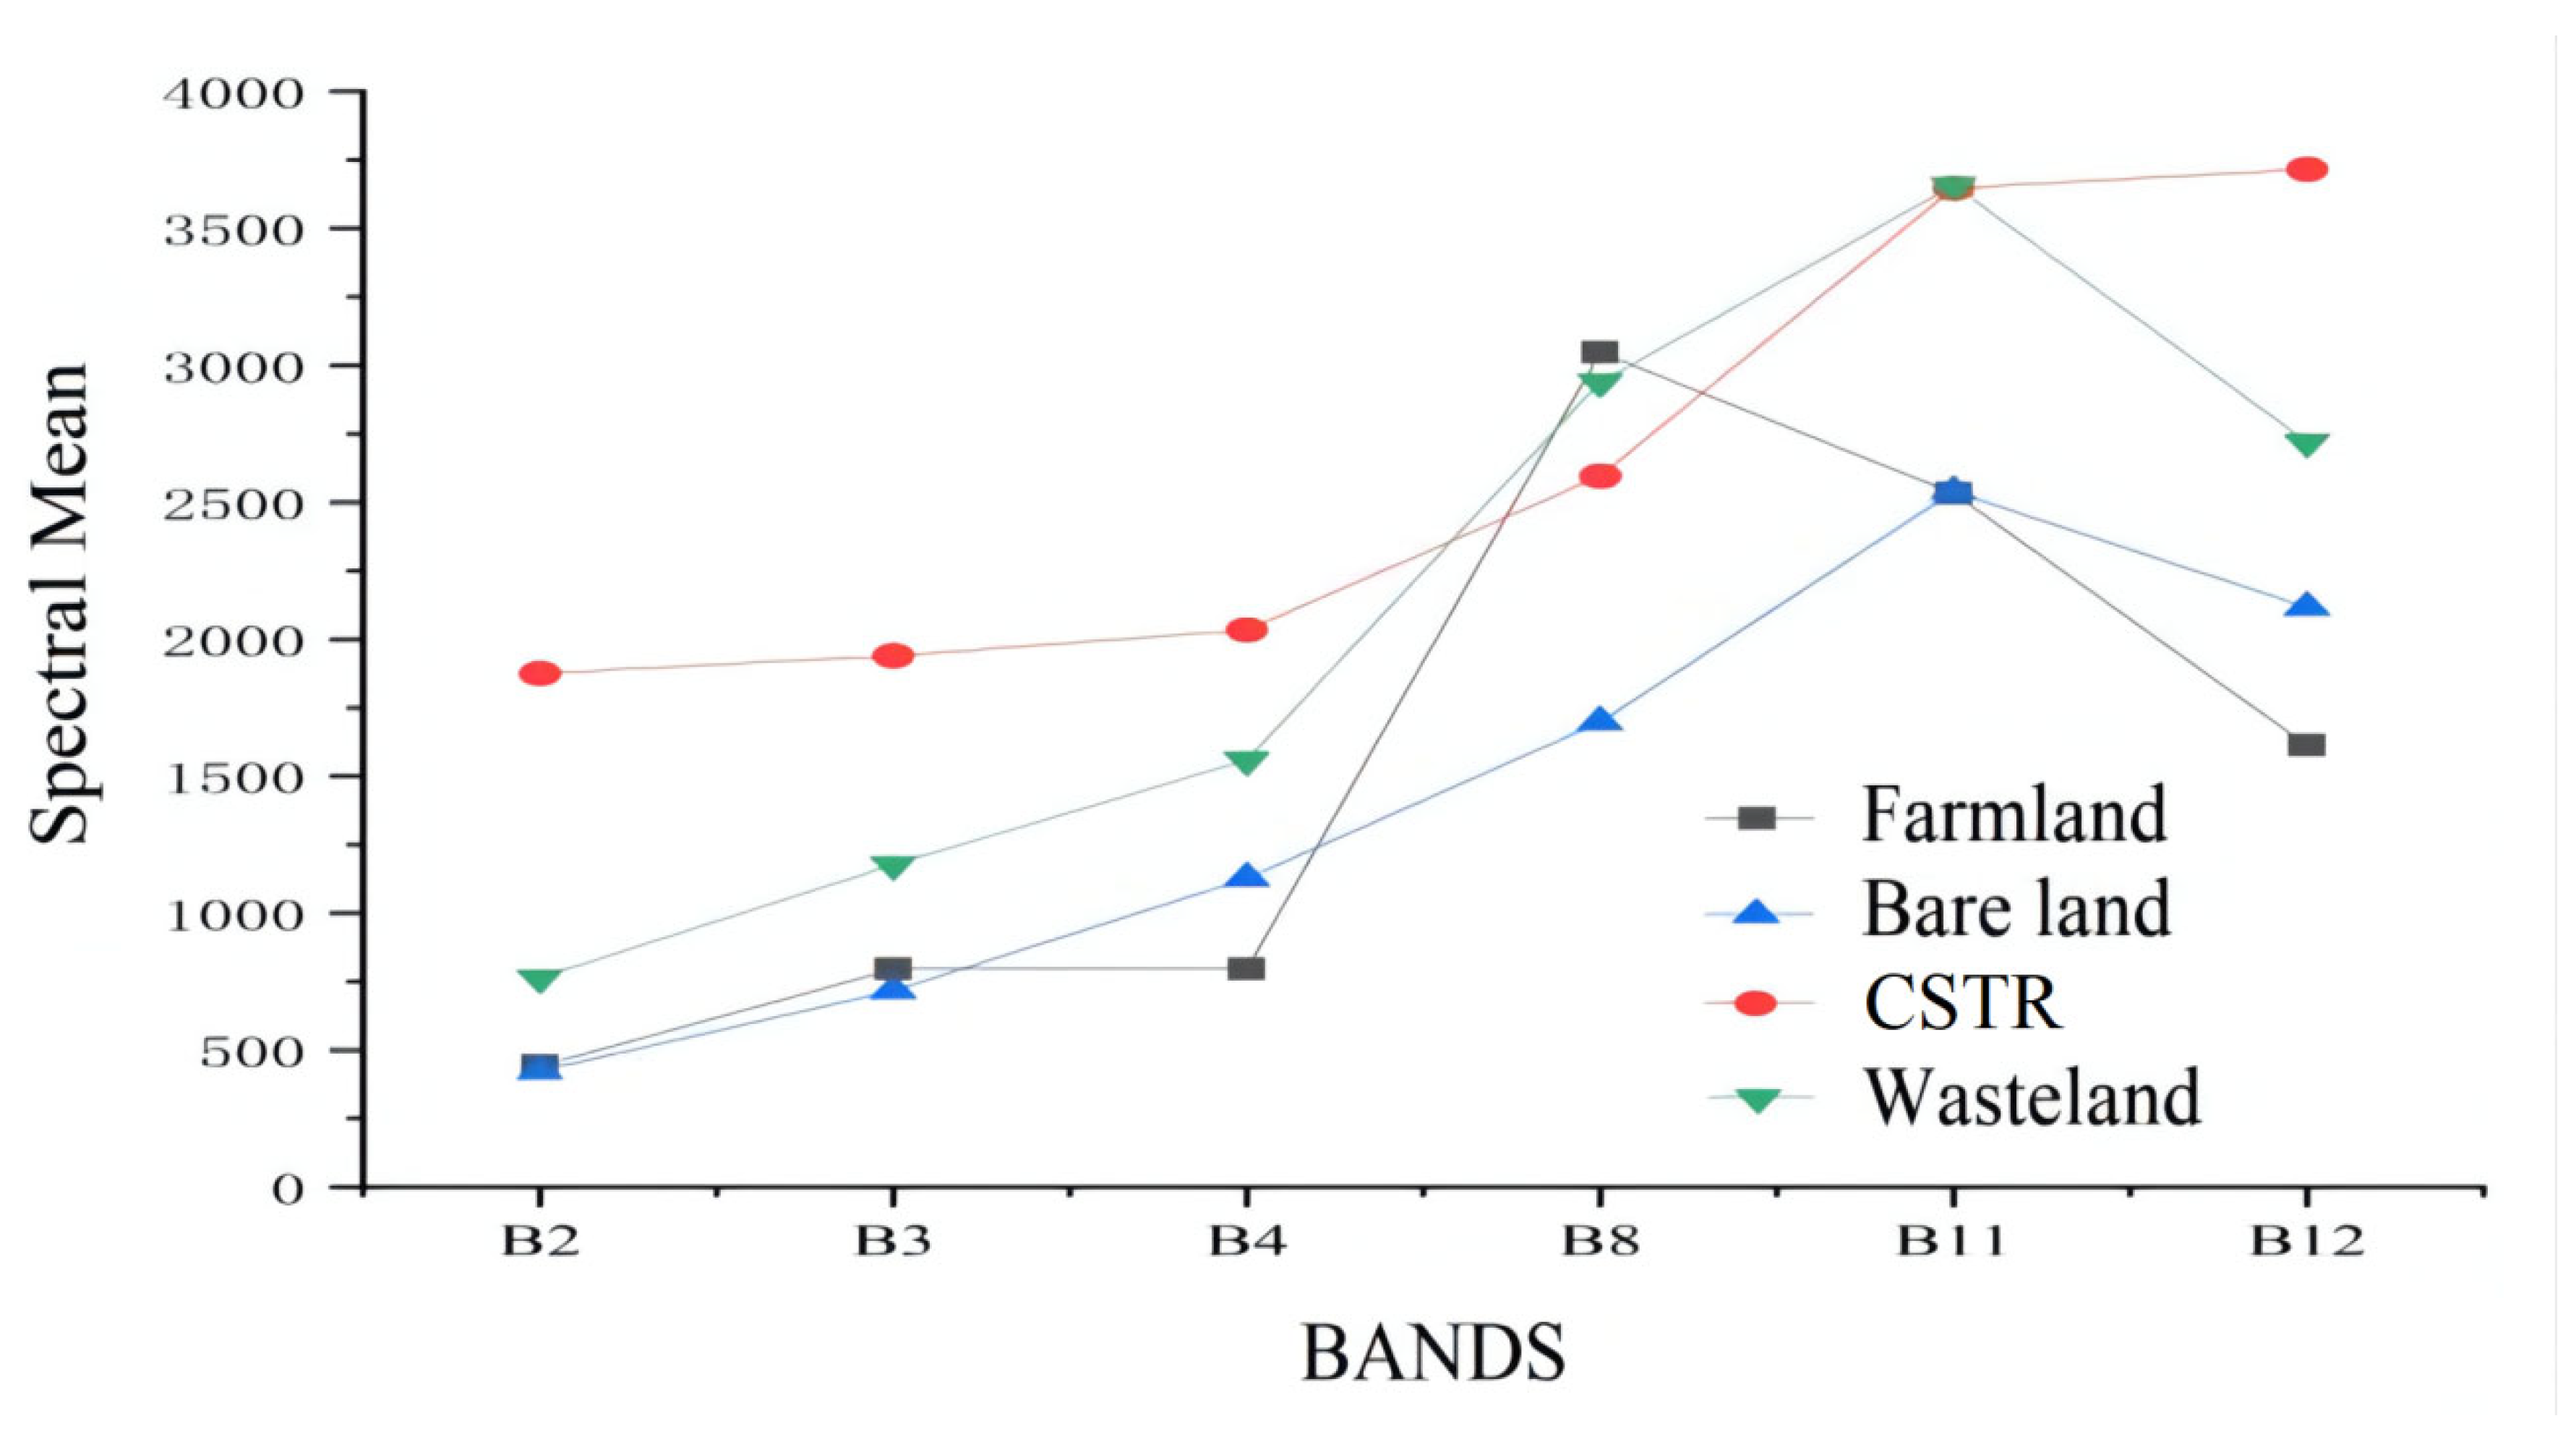
3.1.1. Spectral Characteristics

In the Sentinel image, combined with the sample points selected from Google Earth image, the spectral mean values of farmland, CSTR, bare land, and wasteland in each band were counted, and the spectral characteristic curve of sample data of each type was drawn according to the band information, as shown in Figure 3.
According to the spectral characteristic curve, the average spectral value of the CSTR is greater than 1800 in the six bands, and it is quite different from the other three types of ground objects in Band 2, and the curve is relatively flat in the visible light band, showing a gradual upward trend in the Band 8 and Band 11. Wasteland shows a gradual upward trend between visible light and Band 11 and a rapid decline in Band 11 and Band 12. An obvious reflection peak is formed at Band 11, which is quite different from CSTR. The farmland presents a typical spectral curve, with a reflection peak visible in Band 4 and Band 8. Because the climate in Kenya is dry and the vegetation moisture content is low, the wave peak is not obvious enough. The trend of the spectral curve of bare land is similar to that of CSTR, so it is difficult to distinguish from spectral features, and texture features can be added appropriately.

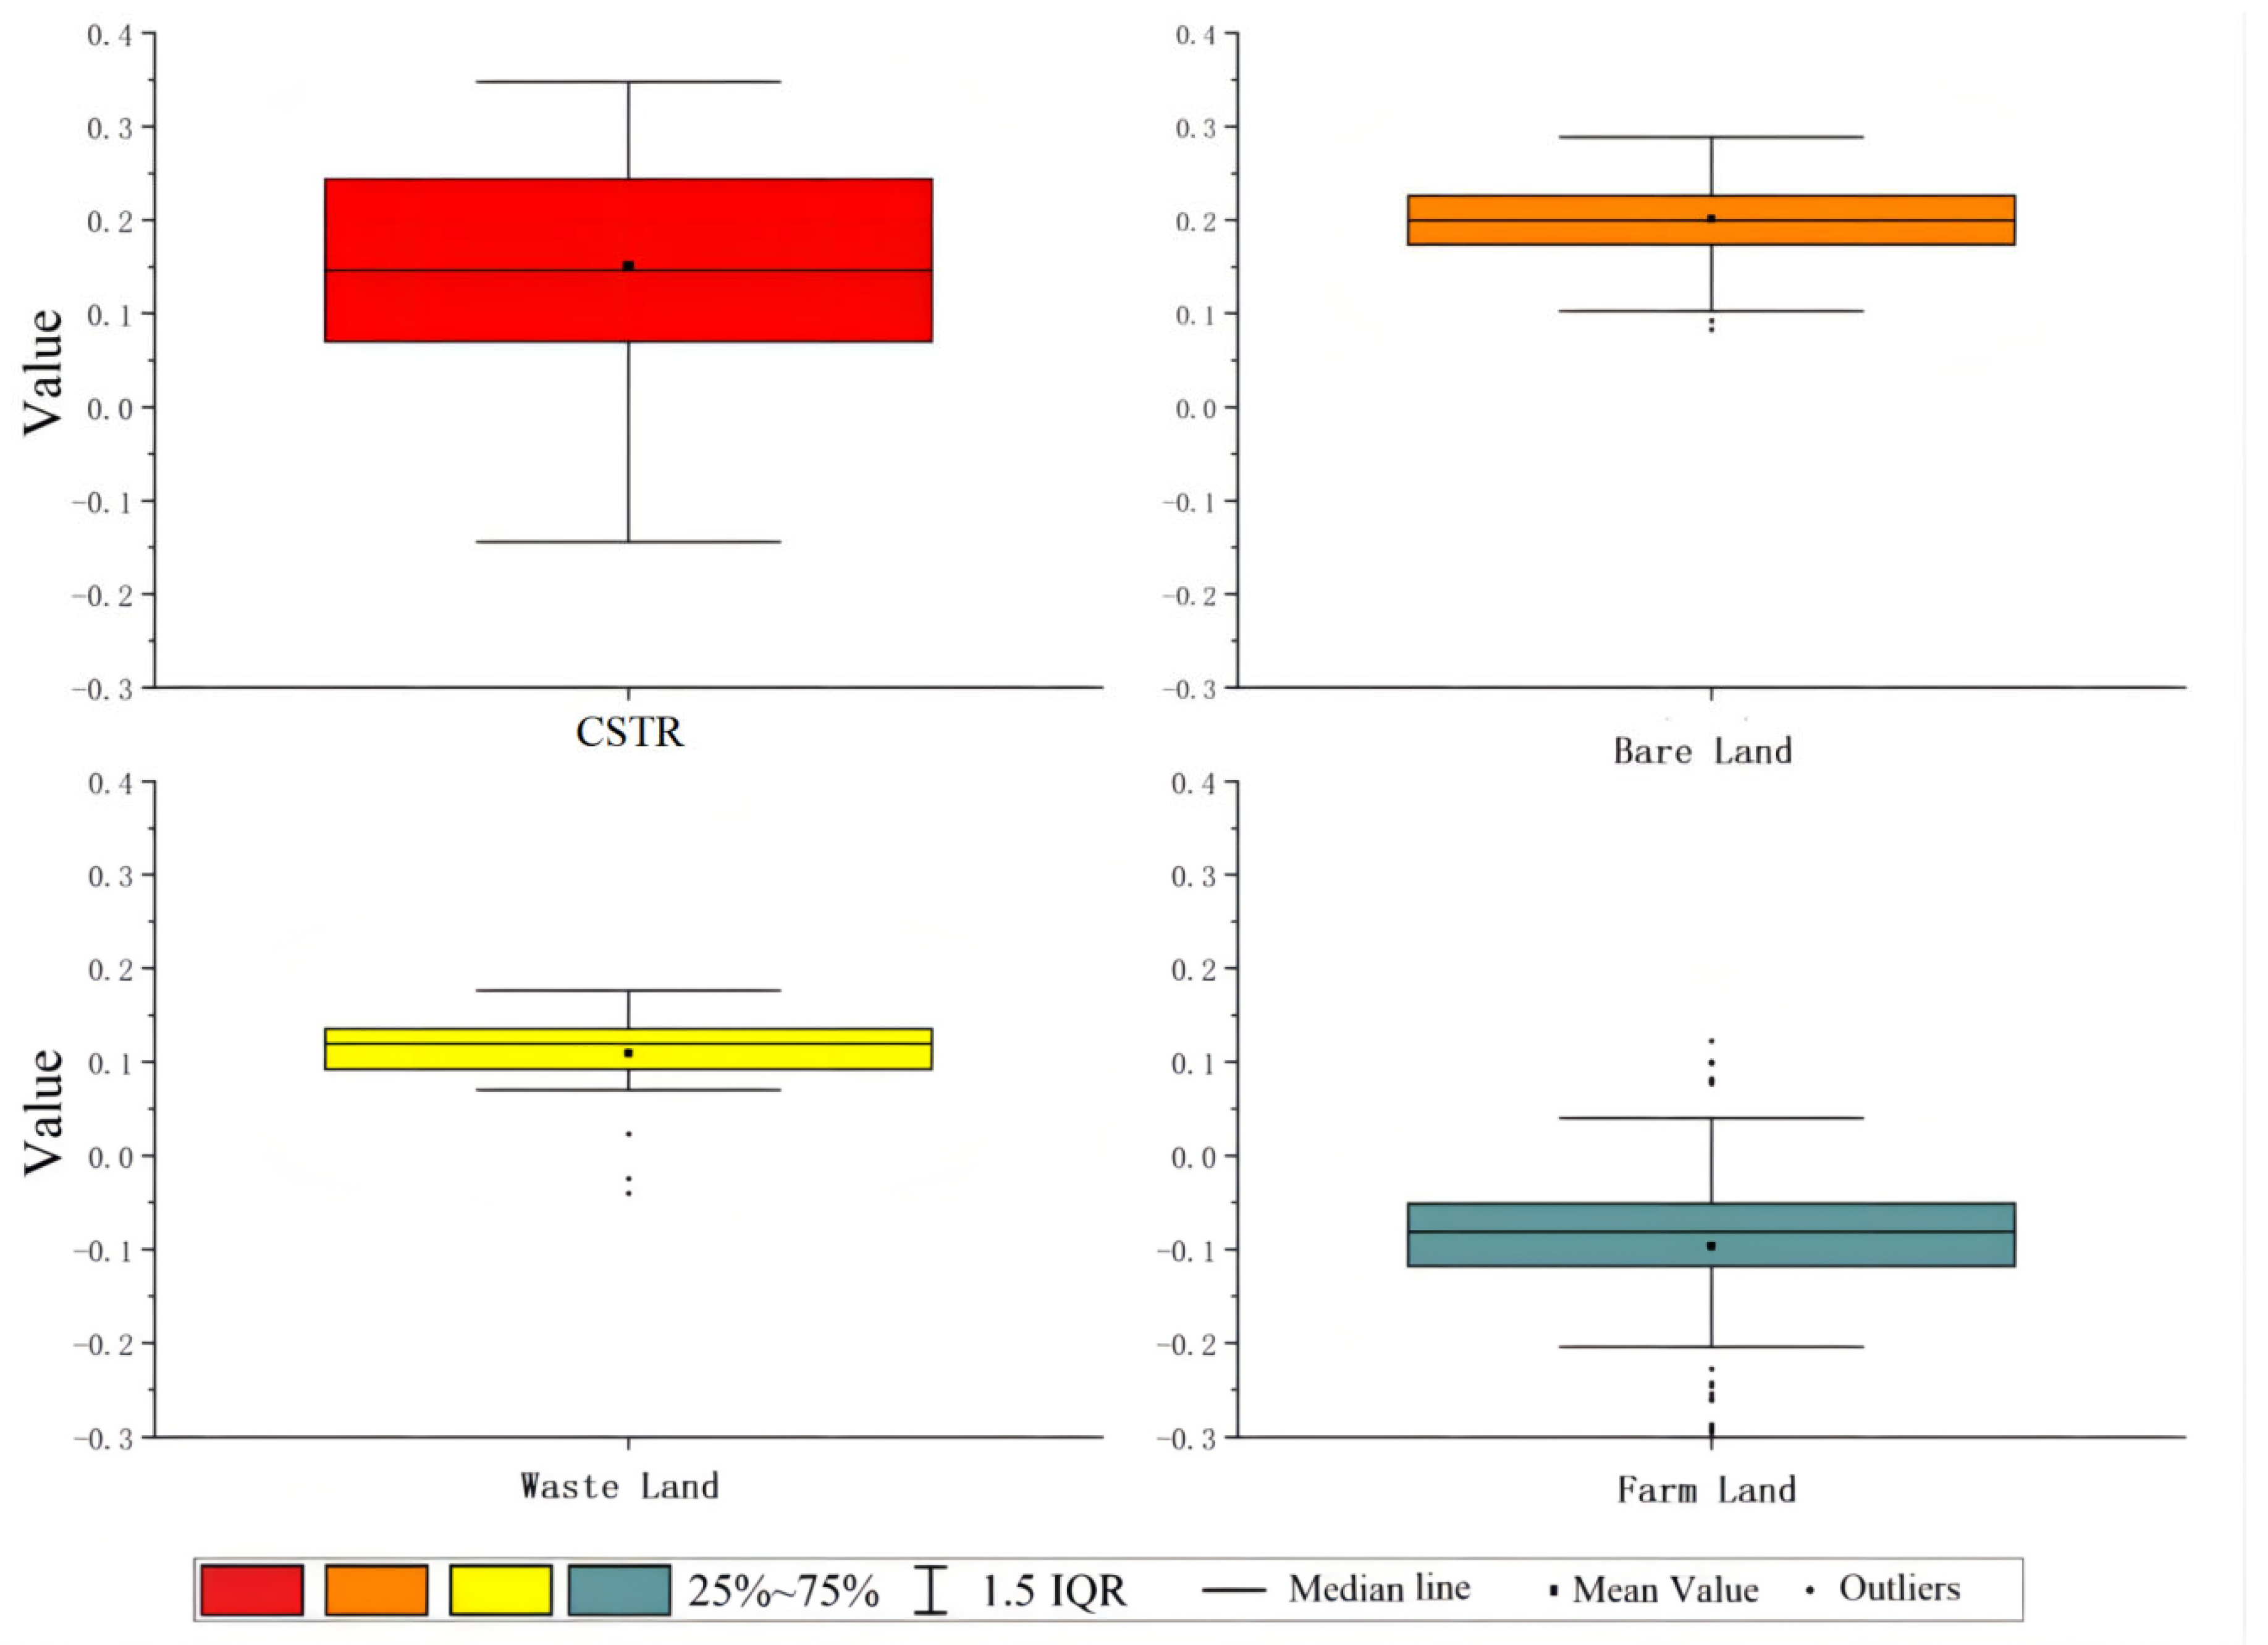
3.1.2. Analysis of Index Characteristics

(1)
Normalized Difference Vegetation Index (NDVI)
NDVI was first proposed by Rouse in 1974 [23], according to the plant biophysical mechanism that the Red light band is strongly absorbed by chlorophyll in vegetation, but NIR band is strongly reflected by leaf cell structure. The studies have shown that the NDVI is sensitive to areas with low coverage, especially those with vegetation coverage less than 80% [24,25]. The study area is located in the east of Africa, with a dry climate and low vegetation coverage. Therefore, NDVI index was used to identify farmland areas. The calculation formula is as Equation (1):
N D V I = ρ n i r ρ r e d ρ n i r + ρ r e d
where ρ n i r refers to NIR band, ρ r e d refers to Red band.
According to Equation (1), the NDVI was obtained from the data of Sentinel 2 images. The index characteristics of the 4 types of ground objects were statistically analyzed, and the box diagram was drawn. The results are shown in Figure 4.
According to the statistical analysis of the above box chart, the NDVI of farmland is mainly distributed between 0.45 and 0.70, with an average of 0.58, which is significantly larger than the average of 0.15 for CSTR, 0.31 for wasteland, and 0.18 for bare land.
(2)
Normalized Difference Build Index (NDBI)
NDBI, also known as Normalized Exposure Index, was first proposed by Cha [26] and others in 2003. Through the spectral characteristics of residential areas, there are obvious differences between NIR and SWIR1, and the differences of other ground feature types between the two bands are not obvious. The two bands are calculated to enhance the differences between the ground features. The calculation formula is as Equation (2):
N D B I = ρ s w i r 1 ρ n i r ρ s w i r 1 + ρ n i r
where, ρ n i r refers to NIR band, ρ s w i r 1 refers to SWIR band.
According to Equation (2), the NDBI index was obtained from the data of Sentinel-2 images. The index characteristics of the four types of ground objects were statistically analyzed, and the box diagram was drawn. The results are shown in Figure 5.
According to the statistical analysis of the above box chart, the average NDBI values of CSTR, wasteland, and bare land are 0.15, 0.11 and 0.20 respectively, which are all greater than 0, while the average NDBI values of farmland are less than 0, which is −0.09, significantly smaller than other ground features. Therefore, NDVI and NDBI indexes can be used to remove the influence of farmland on the extraction of CSTR. However, the NDBI and NDVI indexes of the other three types of features have a large overlap, so the CSTR cannot be accurately extracted, and the classification features need to be added.
(3)
Normalized Difference Surface Index (NDSI)
There is an obvious gap between the CSTR and the wasteland in terms of surface smoothness and water permeability. According to the analysis in Figure 2, there is a large difference between the spectral mean of wasteland in SWIR 1 and SWIR 2 bands, and the change rate is quite different from that of CSTR in the same band. The spectral curve of the wasteland shows a rapid downward trend between the two bands, and the spectral curve of the CSTR shows a stable trend and a small increase between the two bands. The Normalized Difference Surface Index (NDSI) was constructed to analyze the difference between wasteland and CSTR. The NDSI model was calculated as Equation (3):
N D S I = ρ s w i r 1 ρ s w i r 2 ρ s w i r 1 + ρ s w i r 2
where ρ s w i r 1 refers to WIR 1 band, ρ s w i r 2 refers to SWIR 2 band.
The calculated NDSI was drawn into a box diagram for analysis, and the results are shown in Figure 6.
It can be seen from Figure 6 that there is a significant difference between the two. NDSI of wasteland ranges from 0.12 to 0.18, with an average of 0.15; the NDSI index of CSTR is distributed between −0.06 and 0.06, with an average of 0.02, and the difference between the two is 0.13. Therefore, wasteland and CSTR can be distinguished by NDSI index.

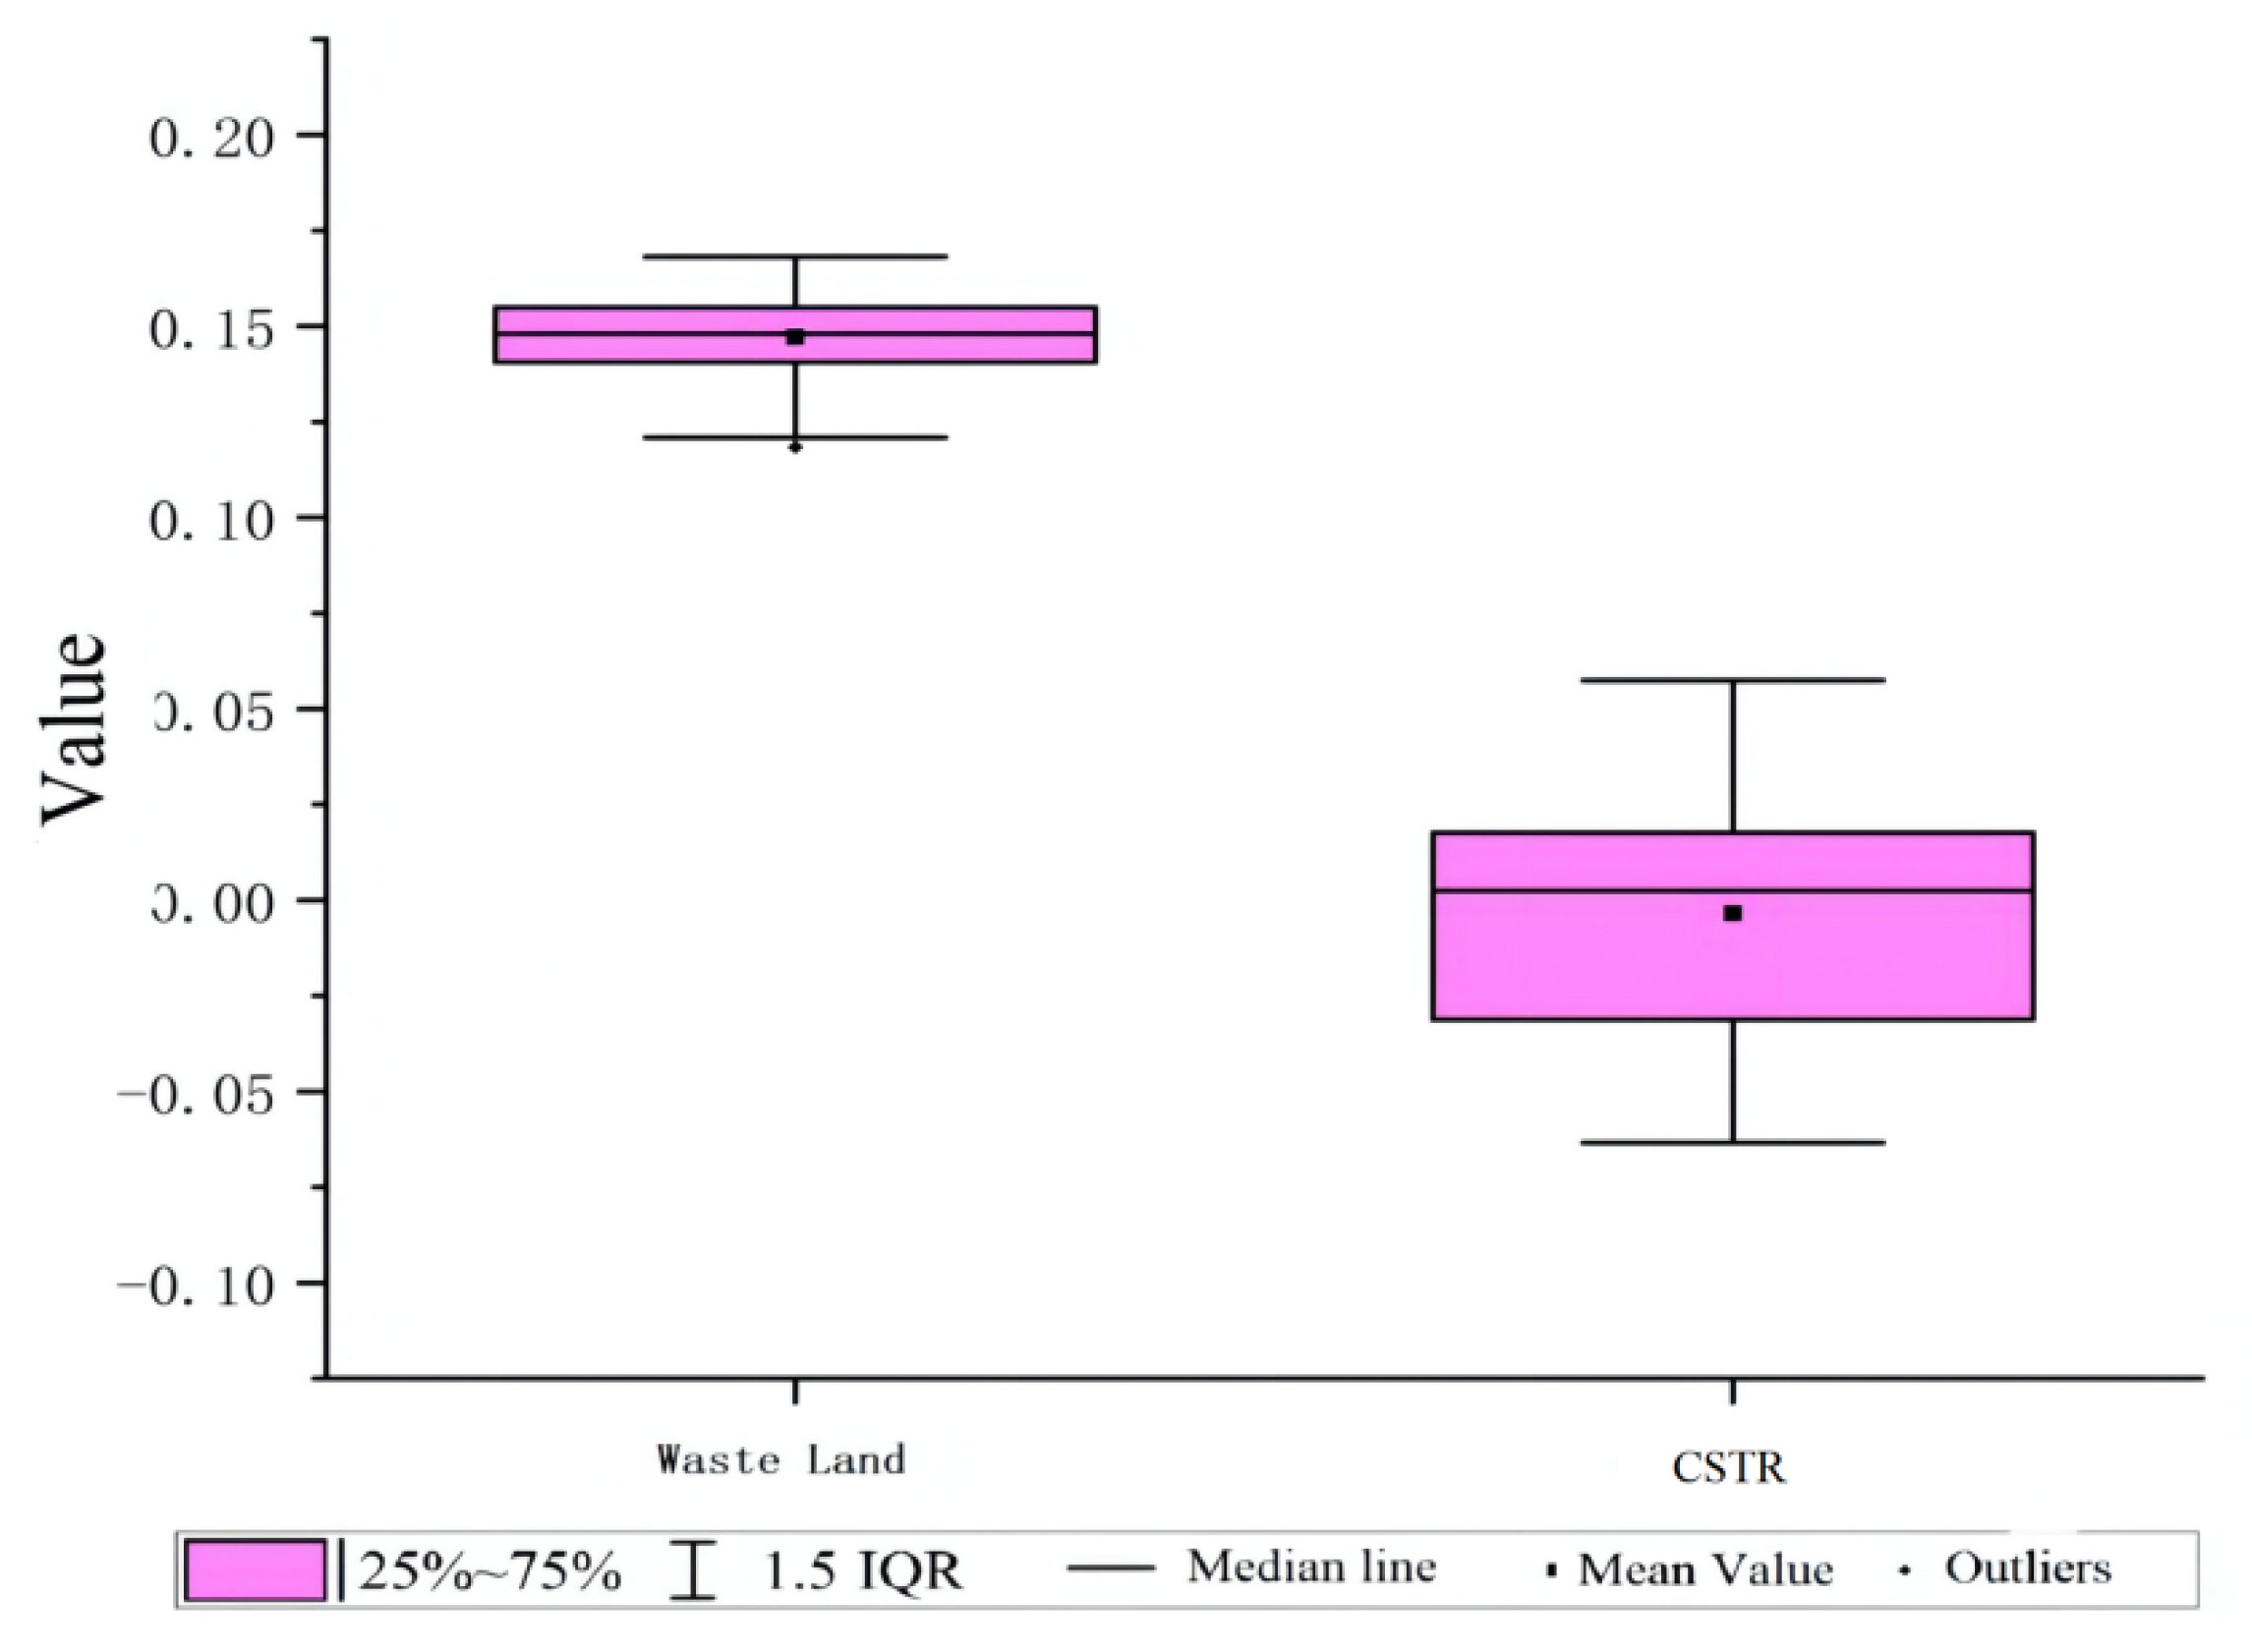
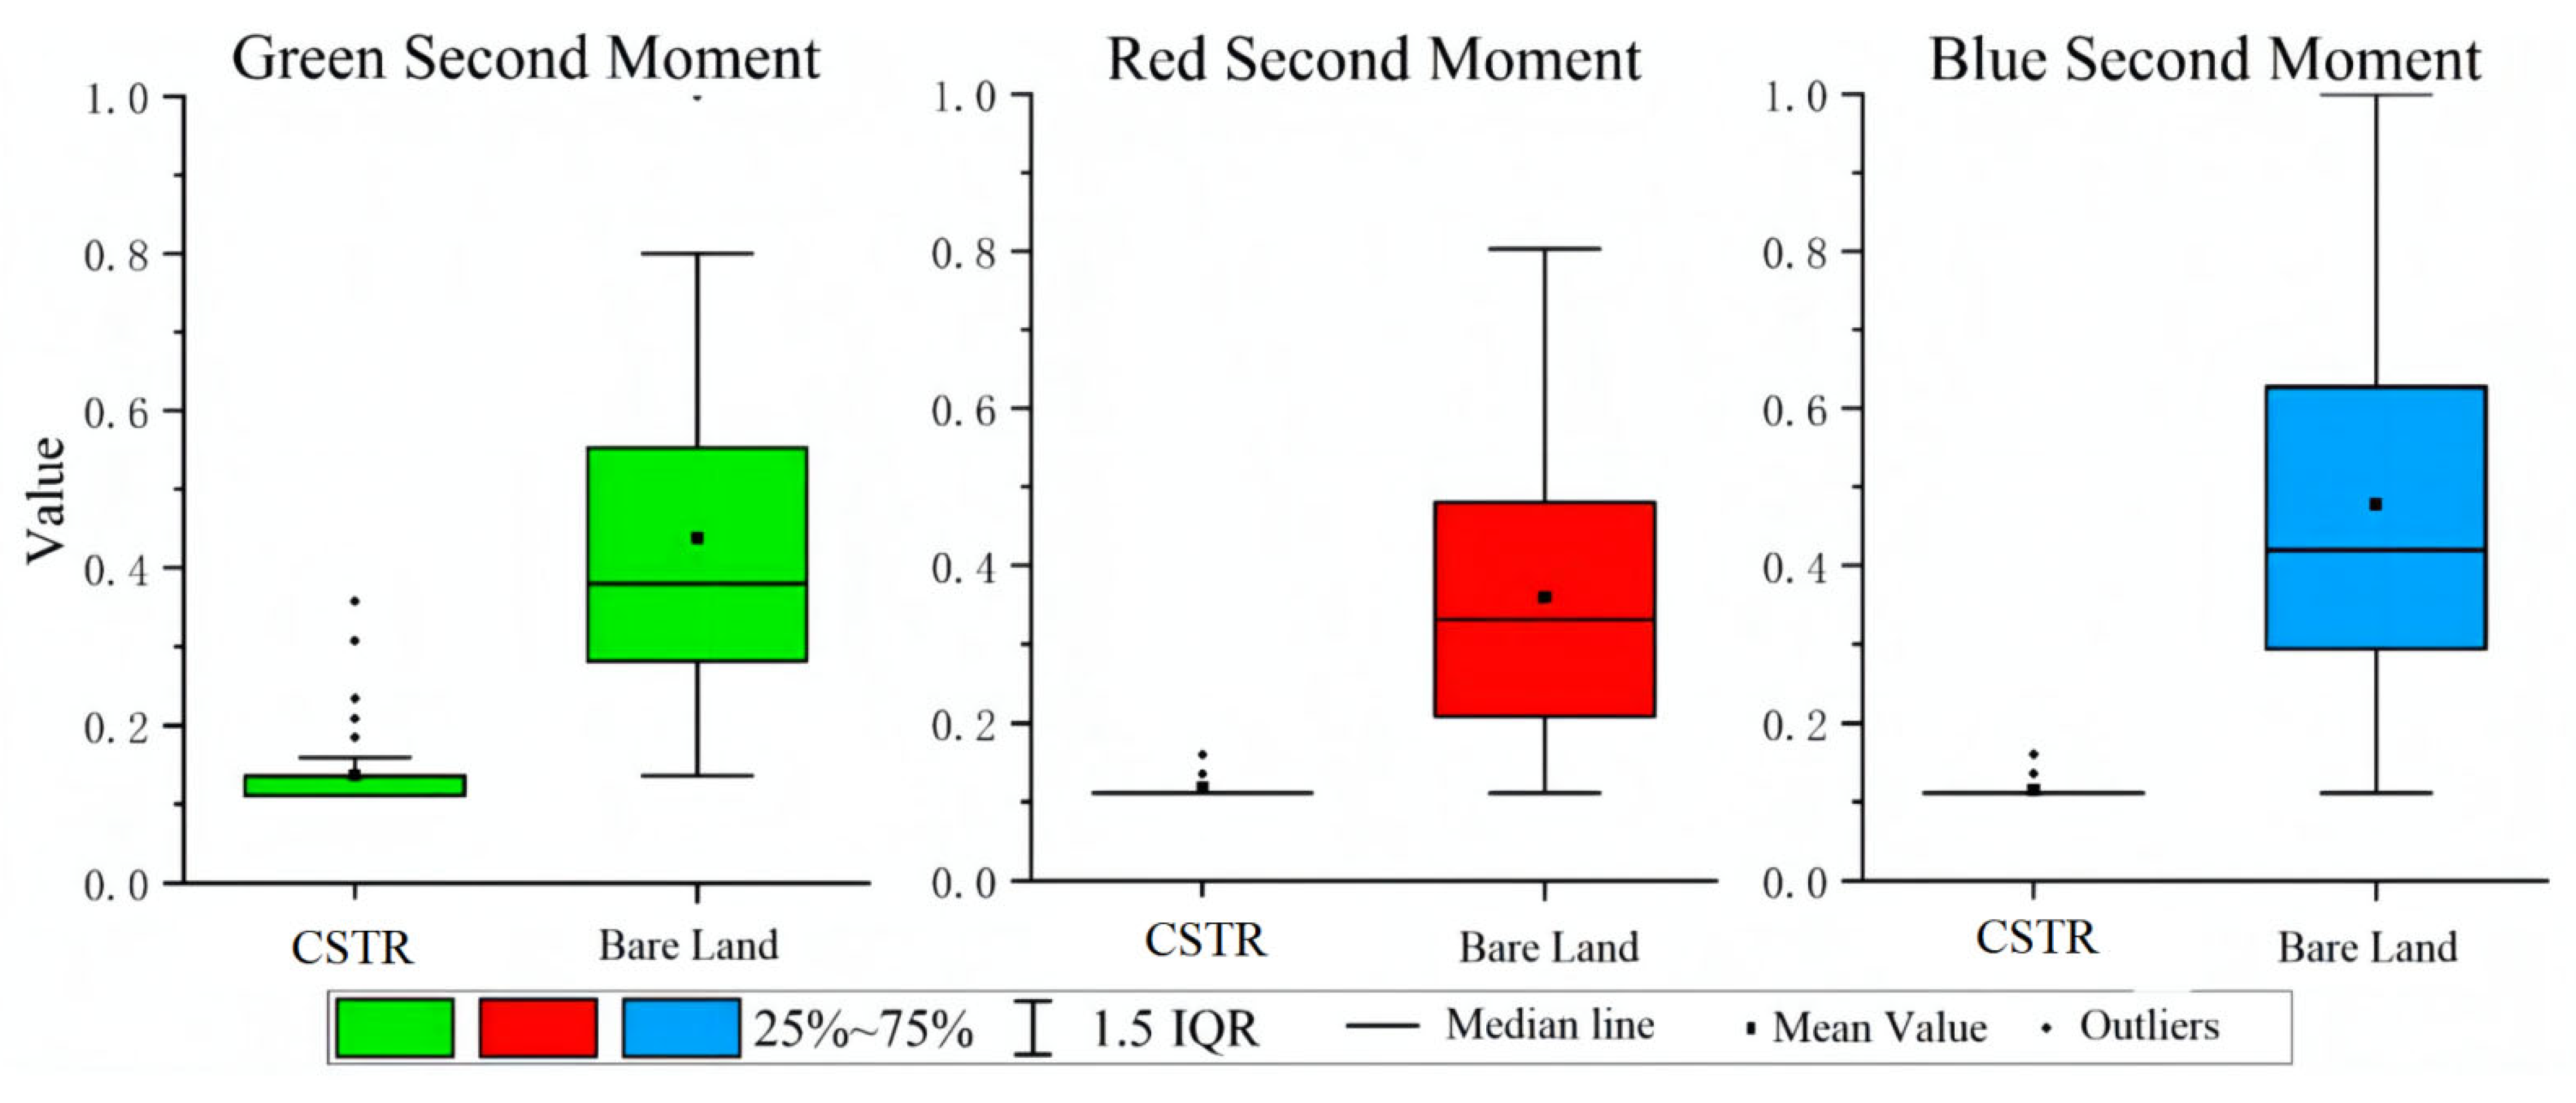
3.1.3. Texture Features

The gray-level co-occurrence matrix (GLCM) based on statistical analysis was used to analyze the texture features of ground objects. GLCM is a matrix that statistically describes a certain relationship between the gray levels of adjacent pixels or two pixels within a certain distance in a local region or the whole region in the image, that is, a symmetric matrix obtained by counting the probability density distribution of joint events in a certain direction (0°, 45°, 90°, 135°) in the reference window of a certain GLCM on the image where two gray levels, i and j, are d apart at the same time [27]. The matrix can represent the spatial correlation of pixel gray levels near the center point of the reference window and can effectively display the texture features of ground objects, so as to distinguish according to the difference of texture features between the CSTR and the bare land.
The data processing software adopts ENVI to calculate 48 texture features of Red, Green, Blue, NIR, SWIR 1, and SWIR 2 bands through GLCM filtering, including mean value, variance, synergy, contrast, dissimilarity, information entropy, second-order moment, and correlation. As per the method of Lu [28] and others, we selected the best texture feature to distinguish between lodging wheat and normal wheat by calculating the coefficient of variation (CV) and relative difference (RD) of the texture features. In order to select the best texture feature to distinguish CSTR and bare land, we used the statistical function of ENVI, selected the sample points of CSTR and bare land in the study area, and obtained the mean and variance of 48 texture features and calculated the CV and relative difference between them through the mean and variance. Calculated by using Equations (4) and (5), the statistical results are shown in Table 2:
C V = ( σ 2 / μ ) × 100 %
R D = ( ( μ 1 μ 2 ) / μ 1 ) × 100 %
where, CV is the coefficient of variation, RD is the relative difference, μ is mean value of texture features, σ2 is variance of local texture features.
According to the calculation, the CV and RD of each texture feature are very different between different ground objects. The biggest RD between CSTR and bare land is the blue homogeneity, with a value of 404.75%. The minimum RD is the SWIR 1 mean value, which is 139.44%. In CSTR, the smaller CV includes B Homogeneity, G Homogeneity, and R Second Moment. In bare land, smaller CV includes B Homogeneity, G Second Moment, R Second Moment, and NI Second Moment. However, the largest RD values mainly include B Homogeneity, B Second moment, G Homogeneity, G Second moment, and R Second moment. We calculated the contrast characteristics according to the above method in the CSTR: the highest CV is the SWIR 2, with a value of 5510.22%, and the lowest CV is the blue second moment, which is 0.1251%. In the bare land, the NI Second Moment with the largest CV is 1333.64%, and the G homogeneity with the smallest CV is 3.0137%. By analyzing the CV and RD, the top 10 texture features with large relative differences were selected, and then these 10 features were sorted according to the CV. They were combined with the ranking results of RD and CV, and three texture features with small CV and large RD were selected as the texture features to distinguish between CSTR and bare land.
In order to better distinguish between the two types of ground objects, texture features with large RD and small CV should be selected [29]. Based on the analysis of the difference of texture features in Table 2 and Table 3, texture features suitable for distinguishing CSTR and bare soil were selected as Blue second-order moment, Green second-order moment, and Red second-order moment, respectively. In terms of RD, the RD of Blue second moment, Green second moment, and Red second moment were 315.52%, 255.05%, and 205.51%, respectively; in terms of CV, the Blue second moment, Green second moment, and Red second moment of CSTR were 0.1251%, 0.8633%, and 0.2017%, respectively. The results show that the second-order moment feature analysis can enhance the difference between the images of CSTR and bare land more than other texture features. As shown in Figure 7, compared with bare land and CSTR, the median and mean values of the three texture features are significantly larger. The values of the three texture features of the CSTR are small and the distribution is compact, but a small part of them will coincide with the bare land near the minimum value, which may cause the possibility of misclassification of pixels. In order to better distinguish the CSTR from the bare land, combined with the spectral curve of the ground object, the obvious difference between the CSTR and the bare land in the Blue band was used to improve the extraction accuracy of the CSTR.

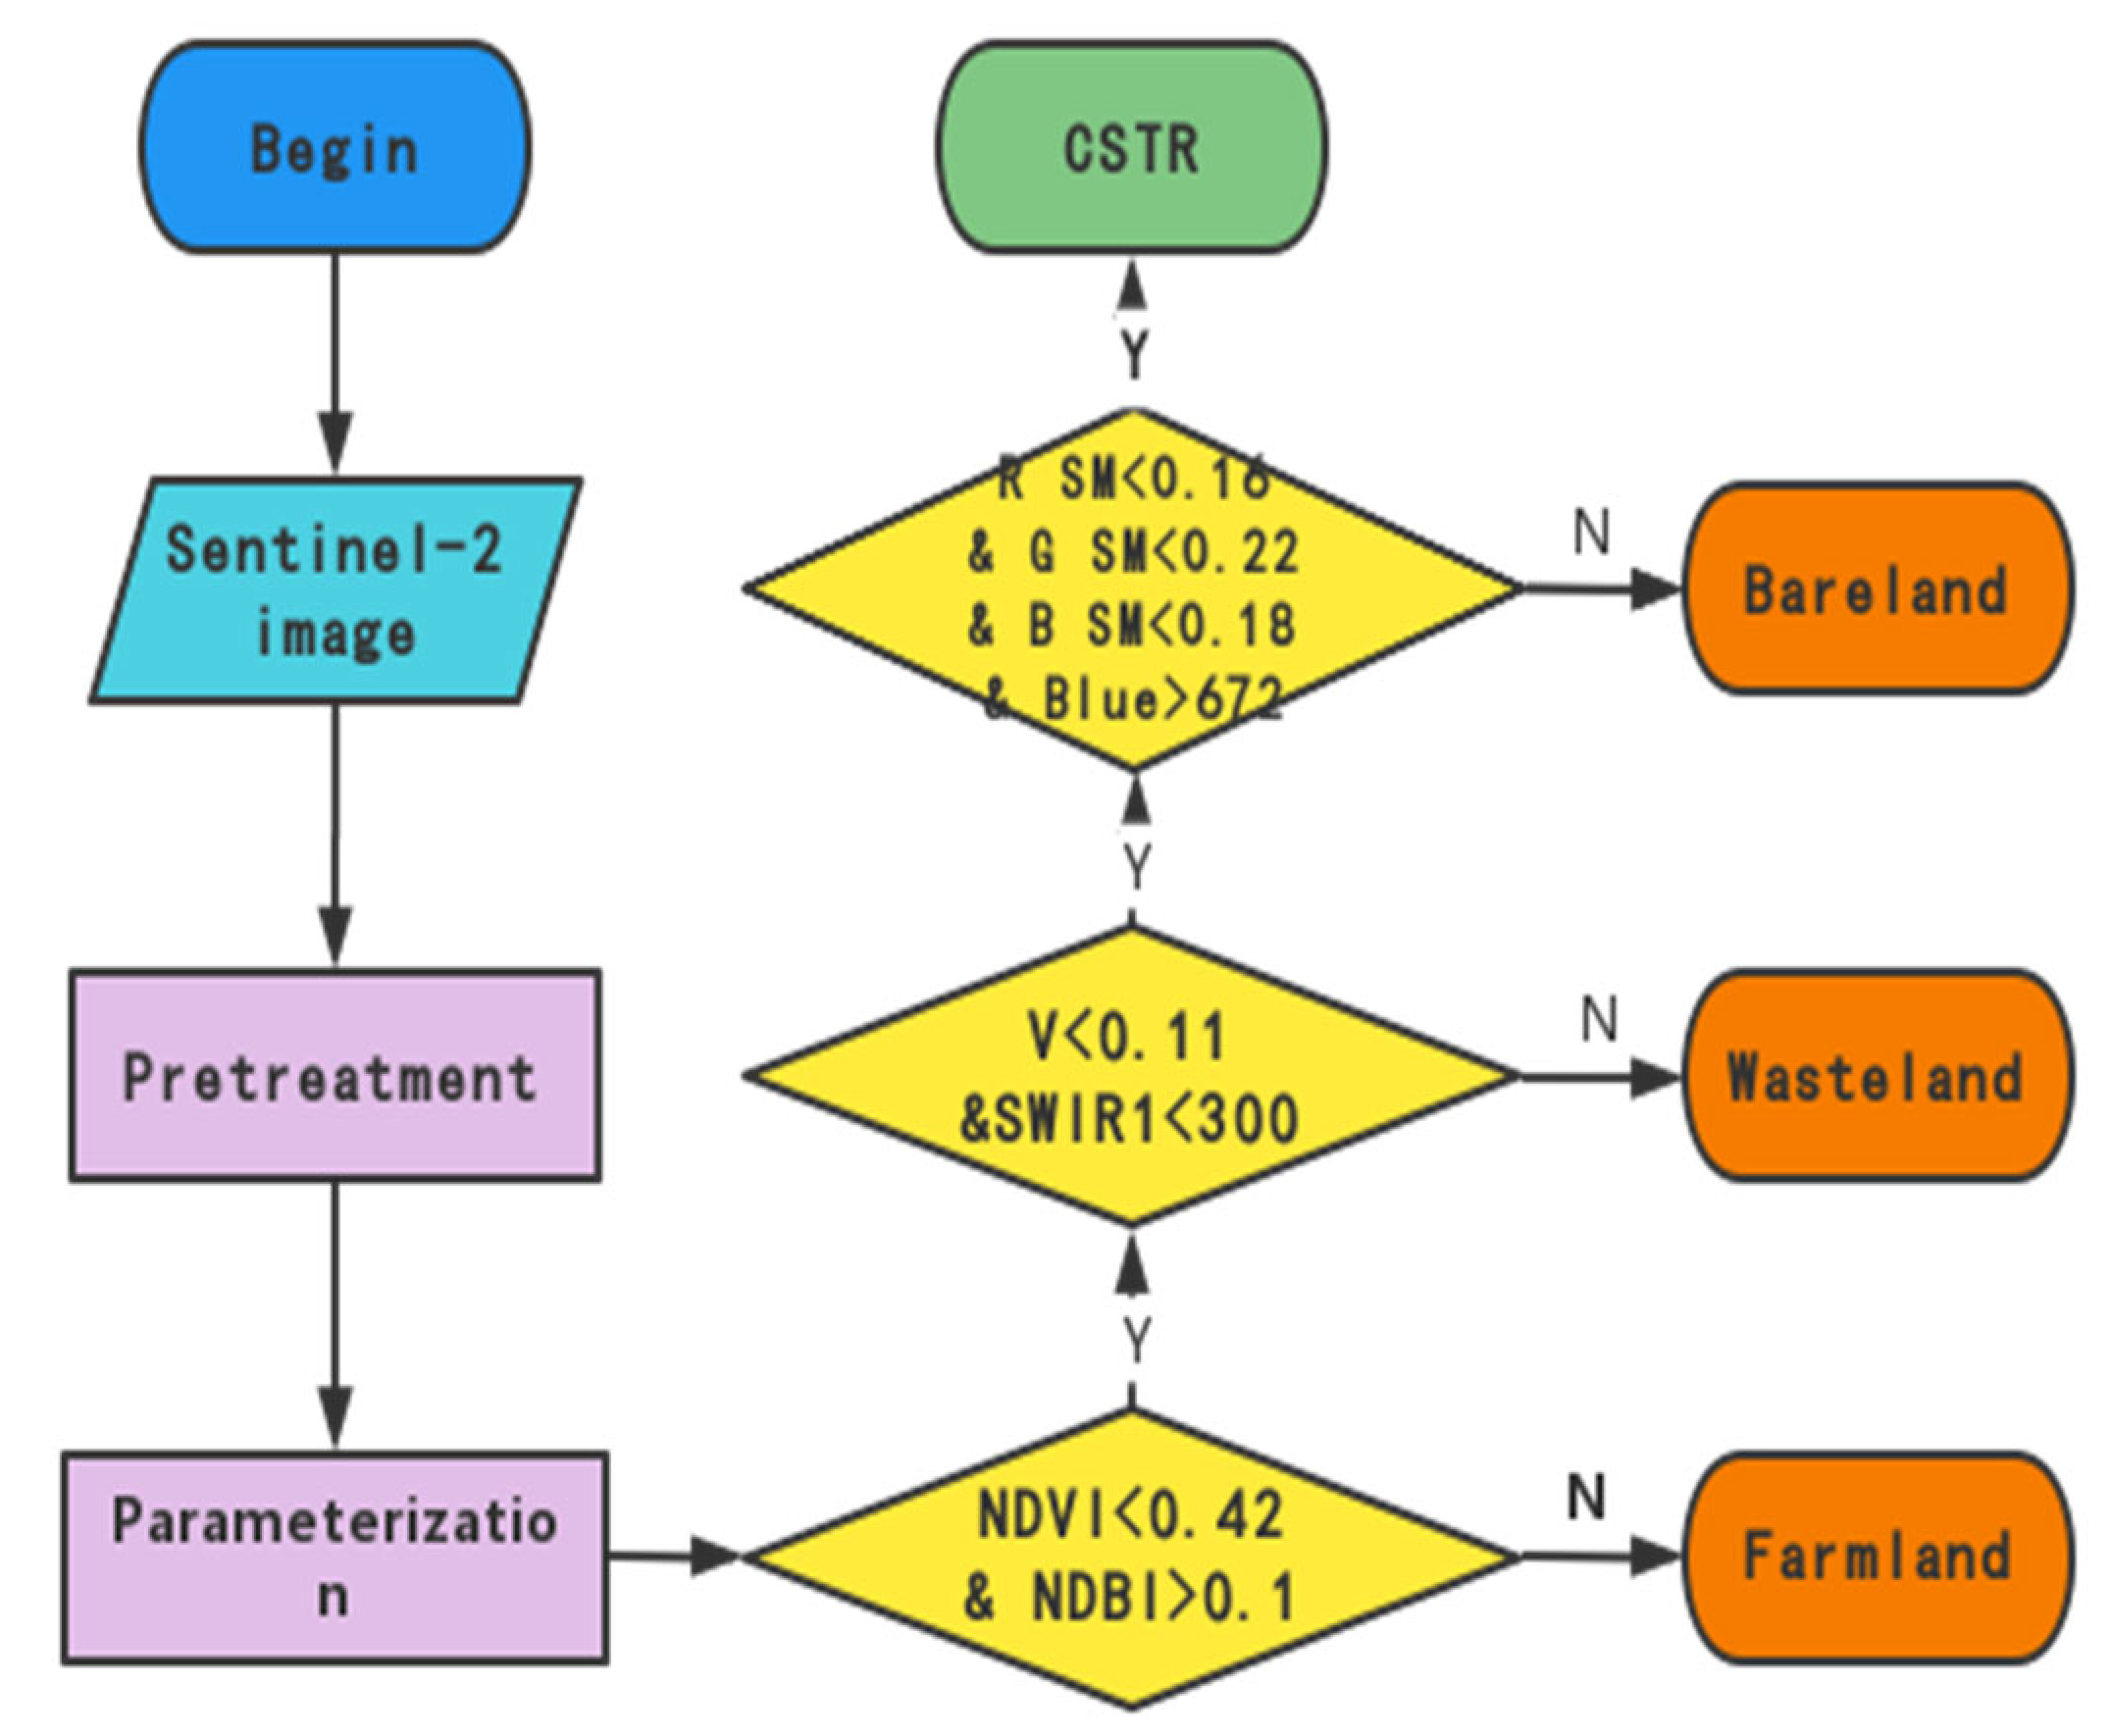
3.2. Construction of CSTR Extraction Model

According to the above analysis, the DTM classification based on the threshold method can be used to extract the CSTR. Through the comparison and analysis of many tests, when the best classification features and their threshold conditions shown in Table 3 are met, the interference features can be removed better, and the effect of extracting CSTR is the best.
It can be seen from Table 4 that when NDVI is greater than 0.42 and NDVI is less than 0.1, farmland can be removed better. The mean NDSI value of CSTR is −0.03, and that of wasteland is 0.18. Using the obvious difference between the spectral characteristics of wasteland and bare land in the SWIR 1 band, setting V > 0.11 and SWIR1 > 3000 can effectively eliminate wasteland. According to the difference between the texture characteristics of the CSTR and the bare land, we set the Blue second moment, the Green second moment, and the Red second moment to be less than 0.16, 0.22, and 0.18, respectively, and set the Blue band threshold as Blue > 672 in combination with the obvious difference in the spectral characteristics of the two in the Blue band, which can effectively distinguish the CSTR and the bare land.

4. Results

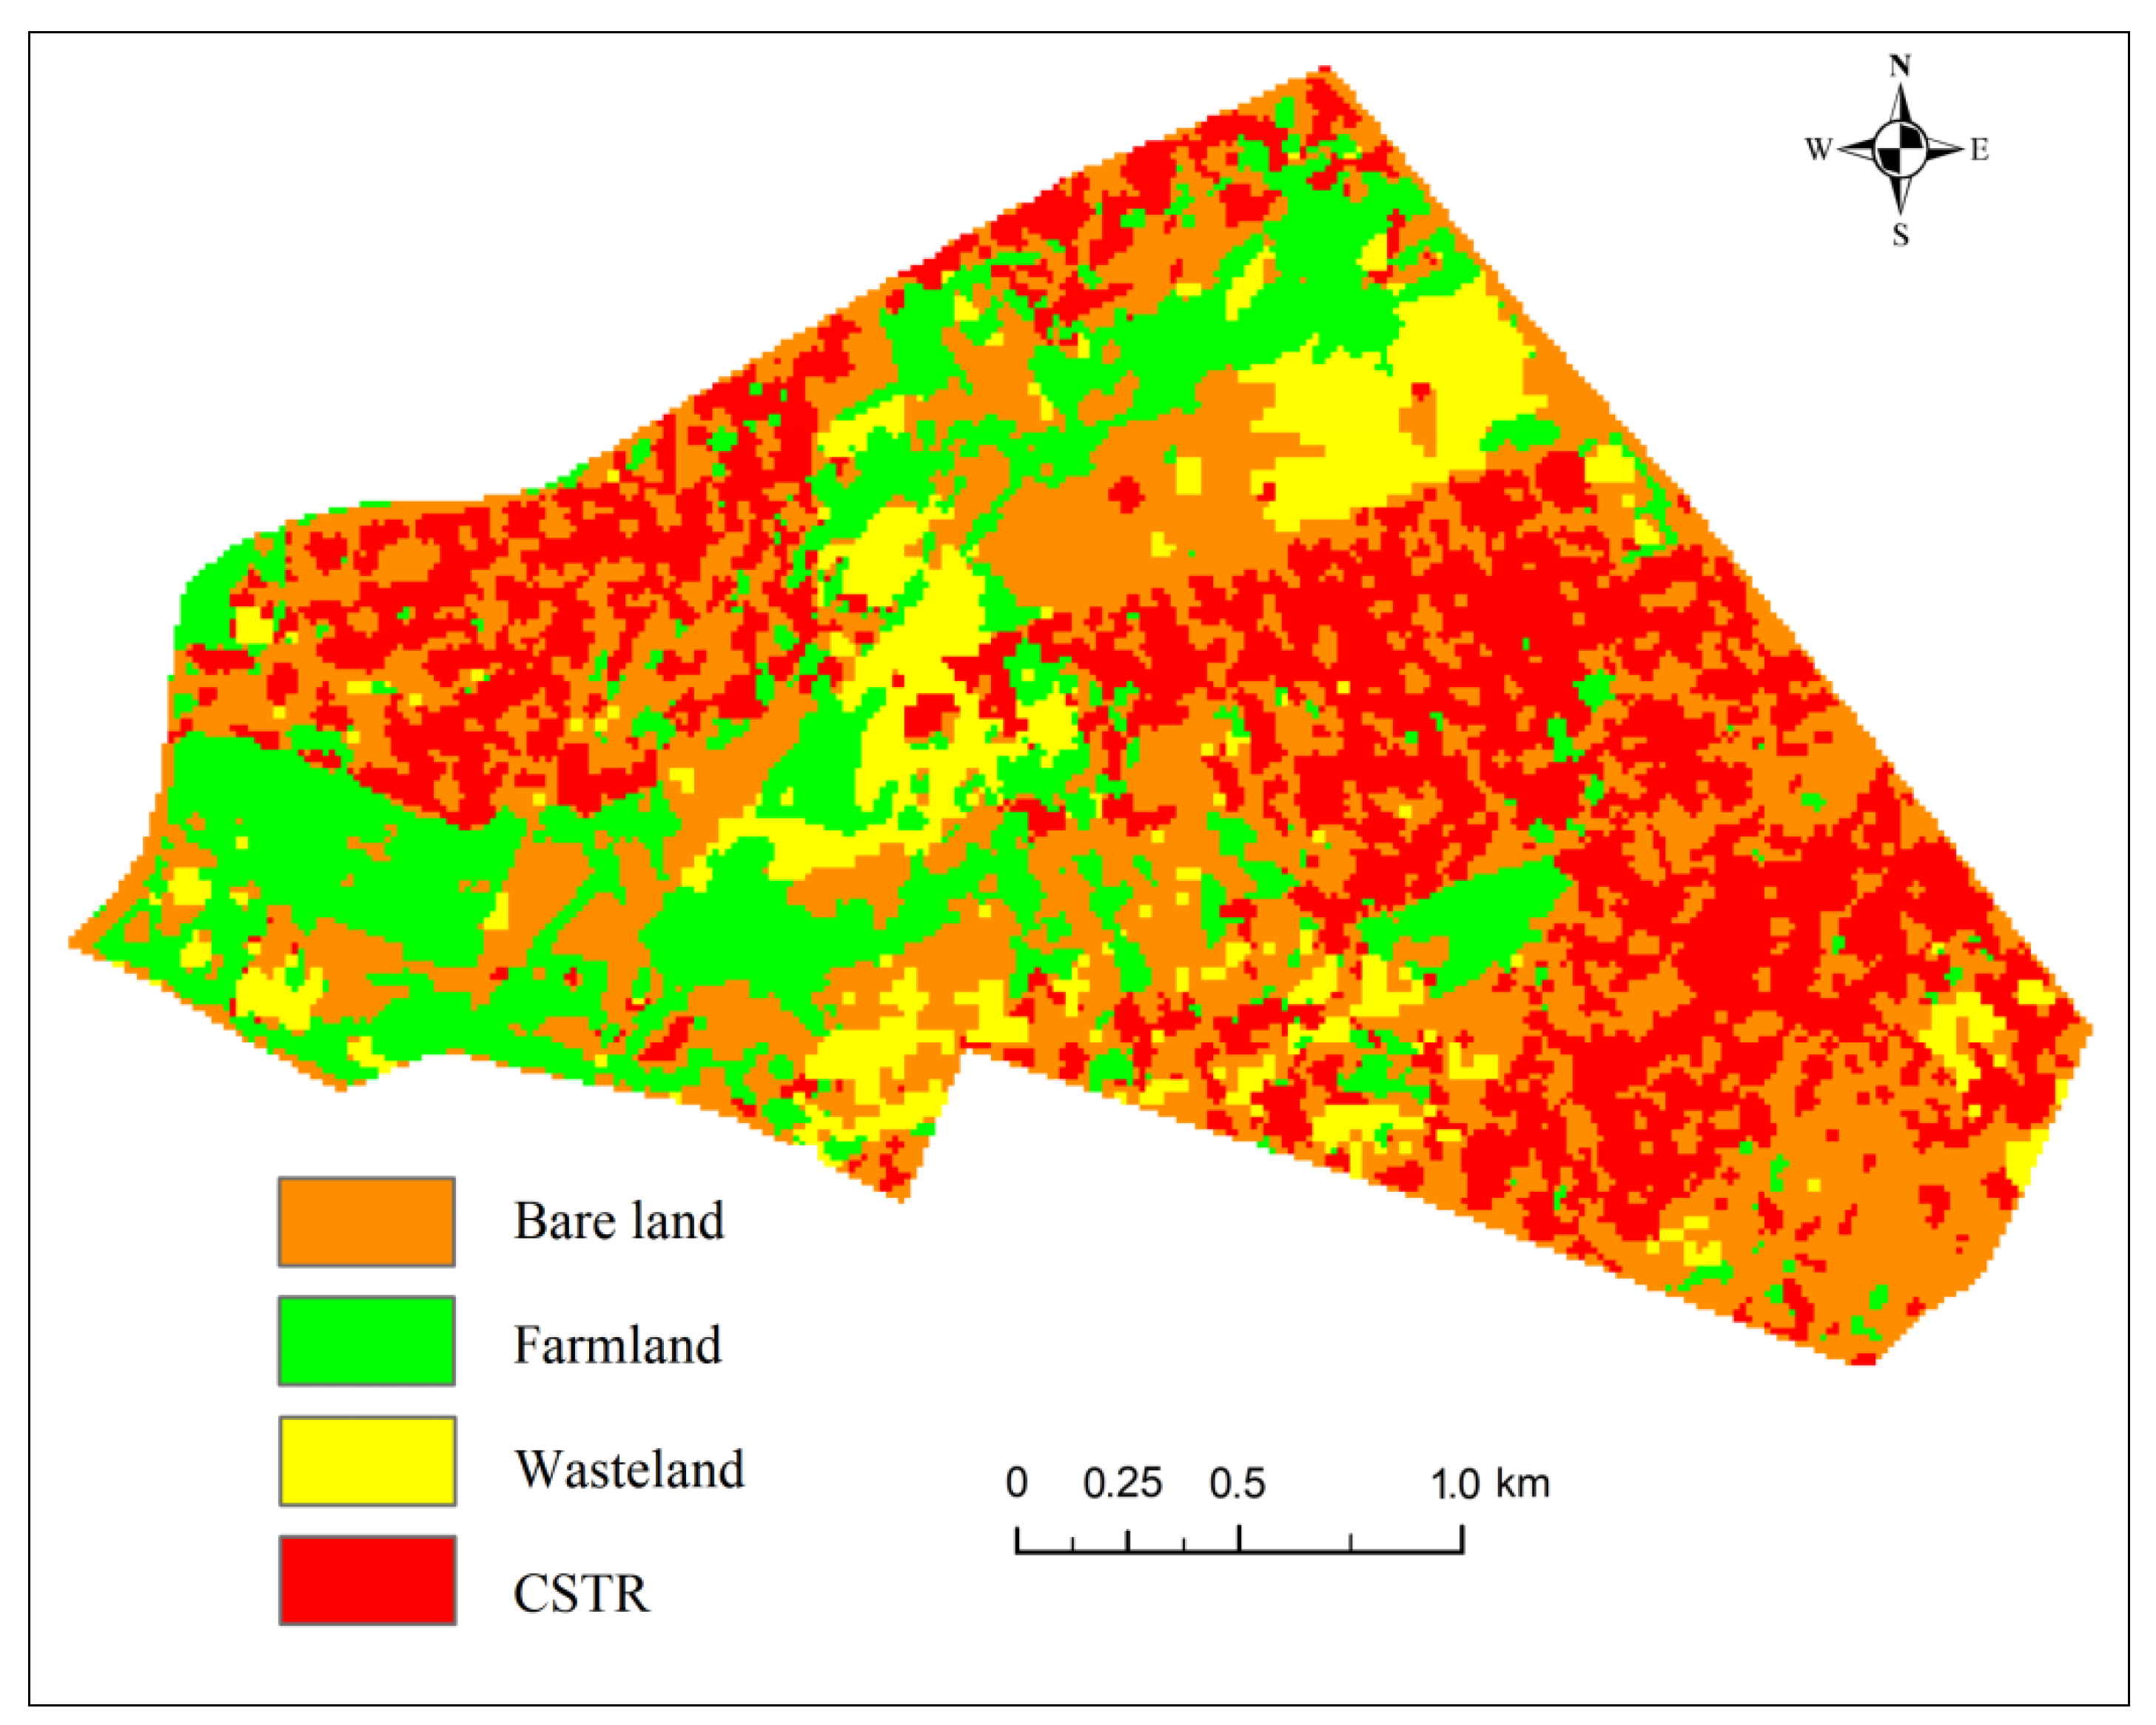
4.1. Classification and Analysis of Ground

The DTM classification was performed according to the CSTR extraction model. As the extraction of CSTR was being mainly studied, we masked the rest of the ground features and compared the extraction results of CSTR image, as shown in Figure 8.
According to the classification results shown in Figure 8, CSTRs are concentrated and distributed in the study area, most densely around the road. We selected the sample area for visual discrimination and compared the extraction results of DTM. Through this study with the sample, the extraction accuracy of the CSTR will be determined.
In order to objectively and truly evaluate the extraction accuracy of CSTR, the confusion matrix method was used. Combined with high-resolution images and field conditions, the visual interpretation method was used to select the inspection sample points of various ground objects in the study area. The confusion matrix was constructed through ENVI to obtain the drawing accuracy, user accuracy, and Kappa coefficient of the CSTR. The Kappa coefficient is 0.9223, the mapping accuracy is 91.10%, and the user accuracy is 97.79%. The verification results obtained by using the confusion matrix show that the extraction model has high accuracy and can realize the remote sensing monitoring of the spatial distribution of the CSTR.

4.2. Analysis and Verification

The study focuses on the impact of the municipal road project on the temporal and spatial changes of the CSTR. In order to reduce the impact of surrounding roads, environment, and other factors, the images of the size of the demonstration enclosure shown in Figure 9 and in a short period before and after the completion of the project were selected to study the temporal and spatial changes. The earliest available Sentinel data in this region is the 2016 image, so the data from March to May 2016–2020 were selected. In order to express ground objects more clearly, images with little or no cloud and good quality were selected [30]. The extraction results are shown in Figure 9.
According to Figure 9, from 2016 to 2020, the distribution density of CSTR in residential areas covered by roads continued to rise, and the overall area gradually increased. Through the statistical function, the number of pixels of the CSTR in the extraction results of each year was obtained, and its area was calculated according to the pixel size. The space–time analysis of the CSTR was carried out by using the two indicators of annual growth and annual growth rate [31]. As the building increase period is long, the extracted results were divided into two stages: from 2016 to 2018 and from 2018 to 2020. The calculation formula and statistical results are as Equations (6) and (7):
A I = A e n d A s t a r t d
A G R = 100 % × ( A e n d A s t a r t d 1 )
where AI is the annual growth, AGR is the annual growth rate, Astart is the area of the start year, Aend is the area of the end year, d is the time series of the study.
According to Table 4, it is obvious that the CSTR area has increased in both time periods, but the annual growth area during 2018–2020 has doubled compared with that during 2016–2018, and the annual growth rate has increased by three percentage points. The period 2016–2018 is the construction stage and initial operation stage of Eldoret municipal road. The infrastructure is not perfect, and the road does not give full play to its economic benefits, resulting in a low annual growth rate of CSTR. During 2018–2020, the infrastructure will be gradually improved, roads will be fully put into operation, transportation tasks undertaken, full play given to its economic value, and the development of the living standards of the local population actively promoted. The annual growth rate of CSTR reached 0.0454 km2, with an annual growth rate of about 7.29%, which played a substantial role in improving the economic level of local residents, as shown in Figure 10.

5. Discussion

5.1. Evaluation of Research Results

The method studied in this paper will be applied to CSTR extraction, and based on the extracted results, it will discuss the changes in rural life in Munyaka, Kenya, Africa, the impact of road traffic infrastructure on people’s lives, and it will reflect the changes in the economic development of Kenya. The CSTR can be extracted by remote sensing, and the spatial and temporal distribution and change of the CSTR can be monitored. The Kappa coefficient is 0.9233, and accuracy exceeds 90%, The method in this paper has a good effect in extracting CSTR. The temporal and spatial variation characteristics of CSTR have also been well analyzed and statisticized. It is found that from 2018 to 2020, the growth rate of CSTR reached 7.29%, since the completion of road infrastructure construction. This is more than double the growth rate of 3.47% in 2016–2018. This study also has some shortcomings: (1) the resolution of Sentinel-2 data is only 10 m, and small-area CSTR cannot be extracted better; (2) the scope of this study is relatively small—it is mainly limited by the scope of the Munyaka slums and road project.
Through this study, this method can better obtain the temporal and spatial changes of CSTR, combined with the changes of Munyaka’s living standard and Kenya’s economic development. We can still analyze the impact of road infrastructure monitoring on Kenya’s economy and people’s living conditions. We believe that this change has much to do with road construction. It is shown that the construction of transportation infrastructure plays a certain role in promoting the economic development of Kenya. We selected the residential areas that can be covered by the project in combination with relevant materials and drew the distribution of main roads, as shown in Figure 11. According to the municipal road project numbers of 2001, 2002, 2006, and 3005, which were built by Chinese enterprises, the east and west pass through the main residential areas in Munyaka area, crossing each other in the north and south directions, forming a significant transportation network, basically covering the main residential areas and greatly improving the local transportation capacity. With convenient transportation and a superior geographical location, it greatly facilitates information exchange, resource transportation, and interpersonal communication.

5.2. Monitoring of Changes in Economic Development

Although the time–space change characteristics of CSTR are monitored by remote sensing, it reflects the changes brought to people’s lives by the municipal road infrastructure [32,33,34]. The impact on economic development needs to be further analyzed in combination with corresponding policies. Optimizing and adjusting the spatial distribution of transportation infrastructure and actively guiding the rational layout of economic space are important ways to promote the healthy and sustainable development of Kenya’s economy [35]. The Sinohydro group (Sinohydro) actively responded to China’s “One Belt, One Road” policy [4,36], vigorously supported the construction of infrastructure in countries along the line, and completed the Eldoret municipal road project in 2017, which had been completed in 2018 [33].
Kenya is the largest economy in East Africa. To build it into a middle-income new industrialized country by 2030 [36], in June 2017, the establishment Executive Committee of the African Manufacturing Initiative was announced, marking a step forward in concrete action towards sustainable industrialization in Africa. The initiative aims to ensure that Africa can take full advantage of relevant opportunities, while also ensuring that sustainable and inclusive growth models are followed in the process of future industrialization. In July 2017, the construction of the special economic zone jointly built by China and Kenya started, with an estimated investment of about US $2 billion. The Pearl River special economic zone jointly built by Chinese and Kenyan enterprises is the first special economic zone in Kenya. It will focus on the development of industrial clusters such as agricultural product processing, high and new technology, furniture, light textile (textile and clothing), and machinery and construction, with six industries as the leading industries and raw material processing as the main body, and comprehensively build itself into a special economic zone with the simultaneous development of engineering, marketing, and trade industries. Upon completion, the project will provide 40,000 jobs directly and 150,000 jobs indirectly. The construction of municipal infrastructure has brought significant changes to the transportation, communication, living, medical, and other industries in Eldoret, Kenya. It has promoted people’s income growth, made people start to pursue higher and better living conditions, improved living standards, and helped economic development.

5.3. Application Analysis of Research Results

This method can also be used in the research of other methods, such as studying the change of cultivated land and analyzing the agricultural development in a certain area. It can also be used to analyze the increase and decrease in buildings in the economic and trade zone. Through the analysis of changes in time and space, we can better obtain the information about the changes of ground objects. According to these changes, we can obtain the knowledge related to humanities in combination with relevant economic policies. Therefore, this research method has the characteristics of less investigation workload, less influence of human factors, and more objective changes than manual investigation. By combining other information changes, the analysis results are more objective and reasonable.
This method can make people more objective in understanding the changes of surface features in the study area and help to analyze the local economic development status. In addition, for war, this method can obtain information such as the damage of houses and roads in the war zone, and analyze the development of war.

6. Conclusions

This paper uses the DTM method to extract CSTR information from remote sensing images and studies the temporal and spatial changes of CSTR in the Munyaka residential area of Kenya. The results show that the CSTR information extracted by DTM has higher precision and a better Kappa coefficient. The temporal and spatial variation law of CSTR from 2016 to 2020 is obtained, which provides an objective monitoring method for analyzing the impact of road infrastructure construction on surrounding rural areas. The main results are as follows:
(1)
In this paper, we built a multifeature decision tree extraction model, combined multiple exponential features and second-order matrix texture features, and used DTM to set the corresponding threshold, which can better avoid the impact of other ground objects when extracting CSTR. The accuracy of the research results were evaluated using the confusion matrix. After calculation, the Kappa coefficient of the model is 0.9223, and the user accuracy and mapping accuracy both exceed 90%.
(2)
The CSTR information in 2016, 2018, and 2020 was extracted using the method in this paper, and the temporal and spatial change rule of CSTR in 2016–2020 was studied. The change characteristics were analyzed using the two indicators of annual growth AI and annual growth ARG.
(3)
According to the Eldoret municipal road construction, two years before the completion of the road infrastructure construction, the area growth rate of CSTR was 3.47%. Two years after the construction of road infrastructure, the growth rate of CSTR area reached 7.29%, about 2.1 times that before the completion of the road. The construction of municipal road infrastructure has a positive impact on the change of the living environment of African residents.

Author Contributions

Conceptualization, W.Z. and G.L.; methodology, G.L. and L.D.; software, M.D.; validation, M.D., W.Z. and G.L.; formal analysis, G.L. and M.D.; investigation, W.Z.; resources, M.D. and S.Y.; data curation, M.D.; writing—original draft preparation, M.D. and G.L.; writing—review and editing, W.Z., G.L. and M.D.; visualization, G.L. and M.D.; supervision, W.Z. and L.D.; project administration, W.Z.; funding acquisition, W.Z. All authors have read and agreed to the published version of the manuscript.

Funding

This research was funded by the National Natural Science Foundation of China, grant number U1810203, and supported by the Fundamental Research Funds for the Universities of Henan Province, China, grant number NSFRF220432.

Institutional Review Board Statement

Not applicable.

Informed Consent Statement

Not applicable.

Data Availability Statement

The data used to support the findings of this study are included within the article.

Conflicts of Interest

The authors declare no conflict of interest.

References

  1. Xian, Z.; Ba, Y.; Cheng, J. Study on the relationship between the indicators and policies of the UN 2030 sustainable development goals. Stat. Res. 2021, 38, 4–14. [Google Scholar]
  2. Stothers, L.; Macnab, A.; Bajunirwe, F.; Mutabazi, S.; Berkowitz, J. Associations between the severity of obstructive lowe rurinary tract symptoms and care-seeking behavior in rural Africa: A cross-sectional survey from Uganda. PLoS ONE 2017, 12, e0173631. [Google Scholar] [CrossRef] [PubMed] [Green Version]
  3. Yan, L. History and current situation of poverty in Africa. J. Xinzhou Norm. Univ. 2012, 28, 93–98. [Google Scholar]
  4. Ya, Z.; Pei, K. Factors Influencing Agricultural Products Trade between China and Africa. Sustainability 2022, 14, 5589. [Google Scholar] [CrossRef]
  5. Liu, X. Research on the impact of transportation infrastructure on regional economy. Economist 2021, 138–139. [Google Scholar]
  6. Charalampidis, I.; Karkatsoulis, P.; Capros, P. A Regional Economy-Energy-Transport Model of the EU for Assessing Decarbonization in Transport. Energies 2019, 12, 3128. [Google Scholar] [CrossRef] [Green Version]
  7. Prus, P.; Sikora, M. The Impact of Transport Infrastructure on the Sustainable Development of the Region—Case Study. Agriculture 2021, 11, 279. [Google Scholar] [CrossRef]
  8. Yu, Y.; Wang, S.; Wang, B. Hierarchical extraction of buildings from high resolution remote sensing images. J. Remote Sens. 2019, 23, 125–136. [Google Scholar]
  9. Wang, X.; Yan, H.; Zhou, L. Using SVM classify Landsat image to analyze the spatial and temporal characteristics of main urban expansion analysis in Democratic People’s Republic of Korea. Remote Sens. Land Resour. 2020, 32, 163–171. [Google Scholar]
  10. Lin, Y.; Zhang, B.; Wang, D.; Chen, X.; Xu, J. Hierarchical extraction of high-resolution remote sensing image buildings based on multi feature fusion. Chin. J. Image Graph. 2017, 22, 1798–1808. [Google Scholar]
  11. Shackelford, A.K. Combined Fuzzy Pixel-Based and Object-Based Approach for Classification of High-Resolution Multispectral Data Over Urban Areas. IEEE Trans. Geosci. Remote Sens. 2003, 41, 2354–2363. [Google Scholar] [CrossRef] [Green Version]
  12. Wang, X.; Li, P.; Jiang, S. Building extraction using airborne LiDAR data and very high resolution imagery over a complex urban area. Remote Sens. Land Resour. 2016, 28, 106–111. [Google Scholar]
  13. Zhang, H.; Zhao, Y.; Chen, G. Remote Sensing Image Building Recognition and Classification Based on the Support Vector Machine. Geol. Sci. Technol. Inf. 2016, 8, 4634–4646. [Google Scholar]
  14. Li, P.; Yang, S.; Yao, H. Extraction of urban color steel shed based on high resolution remote sensing image. Geospat. Inf. 2017, 15, 13–15. [Google Scholar]
  15. Ma, J.; Yang, S.; Jia, X. Temporal and spatial change of color steel sheds in Anning district of Lanzhou city. Sci. Surv. Mapp. 2018, 43, 34–37. [Google Scholar]
  16. Drusch, M.; Bello, U.D.; Carlier, S. Sentinel-2 optical high resolution mission for GMES land operational services. Remote Sens. Environ. 2012, 120, 25–36. [Google Scholar] [CrossRef]
  17. Zhang, W.; Liu, H.; Wu, W. Classification of Land Use in Low Mountain and Hilly Area Based on Random Forest and Sentinel-2 Satellite Data:A Case Study of Lishi Town, Jiangjin, Chongqing. Resour. Environ. Yangtze Basin 2019, 28, 1334–1343. [Google Scholar]
  18. Baillarin, S.; Meygret, A.; Dechoz, C.; Petrucci, B.; Lacherade, S.; Tremas, T.; Isola, C.; Martimort, P.; Spoto, F. Sentinel-2 level 1 products and image processing performances. In Proceedings of the IEEE International Geoscience and Remote Sensing Symposium, Munich, Germany, 22–27 July 2012; pp. 7003–7006. [Google Scholar] [CrossRef] [Green Version]
  19. Su, W.; Zhang, M.; Jiang, K. Atmospheric Correction Method for Sentinel-2 Satellite Imagery. Acta Optica Sinica 2018, 38, 322–331. [Google Scholar]
  20. Zheng, C.; Wang, X.; Huang, J. Mapping paddy rice planting area in Zhejiang Province using multi-temporal MODIS images. J. Zhejiang Univ. Agric. Life Sci. 2009, 35, 98–104. [Google Scholar]
  21. Friedl, M.; Brodley, C. Decision Tree classification of land cover from remotely sensed data. Remote Sens. Environ. 1997, 61, 399–409. [Google Scholar] [CrossRef]
  22. Conrad, C.; Colditz, R.; Dech, S. Temporal segmentation of MODIS time series for improving crop classification in Central Asian irrigation systems. Int. J. Remote Sens. 2011, 32, 8763–8778. [Google Scholar] [CrossRef]
  23. Rouse, J. Monitoring Vegetation Systems in the Great Plains with Erts. In Proceedings of the Third ERTS Symposium, Washington, DC, USA, 10–14 December 1973. [Google Scholar]
  24. Zhen, J.; Chen, Y. Vegetation Indices and the Applications in Monitoring Tillage Reverting to Woodland or Grassland Ecosystems. Remote Sens. Technol. Appl. 2006, 21, 41–48. [Google Scholar]
  25. Chen, X.; Zhao, J.; Chen, L. Land Cover Classification and Change Analysis of Hongta District in Yuxi City Based on Landsat Image. Forest Eng. 2019, 35, 5–12. [Google Scholar]
  26. Cha, Y.; Ni, S.; Yang, S. An Effective Approach to Automatically Extract Urban Land-use from TM Imagery. J. Remote Sens. 2003, 7, 37–40. [Google Scholar]
  27. Yu, J. Research on Information Extraction of Agricultural Greenhouse Based on Sentinel Cart Decision Tree; Liaoning Normal University: Dalian, China, 2020; pp. 50–70. [Google Scholar]
  28. Lu, Z.; Xu, F.; Luo, M. Characteristic analysis of lodging rice and study of the multi-spectral remote sensing extraction method. Chin. J. Eco-Agric. 2021, 29, 751–761. [Google Scholar]
  29. Li, Z.; Chen, Z.; Wang, L. Area extraction of maize lodging based on remote sensing by small unmanned aerial vehicle. Chin. J. Eco-Agric. 2014, 30, 207–213. [Google Scholar]
  30. Guan, X.; Fang, C.; Zhou, M. Spatial and Temporal Characteristics of Spatial Expansion of Urban Land in Wuhan Urban Agglomeration. J. Nat. Resour. 2012, 27, 1447–1459. [Google Scholar]
  31. Yu, S.; Sun, Z.; Guo, H. Monitoring and analyzing the spatial dynamics and patterns of megacities along the Maritime Silk Road. J. Remote Sens. 2017, 21, 169–181. [Google Scholar]
  32. Guo, Z.; Chen, S.; Yao, S.; Xiong, C. Analysis on traffic dominance and its spatial differentiation pattern in Kenya. Geogr. Sci. 2020, 40, 956–964. [Google Scholar] [CrossRef]
  33. Wang, P. Analysis on construction management experience of Kenya municipal road engineering. Fujian Archit. 2021, 2021, 159–162. [Google Scholar]
  34. Rose, C.; Joel, O.; Andy, S.; Phil, J. Imagining urban transformation in Kenya. Environ. Sci. Policy 2022, 135, 86–95. [Google Scholar] [CrossRef]
  35. Wei, S. The agricultural trade between China and “One belt, one road” countries: Network structure, association characteristics and strategy choice. Agric. Econ. Probl. 2018, 11, 101–113. [Google Scholar]
  36. Kenya Ministry of Health. Task Sharing Policy Guidelines 2017–2030: Expanding Access to Quality Health Services through Task Sharing; Kenya Ministry of Health: Nairobi, Kenya, 2017.
Figure 1. The study area geographical location and sample point distribution.
Sustainability 14 14886 g001
Figure 2. Flow chart of DTM for identification of CSTR.
Sustainability 14 14886 g002
Figure 3. Spectral curve of features in Sentinel-2 image.
Sustainability 14 14886 g003
Figure 4. NDVI features of the four types of ground objects.
Sustainability 14 14886 g004
Figure 5. NDBI of features of the four types ground objects.
Sustainability 14 14886 g005
Figure 6. NDSI of features between the wasteland and CSTR.
Sustainability 14 14886 g006
Figure 7. Texture features between wasteland and CSTR.
Sustainability 14 14886 g007
Figure 8. Classification results of the study area.
Sustainability 14 14886 g008
Figure 9. Extraction results of CSTR at different years.
Sustainability 14 14886 g009
Figure 10. CSTR stage growth chart.
Sustainability 14 14886 g010
Figure 11. Distribution of main roads.
Sustainability 14 14886 g011
Table 1. The bands’ information of Sentinel-2 image.
BandsBands InformationCentral Wavelength(/μm)Resolution(/m)
Band 1Coastal Aerosol0.44360
Band 2Blue0.49010
Band 3Green0.56010
Band 4Red0.66510
Band 5Vegetation Red Edge0.70520
Band 6Vegetation Red Edge0.74020
Band 7Vegetation Red Edge0.78320
Band 8Near-Infrared (NIR)0.84210
Band 8AVegetation Red Edge0.86520
Band 9Water Vapor0.94560
Band10Short-Wave Infrared (SWIR)–Cirrus1.37560
Band 11SWIR11.61020
Band 12SWIR22.19020
Table 2. Statistics CV and RD of texture features.
IndexCSTRBare landRD
%
Mean ValueVarianceCV
%
Mean ValueVarianceCV
%
B Homogeneity0.79970.02613.26980.15840.01006.3116404.75
B Second Moment0.47940.059612.43880.11590.00010.1251313.52
G Homogeneity0.77450.02333.01370.22270.026111.7326247.71
G Second Moment0.43930.045710.39680.13520.00250.8633225.05
R Second Moment0.36100.03329.19040.11820.00020.2017205.51
SWIR 2 Correlation0.33720.111232.98070.11620.096182.7189190.10
NI Second Moment0.31840.03099.70560.12490.00070.5715154.95
SWIR 2 Second Moment0.34610.042812.36560.13800.00292.1173150.72
SWIR 1 Homogeneity0.31910.088427.70570.13330.089867.3718139.44
Table 3. Feature threshold setting.
Interference FeaturesCharacteristic Threshold
FarmlandNDVI > 0.42 AND NDBI < 0.1
WastelandV > 0.11 AND SWIR1 > 3000
Bare landR Second moment < 0.16 AND G Second moment < 0.22
AND B Second moment < 0.18 AND Blue > 672
Table 4. Annual growth and annual growth rate of CSTR in 2016–2020.
PeriodInitial Area (/km2)Final Area (/km2)Changed
(/km2)
AI
(/km2)
AGR
(%)
2016–20180.56100.60060.03960.01983.4692
2018–20200.60060.69140.09140.04547.2931
Publisher’s Note: MDPI stays neutral with regard to jurisdictional claims in published maps and institutional affiliations.

