Article

Diffusion of Cement Kiln Co-Processing of Contaminated Soil in Selected Provinces of China: Engineering Practices, Modeling, and Driving Factors

1
College of Water Sciences, Beijing Normal University, Beijing 100875, China
2
State Key Laboratory of Environmental Criteria and Risk Assessment, Chinese Research Academy of Environmental Sciences, Beijing 100012, China
3
Technical Centre for Soil, Agriculture and Rural Ecology and Environment, Ministry of Ecology and Environment, Beijing 100012, China
4
Beijing Building Materirals Academy of Sciences Research, Beijing 100041, China
5
Chongqing Taifu Environmental Protection Technology Group Co., Ltd., Chongqing 401147, China
*
Author to whom correspondence should be addressed.
Sustainability 2022, 14(22), 14887; https://doi.org/10.3390/su142214887
Submission received: 1 October 2022 / Revised: 6 November 2022 / Accepted: 9 November 2022 / Published: 10 November 2022
(This article belongs to the Section Pollution Prevention, Mitigation and Sustainability)

Abstract

:
Promoting the diffusion of remediation technologies is an attractive solution to environmental protection and urban sustainability challenges. To better understand technology diffusion, we reviewed the engineering practices of cement kiln co-processing (CKC) of contaminated soil and obtained diffusion parameters using the Bass model in three provinces of China. Our results show that CKC has been adopted for the disposal of multiple contaminants and that the optimal feed rate of contaminated soil is 4–5%. The obtained diffusion parameters can be used to analyze and predict CKC diffusion. Driving factors analysis suggest that CKC diffusion is regulation-driven and obeys the S-curve pattern. Policies at the national level shape the basic pattern of the diffusion curve, while local policies, market scales, and contaminant types produce variations in diffusion rates across provinces. Results also reveal that the co-processing quota management on contaminated soil has little impact on CKC adoption. This study provides insights into contaminated soil remediation technology diffusion and the effectiveness of environmental policy implementation at home and abroad.

1. Introduction

More than one million potentially contaminated sites are estimated to be present in China, tens of thousands of which require soil remediation [1]. In 2016, China promulgated the Action Plan for the Prevention and Control of Contaminated Soil, striving to achieve a safe >95% utilization rate of contaminated land by 2030. Achieving this goal requires the broad participation of multiple stakeholders and a joint implementation of various pathways. In all efforts, contaminated soil remediation technology is crucial. The diffusion of remediation technologies offers a solution to the challenges of environmental protection and urban sustainability.
Technology diffusion is the process whereby new technology penetrates the market and eventually spreads through certain channels to members of a social system [2]. An ongoing phenomenon in diffusion research is that the cumulative adoption curve of technology gradually follows an S-shape. The curve generally consists of three distinct phases, a: (i) long, slow growth; (ii) fast takeoff; and (iii) flattening of the curve. Multiple studies focusing on the factors that determine the adoption rates of a range of technologies, such as agriculture, renewable energy, and pollution control technologies, have been conducted [3,4,5]. Literature has shown that the rates and drivers of diffusion vary widely across regions and technologies. Hence, a scientific analysis of the remediation technology diffusion process is of great importance for a better understanding of the driving factors and promoting technology diffusion.
Several models describe the process of diffusion [6,7,8,9]. The most widely employed technology diffusion model is the Bass model. The original Bass model assumes that the diffusion rate in the initial growth phase depends on many external factors, such as advertisements, government initiatives, and product awareness [10,11,12]. Customers who adopt the innovation at this stage are called initial adopters, and the factors that influence this stage are called innovation externals or enablers. This stage is followed by a latter group of adopters who tend to imitate early adopters and want to benefit from the technology. Factors that influence subsequent growth stages are called mimetic internal factors or pull factors [13]. For many consumer products, the Bass model successfully explains and predicts the number of products sold. However, with the increase in research objects over time, from ordinary consumer products such as refrigerators and TV, to capital knowledge-intensive products such as computers and electric vehicles, and innovative technologies such as wind power and carbon capture and storage, the explanatory power of the Bass model has declined. Several researchers have expanded and improved the model. Due to tacit knowledge, the diffusion rate of in situ bioremediation is lower than that of in situ chemical treatment [14]. Zambrano-Gutiérrez et al. emphasized the role of public policy in electric vehicle diffusion in the US [15]; Van Ewijk and McDowall analyzed the stepwise adoption phenomenon in sulfur control technologies diffusion and confirmed the regulation-driven nature of end-of-pipe abatement technology [16].
The focus on finding solutions to curb city expansion and decreasing the impact on human health and the environment has led to the innovation of contaminated land remediation strategies. Cement kiln co-processing (CKC) is one of the widely adopted technologies in China [17]. In 2005, China first used cement kilns to dispose of 16,000 m3 of pesticide-contaminated soil in Songjiazhuang subway station. This marked the beginning of contaminated land remediation [18]. The cumulative frequency of using CKC in China has exceeded 200 times in 2021, ranking third among China’s contaminated soil remediation technologies. CKC is extremely dependent on cement production facilities. The success of co-processing presumes that market demand and precision management exist at that point of time.
Currently, 19 provinces of China, namely Anhui, Beijing, Chongqing, Fujian, Guangdong, Guangxi, Guizhou, Hebei, Henan, Hubei, Hunan, Jiangsu, Liaoning, Shandong, Shanxi, Sichuan, Tianjin, Yunnan, and Zhejiang have adopted CKC. However, only Beijing, Chongqing, and Jiangsu account for 69.8% of the total cases (Figure S1) and comprise 66.2% of the total co-processed contaminated soil volume [17]. Although a set of policies and guidelines promote contaminated soil remediation at the central government level, individual provinces also make their own policies. The provincial environmental protection supervision department formulates and implements CKC promotion policies, such as government and departmental regulations, guidelines and standards, and exemption clauses. Province-specific issues such as contaminant complexity, remediation cost, contaminated sites count, and cement plant capacity necessitate special permissions for contaminated soil disposal. Consequently, the rate and drivers of diffusion vary for different provinces. Due to a lack of aggregated data, research on diffusion of contaminated soil remediation technologies is still developing. This paper attempts to study the law of diffusion of contaminated soil remediation technologies and explore the impact of provincial differences on technology development. This comparative case study will contribute to better understanding the diffusion of CKC and promoting the sustainable remediation of contaminated soil at both national and local levels.
The remainder of the paper is organized as follows: Section 2 describes the data sources and the Bass diffusion model. Section 3 presents the engineering practices of CKC adoption for contaminated soil remediation, pattern modeling of CKC diffusion, and cement plant disposal capacity analysis and its potential drivers. Finally, Section 4 offers our concluding remarks.

2. Materials and Methods

2.1. CKC Data

The data of remediation cases were derived from open-access resources of the Internet and the National Soil Environmental Management System for Contaminated Land [19]. We used the keywords “soil” and “co-processing” to conduct a systematic search through the Baidu search engine (www.baidu.com, accessed on 10 November 2022). The data were obtained from remediation reports, literature, news reports, and project bidding information, etc.

2.2. Data Cleaning

The main concern of the study is to provide an understanding of CKC adoptions in the history of remediation in China. Therefore, the obtained data cover remediation time and costs, contaminated site and cement plant locations, contaminants, contaminated soil volume, and other factors (Table S1). We verified the accuracy of the data by cross-validating multiple information sources of the same case. For ease of comparison, we unified the measurement units of the data in different cases. The detailed transformation process is provided in the footnotes of Table S1.

2.3. Diffusion Model

The Bass model is the most widely employed environmental technology diffusion model. It presumes that the adaptors are divided into innovators and followers, which derives from the internal and external influences of technology diffusion, respectively [20]. For contaminated soil technology CKC, we assumed that: (1) at a certain moment, the total number of contaminated sites in a region is constant, representing the highest possible adoption number of this technology; and (2) the diffusion rate is correlated with the number of total cases rather than the total number of technology users, as one user may adopt this technology multiple times but the remediation technology decision-making process in each contaminated site is relatively independent; (3) there are adequate cement plants nationwide to carry out co-processing of contaminated soil; (4) remediation technology decision making is not affected by external factors. Based on these assumptions, the diffusion functions can be derived as:
d N t d t = p + q m N t × m N t
where N(t) is the cumulative number of remediation cases that adopted CKC at time t; p is the coefficient of innovation; q is the coefficient of imitation; and m is the estimated number of CKC adopters defined as the “market potential.” With the initial condition of t = t0, N = N0, the equation can be shown as:
N t = m p m     N 0 p   +   q N 0     m exp p   +   q t t 0 q 1 N 0 / m p   +   q N 0     m exp p   +   q t t 0
The inflection time was defined as the time when the cumulative diffusion curve changes from being concave to convex. The point of inflection(t*) owns the maximum diffusion rate; t* and the diffusion rate at t* are given by Equations (3) and (4).
t * = ln   ( q / p ) q + p
d N d t t   =   t * = p + q 2 ( ( p / q ) + ( N 0 / m ) ) p m 1 N 0 / m 2 p + q p N 0 / m 2
Technology takeoff time is defined as the time when the adoption rate increased dramatically following the resolution of technology uncertainty [21,22]. It is the point of distinction between the fermentation and growth stages of the technology life cycle. Considering that the volume of contaminated soil varies greatly between different remediation cases, the takeoff time should meet the: (1) volume of soil disposed, which exceeds the average of the three previous years, and (2) growth rate of the volume of soil disposed, which exceeds 100%.

3. Results and Discussion

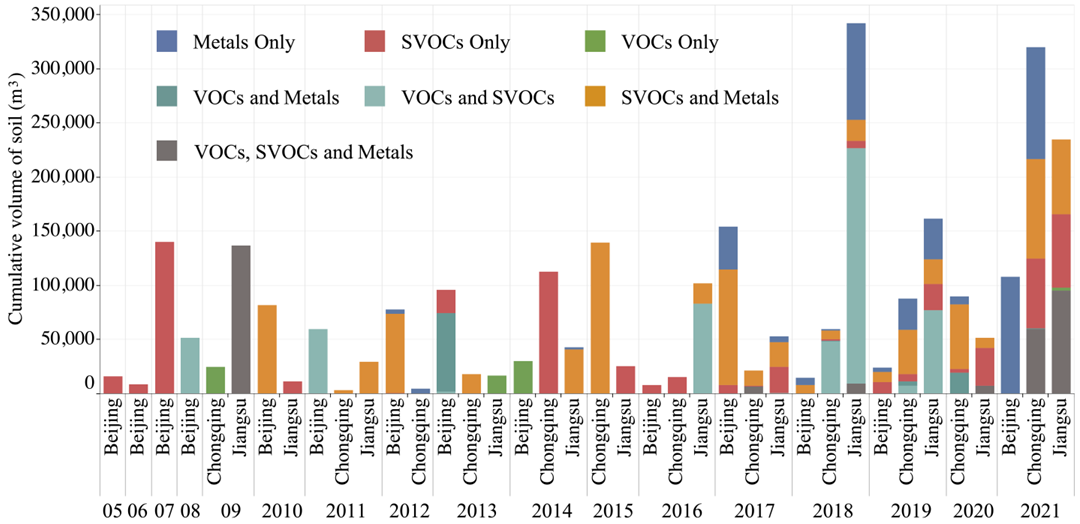
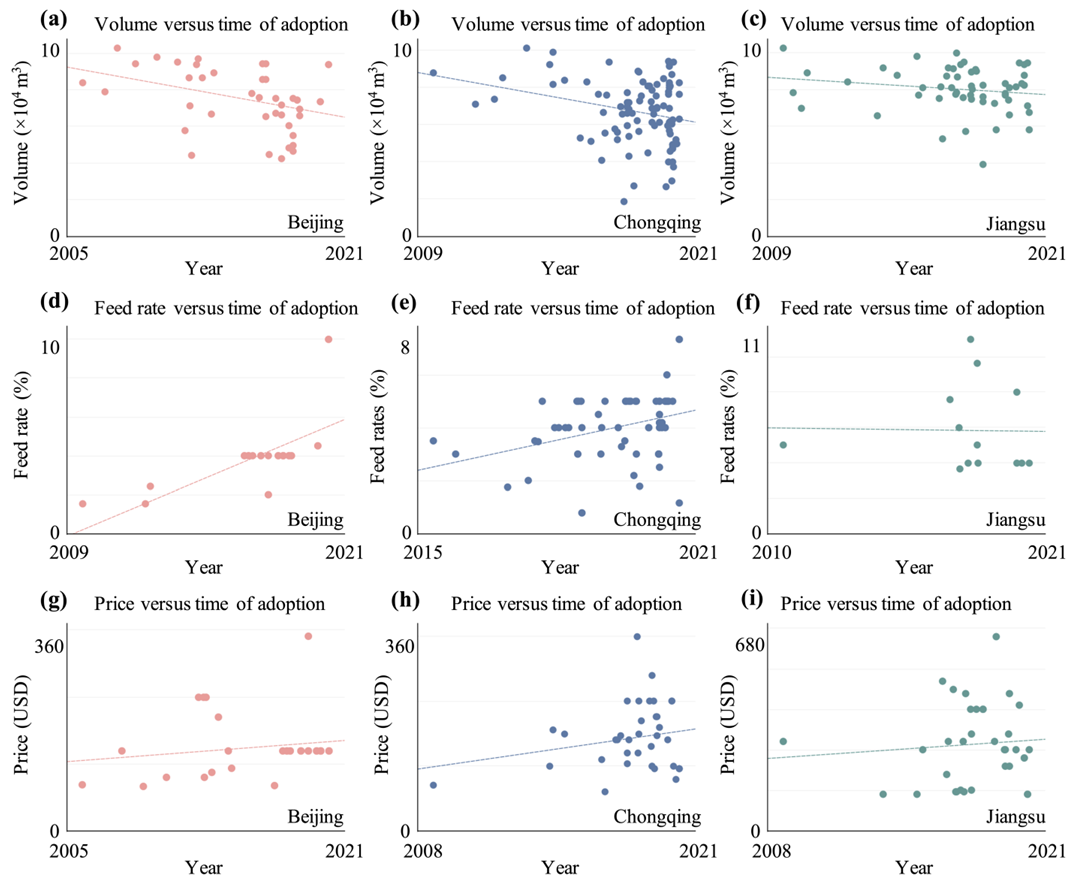
3.1. Changes in Contaminants, Volume, Feed Rate, and Price over Time

Heterogeneity is one of the crucial factors influencing innovation diffusion [23,24]. The literature has studied the impact of heterogeneity of adopters on product diffusion and agriculture technology adoption. In this section, we discuss changes in the characteristics of contaminants, volume, feed rate, and disposal cost of CKC over time and differences between provinces.
In our study, contaminants are categorized into seven groups based on general treatability: metals, semivolatile organic compounds (SVOC), and volatile compounds (VOC), and the combination of these three basic categories. Figure 1 shows the three provinces’ volume and category of contaminated soil disposed by CKC. The results show that CKC can be adopted to dispose all categories of contaminants and has great advantages over other technologies. In the first few years of diffusion, CKC co-processed only a single type of contaminant. In recent years, multiple categories of contaminants were co-processed simultaneously. The same pattern was observed in all the three provinces. This is because, although cement kilns can safely dispose of a variety of contaminants, there are still variations in different types of contaminated soil pretreatment and feeding processes [17]. In the early stage of CKC adoption, cement plants had difficulty mastering a variety of treatment processes and completing the matching equipment transformation simultaneously. Another possible reason is that in the early years of technology diffusion, the number of cases was small, and the sample size affected the statistical results. In terms of the volume of different types of contaminated soil disposed, Beijing, Chongqing, and Jiangsu disposed the highest proportion of SVOCs and metals (32%), SVOCs and metals (42%), and VOCs and SVOCs (31%) (Table S2). As the most complex types—VOCs, SVOCs, and metals—the disposal volume of Jiangsu is much higher than those of Beijing and Chongqing. This is related to the industrial history of the three provinces. Metal smelting is more developed in Chongqing and Beijing, while organic industries are more developed in Jiangsu [25].
The volume of co-processed soil gradually decreased at each site (Figure 2a–c). A downward trend is evident among the three provinces. In Beijing, the primary sources of contamination are metal smelting and coking, which might cause widespread pollution and a massive amount of contaminated soil. In order to speed up the remediation and redevelopment of contaminated lands, a large, contaminated area is divided into smaller sections. Each small section is transferred to the development stage after remediation is completed. This is an effective measure to shorten the time interval between their remediation and redevelopment. Contaminated land management causes a reduction in the volume of contaminated soil. For Chongqing and Jiangsu, the decrease in the volume of contaminated soil is attributed to a thorough remediation strategy. Multiple remediation technologies have been adopted in a case, and CKC is only used to dispose contaminated soil from compound pollution or has a high concentration of contaminants. In addition to the management strategy and the contamination sources discussed above, the results are also relevant to regional policies; see Section 3.4 for a detailed discussion of the policy implications.
Figure 2d–f presents the proportion of contaminated soil added to raw materials for clinker production (feed rate) in the three provinces. Beijing and Chongqing exhibited an upward trend, while Jiangsu demonstrated a slight downward trend. The changes in Beijing and Chongqing are due to the increasing proficiency in technology over time, which improves the disposal efficiency of contaminated soil without affecting system operation and cement quality. The decline in Jiangsu is mainly caused by the relatively high but reasonable feed rate in the early stage. This is confirmed by the average feed rate ranking Jiangsu > Chongqing > Beijing (Figure S2). The results indicated that the most economical, safe, and effective feed rate range was 4–5% [26].
Figure 2g–i show the price of CKC in the three provinces over time. The results reveal that prices have risen in all the provinces. Chongqing’s disposal price rose the fastest while Beijing’s growth was the slowest. A particular case of co-processing is that when the contaminant concentrations are too high to reach the standard of hazardous waste, the disposal price of ordinary contaminated soil will increase by eight times its average disposal price. According to the general rules of the identification standards for solid wastes, transporting contaminated soil for CKC disposal requires an extra identification process. It will increase the time and economic cost of CKC and weaken the market competitiveness [17]. Considering the average disposal price in the three provinces, Jiangsu’s is higher than those of Chongqing and Beijing. The price difference in different provinces is the combined effect of many influencing factors, including supply and demand, cement price, environmental protection policy, and the cost of other restoration technologies, which are beyond the scope of this paper [27]. Furthermore, the ban on interprovincial transportation of contaminated soil has further widened the price gap between different provinces.
In Figure 2, most fitted curves have relatively low correlation coefficients due to outliers. These outliers are attributed to the variety of pollutant types and concentrations from site to site. In reference to other studies of environmental technology diffusion [16], we retain these values in the statistical analysis, although they may reduce the reliability of the statistical results.

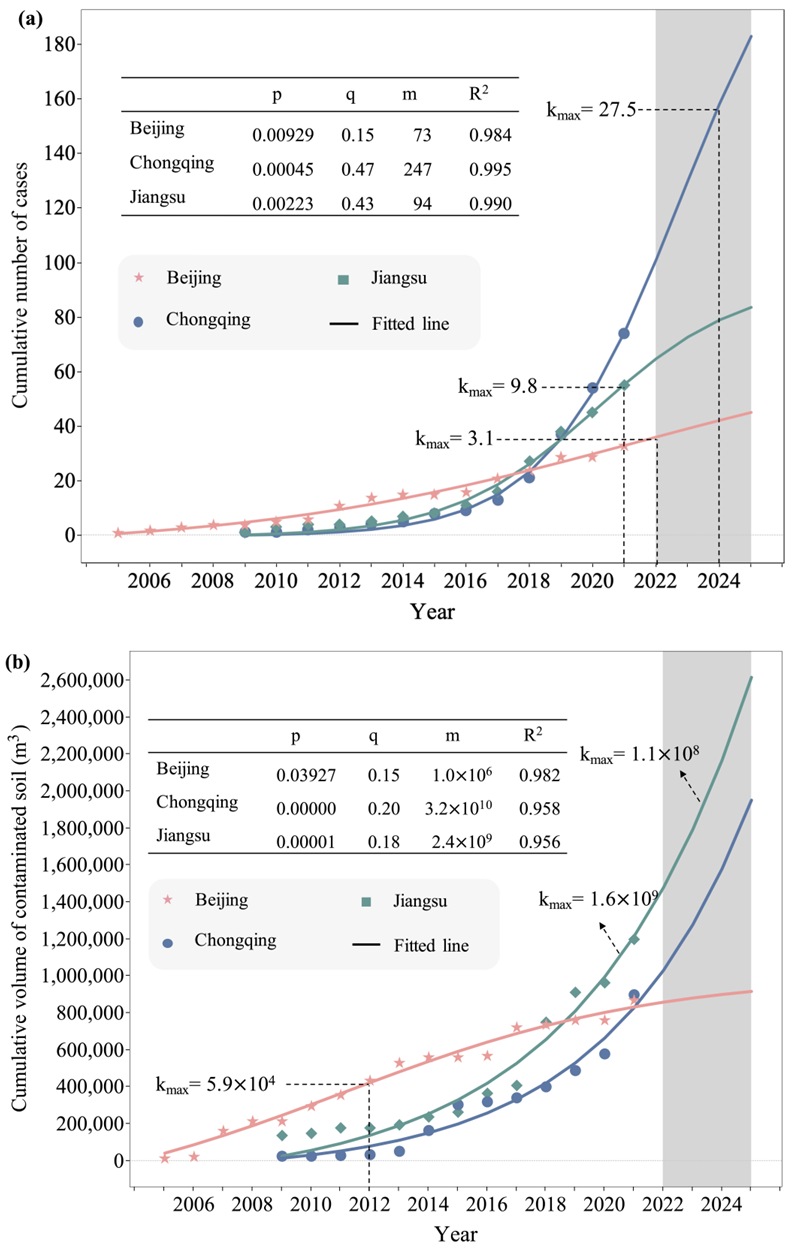
3.2. Diffusion Characteristics of CKC in Different Provinces of China

Generally, accumulation curve growth involves near-exponential growth in the early stages of diffusion, followed by slower growth rates as the market approaches saturation [28]. We regressed the Bass model curve and calculated the parameters. The constants p and q are coefficients of innovation and coefficients of imitation, respectively. The m denotes the extent of diffusion expressed by the saturation level of the S-shape curve. The tables in Figure 3 summarize the regression results.
An examination of Figure 3 reveals that the p values for Chongqing and Jiangsu are lower compared to that of Beijing, while the q value for Beijing is lower than those of Chongqing and Jiangsu. This indicates a higher introductory stage for Beijing, whereas Chongqing and Jiangsu experienced lower growths during the introduction stage of diffusion. In the early stage of urban industrial contaminated land remediation, not only was the selection of remediation technologies limited, but the management and operation experience of remediation technologies was also lacking. Technology adopters required time to become familiar with technology and reduce technology uncertainty [29]. Although Beijing’s p value was relatively high, the low growth in the number of cases and total volume of contaminated soil before 2009 reflects the cautious attitude of early adopters to the new technology. In contrast, the higher q values of Chongqing and Jiangsu demonstrate that external drivers accelerate the diffusion process in these two provinces. Chongqing and Jiangsu disposed of more contaminated soil in the first year than Beijing (1.56 and 8.56 times, respectively), indicating that later technology adopters are bolder and more aggressive in their behavior and attitudes.
The takeoff and inflection times of technology diffusion are shown in Table 1. The results show that Beijing had shorter takeoff and inflection times than Chongqing and Jiangsu. Literature has reported that the takeoff time is more correlated to the coefficient of innovation [30]. In our study, the coefficient of innovation in Jiangsu is greater than that of Chongqing. Still, the takeoff time is longer than that of Chongqing, which may be due to Jiangsu’s more complex pollution situation, resulting in a long time to employ the technology (Figure 3b). The time of the inflection point of the diffusion curve is positively correlated with the coefficient of imitation, which is consistent with the results of previous studies [31]. Mathematically, two curves with similar t* can have very different growth rates at the inflection point. In our study, the curve inflection points in Chongqing and Jiangsu are similar in time, but the growth rates differ by 14.5 times. This is consistent with the result that the q value of Chongqing is larger than that of Beijing, indicating that the q value of Jiangsu has a more significant correlation with t*, and the driving factors mainly affect the inflection points of each province.
Based on the obtained model parameters, we predicted the technological diffusion of CKC, shown in the gray zone of Figure 3. Numerous studies have demonstrated the policy-driven nature of environmental technologies, and therefore a reasonable forecast must be based on a stable environmental policy over time. Considering the stability of the policy, we set the forecast time to 2022–2025. The results show that Beijing has gradually approached market saturation, both in terms of the number of cases and the volume of contaminated soil disposed, while Chongqing and Jiangsu are still undergoing a rapid technological development stage.

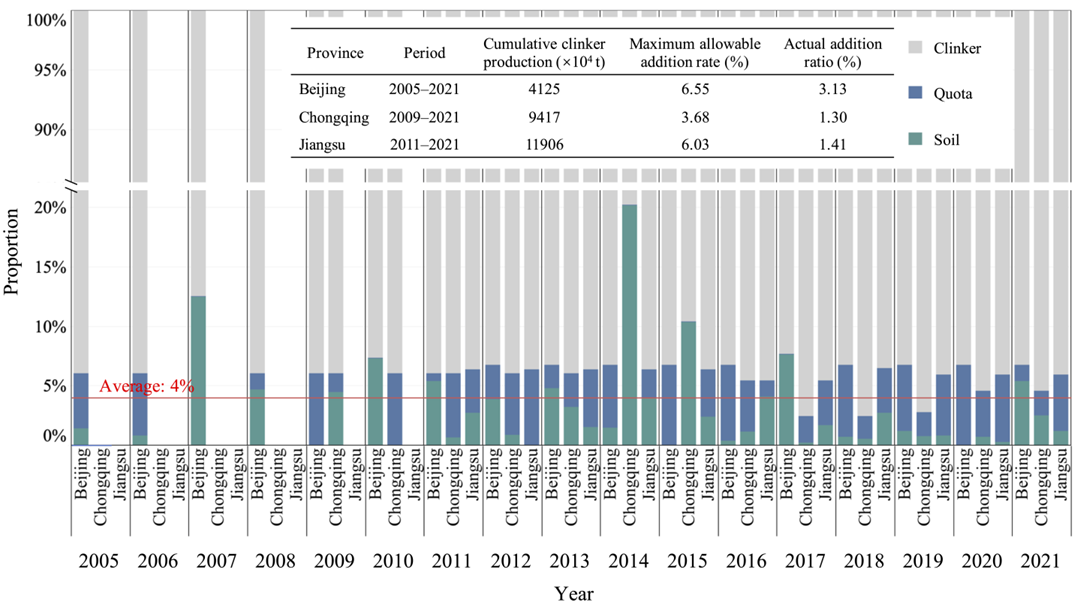
3.3. Capacity of Cement Plants to Co-Process Contaminated Soil

Contaminated soil co-processing at a cement plant requires the construction of a contaminated soil storage warehouse, modification of existing facilities for contaminated soil feeding, and approval from the local government. The maximum disposal amount of contaminated soil permitted by the government and the actual disposal amount of contaminated soil as a percentage of clinker production are presented in Figure 4. The results revealed that the maximum feed rate of contaminated soil allowed by the management department in Beijing, Chongqing, and Jiangsu were 6.55%, 3.68%, and 6.03%, respectively. The values of Beijing and Jiangsu are similar and higher than that of Chongqing because Beijing and Jiangsu treat contaminated soil as general solid waste. When the quota is approved, only the total amount of general solid waste disposal of each year is limited, not the type. In Chongqing, the quota for contaminated soil is listed separately, so the average disposal quota is lower. Considering the actual amount of co-processed soil as a percentage of clinker production, Beijing’s is larger than those of Jiangsu and Chongqing, but all of them are <4%. This is the maximum recommended value for contaminated additions in the Contaminated Site Remediation Technology Catalogue. Beijing has the highest proportion of contaminated soil disposal because its cement production capacity is small and only two cement plants currently remain operational. Jiangsu and Chongqing have similar proportions of contaminated soil disposal, indicating that in the long run, individual limiting contaminated soil disposal quotas have little effect on the total amount of disposed polluted soil.
Except for a few years, the proportion of the three provinces’ disposal of contaminated soil accounted for <50% disposal quotas. The actual disposal amount exceeds the quota because data statistics are calculated according to the amount of contaminated soil that is planned to be co-processed by the cement kiln, rather than the amount of contaminated soil actually co-processed each year. Chongqing, which is the most meticulously managed, had the largest contaminated soil disposal quota usage of 43% (Table S4). This is due to the uncertainty in the timing of the discovery of contaminated soil, resulting in a poor match between the need for remediation of the contaminated soil and the disposal capacity of the cement kiln.

3.4. Drivers for CKC Diffusion

Figure 3 reveals that CKC was first adopted in 2005 and its use increased dramatically in 2016, especially in Chongqing and Jiangsu. Many studies have shown that the diffusion of environmental technologies is policy-driven. Over the past decade, the Chinese government has issued a series of policies and regulations to curb and remediate soil pollution [32]. The first major piece of regulation was the 2004 Notice on Prevention and Control of Environmental Pollution in the Process of Enterprise Relocation, followed by the 2016 Soil Pollution Prevention and Control Action Plan and the 2018 Soil Pollution Prevention Law. Contaminated soil remediation was gradually executed after the regulation was issued in 2004. The 2016 action plan required contaminated land remediation and led to the rapid adoption of CKC in the three provinces. In our previous study, we discussed the inhibitory effect of regulations that required hazardous waste identification on contaminated soil in the diffusion of CKC technology in 2019 [17], Recent data suggest that the long-term impact of this regulation is limited.
National policies can explain the basic trend of CKC diffusion but cannot explain the differences in diffusion rate between provinces. Because Beijing, the capital of China, has small areas and a limited market capacity, we will focus on the impact of local policies on CKC diffusion in Chongqing and Jiangsu. In the early stage of technology diffusion, Chongqing and Jiangsu were mainly affected by national policies and their patterns were similar. In 2018, Chongqing issued detailed rules for the identification of hazardous waste. In 2021, an exemption policy was issued stating that contaminated lands should only be converted to residential areas, schools, and hospitals and the identification of contaminated soil is required (Table S5). These two policies improve the identification process of hazardous waste in contaminated soil, reduce the cost of remediation, shorten the time for remediation of contaminated land, and promote the diffusion of CKC, especially for contaminated lands with small amounts of contaminated soil. During the same period, Jiangsu did not introduce similar policies, explaining why the number of cases in Chongqing grew faster than those in Jiangsu after 2018.
The disposal capacity of cement kilns hinders the diffusion of CKC. As Beijing has only retained two cement plants for the sake of improving air quality, the focus is on the relationship between clinker production capacity and the amount of contaminated soil disposal in Chongqing and Jiangsu. The results show that as the number of qualified cement plants (approved for disposal of solid waste) increases, the disposal amount of contaminated soil also increases (Table S4). However, the proportion of disposal of contaminated soil in clinker production capacity shows a slight downward trend (Figure 5) because the cement kiln not only disposes contaminated soil, but also undertakes the task of other solid waste treatments, such as domestic waste and sludge treatment. The amount of other solid wastes has steadily increased in recent years [33]. Under the condition that the disposal efficiency of cement kilns remains unchanged, the growth of other wastes will inhibit the diffusion of CKC.
Compound contaminants and soil heterogeneity accelerate the diffusion of CKC. Typically, remediation technology can only deal with one or one group of contaminants. Compound pollution requires the combined use of multiple remediation techniques, which increases the cost and time of contaminated land remediation. Concurrently, differences in soil properties within and between sites can also affect the efficiency of the same remediation technique. Cement kilns can dispose multiple pollutants at the same time, and the high temperature in the rotary kiln can decompose organic pollutants into simple inorganic substances. Heavy metals are fixed in the lattice of cement clinker [34], which realizes the harmless disposal and resource reutilization of contaminated soil. Among the contaminated soils co-processed by cement kilns in the three provinces, compound pollution accounts for 61.73% (Table S2). For Jiangsu, compound pollution of organic contaminants and heavy metals accounts for 39.85%, which can explain how despite the lack of policy incentives, the number of cases in Jiangsu is less than that in Chongqing, but the cumulative amount of earthwork disposed in Jiangsu exceeds that in Chongqing. In terms of disposal costs, Jiangsu is also willing to pay higher remediation prices.

4. Conclusions

This study investigated the diffusion process of CKC using data from remediation reports. A mixed influence model (Bass model) was used to obtain the diffusion parameters in selected provinces in China. The key findings are as follows:
(1) CKC was effectively adopted for the disposal of multiple contaminants in soil. In the early stage of technology adoption, the contaminated soil in a site generally had large volumes and single types of contaminants. In the later stage, CKC was primarily used to dispose of composite pollutants with small volumes, indicating the strong disposal capacity of cement kilns.
(2) The disposal capacity of cement plants limits the adoption of CKC. The optimal range of contaminated soil feed rate in a single case is 4–5% and the multiyear average feed rate is 1.3–3.2%.
(3) The results of the Bass model show that CKC diffusion in Beijing is almost at saturation. In contrast, Chongqing and Jiangsu will continue to experience rapid diffusion over the following five years.
(4) An analysis of the driving factors revealed that the critical drivers of CKC diffusion are policies at the national level. The diffusion differences among provinces were caused by other drivers including regional policies, market scales, and pollutant characteristics.
Our research shows that policies are critical to the diffusion of environmental technologies. Other countries can promote the remediation of contaminated soils by enacting national soil protection laws. At the local level, the Bass model can be used to study and predict remediation technology diffusion; exemptions on contaminated soil testing and transportation can be developed to promote the adoption of remediation technologies.
Due to the difficulty in collecting the remediation data of contaminated soil, our study used the data from cement plant remediation reports instead of operation reports, which made it difficult for us to assess the impact of cement kiln disposal capacity on technology diffusion. Future research should consider incorporating other remediation technologies and evaluating the disposal capabilities of each to enhance the understanding of remediation technologies diffusion.

Supplementary Materials

The following supporting information can be downloaded at: https://www.mdpi.com/article/10.3390/su142214887/s1. Figure S1 Distribution of studied cases (Beijing, Jiangsu and Chongqing). Figure S2 Trend of feed rate in the three provinces over time. The feed rate is calculated from the proportion of contaminated soil to cement raw meal. Table S1 Summary of 162 remediation cases in Beijing, Jiangsu, and Chongqing provinces. Feed rate denotes the proportion of contaminated soil added to raw materials for clinker production. PAHs, Polycyclic Aromatic Hydrocarbons, VCHs, Volatile Chlorinated Hydrocarbons, BTEX, benzene (B), toluene (T), ethylbenzene (E), and p -xylene (X), TPH, Total Petroleum Hydrocarbons. Table S2 Proportion count by volume of contaminated soil co-processed by CKC in each category of three provinces. Table S3 The volume and growth rate of co-processed soil in three provinces of China. Volume, ×103 m3. Table S4 The clinker production capacity, the quota for disposal of contaminated soil, and the actual disposed amount of contaminated soil in three provinces. The data only includes cement plants that have or are conducting co-processing of contaminated soil with cement kilns. (×104 tone). Table S5 Key policies affecting the diffusion of cement kiln co-processing of contaminated soil in China.

Author Contributions

Data curation, C.D. and H.Z.; formal analysis, T.W. and J.Y.; investigation, A.D. and F.L.; methodology, T.L., P.D. and T.W.; project administration, F.L.; resources, B.Y. and C.D.; software, F.M.; supervision, A.D.; validation, Q.G.; visualization, T.L. and P.W.; writing—original draft, T.L. All authors have read and agreed to the published version of the manuscript.

Funding

This research was funded by The National Key Research and Development Program of China grant number Nos. 2018YFC1801400 and 2018YFC1801401 And The APC was funded by The National Key Research and Development Program of China.

Institutional Review Board Statement

Not applicable.

Informed Consent Statement

Not applicable.

Data Availability Statement

Details about data sources are provide in Supplementary Materials.

Acknowledgments

This study was supported by The National Key Research and Development Program of China (Nos. 2018YFC1801400 and 2018YFC1801401).

Conflicts of Interest

The authors declare no conflict of interest.

References

  1. CSER. China’s Soil Remediation Technology and Market Development Research Report 2016–2020; China Solid Waste Network: Beijing, China, 2016. [Google Scholar]
  2. Rogers, E.M. Diffusion of Innovations, 5th ed.; Free Press: New York, NY, USA, 2003; ISBN 978-0-7432-2209-9. [Google Scholar]
  3. Kumar, A.; Takeshima, H.; Thapa, G.; Adhikari, N.; Saroj, S.; Karkee, M.; Joshi, P.K. Adoption and Diffusion of Improved Technologies and Production Practices in Agriculture: Insights from a Donor-Led Intervention in Nepal. Land Use Policy 2020, 95, 104621. [Google Scholar] [CrossRef]
  4. Li, Y.; Khalkhali, M.; Mo, W.; Lu, Z. Modeling Spatial Diffusion of Decentralized Water Technologies and Impacts on the Urban Water Systems. J. Clean. Prod. 2021, 315, 128169. [Google Scholar] [CrossRef]
  5. She, Z.-Y.; Cao, R.; Xie, B.-C.; Ma, J.-J.; Lan, S. An Analysis of the Wind Power Development Factors by Generalized Bass Model: A Case Study of China’s Eight Bases. J. Clean. Prod. 2019, 231, 1503–1514. [Google Scholar] [CrossRef]
  6. Benvenutti, L.M.M.; Ribeiro, A.B.; Uriona, M. Long Term Diffusion Dynamics of Alternative Fuel Vehicles in Brazil. J. Clean. Prod. 2017, 164, 1571–1585. [Google Scholar] [CrossRef]
  7. Dev, N.K.; Shankar, R.; Swami, S. Diffusion of Green Products in Industry 4.0: Reverse Logistics Issues during Design of Inventory and Production Planning System. Int. J. Prod. Econ. 2020, 223, 107519. [Google Scholar] [CrossRef]
  8. Gao, X.; Zheng, Z.; Chu, Q.; Tang, S.; Chen, G.; Deng, Q. Popularity Prediction for Single Tweet Based on Heterogeneous Bass Model. IEEE Trans. Knowl. Data Eng. 2021, 33, 2165–2178. [Google Scholar] [CrossRef]
  9. Lim, H.; Jun, D.B.; Hamoudia, M. A Choice-Based Diffusion Model for Multi-Generation and Multi-Country Data. Technol. Forecast. Soc. Chang. 2019, 147, 163–173. [Google Scholar] [CrossRef]
  10. Mohan, P.; Strobl, E.; Watson, P. Innovation, Market Failures and Policy Implications of KIBS Firms: The Case of Trinidad and Tobago’s Oil and Gas Sector. Energy Policy 2021, 153, 112250. [Google Scholar] [CrossRef]
  11. Lee, Y.; Kim, S.-H.; Cha, K.C. Impact of Online Information on the Diffusion of Movies: Focusing on Cultural Differences. J. Bus. Res. 2021, 130, 603–609. [Google Scholar] [CrossRef]
  12. Singhal, S.; Anand, A.; Singh, O. SDE Based Generalized Innovation Diffusion Modeling. Int. J. Math. Eng. Manag. Sci. 2019, 4, 697–707. [Google Scholar] [CrossRef]
  13. Bass, F.M. Comments on “A New Product Growth for Model Consumer Durables the Bass Model”. Manag. Sci. 2004, 50, 1833–1840. [Google Scholar] [CrossRef] [Green Version]
  14. Hou, D.; O’Connor, D.; Al-Tabbaa, A. Modeling the Diffusion of Contaminated Site Remediation Technologies. Water. Air. Soil Pollut. 2014, 225, 2111. [Google Scholar] [CrossRef]
  15. Zambrano-Gutiérrez, J.C.; Nicholson-Crotty, S.; Carley, S.; Siddiki, S. The Role of Public Policy in Technology Diffusion: The Case of Plug-in Electric Vehicles. Environ. Sci. Technol. 2018, 52, 10914–10922. [Google Scholar] [CrossRef]
  16. van Ewijk, S.; McDowall, W. Diffusion of Flue Gas Desulfurization Reveals Barriers and Opportunities for Carbon Capture and Storage. Nat. Commun. 2020, 11, 4298. [Google Scholar] [CrossRef] [PubMed]
  17. Liang, T.; Yang, F.; Ding, A.; Li, F. Cement Kiln Co-Processing Promotes the Redevelopment of Industrially Contaminated Land in China: Spatio-Temporal Features and Efficiency Analysis. Sci. Total Environ. 2022, 817, 152788. [Google Scholar] [CrossRef]
  18. Xinmin Evening Post Pollution Incident at Beijing Songjiazhuang Metro Station. Available online: http://xmwb.xinmin.cn/html/2013-05/19/content_15_2.htm (accessed on 1 October 2021).
  19. MEE National Soil Environmental Management System for Contaminated Land. Available online: http://114.251.10.109/page/shareuserlogin.html (accessed on 27 August 2022).
  20. Rao, K.U.; Kishore, V.V.N. A Review of Technology Diffusion Models with Special Reference to Renewable Energy Technologies. Renew. Sustain. Energy Rev. 2010, 14, 1070–1078. [Google Scholar] [CrossRef]
  21. Peres, R.; Muller, E.; Mahajan, V. Innovation Diffusion and New Product Growth Models: A Critical Review and Research Directions. Int. J. Res. Mark. 2010, 27, 91–106. [Google Scholar] [CrossRef]
  22. Wang, H.S.; Noble, C.H.; Dahl, D.W.; Park, S. Successfully Communicating a Cocreated Innovation. J. Mark. 2019, 83, 38–57. [Google Scholar] [CrossRef]
  23. Li, W.; Tian, L.; Liu, H.; Su, Q. Heterogeneous Adoption of Eco-Innovation Considering Commuting Mobility Patterns. J. Clean. Prod. 2020, 250, 119499. [Google Scholar] [CrossRef]
  24. Zhang, H.; Vorobeychik, Y. Empirically Grounded Agent-Based Models of Innovation Diffusion: A Critical Review. Artif. Intell. Rev. 2019, 52, 707–741. [Google Scholar] [CrossRef]
  25. Hui, Z.H.U.; Shujun, Y.E.; Jichun, W.U.; Haizhen, X.U. Characteristics of Soil Lithology and Pollutants in Typical Contamination Sites in China. Earth Sci. Front. 2021, 28, 26. [Google Scholar] [CrossRef]
  26. Chang, J.-S.; Cho, Y.-C.; Lin, Y.-P. Regeneration of Heavy Metal Contaminated Soils for Cement Production by Cement Kiln Co-Processing. Resour. Conserv. Recycl. 2022, 176, 105909. [Google Scholar] [CrossRef]
  27. Suksanguan, U.; Siwadamrongpong, S.; Champahom, T.; Jomnonkwao, S.; Boonyoo, T.; Ratanavaraha, V. Structural Equation Model of Factors Influencing the Selection of Industrial Waste Disposal Service in Cement Kilns. Sustainability 2022, 14, 4109. [Google Scholar] [CrossRef]
  28. Losacker, S. ‘License to Green’: Regional Patent Licensing Networks and Green Technology Diffusion in China. Technol. Forecast. Soc. Chang. 2022, 175, 121336. [Google Scholar] [CrossRef]
  29. Verpaalen, I.A.M.; Holland, R.W.; Ritter, S.; van Hooff, M.; Ebbers, W.; Hooft, L.; Metting, E.; van der Laan, L.N. Resistance to Contact Tracing Applications: The Implementation Process in a Social Context. Comput. Hum. Behav. 2022, 134, 107299. [Google Scholar] [CrossRef]
  30. Usha Rao, K.; Kishore, V.V.N. Wind Power Technology Diffusion Analysis in Selected States of India. Renew. Energy 2009, 34, 983–988. [Google Scholar] [CrossRef]
  31. Bertotti, M.L.; Modanese, G. On the Evaluation of the Takeoff Time and of the Peak Time for Innovation Diffusion on Assortative Networks. Math. Comput. Model. Dyn. Syst. 2019, 25, 482–498. [Google Scholar] [CrossRef]
  32. Taylor, M.R.; Rubin, E.S.; Hounshell, D.A. Regulation as the Mother of Innovation: The Case of SO2 Control. Law Policy 2005, 27, 348–378. [Google Scholar] [CrossRef]
  33. Kosajan, V.; Wen, Z.; Fei, F.; Doh Dinga, C.; Wang, Z.; Zhan, J. The Feasibility Analysis of Cement Kiln as an MSW Treatment Infrastructure: From a Life Cycle Environmental Impact Perspective. J. Clean. Prod. 2020, 267, 122113. [Google Scholar] [CrossRef]
  34. Yang, Y.; Xue, J.; Huang, Q. Studies on the Solidification Mechanisms of Ni and Cd in Cement Clinker during Cement Kiln Co-Processing of Hazardous Wastes. Constr. Build. Mater. 2014, 57, 138–143. [Google Scholar] [CrossRef]
Figure 1. Annual contaminated soil volume and categories disposed by cement kiln co-processing (CKC) for the provinces of Beijing, Chongqing, and Jiangsu. The categories increase over time, especially in Jiangsu Province. SVOC: semivolatile organic compounds; VOC: volatile organic compounds.
Sustainability 14 14887 g001
Figure 2. Relationships between volume, feed rate, cost, and time of adoption of cement kiln co-processing (CKC). The relationships between the (ac) disposed volume of contaminated soil, (df) proportion of contaminated soil added to the raw material for cement production, and (gi) price per cubic meter of contaminated soil disposal and the adoption time are presented.
Sustainability 14 14887 g002
Figure 3. Cumulative amount and fitted line of the cement kiln co-processing (CKC) adoption. The cumulative (a) number of cases and (b) volume of treated contaminated soil are presented. The provinces of Jiangsu and Chongqing have the same time period for analysis (2009–2021) while the diffusion of Beijing started much earlier (2005).
Sustainability 14 14887 g003
Figure 4. Quota of contaminated soil permitted by the government and the actual disposal amount of contaminated soil as a percentage of clinker production over time in the three provinces. The maximum allowable addition amount and the actual addition ratio are the cumulative quota and cumulative disposal amount divided by the cumulative cement clinker output, respectively. Data are shown in Table S4.
Sustainability 14 14887 g004
Figure 5. Downward trend in the proportion of the actual disposal of contaminated soil to the quota in the three provinces over time. The actual disposal amount of contaminated soil comes from remediation reports.
Sustainability 14 14887 g005
Table 1. Time of takeoff and inflection points and the diffusion rate at the time of inflection points for the three provinces. The data are based on the cumulative volume of contaminated soil co-processed by cement kiln. More detailed information is presented in Table S3.
ProvincePeriodTakeoff Time at*(dN/dt)t= t*
Beijing2005–2021275.9 × 104
Chongqing2009–20214641.6 × 109
Jiangsu2009–20217551.1 × 108
Note: a indicates the interval between the year diffusion began and the time of the takeoff point and t* indicates the year when the inflection point occurred.
Publisher’s Note: MDPI stays neutral with regard to jurisdictional claims in published maps and institutional affiliations.

