Article

Assessment of Yield and Nitrogen Utilization of the Mixed CRU and Urea in Wheat–Maize Production in a 5-Year Field Trial

1
Institute of Plant Nutrition, Resources and Environment, Beijing Academy of Agriculture and Forestry Sciences, Beijing 100097, China
2
Tai’an Academy of Agricultural Science, Tai’an 271000, China
*
Authors to whom correspondence should be addressed.
Sustainability 2022, 14(22), 14943; https://doi.org/10.3390/su142214943
Submission received: 23 October 2022 / Revised: 6 November 2022 / Accepted: 8 November 2022 / Published: 11 November 2022

Abstract

:
To identify the general pattern of impact of the application of the mixed controlled-release urea (CRU) with urea (C-U) on grain yield, plant characteristics, NUE and soil nitrogen contents in wheat–maize production, a 5-year field trial with three release longevity and four ratios of CRU in C-U and common urea alone (U) was carried out in the North China Plain. Results with meta-analysis revealed that C-U had significant effects on grain yield and plant characteristics, NUE and soil NO3-N contents in wheat–maize production positively with the release longevity of CRU and the ratio of CRU-N in C-U. The application of C-U with 60 d or 90 d CRU for wheat and maize had the best overall effects, while C-U treatment with 30 d CRU had a significant inhibitory effect. For maize, C-U with 30% CRU-N had the largest increase rate on yield, 1000-grain weight, plant height, dry weight and NUE by 5.13%, 1.61%, 3.70%, 11.33%, and 8.63%, respectively, while C-U with 40% CRU-N had the largest reduction soil NO3-N. For wheat, the application of C-U with 40% CRU-N had a significant effect on yield, sterile spikelet number, and NUE by 4.45%, −9.76%, and −8.04%, respectively. To conclude, the use of the C-U with appropriate release longevity and the ratio of CRU has great potential to proliferate wheat–maize yields and reduce fertilizer loss especially for maize that not only provides an effective generic methodology for agriculture to improve measures but also ensures profitability.

1. Introduction

The winter wheat–summer maize rotation is one of the most important cropping systems on the North China Plain, providing more than 52.4% of wheat and 32.1% of maize production on 25.1% of the cultivated land in China [1]. Nitrogen (N) is the major essential element for plant growth development. Basal nitrogen fertilizer plus topdressing mainly with normal urea N is a traditional fertilization practice in agricultural production. Nevertheless, soil deterioration, low nitrogen use efficiency (NUE), and environmental risks as a consequence of excessive chemical N fertilizer usage are key factors restricting sustainable agriculture. The loss of nitrogen fertilizer in this area is as high as 20–55%, and the nitrogen use efficiency of maize is only 26.1%, which is far lower than the international level of 50% [2,3,4,5]. At present, agriculture has encountered the dual pressures of a reduction in the availability of agricultural workers and an increase in food requirements [4,5]. Topical application with normal urea N increased additional labor for field operations in comparison with a single basal application of all N fertilizer [6]. Hence, exploring the sustainable fertilizer N management to maximize crop production and NUE, minimize environmental risks, and maintain laborsaving fertilizing practices is urgently required in China.
Controlled-release urea (CRU) was designed to meet crop nutrient requirements, reduce labor demands, and increase crop yields [7]. In China, CRU has become the major trend in fertilizer application because of its excellent slow-release performance [8], which has been practiced for many crops [9,10]. However, the wide use of CRU in agriculture is limited due to its more uneconomical price than that of conventional urea. Therefore, instead of employing urea or CRU exclusively, the use of mixed CRU and urea has been advocated in the agricultural industry to acquire the benefits of reduced labor costs and augmented crop yields [4,9,11], which not only is an economical and effective [12] but also benefits the wheat–maize system [13,14]. However, these results are only qualitative, lacking quantitative evaluation of long-term positioning test data, and insufficient discussion on the effect of CRU on release longevity and proportion. Moreover, these studies rarely explored variations in patterns observed in maize and wheat in study periods.
Therefore, in the North China Plain, over five consecutive years, we conducted a trial in one field to optimize the release longevity and the ratio of CRU-N in the mixed CRU and urea to maintain crop yield, increase NUE, and decrease nitrogen leaching. The results demonstrate new fertilizer techniques allowing more sustainable and highly efficient application of fertilizers. Additionally, the meta-analysis method was employed to determine the increase or decrease in the efficiency of C-U on crop yield, plant characteristics, and nitrogen utilization. Revealing variation may help to identify the factors driving the changes in different release longevity and ratios of CRU and to understand the reasons behind the variability in the results. Firstly, the initial objective of the study was to identify the general pattern of the impact of CRU on winter wheat and summer maize crops and to explore variations related to the release longevity and the ratios of CRU in mixed fertilizer. Secondly, we aimed to identify the mechanisms behind the impact of CRU. The results will provide the basis for cleaner production using highly efficient fertilization that is not only more sustainable but also ecologically beneficial.

2. Materials and Methods

2.1. Experimental Site and Materials

The field trials were conducted in winter wheat–summer maize rotation over five years from October 2008 to October 2013 in Taian, Shandong province, China (36.15° N, 117.27° E). The climate in this region is categorized as continental temperate monsoon with an annual average temperature of 12.8 °C, and a mean annual precipitation of 697 mm mainly concentrating in July and August. The soil type is loam, and the physical and chemical properties in the topsoil are as follows: pH 6.9; total organic C, 12.27 g/kg; alkaline nitrogen 82.44 mg/kg; available phosphate 29.40 mg/kg; available potassium 111.70 mg/kg.
The maize variety was Zhengdan958, and the wheat variety was Jimai22. The conventional fertilizers were applied as urea (46.0% N), calcium superphosphate (12% P2O5), and potassium chloride (60% K2O). The CRU incorporated for this study is the polyurethane-coated Urea (42.4% N), and the coating rate is 8.3%.

2.2. Experimental Design and Managements

A randomized block design was implemented to prepare three replicates of each treatment. The three N application modes were no N (CK), common urea alone (U), and the mixed CRU with common urea (C-U). U treatment and C-U treatment were at the same N application rate. Among the C-U treatment, there were three kinds of release longevity of CRU and four ratios of CRU nitrogen (CRU-N) in the mixed CRU and urea: the former including 30 d, 60 d, and 90 d with 30% CRU, and the latter at the ratio of 10%, 20%, 30%, and 40% for wheat and 20%, 25%, 30%, and 40% for maize, all with 60 d CRU. Each plot was 6 m long and 4 m wide in a randomized block arrangement.
The density of maize was 70,000 plants·ha−1, and wheat seeds were sown at 180 kg·ha−1. Fertilizers N, P, and K were applied at the recommended rate of 270 kg N·ha−1, 180 kg P2O5·ha−1, and 90 kg K2O·ha−1 for wheat, and 291 kg N·ha−1, 243.75 kg P2O5·ha−1, and 90.75 kg K2O ha−1 for maize, respectively. In U treatment, the full rate of P and K with 60% of the N was applied as basal fertilizer, and 40% N as topdressing applied at the bellbottom stage in summer maize or at the returning-green period in winter wheat. In C-U treatment, the mixed CRU and urea were all applied as basal fertilizer once before sowing with all phosphorus and potassium fertilizers. Pest and irrigation management refers to local management practices.

2.3. Sampling and Measurement

2.3.1. Grain Yield and Yield Components

The grain yield was measured by harvesting in each plot at crop maturity with 14% moisture content. The numbers of wheat ears in representative plots of 1 m2 were surveyed, while the numbers of maize ears in representative plots of 10 m2 were surveyed. Grains were threshed and air-dried, and the grain number per ear was measured by counting the grains of 10 plants divided by the number of collected ears. The air-dried grains were used to measure 1000-grain weight.

2.3.2. Plant

Crop plants were sampled for height, stem diameter, and biomass determinations at the crop growth stage: for wheat sampling at the trefoil stage, pre-pre-freezing stage, returning-green period, elongation stage, flowering stage, filling stage, and maturing stage and for maize sampling at the seedling stage, elongation stage, booting stage, tasseling stage, filling stage, and maturing stage. Three plants were sampled randomly in each plot. The height and stem diameter of the plant were measured with a scale. Total above-ground biomass was determined gravimetrically after drying at 65–75 °C for 48 h. The dried samples were milled for analysis of N content. Plant samples were digested using an H2SO4–H2O2 method [15], and total N was measured using a discontinuous auto-analyzer (SMART 200, SEAL Analytical, Norderstedt, Germany). Nitrogen uptake by the plants was calculated based on plant N and the weights of the plant. NUE was calculated by the Formula (1) [16].
NUE = N F N 0 F × 100 %
where NF and N0 denote the seasonal N uptake as measured at the crop growth stage in the fertilized and the control plots (kg N·ha−1), while F gives the seasonal addition rate of N fertilizer (kg N·ha−1).

2.3.3. Soil

A composite soil sample of 3 cores was collected using a soil drill (with the core diameter 3 cm) following harvest at 20 cm intervals from 0 to 100 cm depth sequence in a random zigzag pattern from each plot. Soil NO3-N and NH4+-N (extracted by 0.01 M CaCl2) concentrations were determined using the AA3 Auto-analyzer (Bran-Luebbe, Norderstedt, Germany).

2.4. Data Analysis

Considerable variation in absolute values of crop yield, plant characteristics, NUE, and soil nitrogen content with C-U treatments in five years prompted us to use a meta-analytic approach in this study. For each pair of samples, we calculated a reaction ratio of effect size (ES) as the difference between C-U treatment and U treatment, divided by the standard deviation and weighted by the sample size. A negative ES indicates that the effect under study is smaller in C-U treatment than in U treatment.
ES = ln   X ¯ treatment   X ¯ control
v ES = S 1 2 n 1   X ¯ treatment + S 2 2 n 2   X ¯ control
where   X ¯ treatment and   X ¯ control are mean values of yield or plant characteristics or NUE or soil nitrogen contents in C-U and U treatments, respectively. S1 and S2 represent the standard deviation of C-U and U treatments, respectively; n1 and n2 represent the number of samples in C-U and U treatments, respectively.
The mean ES and the 95% confidence interval (CI95) of the mean ES were computed and compared using R software with the metafor package [17,18]. C-U treatment was considered to have a statistically significant effect if CI95 of the mean ES did not include zero. We investigated variation among the release longevity or the ratio of CRU-N in C-U treatments, which were considered categorical explanatory variables. All analyses were performed using random effects models.

3. Results

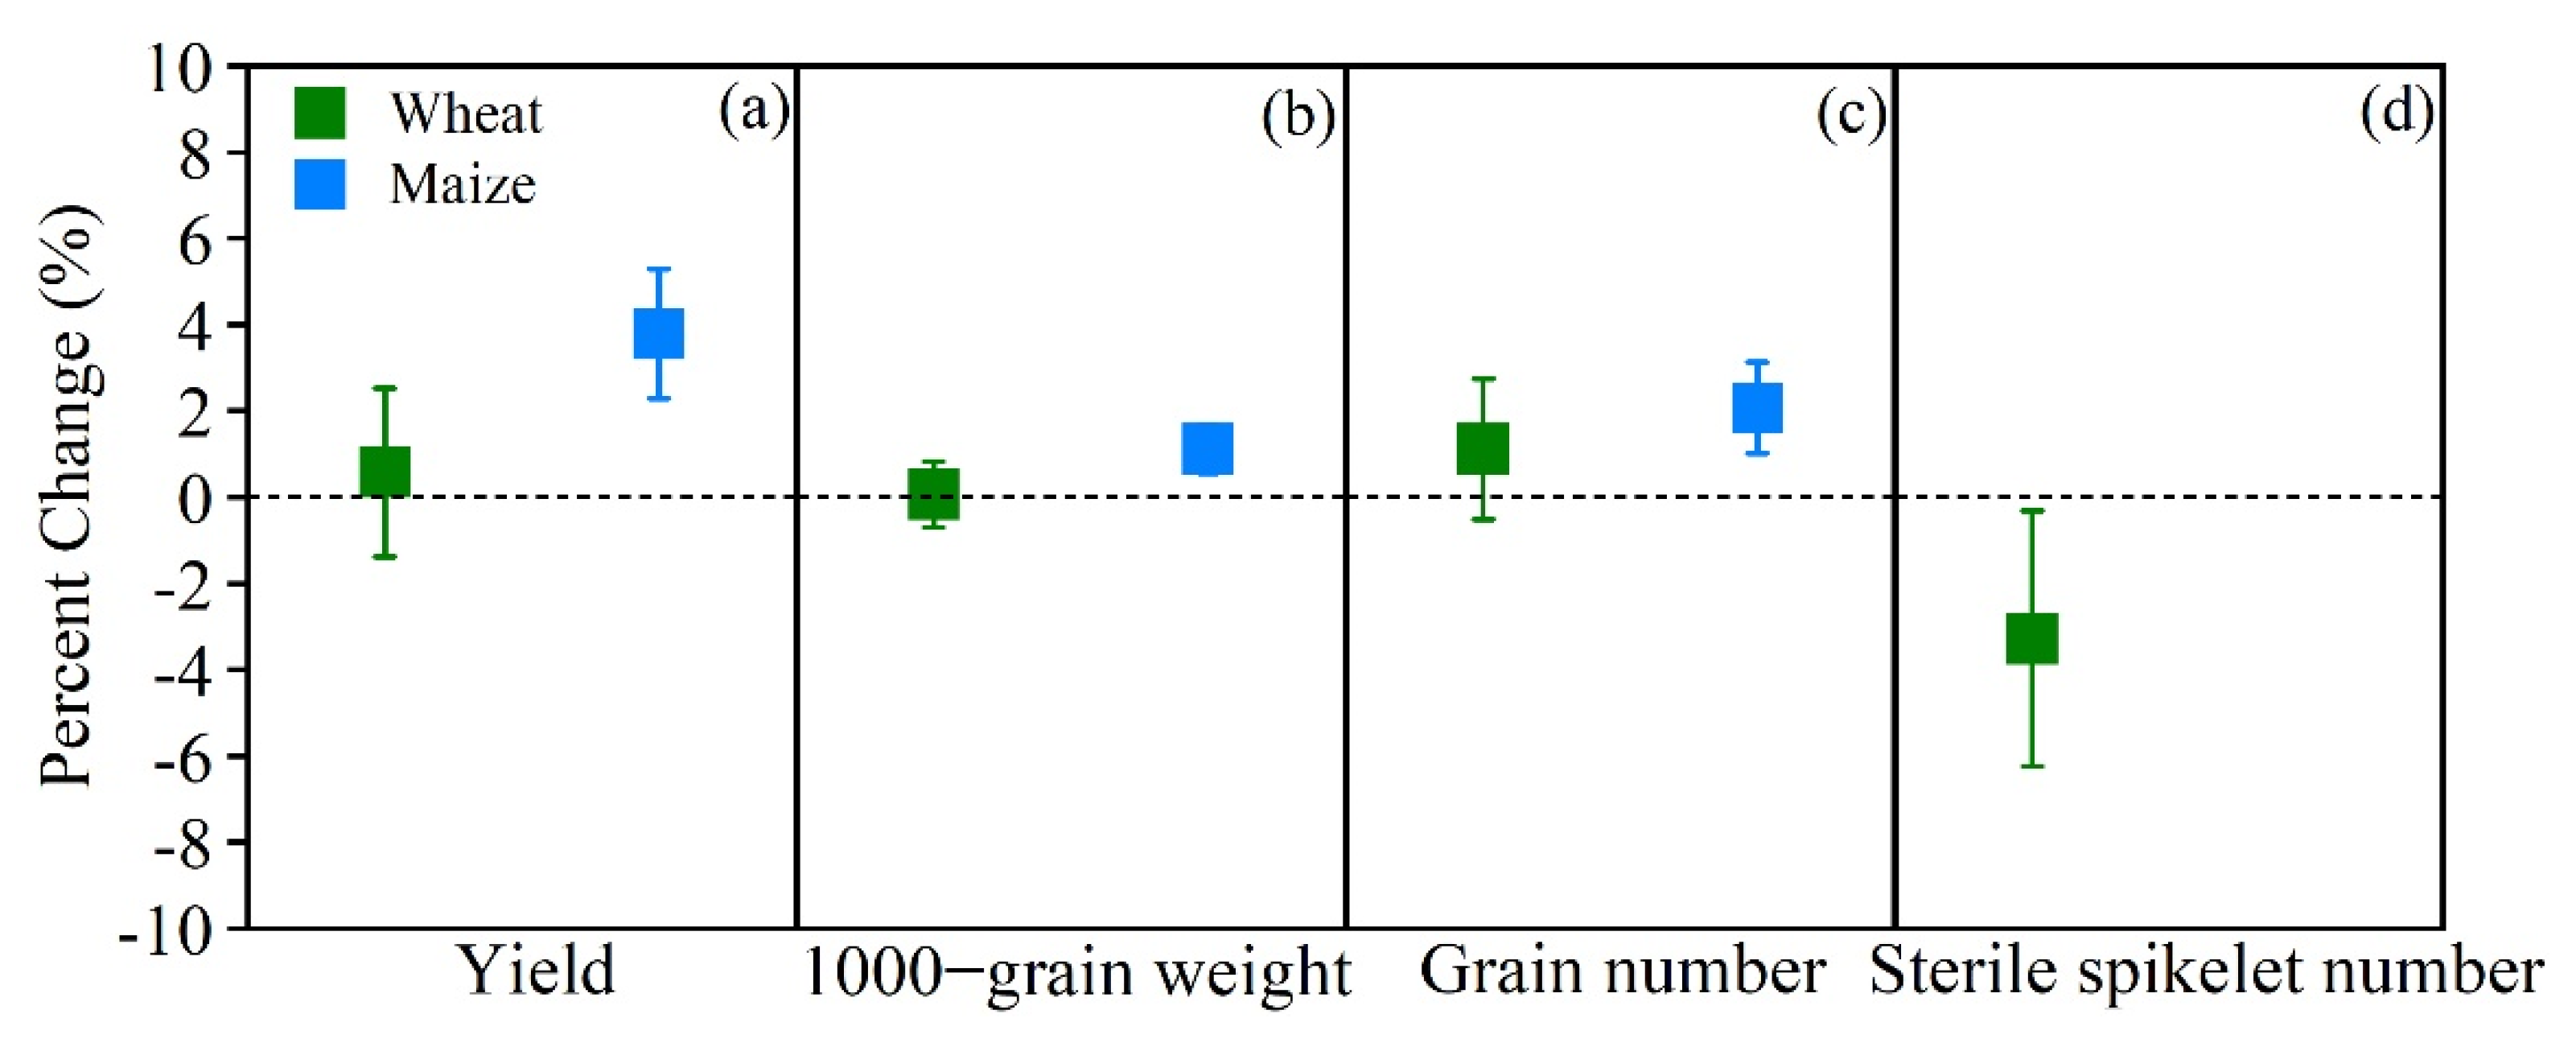
3.1. Effects of C-U on Yield Characteristics

For wheat, the yield, 1000-grain weight, and grain number per ear to all C-U treatments, averaged by the release longevity or the ratio of CRU-N and study years, were with a mean value of 7101.53 kg·ha−1, 43.90 g·plant−1, and 32.67 seeds, compared with U treatment with a mean value of 7059.03 kg·ha−1, 43.98 g·plant−1, and 32.21 seeds, respectively (Figure 1a–c). Meta-analysis revealed that C-U had no significant effect on these yield characteristics (Figure 2a–c). However, the sterile spikelet number drastically reduced with C-U by 3.28% (Figure 2d), which was with a mean value of 2.86 spikelets compared with U treatment with a mean value of 2.97 spikelets (Figure 1d). Effects of C-U on wheat yield characteristics differed among the release longevity of CRU and the ratio of CRU-N:C-U with 30 d CRU significantly diminished the yield, 1000-grain weight, and grain number per ear by 6.29%, 2.16%, and 6.22%, while C-U with 60 d or 90 d CRU increased grain number per ear by 4.23% and 1.86% respectively. Additionally, C-U with 10% CRU-N reduced yield by 7.32%, while C-U with 30% and 40% CRU-N proliferated the yield by 2.12% and 4.45% and depleted the sterile spikelet number by 3.97% and 9.76%, respectively(Table 1).
In the case of maize, the yield to all C-U treatments ranged from 6318.78 kg·ha−1 to 9437.78 kg·ha−1, with a mean value of 8244.11 kg·ha−1, in comparison to U treatment with a mean value of 7951.37 kg·ha−1 (Figure 1e). The 1000-grain weight and the grain number per ear to all C-U treatments ranged from 264.13 to 342.93 g and 390.2 to 548.67 seeds, with a mean value of 311.73 g and 455.98 seeds, in comparison to the U treatment with a mean value of 308.73 g and 445.04 seeds, respectively (Figure 1f,g). Meta-analysis demonstrated that the C-U treatments significantly elevated maize’s yield, the 1000-grain weight, and the grain number per ear by 3.80%, 1.12%, and 2.07%, respectively (Figure 2). Effects of C-U on maize yield characteristics varied among the release longevity and the ratio of CRU-N:C-U with 60 d and 90 d CRU having remarkably elevated yield, 1000-grain weight, and grain number per ear by 4.08% and 6.29%, 1.21% and 2.33%, 2.60%, and 2.79%. Furthermore, C-U with 30% CRU-N augmented the yield and 1000-grain weight by 5.13% and 1.61%, and C-U with 40% CRU-N improved the yield by 3.98% (Table 1).

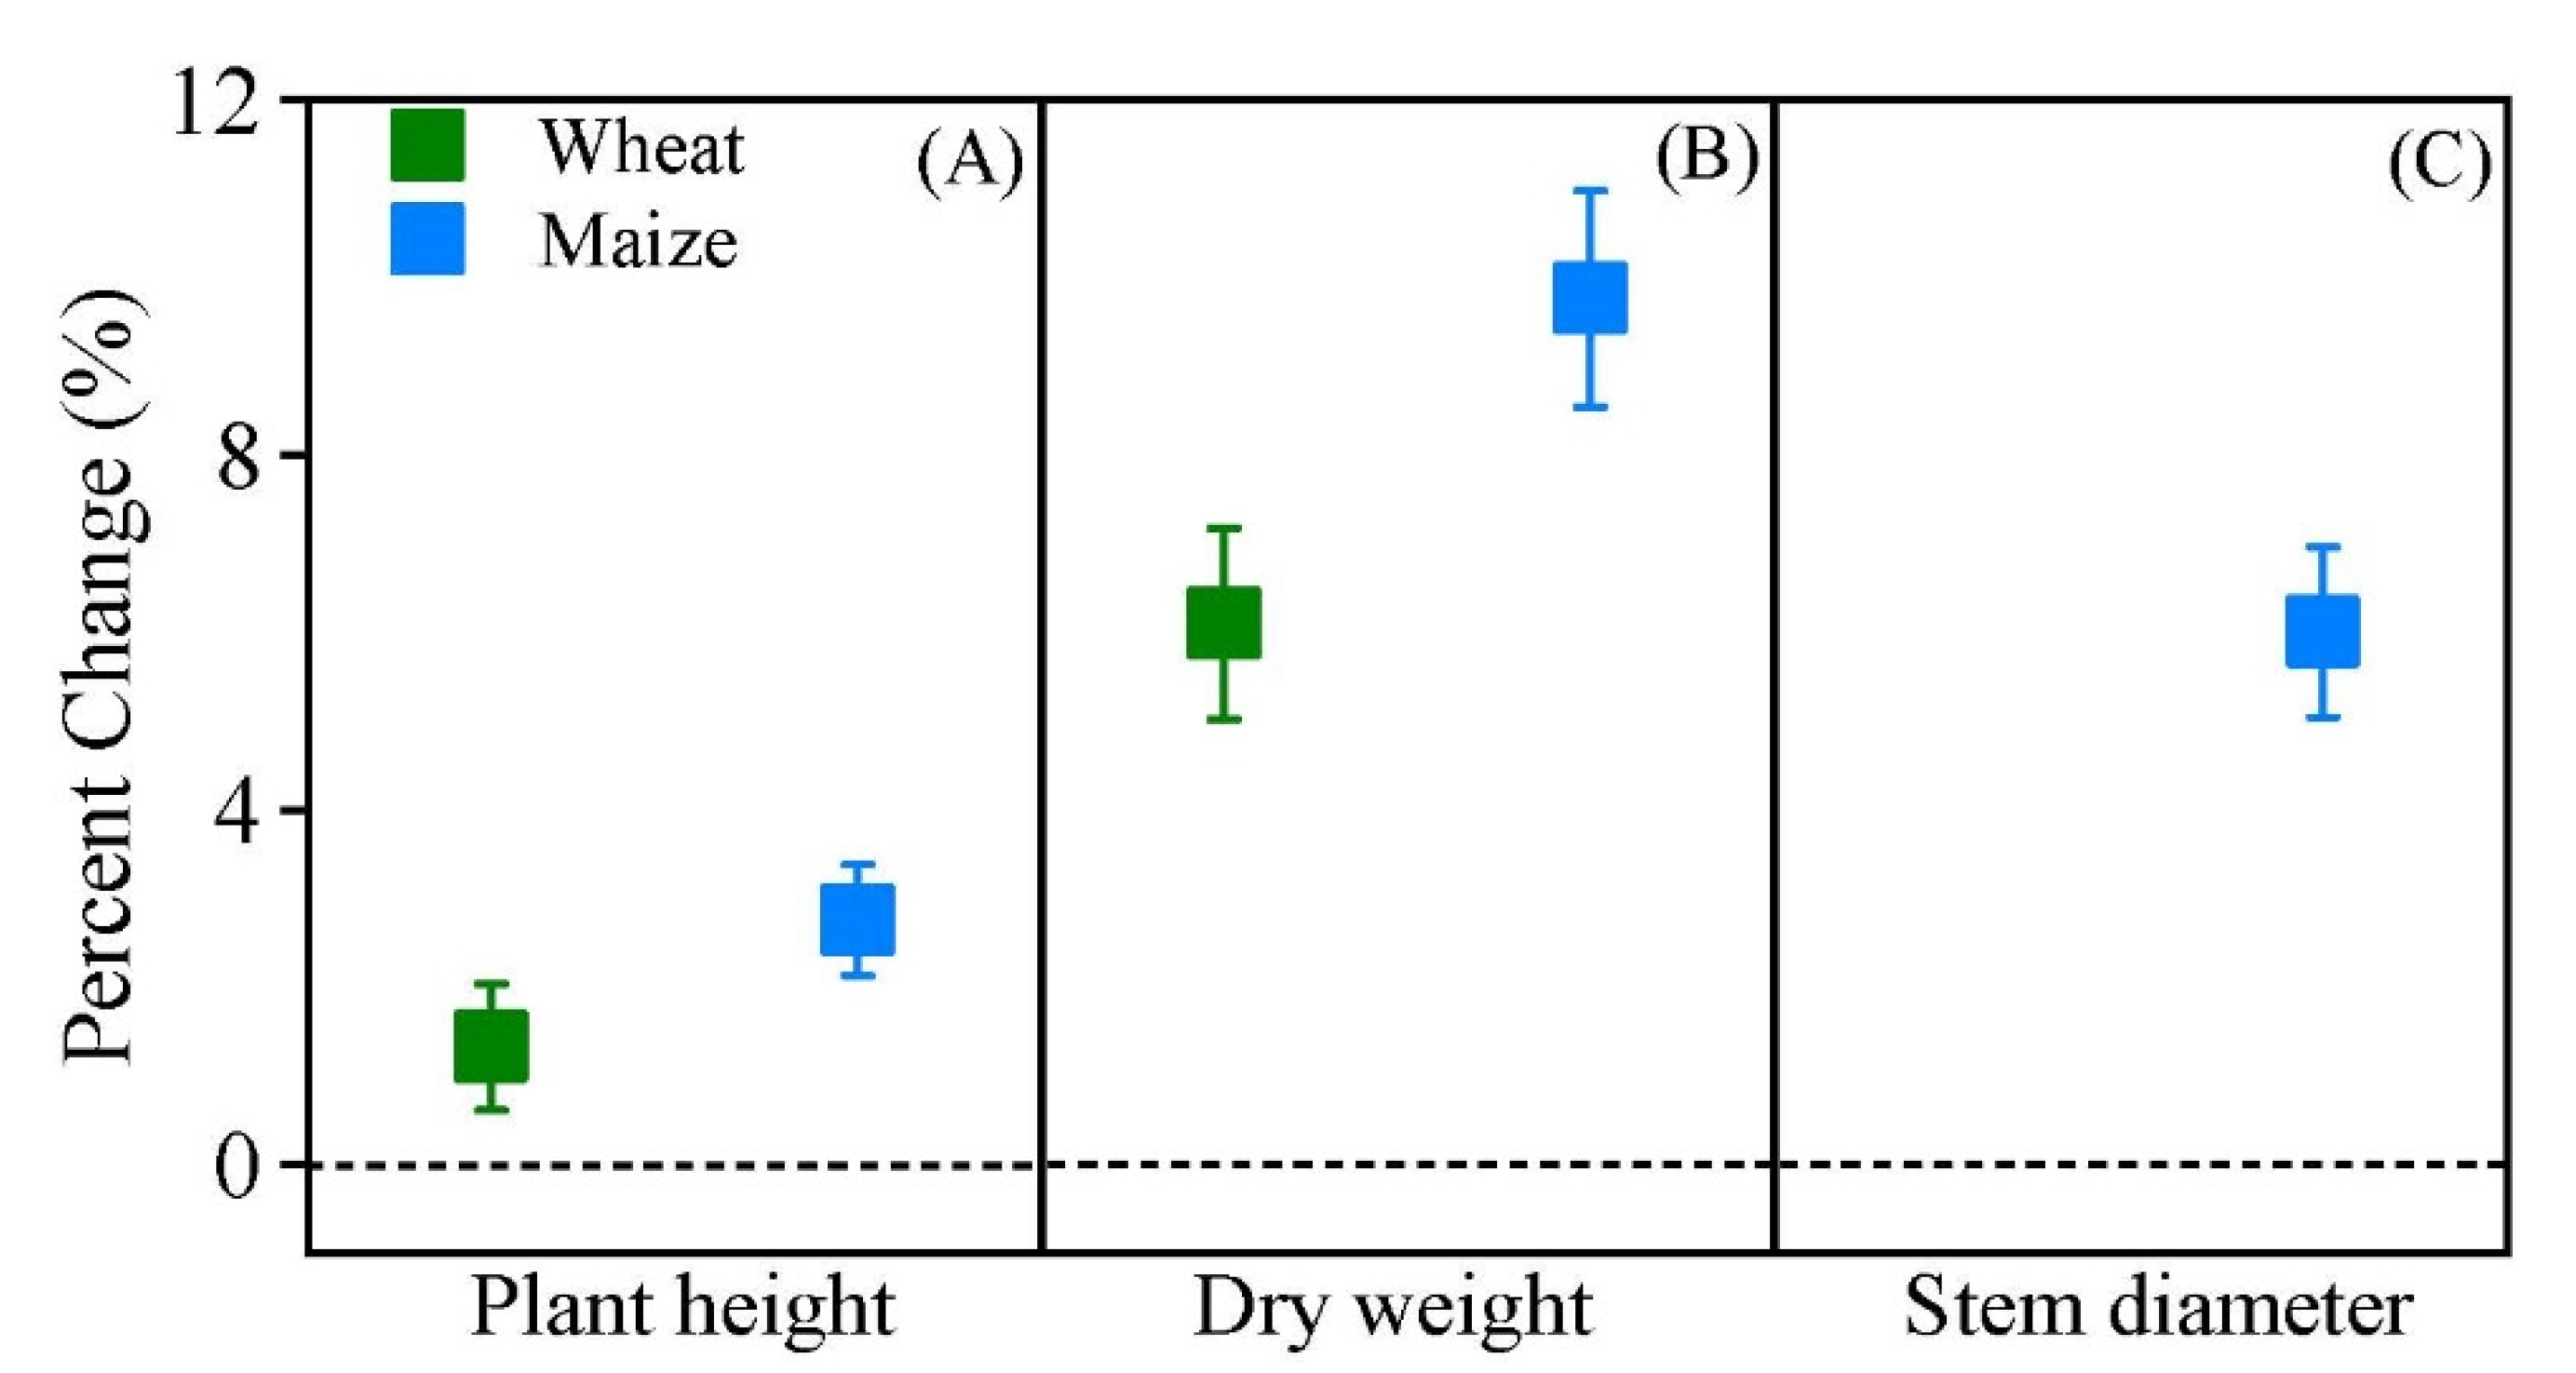
3.2. Effects of C-U on Plant Characteristics

For wheat, the effects of C-U on crop plant characteristics fluctuate among the studied growth stage, for plant height with QM = 40.99, df = 7, p < 0.0001, and for dry weight with QM = 198.94, df = 7, p < 0.0001. The mean value of plant height with C-U in the trefoil stage (3.54 cm), pre-freezing stage (3.56 cm), returning-green period (4.39 cm), elongation stage (15.98 cm), and flowering stage (67.54 cm) exceed ones with U treatment (Figure 3A), while meta-analysis revealed especially in returning-green period and elongation stage, plant height increased considerably (Table 2). Although the mean value of the dry weight with C-U in all growth stages exceeds the ones with the U treatment (Figure 3B), dry weight increased remarkably in the trefoil stage, the pre-freezing stage, the returning-green period, and the elongation stage (Table 2). Predominantly, significant increases were revealed in plant height and plant dry weight of wheat by 1.33% and 6.10%, respectively, with C-U in comparison to the U treatment. Furthermore, the effects of C-U on wheat plant characteristics varied among the release longevity, and the ratio of CRU-N:C-U with 60 d CRU had significantly increased the plant height and dry weight by 1.76% and 6.48%, whereas C-U with 90 d CRU significantly proliferated the dry weight by 7.68%. Additionally, C-U with 20%, 30%, and 40% CRU-N elevated the dry weight by 6.23%, 6.52%, and 7.28% notably, while the ratio of CRU-N had no effects on the plant height of wheat (Table 1).
In the case of maize, the effects of C-U on crop plant characteristics varied among the studied growth stage, for plant height with QM = 39.56, df = 6, p < 0.0001, and for dry weight with QM = 87.89, df = 6, p < 0.0001, and for stem diameter with QM = 24.27, df = 6, p = 0.0002. At the seedling stage, elongation stage, booting stage, tasseling stage, filling stage, and maturing stage, a mean value of the dry weight and stem diameter to all C-U treatments were 2.77, 18.65, 60.51,117.65, 116.36, and 151.02 g·plant-1 and 1.32, 2.14, 2.31, 2.35, 2.04. and 2.12 cm. respectively, which all exceeded ones with U treatment. C-U considerably augmented the dry weight and stem diameter at every growth stage. A mean value of plant height with C-U in these growth stages was 43.36, 80.04, 165.03, 271.05, 280.90, and 278.91 cm, in comparison to U treatment with a mean value 43.36, 76.11, 157.69, 265.35, 275.56, and 275.33 cm, respectively, with a remarkable increase at the elongation, booting, and the tasseling stage (Table 2). Comprehensively, C-U treatment also increased the plant height, dry weight, and stem diameter when compared with U treatment by 2.76%, 9.76%, and 6.0%, respectively (Figure 4). Furthermore, C-U with 30 d, 60 d, and 90 d CRU had significantly increased dry weight by 4.37%, 10.07%, and 13.49%, accelerated the plant height by 1.85%, 2.51%, and 4.77% and improved the stem diameter by 2.79%, 6.48%, and 6.91%. Additionally, C-U with 20%, 25%, 30%, or 40% CRU-N elevated the dry weight by 3.48%, 9.55%, 11.33%, and 10.09%, respectively, and C-U with 25% and 30% CRU-N increased the plant height by 1.78% and 3.70%, while the ratio of CRU-N had no effect on stem diameter of maize (Table 1).

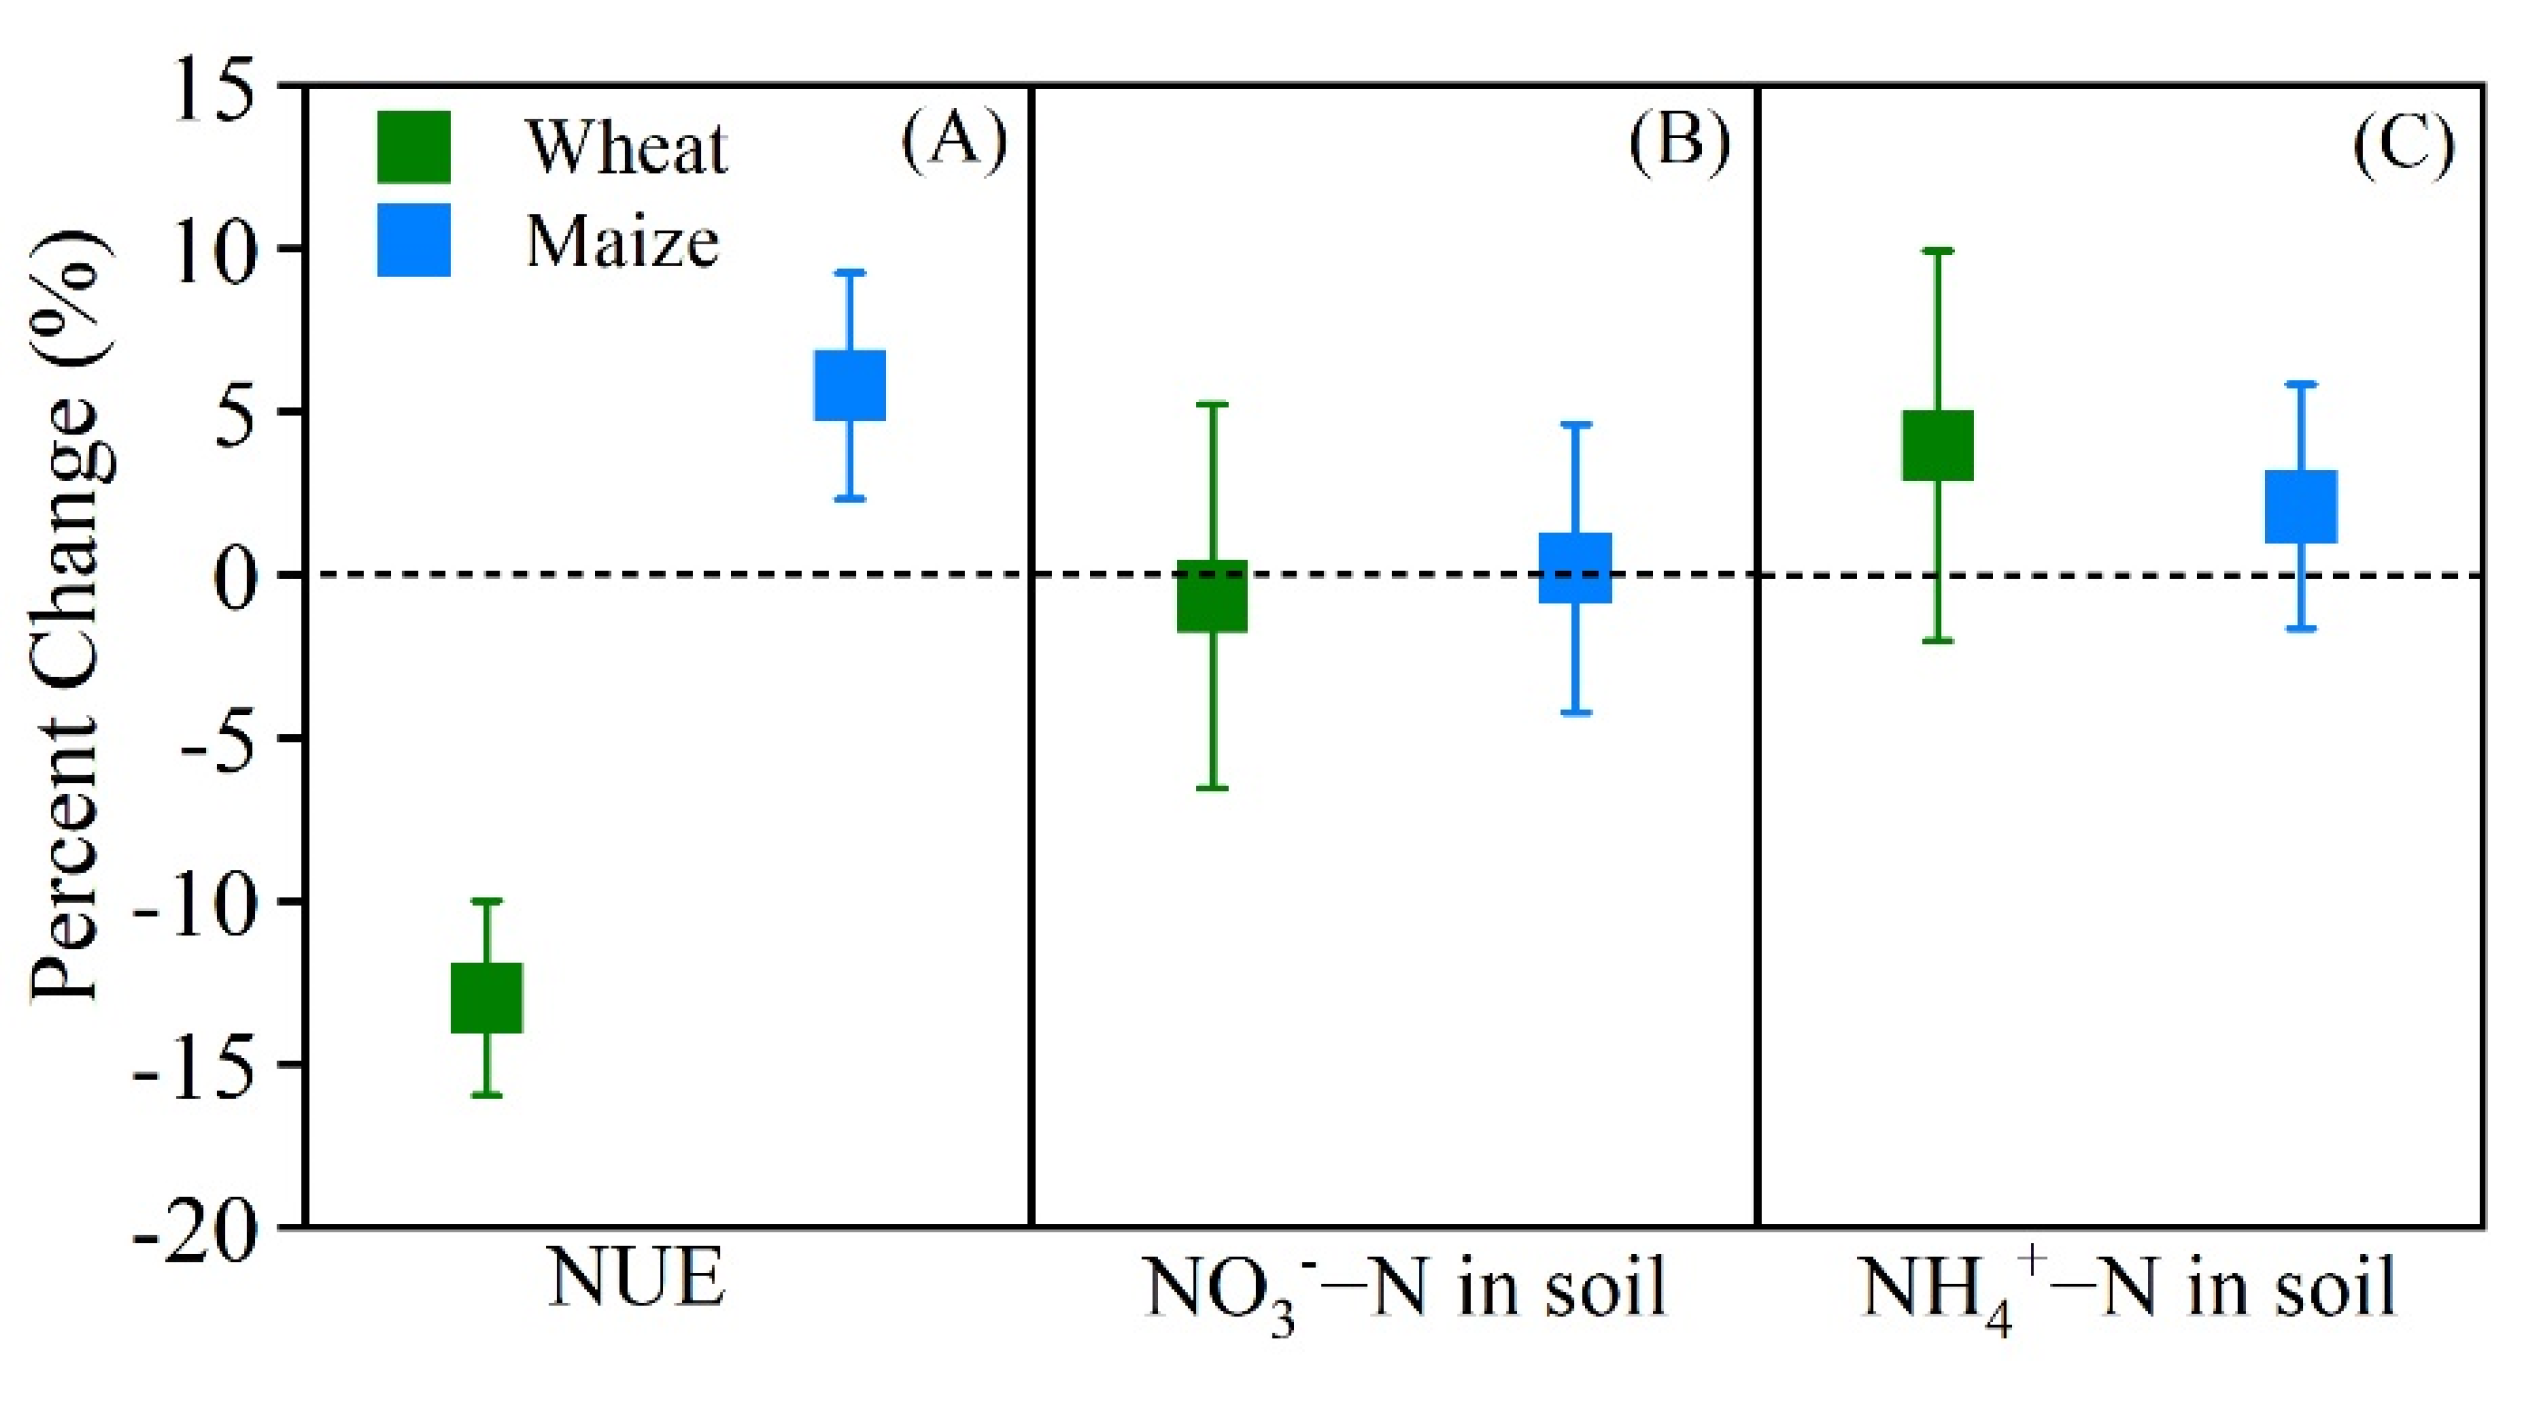
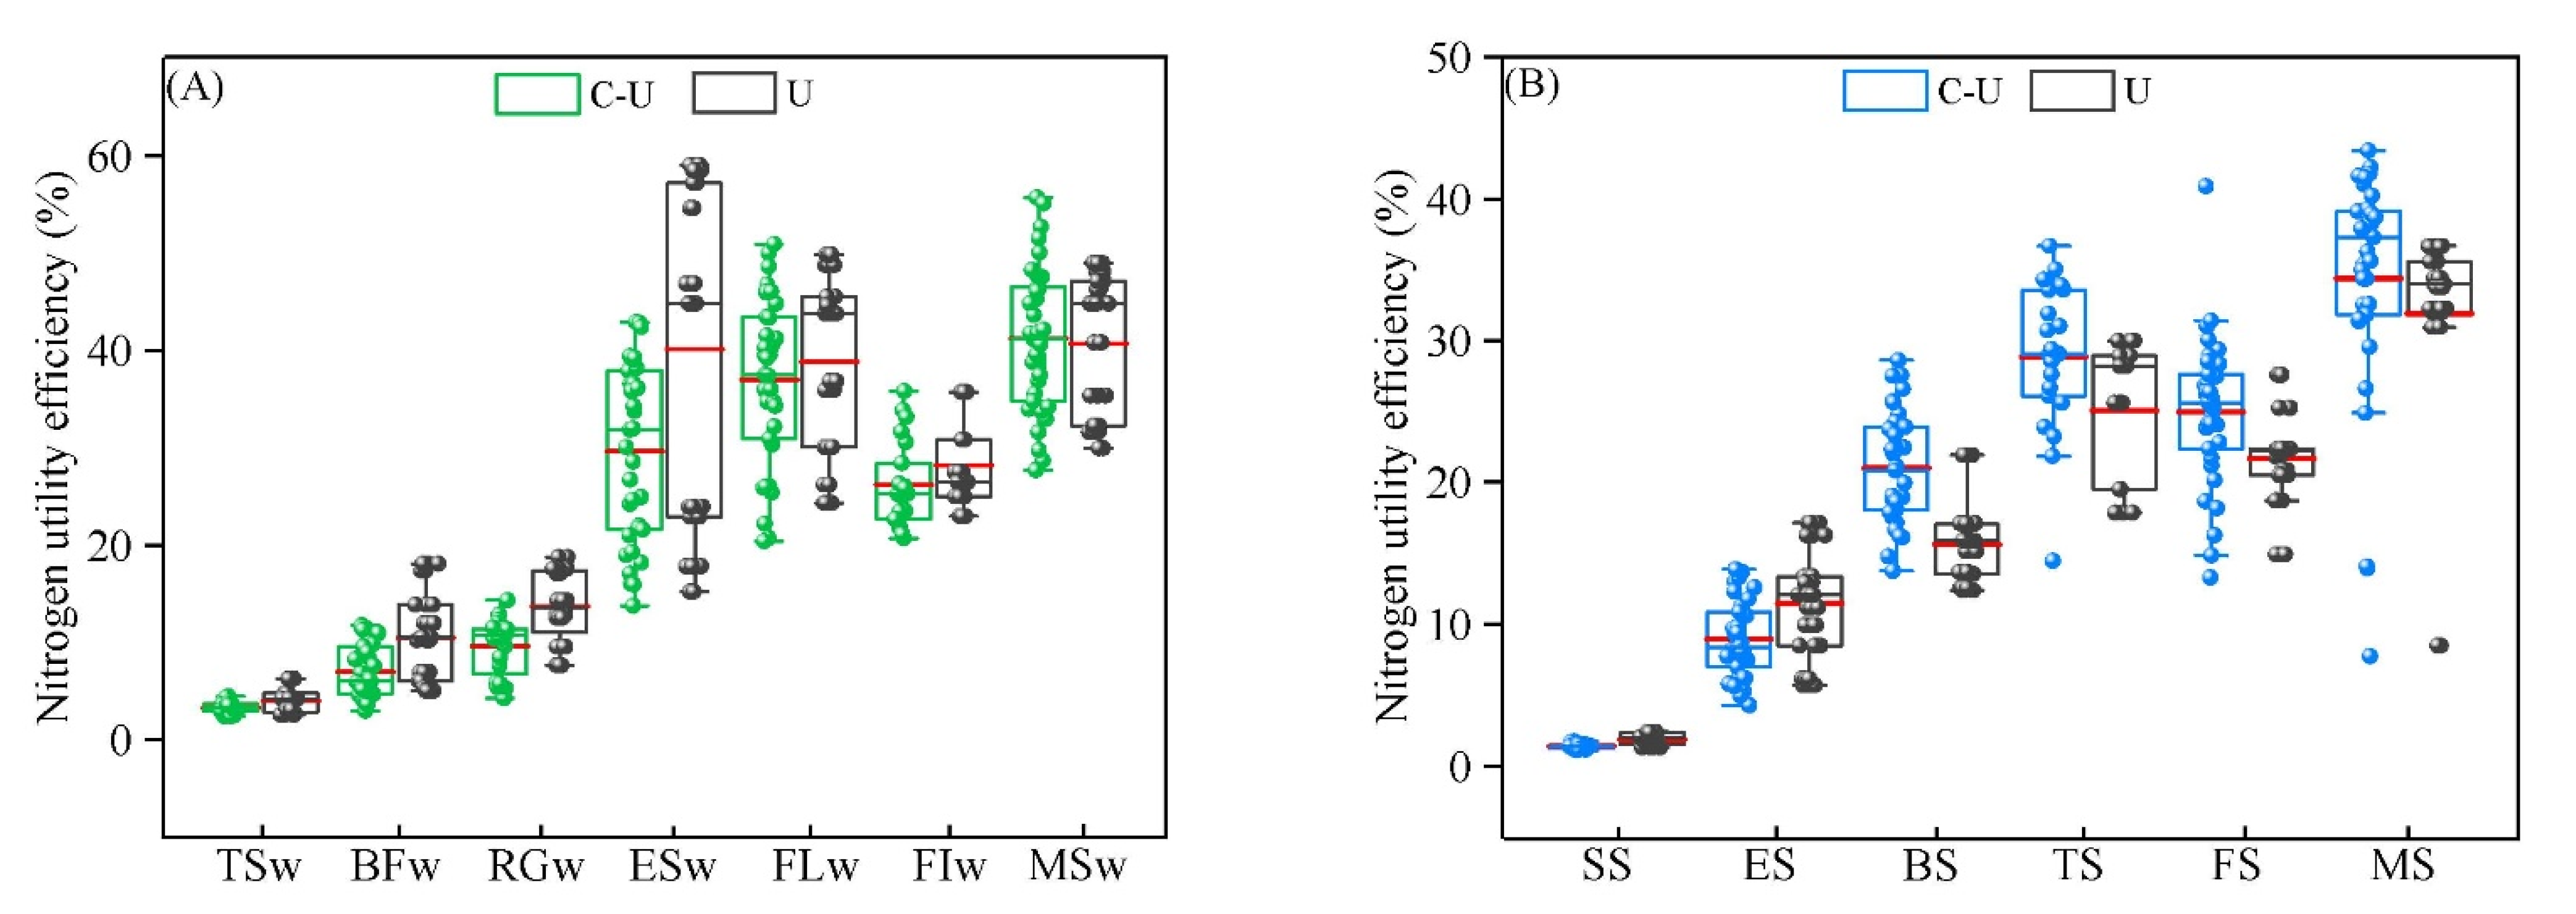
3.3. Effects of C-U on Nitrogen Utility Efficiency(NUE)

Meta-analysis showed that C-U treatment drastically reduced the NUE of wheat by 12.99%, while significantly improving the NUE in the case of maize by 5.79% when compared with U treatment (Figure 5). The effects of C-U on NUE differ among growth stage of wheat (QM = 239.27, df = 6, p < 0.0001), and the mean value of NUE in the maturing stage (41.24%) exceeded ones with U treatment, except in the trefoil stage (3.29%), pre-freezing stage (6.96%), returning-green period (9.59%), elongation stage (29.68%), flowering stage (37.04%), and filling Stage (26.24%) (Figure 6A), and Meta revealed that in filling stage, trefoil stage, elongation stage, returning-green period, and pre-freezing stage, C-U significantly decreased NUE (Table 2). Additionally, C-U with 30 d, 60 d, and 90 d CRU had significantly decreased NUE by 21.23%, 11.55%, and 11.87%, and C-U with 10%, 20%, 30%, and 40% CRU-N also had significantly decreased NUE by 22.97%, 11.57%, 11.95%, and 8.04%, respectively (Table 1).
The effects of C-U on NUE varied among the growth stage of maize (QM = 201.30, df = 5, p < 0.0001), and the mean value in booting (20.99%), tasseling (28.85%), filling stage (24.96%), and the maturing stage (34.36%) exceeded the ones with U treatment, except in seedling (1.36%) and elongation stage (8.93%) (Figure 6B). Similarly, the C-U significantly reduced the NUE in the seedling and elongation stages, whereas it proliferated remarkably in the booting, tasseling, filling stage, and the maturing stage. Moreover, the C-U with 60 d and 90 d CRU significantly improved the NUE by 6.64% and 12.92%, whereas C-U with 30% CRU-N enhanced the NUE by 8.63% (Table 1).

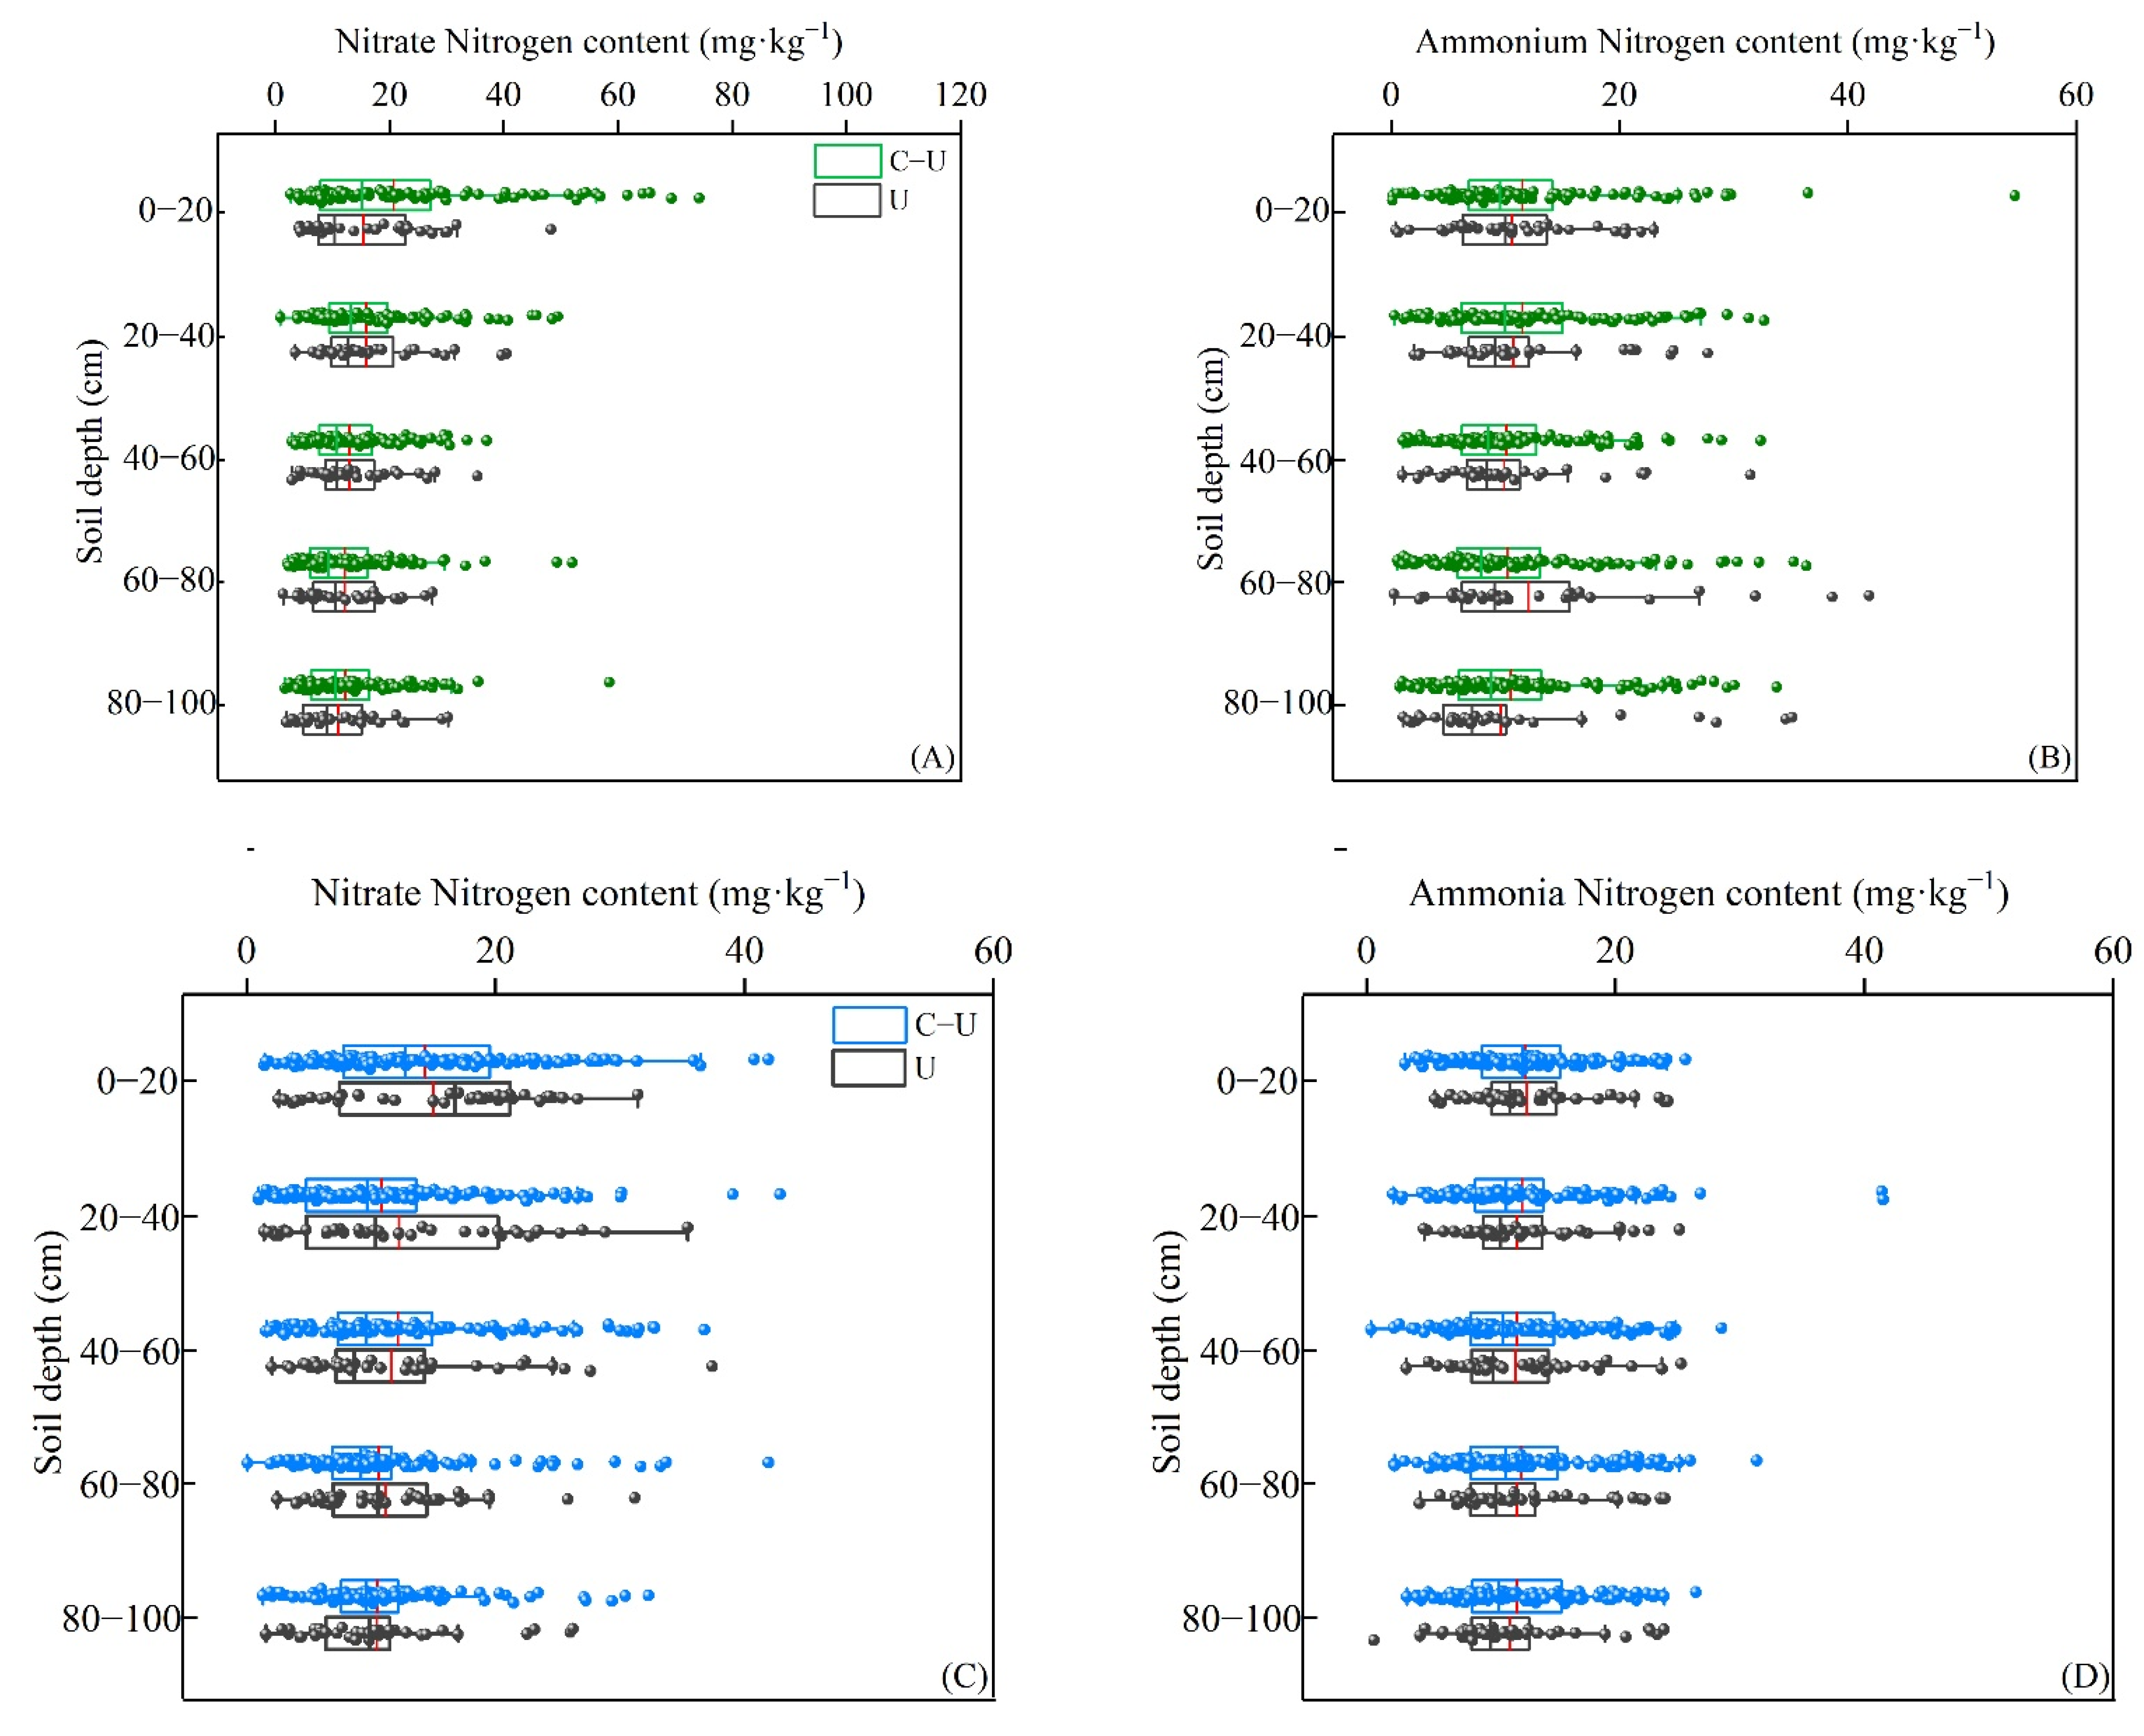
3.4. Effects of C-U on Nitrogen Content in the Soil

In wheat season, a mean value of NO3-N in 0–20 cm (21.44 mg·kg−1) and 80–100 cm (12.66 mg·kg−1) exceeded ones with U treatment, except in 20–40 cm (15.57 mg·kg−1), 40–60 cm (13.17 mg·kg−1), and 60–80 cm (12.64 mg·kg−1) (Figure 7A). A mean value of NH4+-N in 0–20 cm (10.76 mg·kg−1), 20–40 cm (11.36 mg·kg−1), 40–60 cm (9.76 mg·kg−1), and 80–100 cm (9.83 mg·kg−1) exceeded the ones with U treatment, except in 60–80 cm (9.56 mg·kg−1) (Figure 7B). Meta-analysis demonstrated that C-U treatments had no considerable effect on soil NO3-N and NH4+-N (Figure 5), irrespective of the release longevity or the ratios of CRU (Table 1). However, NO3-N in 0–20 cm and NH4+-N in 80–100 cm were significantly augmented by 13.61% and 15.17%, respectively, with C-U treatment (Figure 8A,B).
In maize season, a mean value of NO3-N in 40–60 cm (12.16 mg·kg−1) and 80–100 cm (10.51 mg·kg−1) exceeded ones with U treatment, except in 0–20 cm (14.38 mg·kg−1), 20–40 cm (10.85 mg·kg−1), and 60–80 cm (10.61 mg·kg−1) (Figure 7C). A mean value of NH4+-N in 20–40 cm (12.49 mg·kg−1), 40–60 cm (12.07 mg·kg−1), 60–80 cm (12.46 mg·kg−1), and 80–100 cm (12.10 mg·kg−1) exceeded the ones with U treatment, except in 0–20 cm (12.77 mg·kg−1) (Figure 7D). Meta-analysis also demonstrated that C-U treatments had no effect on soil NO3-N and NH4+-N (Figure 5), despite soil depth (Figure 8A,B). Meta-analysis revealed that the release longevity and the ratio of CRU had a notable effect on soil NO3-N: C-U with 30 d of CRU significantly decreasing NO3-N by 14.84%, and C-U with 40% CRU-N increasing NO3-N by 18.25% (Table 1).

4. Discussion

Application of fertilizer in accordance with the crop requirements is crucial for efficient yield (Shoji et al., 2001; Geng et al., 2015a). The N demand of most crops has predominantly an obvious S-shaped curve, and more N is often required in the middle of rapid growth [19], expanding from the small bellbottom stage to the heading stage for maize and from the elongation stage to heading stage for wheat. The N release of CRU also forms an obvious S-shape [6,20], indicating that CRU can supply better synchronization for most crop N demand, which not only promotes crop growth and improves dry matter accumulation and N uptake but also prevents premature senescence [21]. Common urea is the instant nitrogen fertilizer utilized all over the world, which can increase soil NO3-N content rapidly after application into soil in 2 weeks [22]. N application in excessive amounts with inappropriate application methods leads to high N losses through leaching. Especially in maize season with high temperature and concentrated precipitation, topical application of urea N not only obstructs the sole objective of high crop yield, but also induces N waste and descreases the NUE. In addition, CRU promotes crop root activity and augments the absorption area, thereby enhancing nutrient absorption [23]. These changes consecutively improve crop yield and NUE [24]. However, some results revealed that the mixed CRU with or splitting urea N remarkably improved crop yield and N accumulation, but there was no obvious difference between them [20,25,26].
The single basal application of CRU before transplanting could delay and prolong the N release to harvest, due to its slower N release rate [27]. Nevertheless, a single basal application of the mixed CRU with urea could provide N nutrition adequate for panicle differentiation and the grain filling process of the crop [28]. Establishing a reasonable CRU-N proportion in the mixed N fertilizer requires a scientific and flexible fertilizing recommendation [29]. Some reports demonstrated that CRU with a 50% proportion in the mixture can promote maize root growth and enhance the efficient utilization of N by soil microorganisms, and CRU with a 70% proportion plays a vital role in a wheat–maize rotation system, which can potentially be employed to improve the yields, NUE, and net benefit with low N losses [4]. There are differences among results about the ratios of CRU-N in mixed fertilizer. Predominantly, a lot of N for reproduction and vegetative growth in the latter growth stage were indispensable. Zhang et al. analyzed that there was a significant positive correlation between the N release longevity and the positive effect of CRU by implementing the regression method [25]. In this study, 30 d CRU in the mixture was negatively correlated with crop yield, plant characteristics, and NUE, while 60 d or 90 d CRU revealed positive consequences. However, the cost of CRU with 90 d proved to be relatively high, and its release longevity of N is nonfunctional for the fertilizer requirement of summer maize.
CRU governed N release by coating may be more sensitive to climate factors [30]. More precipitation and higher temperatures accelerate nutrient release from CRU [31], especially when the mean annual temperature is > 12 °C and mean annual rainfall is >550 mm [25], while in winter, when the soil temperature is below 0 °C and little N is needed by wheat, the CRU is almost not released into the soil. Additionally, the N release is slow mainly in the early stage of CRU [27], only with 28.7% N released in the first 120 days of the wheat growing season and 37.9% N released in the first 50 days of the corn growing season [20], although the cumulative N release longevity of CRU was 240 days for wheat and 120 days for maize. Most notably, the slow release of N in the early stage would limit the spike number per unit area of wheat, which is a key factor for its grain yield [27,32]. Furthermore, studies proved impacts of SOM on the CRU effect [25]. The higher C/N ratio in soil after maize straw returning would lead to increased competition for nitrogen between soil microorganisms and crops [33]. This increased competition restricting the amount of N released from the soil would cause the N content reduction in crop leaves, leading to a diminished photosynthesis rate [34]. At the same time, the slow release of N from CRU would further accelerate this effect with higher C/N ratios. Therefore, CRU had a poor substitution effect on urea-N for wheat [25], which is in line with this study’s results. Zhang et al. also revealed that when the soil-available N content and the N application rate were both low in wheat season, such as the former < 50 mg kg−1 and the latter < 150 kg ha−1, the positive effect of CRU is weaker than split-urea N [25].
The soil NH4+-N levels in C-U treatment are comparatively proliferated than in U treatment. Some studies also demonstrated that the application of C-U could improve the NH4+-N contents in the topsoil [20]. Notably, although the concentrations of TN and NH4+-N under C-U treatment were higher, the difference among the controlled-release nitrogen fertilizer (CRU-N) was not statistically significant [4]. Those results indicated that the reduction of the conventional urea and the elevation of the proportion of 100% CRU would benefit nitrogen accumulation. Actually, 30% traditional urea in C-U was adequate to restore the nitrogen deficiency [35,36].
Predominantly, C-U contributes to crop yield and NUE, in comparison, to urea. A combination of 30–50% of CRU with urea synchronizes absorption with availability due to a period of increased N availability in soils and is proven to be the best strategy for simultaneously increasing wheat or maize production and NUE and reducing N leaching [7]. However, due to regional climate factors, soil physicochemical factors, and field management measures, the effects of C-U is varied. For crops such as winter wheat with a long growth cycle, CRU may have the risk of insufficient N supply for crop growth [27] and furthermore indicated a twice-split application of CRU to meet the N demand of winter wheat [30]. For crops, such as maize with short growth cycles, a single basal application of C-U may fit their N requirement patterns. Additionally, it is necessary to optimize CRU to reduce costs [37].

5. Conclusions

In comparison to common urea alone at the same N application rate, across five years, C-U (the mixed CRU with urea) had significant effects on grain yield and plant characteristics, NUE, and soil NO3-N contents in wheat–maize production with meta-analysis. In general, C-U significantly increased yield (3.80%), 1000-grain number (1.12%), grain number per ear (2.07%), plant dry weight (9.76%), plant height (2.76%), stem diameter (6.0%), and NUE (5.79%) for maize, while it decreased sterile spikelet number (3.28%) and NUE (12.22%) and increased plant dry weight (6.10%) and plant height (1.33%) for wheat. These effects were different with the appropriate release longevity of CRU and the ratio of CRU-N in C-U. The application of C-U with 60 d or 90 d CRU for wheat and maize had the best overall effects, while C-U treatment with 30 d CRU had a significant inhibitory effect on grain yield, 1000-grain weight, grain number per ear, and NUE. For maize, the application of C-U with 30% CRU-N had the largest increase rate on yield, 1000-grain weight, plant height, dry weight, and NUE by 5.13%, 1.61%, 3.70%, 11.33%, and 8.63%, respectively, while 40% CRU-N had the largest decrease on soil NO3-N. For wheat, the application of C-U with 40% CRU-N had noteworthy effects on yield, sterile spikelet number, and NUE by 4.45%, −9.76%, and −8.04%, respectively. Consequently, the use of the C-U has great potential to increase wheat–maize yields and reduce fertilizer loss, especially for maize, which provides an effective generic methodology for agriculture to improve measures and ensure profitability.

Author Contributions

J.L., writing—original draft preparation and data curation; G.Z. and G.S., field trial and investigation; W.Y. and Q.X., methodology, writing—reviewing and editing. All authors have read and agreed to the published version of the manuscript.

Funding

This research was funded by the National Natural Science Foundation of China (Grant No. 41907078) and the National Key R&D Project of China (2017YFD0201702 and 2018YFD0200608).

Institutional Review Board Statement

Not applicable.

Informed Consent Statement

Not applicable.

Data Availability Statement

Data available in a publicly accessible repository. The data presented in this study are available on request from the author.

Acknowledgments

We thank the anonymous reviewers and the editors for very helpful comments and suggestions for the manuscript.

Conflicts of Interest

The authors declare that they have no known competing financial interest or personal relationships that could have appeared to influence the work reported in this paper.

References

  1. Editorial Board of Ministry Agriculture. China Agriculture Statistical Report; China Agriculture Press: Beijing, China, 2017. [Google Scholar]
  2. Zhang, F.S.; Wang, J.Q.; Zhang, W.F.; Cui, Z.L.; Ma, W.Q.; Chen, X.P.; Jiang, R.F. Nutrient use efficiencies of major cereal crops in China and measures for improvement. Acta Pedol. Sin. 2008, 45, 915–924. (In Chinese) [Google Scholar]
  3. Zhong, Q.; Ju, X.T.; Zhang, F.S. Analysis of environmental endurance of winter wheat/summer maize rotation system to nitrogen in North China Plain. J. Plant Nutr. Fertil. 2006, 12, 285–293. (In Chinese) [Google Scholar]
  4. Ji, P.T.; Peng, Y.J.; Cui, Y.W.; Li, X.L.; Tao, P.J.; Zhang, Y.C. Effects of reducing and postponing controlled-release Urea application on soil nitrogen regulation and maize grain yield. Int. J. Agric. Biol. Eng. 2022, 15, 116–123. [Google Scholar] [CrossRef]
  5. Li, T.Y.; Zhang, W.F.; Yin, J.; Chadwick, D.R.; Norse, D.; Lu, Y.L.; Liu, X.J.; Chen, X.P.; Zhang, F.S.; Powlson, D. Enhanced-efficiency fertilizer are not a panacea for resolving the nitrogen problem. Glob. Change Biol. Bioenergy 2018, 24, 511–521. [Google Scholar] [CrossRef] [PubMed]
  6. Geng, J.B.; Ma, Q.; Zhang, M.; Li, C.L.; Liu, Z.G.; Lu, X.X.; Zheng, W.K. Synchronized relationships between nitrogen release of controlled release nitrogen fertilizers and nitrogen requirements of cotton. Field Crops Res. 2015, 184, 9–16. [Google Scholar] [CrossRef]
  7. Yang, X.; Zhang, C.; Ma, X.; Liu, Q.; An, J.; Xu, S.; Xie, X.; Geng, J. Combining Organic Fertilizer with Controlled-Release Urea to Reduce Nitrogen Leaching and Promote Wheat Yields. Front. Plant Sci. 2021, 12, 802137. [Google Scholar] [CrossRef]
  8. Chen, Y.T.; Peng, J.; Wang, J.; Fu, P.H.; Hou, Y.; Zhang, C.D.; Fahad, S.H.; Peng, S.B.; Cui, K.H.; Nie, L.X.; et al. Crop management based on multi-split topdressing enhances grain yield and nitrogen use efficiency in irrigated rice in China. Field Crops Res. 2015, 184, 50–57. [Google Scholar] [CrossRef]
  9. Tian, X.F.; Li, C.L.; Zhang, M.; Li, T.; Lu, Y.Y.; Liu, L.F. Controlled release Urea improved crop yields and mitigated nitrate leaching under cotton-garlic intercropping system in a 4-year field trial. Soil Tillage Res. 2018, 175, 158–167. [Google Scholar] [CrossRef]
  10. Guo, J.M.; Wang, Y.H.; Blaylock, A.D.; Chen, X.P. Mixture of controlled release and normal Urea to optimize nitrogen management for high-yielding (>15 Mg ha−1) maize. Field Crops Res. 2017, 204, 23–30. [Google Scholar] [CrossRef]
  11. Mikula, K.; Izydorczyk, G.; Skrzypaczak, D.; Mironiuk, M.; Moustakas, K.; Witek-Krowiak, A.; Chojnacka, K. Controlled release micronutrient fertilizers for precision agriculture—A review. Sci. Total Environ. 2020, 712, 136365. [Google Scholar] [CrossRef]
  12. Huang, Q.; Fan, X.; Tang, S.; Zhang, M.; Huang, X.; Yi, Q.; Pang, Y.; Huang, J. Seasonal differences in N release dynamic of controlled-released Urea in paddy field and its impact on the growth of rice under double rice cropping system. Soil Tillage Res. 2019, 195, 104371. [Google Scholar] [CrossRef]
  13. Zheng, W.K.; Zhang, M.; Liu, Z.G.; Zhou, H.Y.; Lu, H.; Zhang, W.T.; Yang, Y.C.; Li, C.L.; Chen, B.C. Combining controlled-release Urea and normal Urea to improve the nitrogen use efficiency and yield under wheat–maize double cropping system. Field Crops Res. 2016, 197, 52–62. [Google Scholar] [CrossRef]
  14. Zhou, Z.J.; Shen, Y.Z.; Du, C.W.; Zhou, J.M.; Qin, Y.S.; Wu, Y.J. Economic and Soil Environmental Benefits of Using Controlled-Release Bulk Blending Urea in the North China Plain. Land Degrad. Dev. 2017, 28, 2370–2379. [Google Scholar] [CrossRef]
  15. Douglas, L.A.; Riazi, A.; Smith, C.J. A semi-micro method for determining total nitrogen in soils and plant material containing nitrite and nitrate. Soil Sci. Soc. Am. J. 1980, 44, 431–433. [Google Scholar] [CrossRef]
  16. Devkota, M.; Martius, C.; Lamers, J.P.A.; Sayre, K.D.; Devkota, K.P.; Vlek, P.L.G. Tillage and nitrogen fertilization effects on yield and nitrogen use efficiency of irrigated cotton. Soil Tillage Res. 2013, 134, 72–82. [Google Scholar] [CrossRef]
  17. R Core Team. R: A Language and Environment for Statistical Computing; R Foundation for Statistical Computing: Vienna, Austria, 2014; Available online: http://www.R-project.org/ (accessed on 22 October 2022).
  18. Wolfgang, V. Conducting meta–analyses in R with the metafor package. J. Stat. Softw. 2010, 36, 1–48. [Google Scholar]
  19. Overman, A.R.; Scholtz, R.V., III. Model for accumulation of dry matter and plant nutrients by corn. Commun. Soil Sci. Plant Anal. 1999, 30, 2059–2081. [Google Scholar] [CrossRef]
  20. Zheng, W.K.; Liu, Z.G.; Zhang, M.; Shi, Y.F.; Zhu, Q.; Sun, Y.B.; Zhou, H.Y.; Li, C.L.; Yang, Y.C.; Geng, J.B. Improving crop yields, nitrogen use efficiencies, and profits by using mixtures of coated controlled-released and uncoated Urea in a wheat—Maize system. Field Crops Res. 2017, 205, 106–115. [Google Scholar] [CrossRef]
  21. Ye, Y.S.; Liang, X.Q.; Chen, Y.X.; Liu, J.; Gu, J.T.; Guo, R.; Li, L. Alternate wetting and drying irrigation and controlled-release nitrogen fertilizer in late-season rice. Effects on dry matter accumulation, yield, water and nitrogen use. Field Crops Res. 2013, 144, 212–224. [Google Scholar] [CrossRef]
  22. Ren, C.L.; Ma, Y.L.; Dong, X.X.; Zhang, L.J.; Ji, Y.Z. Effects of applying controlled-release Urea on the yield, nitrogen use efficiency and soil NO-3-N of summer maize. J. Agric. Univ. Hebei 2012, 35, 12–17. (In Chinese) [Google Scholar]
  23. Liu, C.M.; Luo, S.G.; Liu, Y.Y. Effect of controlled release Urea on the root activity and content of grain protein of spring wheat. J. Heilongjiang Bayi Agric. Univ. 2012, 24, 4–7. (In Chinese) [Google Scholar]
  24. Sun, H.F.; Zhou, S.X.; Zhang, J.N.; Zhang, X.X.; Wang, C. Effects of controlled-release fertilizer on rice grain yield, nitrogen use efficiency, and greenhouse gas emissions in a paddy field with straw incorporation. Field Crops Res. 2020, 253, 10781. [Google Scholar] [CrossRef]
  25. Zhang, G.X.; Zhao, D.H.; Liu, S.J.; Liao, Y.C.; Han, J. Can controlled-release Urea replace the split application of normal Urea in China? A meta-analysis based on crop grain yield and nitrogen use efficiency. Field Crops Res. 2022, 275, 10. [Google Scholar] [CrossRef]
  26. Zhu, B.G. Effect of controlled release nitrogen fertilizer on soil nitrate nitrogen and plant total nitrogen content and yield of corn. Chin. Agric. Sci. Bull. 2014, 30, 220–223. (In Chinese) [Google Scholar]
  27. Grant, C.A.; Wu, R.; Selles, F.; Harker, K.N.; Clayton, G.W.; Bittman, S.; Zebarth, B.J.; Lupwayi, N.Z. Crop yield and nitrogen concentration with controlled release Urea and split applications of nitrogen as compared to non-coated Urea applied at seeding. Field Crops Res. 2012, 127, 170–180. [Google Scholar] [CrossRef]
  28. Dubey, A.; Mailapalli, D.R. Development of control release Urea fertilizer model for water and nitrogen movement in flooded rice. Paddy Water Environ. 2018, 16, 1–13. [Google Scholar] [CrossRef]
  29. Xu, C.M.; Wang, D.Y.; Chen, S.; Chen, L.P.; Zhang, X.F. Effects of Aeration on root physiology and nitrogen metabolism in rice. Rice Sci. 2013, 20, 148–153. [Google Scholar] [CrossRef]
  30. Ma, Q.; Wang, M.Y.; Zheng, G.L.; Yao, Y.; Tao, R.R.; Zhu, M.; Ding, J.F.; Li, C.Y.; Guo, W.S.; Zhu, X.K. Twice-split application of controlled-release nitrogen fertilizer met the nitrogen demand of winter wheat. Field Crops Res. 2021, 267, 108163. [Google Scholar] [CrossRef]
  31. Yang, M.; Zhu, X.Q.; Bai, Y.; Sun, D.; Zou, H.T.; Fang, Y.T.; Zhang, Y.L. Coated controlled-release Urea creates a win-win scenario for producing more staple grains and resolving N loss dilemma worldwide. J. Clean. Prod. 2021, 288, 125660. [Google Scholar] [CrossRef]
  32. McKenzie, R.H.; Bremer, E.; Middleton, A.B.; Pfiffner, P.G.; Dowbenko, R.E. Controlled-release Urea for winter wheat in southern Alberta. Can. J. Soil Sci. 2007, 87, 85–91. [Google Scholar] [CrossRef]
  33. Springob, G.; Kirchmann, H. Bulk soil C to N ratio as a simple measure of net N mineralization from stabilized soil organic matter in sandy arable soils. Soil Biol. Biochem. 2003, 35, 629–632. [Google Scholar] [CrossRef]
  34. Gao, Y.; Shao, G.C.; Yang, Z.; Zhang, K.; Lu, J.; Wang, Z.Y.; Wu, S.Q.; Xu, D. Influences of soil and biochar properties and amount of biochar and fertilizer on the performance of biochar in improving plant photosynthetic rate: A meta-analysis. Eur. J. Agron. 2021, 130, 126345. [Google Scholar] [CrossRef]
  35. Zhang, W.; Liang, Z.; He, X.; Wang, X.W.; Shi, X.J.; Zou, C.Q.; Chen, X.P. The effects of controlled release Urea on maize productivity and reactive nitrogen losses: A meta-analysis. Environ. Pollut. 2019, 246, 559–565. [Google Scholar] [CrossRef]
  36. Li, P.E.; Lu, J.W.; Wang, Y. Nitrogen losses use efficiency and productivity of early rice under controlled-release Urea. Agric. Ecosyst. Environ. 2018, 251, 78–87. [Google Scholar] [CrossRef]
  37. Yang, X.Y.; Geng, J.B.; Liu, Q.J.; Zhang, H.Y.; Hao, X.D.; Sun, Y.B.; Lu, X.F. Controlled-release Urea improved rice yields by providing nitrogen in synchrony with the nitrogen requirements of plants. J. Sci. Food Agric. 2021, 101, 4183–4192. [Google Scholar] [CrossRef]
Figure 1. Yield characteristics of wheat and maize with C-U and U treatments: (a) wheat yield; (b) wheat 1000−grain weight; (c) wheat grain number per ear; (d) the numbers of sterile spikelet of wheat; (e) maize yield; (f) maize 1000-grain weight; (g) maize grain number per ear. In box-and-whiskers diagrams, red lines represent mean values, and green, blue, and gray lines represent median values; lower and upper edges represent 25th and 75th percentiles, respectively, and the shisker caps represent 10th and 90th percentiles of all data.
Sustainability 14 14943 g001
Figure 2. Percent change (%) in effects of C-U treatment on crop yield characteristics of wheat and maize: (a) yield; (b) 1000-grain weight; (c) grain number per ear; (d) the numbers of sterile spikelet.
Sustainability 14 14943 g002
Figure 3. Plant characteristics of wheat and maize with C-U and U treatments: (A) wheat plant height; (B) wheat dry weight; (C) maize plant height; (D) maize dry weight; (E) maize stem diameter. In box-and-whiskers diagrams, red lines represent mean values, and green, blue, and gray lines represent median values; lower and upper edges represent 25th and 75th percentiles, respectively, and the shisker caps represent 10th and 90th percentiles of all data; for wheat, TSw: trefoil stage; BFw: pre-freezing stage; RGw: returning-green period; Esw: elongation stage; FLw: flowering stage; Fiw: filling stage; MSw: maturing stage; for maize, SS: seedling stage; ES: elongation stage; BS: booting stage; TS: tasseling stage; FS: filling stage; MS: maturing stage.
Sustainability 14 14943 g003
Figure 4. Percent change (%) in effects of C-U on plant characteristics of wheat and maize: (A) plant height; (B) dry weight; (C) stem diameter.
Sustainability 14 14943 g004
Figure 5. Percent change (%) in effects of C-U on NUE, NO3-N, and NH4+-N in soil for wheat and maize: (A) NUE; (B) NO3-N; (C) NH4+-N.
Sustainability 14 14943 g005
Figure 6. NUE of wheat and maize with C-U and U treatments: (A) wheat; (B) maize. In box-and-whiskers diagrams, red lines represent mean values, and green, blue, and gray lines represent median values; lower and upper edges represent 25th and 75th percentiles, respectively, and the shisker caps represent 10th and 90th percentiles of all data; for wheat, TSw: trefoil stage; BFw: pre-freezing stag; RGw: returning-green period; Esw: elongation stage; FLw: flowering stage; Fiw: filling stage; MSw: maturing stage; for maize, SS: seedling stage; ES: elongation stage; BS: booting stage; TS: tasseling stage; FS: filling stage; MS: maturing stage.
Sustainability 14 14943 g006
Figure 7. Soil nitrogen content of wheat and maize with C-U and U treatments: (A) soil NO3-N content of wheat; (B) soil NH4+-N content of wheat; (C) soil NO3N content of maize; (D) soil NH4+-N content of maize. In box-and-whiskers diagrams, red lines represent mean values, and green, blue, and gray lines represent median values; lower and upper edges represent 25th and 75th percentiles, respectively, and the shisker caps represent 10th and 90th percentiles of all data.
Sustainability 14 14943 g007
Figure 8. Percent change (%) in effects of C-U on NO3-N and NH4+-N in soil depth for wheat and maize; (A) NO3-N for wheat; (B) NO3-N for maize; (C) NH4+-N for wheat; (D) NH4+-N for maize.
Sustainability 14 14943 g008
Table 1. Effects of the release longevity or the ratio of CRU-N on yield and plant characteristics, NUE, and soil nitrate contents for wheat or maize.
IndexCropVariable 1 (p Value)Variable 2EstimateCi.LbCi.UbPercent Change (%)
YieldmaizeCRU release longevity (0.016)30 d−0.011−0.0490.027−1.094
60 d ***0.040.0250.0574.081
90 d ***0.0610.0280.0966.29
CRU ratio (0.039)20%−0.012−0.0510.027−1.193
25%0.026−0.0130.0662.634
30% ***0.050.0320.0695.127
40% *0.0390.0030.0763.977
wheatCRU release longevity (0.003)30 d **−0.065−0.113−0.019−6.293
60 d0.011−0.0090.0321.106
90 d0.041−0.0030.0864.185
CRU ratio (<0.0001)10% ***−0.076−0.117−0.036−7.318
20%−0.003−0.0480.041−0.3
30% *0.02100.0412.122
40% *0.0440.0010.0864.446
1000-grain weightmaizeCRU release longevity (0.013)30 d−0.006−0.0210.008−0.598
60 d ***0.0120.0060.0181.207
90 d ***0.0230.0090.0362.327
CRU ratio (0.0367)20%−0.005−0.0190.008−0.499
25%.0.012−0.0010.0261.207
30% ***0.0160.0090.0231.613
40%0.008−0.0050.0220.803
wheatCRU release longevity (0.040)30 d *−0.022−0.041−0.003−2.156
60 d0.005−0.0030.0140.541
90 d0.001−0.0180.020.11
CRU ratio (0.988)-----
Grain number per earmaizeCRU release longevity (0.016)30 d−0.014−0.0390.011−1.371
60 d ***0.0260.0140.0372.603
90 d *0.0280.0020.0532.788
CRU ratio (0.441)-----
wheatCRU release longevity (<0.0001)30 d ***−0.064−0.096−0.032−6.218
60 d *0.0180.0040.0331.857
90 d **0.0410.0110.0724.227
CRU ratio (0.096)-----
Sterile spikelets numberwheatCRU release longevity (0.055)-----
CRU ratio (0.022)10%0.035−0.0290.0993.593
20%0.002−0.0710.0740.16
30% *−0.041−0.076−0.005−3.969
40% **−0.103−0.17−0.036−9.76
Dry weightmaizeCRU release longevity (0.0009)30 d **0.0430.0110.0754.373
60 d ***0.0960.0820.1110.065
90 d ***0.1270.0950.15813.485
CRU ratio (0.0006)20% *0.0340.0030.0653.479
25% ***0.0910.060.1229.549
30% ***0.1070.0920.12311.327
40% ***0.0960.0650.12710.087
wheatCRU release longevity (0.032)30 d0.025−0.0030.0542.552
60 d ***0.0630.050.0756.481
90 d ***0.0740.0460.1037.681
CRU ratio (0.087)-----
Plant heightmaizeCRU release longevity (0.024)30 d *0.0180.0020.0341.847
60 d ***0.0250.0180.0322.511
90 d ***0.0470.0310.0624.77
CRU ratio (0.005)20%0.01−0.0060.0271.045
25% *0.0180.0020.0331.776
30% ***0.0360.0290.0443.697
40%0.015−0.0010.0311.542
wheatCRU release longevity (0.028)30 d−0.01−0.0280.008−0.995
60 d ***0.0170.0090.0261.755
90 d0.014−0.0050.0331.42
CRU ratio (0.134)-----
Stem diametermaizeCRU release longevity (0.027)30 d *0.0280.0030.0522.788
60 d ***0.0630.0520.0746.481
90 d ***0.0670.0430.096.908
CRU ratio (0.234)----
NUEmaizeCRU release longevity (0.022)30 d−0.05−0.1390.04−4.849
60 d **0.0640.0240.1046.641
90 d **0.1220.0330.2112.919
CRU ratio (0.029)20%−0.07−0.1590.02−6.714
25%0.057−0.0330.1465.844
30% ***0.0830.0390.1278.632
40%0.074−0.0160.1637.627
wheatCRU release longevity (0.028)30 d ***−0.239−0.317−0.16−21.227
60 d ***−0.123−0.157−0.089−11.547
90 d **−0.126−0.204−0.048−11.865
CRU ratio (0.006)10% ***−0.261−0.338−0.184−22.972
20%**−0.123−0.199−0.047−11.574
30% ***−0.127−0.166−0.089−11.953
40% *−0.084−0.158−0.009−8.038
NH4+-N in soilmaizeCRU release longevity (0.328)-----
CRU ratio (0.338)-----
wheatCRU release longevity (0.558)-----
CRU ratio (0.779)-----
NO3-N in soilmaizeCRU release longevity (0.008)30 d *0.1380.0290.24814.843
60 d−0.041−0.0920.011−3.988
90 d0.063−0.0490.1756.513
CRU ratio (0.002)20%−0.021−0.1320.091−2.029
25%0.047−0.0660.164.833
30%0.045−0.0110.14.592
40% ***−0.202−0.315−0.088−18.25
wheatCRU release longevity (0.667)-----
CRU ratio (0.90)-----
*, ** and *** represent p < 0.05, p < 0.01, and p < 0.001, respectively.
Table 2. Percent change of crop plant height, dry weight, stem diameter, and NUE of wheat or maize in each crop growth stage under C-U treatment with Meta-analysis (%).
CropCrop Growth StagePlant HeightDry WeightStem DiameterNUE
WheatTrefoil Stage0.1615.49 ***-−14.24 **
Pre-freezing stage0.0812.14 ***-−33.25 ***
Returning-green period5.07 ***13.84 ***-−29.7 ***
Elongation stage4.74 ***11.96 ***-−20.9 ***
Flowering stage0.330.54-−4.88
Filling Stage−0.45−1.85-−7.96 *
Maturing stage1.090.53-1.91
MaizeSeedling stage−0.4215.14 ***6.62 ***−27.68 ***
Elongation stage5.39 ***19.96 ***5.95 ***−19.99 ***
Booting stage5.4 ***15.81 ***4.50 ***35.31 ***
Tasseling stage2.19 **8.25 ***12.40 ***15.43 ***
Filling stage1.607.57 ***4.41 ***14.6 ***
Maturing Stage1.39 *3.95 **5.27 ***10.48 **
*, ** and *** represent p < 0.05, p < 0.01, and p < 0.001, respectively.
Publisher’s Note: MDPI stays neutral with regard to jurisdictional claims in published maps and institutional affiliations.

