The Effect of Using “Student Response Systems (SRS)” on Faculty Performance and Student Interaction in the Classroom
Abstract
1. Introduction
2. Methods
2.1. Study Design
2.2. Procedure
- The participating faculty member must efficiently utilize the SRS in the learning process at least in six lectures (at least three questions each) within the semester.
- The participating faculty member must fulfill the final report on using SRS within the semis miter.
- The participating faculty member should use the SRS with bachelor’s sections where at least one section includes a minimum of 15 students.
- The participating faculty member should submit the faculty survey and encourage his/her students to fulfill the students’ survey on utilizing SRS.
- The newly engaged faculty members shall receive financial support for their efforts in using, managing, distributing the SRS devices, collecting data, and sending the reports on the project (irrespective of their students’ or their own opinion of using SRS).
2.3. Questionnaires to Evaluate Student’s and Faculty’s Perceptions
2.4. Validity and Reliability of the Surveys
2.5. Factor Analysis of the Surveys
2.6. Characteristics of the Participants
2.7. Ethical Considerations
2.8. Statistical Analysis
3. Results
4. Discussion
5. Conclusions
Author Contributions
Funding
Data Availability Statement
Acknowledgments
Conflicts of Interest
References
- Komarraju, M.; Musulkin, S.; Bhattacharya, G. Role of Student–Faculty Interactions in Developing College Students’ Academic Self-Concept, Motivation, and Achievement. J. Coll. Stud. Dev. 2010, 51, 332–342. [Google Scholar] [CrossRef]
- Lodge, J.M.; Kennedy, G.; Lockyer, L.; Arguel, A.; Pachman, M. Understanding Difficulties and Resulting Confusion in Learning: An Integrative Review. Front. Educ. 2018, 3, 49. [Google Scholar] [CrossRef]
- Li, R. Communication preference and the effectiveness of clickers in an Asian university economics course. Heliyon 2020, 6, e03847. [Google Scholar] [CrossRef] [PubMed]
- Stover, S.; Heilmann, S.G.; Hubbard, A.R. Student perceptions regarding clickers: The efficacy of clicker technologies. In End-User Considerations in Educational Technology Design; IGI Global: Hershey, Pennsylvania, 2018; pp. 291–315. [Google Scholar]
- Shahba, A.A.; Sales, I. Design Your Exam (DYE): A novel active learning technique to increase pharmacy student engagement in the learning process. Saudi Pharm. J. 2021, 29, 1323–1328. [Google Scholar] [CrossRef]
- Al Shammari, T.H.; Al Massaad, A.Z. The effect of using flipped classroom strategy on academic achievement and motivation towards learning informatics for 11th grade students. J. Educ. Psychol. Stud. 2019, 13, 65–85. [Google Scholar] [CrossRef]
- Sebelego, I.-K. The use of clickers to evaluate radiographer’s knowledge of shoulder images. Health SA 2019, 24, 1053. [Google Scholar] [CrossRef]
- Kapp, F.; Braun, I.; Körndle, H.; Schill, A. Metacognitive support in university lectures provided via mobile devices. In Proceedings of the 6th International Conference on Computer Supported Education, Barcelona, Spain, 1–3 April 2014. [Google Scholar]
- Tregonning, A.M.; Doherty, D.A.; Hornbuckle, J.; Dickinson, J.E. The audience response system and knowledge gain: A prospective study. Med. Teach. 2012, 34, e269–e274. [Google Scholar] [CrossRef]
- Duncan, D. Clickers in the Classroom; Addison-Wesley: Upper Saddle, NJ, USA, 2005. [Google Scholar]
- Lam, P.; Tong, A. Digital Devices in Classroom–Hesitations of Teachers-to-be. Electron. J. e-Learn. 2012, 10, 387–395. [Google Scholar]
- Katsioudi, G.; Kostareli, E. A Sandwich-model experiment with personal response systems on epigenetics: Insights into learning gain, student engagement and satisfaction. FEBS Open Bio 2021, 11, 1282–1298. [Google Scholar] [CrossRef]
- Stanley, D. Can technology improve large class learning? The case of an upper-division business core class. J. Educ. Bus. 2013, 88, 265–270. [Google Scholar] [CrossRef]
- Liu, D.J.; Walker, J.; Bauer, T.; Zhao, M. Facilitating Classroom Economics Experiments with an Emerging Technology: The Case of Clickers. 2007. Available online: https://papers.ssrn.com/sol3/papers.cfm?abstract_id=989482 (accessed on 2 October 2022).
- Hayter, J.; Rochelle, C.F. Clickers: Performance and Attitudes in Principles of Microeconomics. 2013. Available online: https://papers.ssrn.com/sol3/papers.cfm?abstract_id=2226401 (accessed on 2 October 2022).
- López, L.B.; Pérez, A.M.F.; León, E.F.; Varo, M.E.F.; Rodríguez, M.D.L. Using Interactive Response Systems in Economics: Utility and factors influencing students’ attitudes. Multidiscip. J. Educ. Soc. Technol. Sci. 2017, 4, 16–36. [Google Scholar] [CrossRef]
- Green, A. Significant returns in engagement and performance with a free teaching app. J. Econ. Educ. 2016, 47, 1–10. [Google Scholar] [CrossRef]
- Shahba, A.A.; Alashban, Z.; Sales, I.; Sherif, A.Y.; Yusuf, O. Development and Evaluation of Interactive Flipped e-Learning (iFEEL) for Pharmacy Students during the COVID-19 Pandemic. Int. J. Environ. Res. Public Health 2022, 19, 3902. [Google Scholar] [CrossRef] [PubMed]
- Tretter, J.T.; Windram, J.; Faulkner, T.; Hudgens, M.; Sendzikaite, S.; Blom, N.A.; Hanseus, K.; Loomba, R.S.; McMahon, C.J.; Zheleva, B.; et al. Heart University: A new online educational forum in paediatric and adult congenital cardiac care. The future of virtual learning in a post-pandemic world? Cardiol. Young 2020, 30, 560–567. [Google Scholar] [CrossRef] [PubMed]
- Wilson, J.A.; Waghel, R.C.; Dinkins, M.M. Flipped classroom versus a didactic method with active learning in a modified team-based learning self-care pharmacotherapy course. Curr. Pharm. Teach. Learn. 2019, 11, 1287–1295. [Google Scholar] [CrossRef] [PubMed]
- Mahmoud, M.A.; Islam, M.A.; Ahmed, M.; Bashir, R.; Ibrahim, R.; Al-Nemiri, S.; Babiker, E.; Mutasim, N.; Alolayan, S.O.; Al Thagfan, S.; et al. Validation of the Arabic Version of General Medication Adherence Scale (GMAS) in Sudanese Patients with Diabetes Mellitus. Risk Manag. Healthc. Policy 2021, 14, 4235–4241. [Google Scholar] [CrossRef]
- Aithal, A.; Aithal, P. Development and Validation of Survey Questionnaire & Experimental Data—A Systematical Review-based Statistical Approach. Int. J. Manag. Technol. Soc. Sci. 2020, 5, 233–251. [Google Scholar]
- Ohsato, A.; Seki, N.; Nguyen, T.T.T.; Moross, J.; Sunaga, M.; Kabasawa, Y.; Kinoshita, A.; Morio, I. Evaluating e-learning on an international scale: An audit of computer simulation learning materials in the field of dentistry. J. Dent. Sci. 2022, 17, 535–544. [Google Scholar] [CrossRef]
- Pallant, J. SPSS Survival Manual: A Step by Step Guide to Data Analysis Using SPSS; Routledge: London, UK, 2010. [Google Scholar]
- Shrestha, N. Factor analysis as a tool for survey analysis. Am. J. Appl. Math. Stat. 2021, 9, 4–11. [Google Scholar] [CrossRef]
- Ahmad, T. Teaching evaluation and student response rate. PSU Res. Rev. 2018, 2, 206–211. [Google Scholar] [CrossRef]
- Singh, A.; Singh, R. Effect of type of schooling and gender on sociability and shyness among students. Ind. Psychiatry J. 2017, 26, 77–81. [Google Scholar] [CrossRef] [PubMed]
- Middleditch, P.; Moindrot, W. Using classroom response systems for creative interaction and engagement with students. Cogent Econ. Financ. 2015, 3, 1119368. [Google Scholar] [CrossRef]
- Salemi, M.K. Clickenomics: Using a classroom response system to increase student engagement in a large-enrollment principles of economics course. J. Econ. Educ. 2009, 40, 385–404. [Google Scholar] [CrossRef]
- Ghosh, S.; Renna, F. Using electronic response systems in economics classes. J. Econ. Educ. 2009, 40, 354–365. [Google Scholar] [CrossRef]
- Bordes, S.J., Jr.; Gandhi, J.; Bauer, B.; Protas, M.; Solomon, N.; Bogdan, L.; Brummund, D.; Bass, B.; Clunes, M.; Murray, I.V.J. Using lectures to identify student misconceptions: A study on the paradoxical effects of hyperkalemia on vascular smooth muscle. Adv. Physiol. Educ. 2020, 44, 15–20. [Google Scholar] [CrossRef] [PubMed]
- Bouw, J.W.; Gupta, V.; Hincapie, A.L. Assessment of students’ satisfaction with a student-led team-based learning course. J. Educ. Eval. Health Prof. 2015, 12, 1–12. [Google Scholar] [CrossRef]

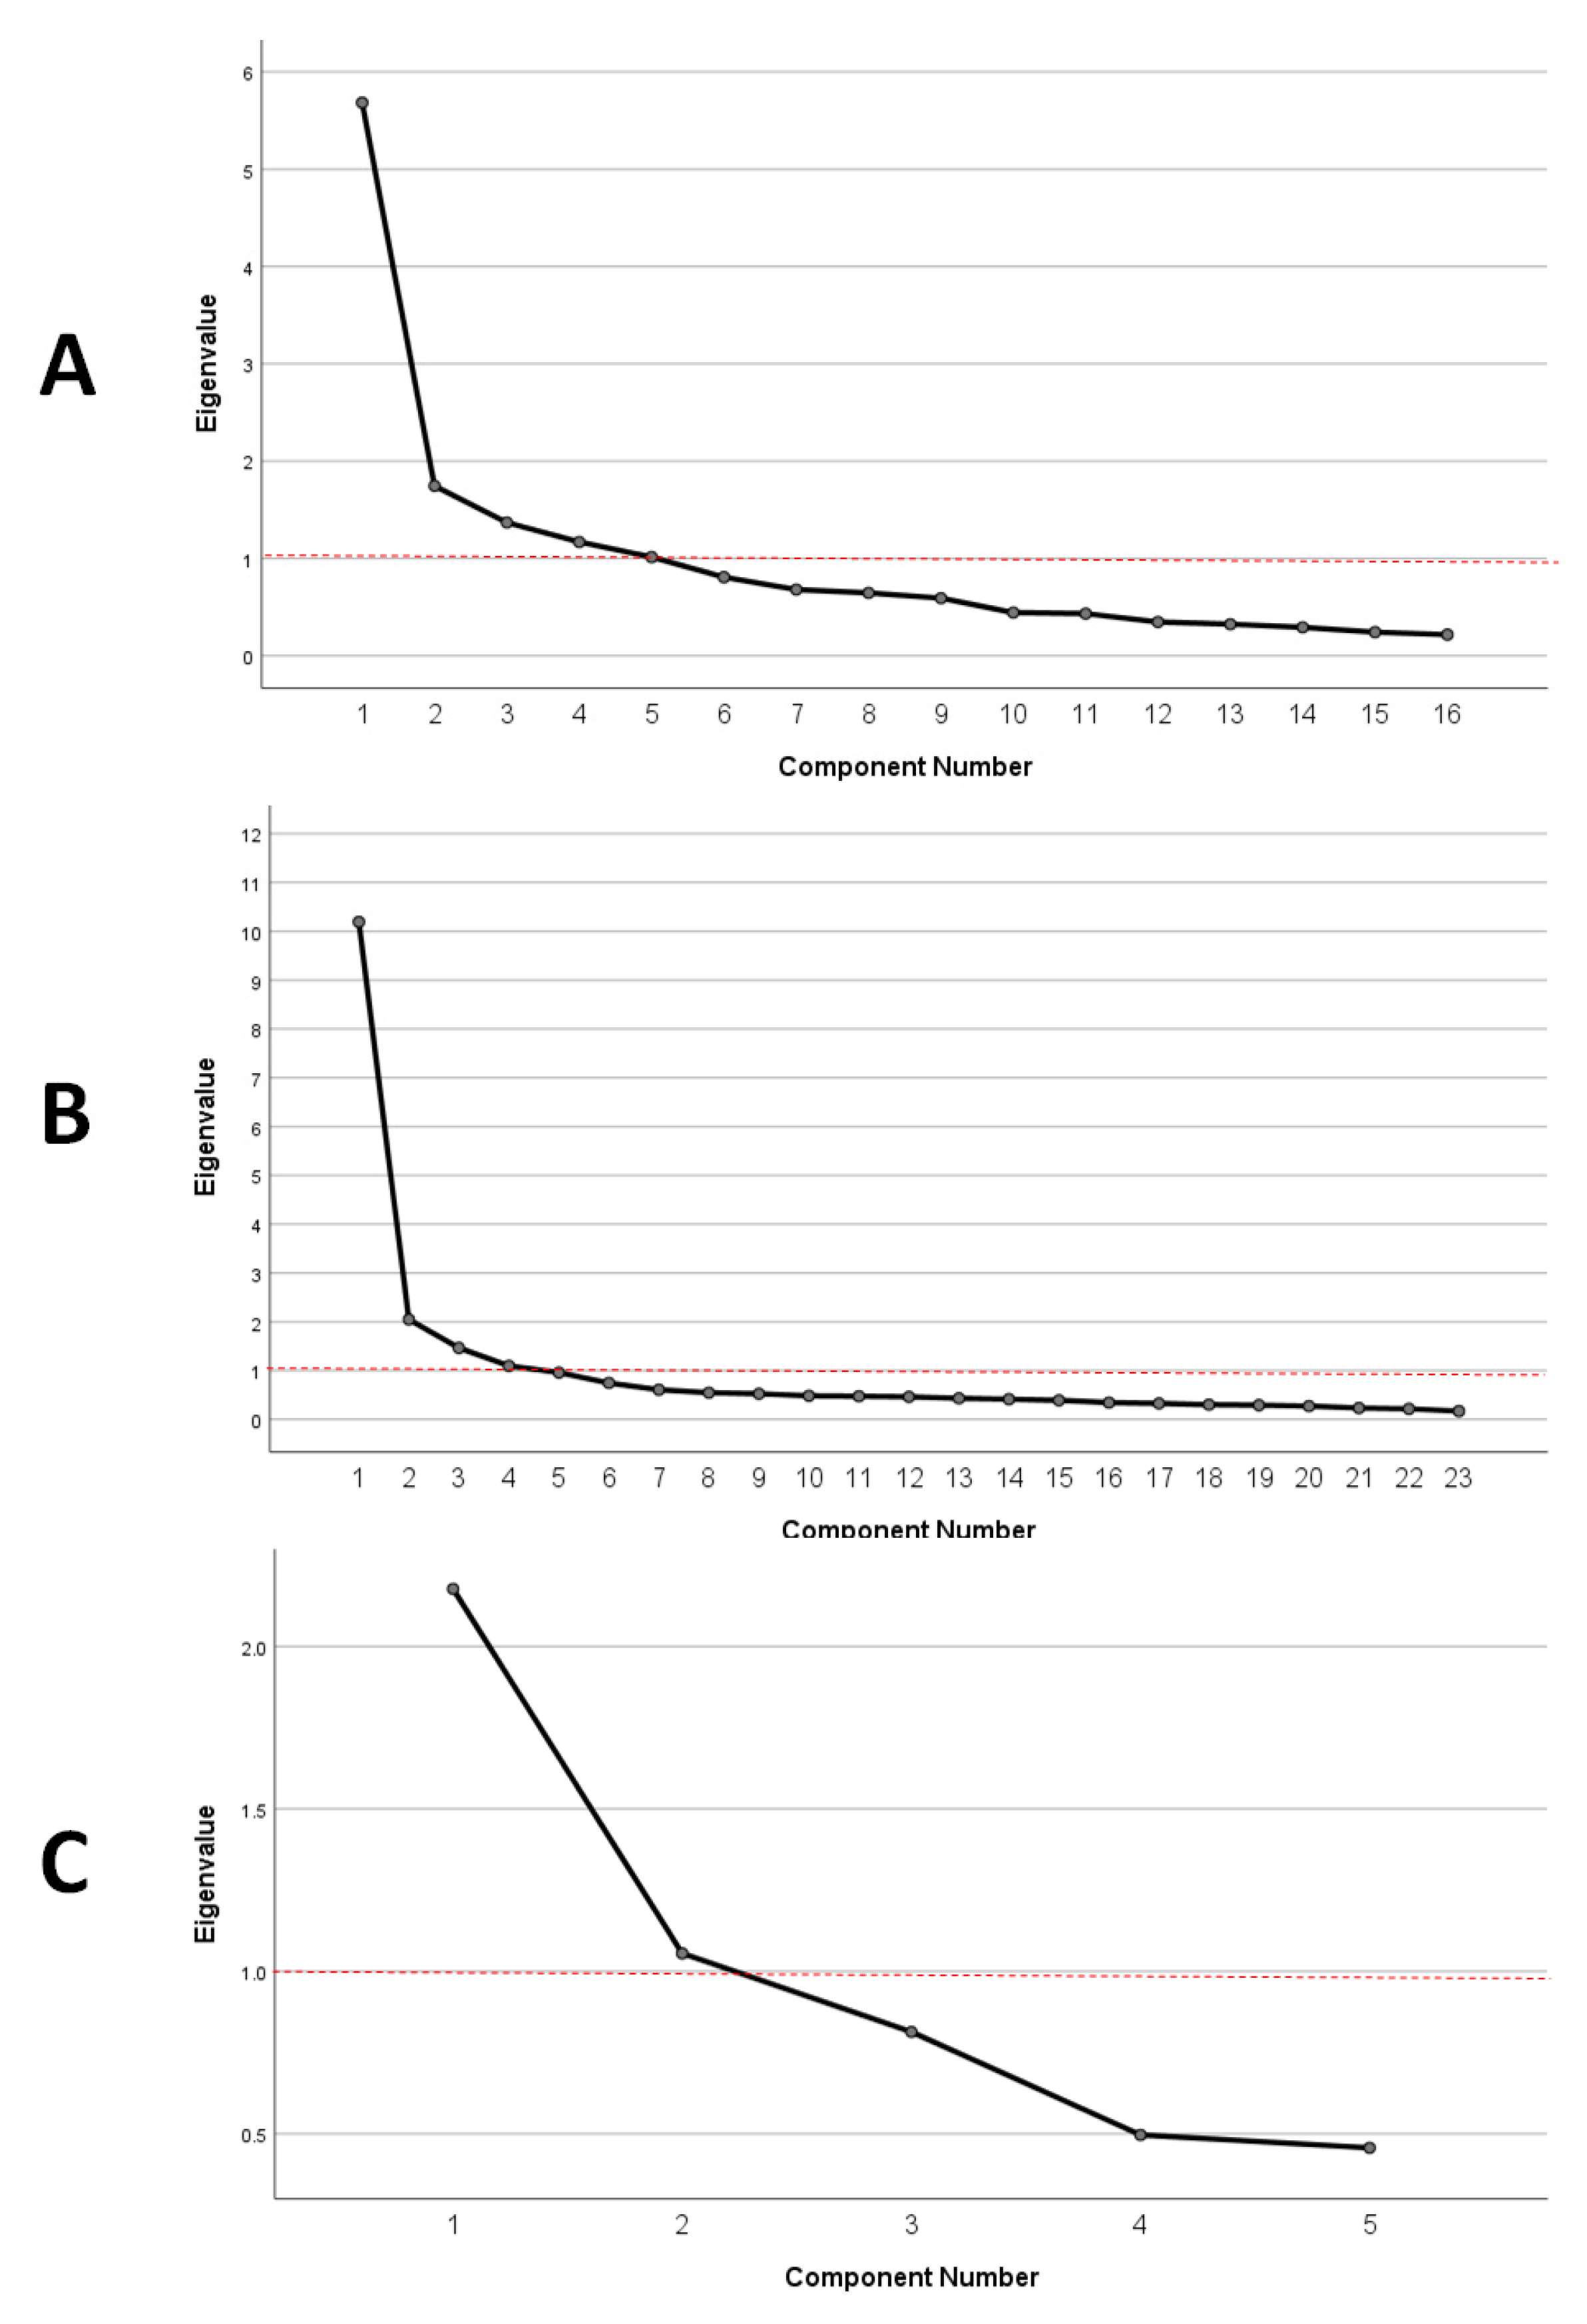
| Questionnaire | Faculty (FQ1–FQ16) | Student (SQ1–SQ23) | Student (SQ25–SQ29) | |
|---|---|---|---|---|
| Kaiser–Meyer–Olkin Measure of Sampling Adequacy. | 0.826 | 0.955 | 0.644 | |
| Bartlett’s Test of Sphericity | Approx. Chi-Square | 978.7 | 48,504.8 | 3503.3 |
| df | 120 | 253 | 10 | |
| Sig. | 0.000 | 0.000 | 0.000 | |
| Respondents | Questionnaire Dimensions | Dimension Items | No. of Valid Responses | No. of Items | Cronbach’s Alpha | Item Means |
|---|---|---|---|---|---|---|
| Faculty members | F-D1 | FQ1–FQ3 | 151 | 3 | 0.781 | 4.581 |
| F-D2 | FQ4–FQ6 and FQ12 | 151 | 4 | 0.673 | 4.682 | |
| F-D3 | FQ10–FQ11 | 151 | 2 | 0.755 | 3.755 | |
| F-D4 | FQ7–FQ8 | 292 | 2 | 0.715 | 4.616 | |
| F-D5 | FQ9,FQ13–FQ16 | 151 | 5 | 0.789 | 4.746 | |
| Students | S-D1 | SQ1–SQ3 | 7526 | 3 | 0.700 | 4.684 |
| S-D2 | SQ4–SQ10 | 7526 | 7 | 0.871 | 4.334 | |
| S-D3 | SQ11–SQ15 | 3437 | 5 | 0.898 | 3.933 | |
| S-D4 | SQ19–SQ20 | 3437 | 2 | 0.730 | 4.793 | |
| S-D5 | SQ25–SQ29 | 4089 | 5 | 0.671 | 3.599 | |
| S-D6 | SQ16–SQ18, SQ21–SQ23 | 3437 | 6 | 0.916 | 4.501 |
| Respondents | Overall Satisfaction Score (OSS) (Mean ± SD) | Independent Variables | ANOVA (p-Value) | Summary of the Important Findings of Post-Hoc (LSD) Tests |
|---|---|---|---|---|
| Faculty | 4.5 ± 0.5 | Semester | 0.446 | No significant differences among all semesters |
| Discipline | 0.059 | Faculty in science colleges showed significantly (p < 0.05) higher OSS compared to humanities/community. | ||
| Academic rank | 0.006 | Each of Prof. and associate prof. showed significantly (p < 0.05) higher OSS compared to other academic ranks. | ||
| Gender | 0.584 | No significant difference between males and females | ||
| Students | 4.3 ± 0.7 | Semester | <0.0001 | Each of the semesters (Fall 2016, Spring 2017, Fall 2017, and Spring 2018) showed significantly (p < 0.05) higher OSS compared to each of the subsequent semesters (Fall 2018–Fall 2019). |
| Discipline | <0.0001 | Students in humanities/community showed significantly (p < 0.05) higher OSS compared to science and health colleges. | ||
| Gender | <0.0001 | Female students showed significantly (p < 0.05) higher OSS compared to male students |
| Question | Total Number of Responses | Data Presentation | Invalid | Little Valid | I Do Not Know | Moderately Valid | Highly Valid | Mean | SD |
|---|---|---|---|---|---|---|---|---|---|
| 1 | 2 | 3 | 4 | 5 | |||||
| FQ1. The SRS operation system was technically easy | 151 | Responses (n) | 3 | 4 | 0 | 42 | 102 | 4.56 | 0.805 |
| Responses (%) | 2.0 | 2.6 | 0 | 27.8 | 67.5 | ||||
| FQ2. Using SRSs’ manual was clear | 151 | Responses (n) | 1 | 4 | 0 | 28 | 118 | 4.71 | 0.669 |
| Responses (%) | 0.7 | 2.6 | 0.0 | 18.5 | 78.1 | ||||
| FQ3. There were no problems in using the SRS device or the receiver during class | 292 | Responses (n) | 11 | 34 | 0 | 102 | 145 | 4.15 | 1.133 |
| Responses (%) | 3.8 | 11.6 | 0.0 | 34.9 | 49.7 |
| Question | N | Data Presentation | Invalid | Little Valid | I Do Not Know | Moderately Valid | Highly Valid | Mean | SD |
|---|---|---|---|---|---|---|---|---|---|
| 1 | 2 | 3 | 4 | 5 | |||||
| SQ1. The SRS operation system was technically easy | 7526 | Responses (n) | 85 | 178 | 84 | 1298 | 5881 | 4.69 | 0.72 |
| Responses (%) | 1.1 | 2.4 | 1.1 | 17.2 | 78.1 | ||||
| SQ2. Using SRSs’ manual was clear | 7526 | Responses (n) | 45 | 75 | 45 | 735 | 6626 | 4.84 | 0.53 |
| Responses (%) | 0.6 | 1.0 | 0.6 | 9.8 | 88.0 | ||||
| SQ3. There were no problems in using the SRS device or the receiver during class | 7526 | Responses (n) | 220 | 371 | 72 | 1438 | 5425 | 4.52 | 0.96 |
| Responses (%) | 2.9 | 4.9 | 1.0 | 19.1 | 72.1 |
| Question | N | Data Presentation | Invalid | Little Valid | I Do Not Know | Moderately Valid | Highly Valid | Mean | SD |
|---|---|---|---|---|---|---|---|---|---|
| 1 | 2 | 3 | 4 | 5 | |||||
| FQ4. Using SRS encouraged students to think more during class | 151 | Responses (n) | 0 | 1 | 1 | 44 | 105 | 4.68 | 0.523 |
| Responses (%) | 0.0 | 0.7 | 0.7 | 29.1 | 69.5 | ||||
| FQ5. Using SRS encouraged students to focus and pay more attention during class | 292 | Responses (n) | 2 | 4 | 3 | 64 | 219 | 4.69 | 0.632 |
| Responses (%) | 0.7 | 1.4 | 1.0 | 21.9 | 75.0 | ||||
| FQ6. Using SRS encouraged students to answer questions during class with no hesitation or fear of wrong answers | 151 | Responses (n) | 1 | 2 | 6 | 29 | 113 | 4.66 | 0.682 |
| Responses (%) | 0.7 | 1.3 | 4.0 | 19.2 | 74.8 | ||||
| FQ12. SRS increased student’s participation during class | 292 | Responses (n) | 3 | 2 | 3 | 41 | 243 | 4.78 | 0.599 |
| Responses (%) | 1.0 | 0.7 | 1.0 | 14.0 | 83.2 |
| Question | N | Data Presentation | Invalid | Little Valid | I Do Not Know | Moderately Valid | Highly Valid | Mean | SD |
|---|---|---|---|---|---|---|---|---|---|
| 1 | 2 | 3 | 4 | 5 | |||||
| SQ4. Using SRS showed me the level of my understanding of the scientific material during the lecture | 7526 | Responses (n) | 261 | 434 | 123 | 2031 | 4677 | 4.39 | 1.02 |
| Responses (%) | 3.5 | 5.8 | 1.6 | 27.0 | 62.1 | ||||
| SQ5. Using SRS stimulated me to think and analyze during the lecture | 7526 | Responses (n) | 299 | 442 | 116 | 1690 | 4979 | 4.41 | 1.05 |
| Responses (%) | 4.0 | 5.9 | 1.5 | 22.5 | 66.2 | ||||
| SQ6. Using SRS helped me identify my weaknesses and misperceptions | 7526 | Responses (n) | 512 | 723 | 231 | 2002 | 4058 | 4.11 | 1.25 |
| Responses (%) | 6.8 | 9.6 | 3.1 | 26.6 | 53.9 | ||||
| SQ7. Using SRS encouraged me to focus more during the lecture | 7526 | Responses (n) | 312 | 450 | 98 | 1625 | 5041 | 4.41 | 1.06 |
| Responses (%) | 4.1 | 6.0 | 1.3 | 21.6 | 67.0 | ||||
| SQ8. Using SRS encouraged me to answer questions during class with no hesitation or fear of wrong answers | 7526 | Responses (n) | 419 | 480 | 123 | 1691 | 4813 | 4.33 | 1.14 |
| Responses (%) | 5.6 | 6.4 | 1.6 | 22.5 | 64.0 | ||||
| SQ9. Using SRS helped me know my level compared to my colleagues | 7526 | Responses (n) | 412 | 567 | 228 | 1778 | 4541 | 4.26 | 1.17 |
| Responses (%) | 5.5 | 7.5 | 3.0 | 23.6 | 60.3 | ||||
| SQ10. SRS increased the chances of discussion effectively during the lecture | 7526 | Responses (n) | 299 | 414 | 152 | 1563 | 5098 | 4.43 | 1.05 |
| Responses (%) | 4.0 | 5.5 | 2.0 | 20.8 | 67.7 |
| Question | N | Data Presentation | Invalid | Little Valid | I Do Not Know | Moderately Valid | Highly Valid | Mean | SD |
|---|---|---|---|---|---|---|---|---|---|
| 1 | 2 | 3 | 4 | 5 | |||||
| FQ10. SRS increased the number of student’s attendance | 151 | Responses (n) | 9 | 12 | 33 | 48 | 49 | 3.77 | 1.163 |
| Responses (%) | 6.0 | 7.9 | 21.9 | 31.8 | 32.5 | ||||
| FQ11. SRS increased student’s intention to prepare for class | 151 | Responses (n) | 9 | 18 | 16 | 68 | 40 | 3.74 | 1.152 |
| Responses (%) | 6.0 | 11.9 | 10.6 | 45.0 | 26.5 |
| Question | N | Data Presentation | Invalid | Little Valid | I Do Not Know | Moderately Valid | Highly Valid | Mean | SD |
|---|---|---|---|---|---|---|---|---|---|
| 1 | 2 | 3 | 4 | 5 | |||||
| SQ11. Using SRS contributed to improving my understanding of the scientific material | 7526 | Responses (n) | 358 | 571 | 124 | 2238 | 4235 | 4.25 | 1.12 |
| Responses (%) | 4.8 | 7.6 | 1.6 | 29.7 | 56.3 | ||||
| SQ12. Using SRS contributed to enhancing my academic achievement in the course | 7526 | Responses (n) | 791 | 824 | 324 | 2180 | 3407 | 3.88 | 1.37 |
| Responses (%) | 10.5 | 10.9 | 4.3 | 29.0 | 45.3 | ||||
| SQ13. Using SRS increased my enthusiasm for studying | 7526 | Responses (n) | 1213 | 930 | 232 | 1944 | 3207 | 3.66 | 1.51 |
| Responses (%) | 16.1 | 12.4 | 3.1 | 25.8 | 42.6 | ||||
| SQ14. Using SRS made me more eager to attend lectures | 3437 | Responses (n) | 434 | 311 | 84 | 764 | 1844 | 3.95 | 1.43 |
| Responses (%) | 12.6 | 9.0 | 2.4 | 22.2 | 53.7 | ||||
| SQ15. Using SRS increased my eagerness to prepare for the lecture | 7526 | Responses (n) | 1434 | 920 | 212 | 1845 | 3115 | 3.57 | 1.57 |
| Responses (%) | 19.1 | 12.2 | 2.8 | 24.5 | 41.4 |
| Question | N | Data Presentation | Invalid | Little Valid | I Do Not Know | Moderately Valid | Highly Valid | Mean | SD |
|---|---|---|---|---|---|---|---|---|---|
| 1 | 2 | 3 | 4 | 5 | |||||
| FQ7. SRS use helped me to find weak points of the students and their misunderstandings | 292 | Responses (n) | 5 | 11 | 2 | 89 | 185 | 4.50 | 0.835 |
| Responses (%) | 1.7 | 3.8 | 0.7 | 30.5 | 63.4 | ||||
| FQ8 SRS use displayed students’ comprehension level of the scientific material during class | 292 | Responses (n) | 3 | 3 | 1 | 55 | 230 | 4.73 | 0.624 |
| Responses (%) | 1.0 | 1.0 | 0.3 | 18.8 | 78.8 |
| Question | N | Data Presentation | Invalid | Little Valid | I Do Not Know | Moderately Valid | Highly Valid | Mean | SD |
|---|---|---|---|---|---|---|---|---|---|
| 1 | 2 | 3 | 4 | 5 | |||||
| SQ19. The performance of the faculty member in using SRS was appropriate | 3437 | Responses (n) | 30 | 69 | 22 | 367 | 2949 | 4.79 | 0.64 |
| Responses (%) | 0.9 | 2.0 | 0.6 | 10.7 | 85.8 | ||||
| SQ20. The faculty member was discussing the students’ answers to the questions | 7526 | Responses (n) | 96 | 145 | 71 | 812 | 6402 | 4.76 | 0.68 |
| Responses (%) | 1.3 | 1.9 | 0.9 | 10.8 | 85.1 | ||||
| Responses (%) | 40.2 | 4.1 | 12.2 | 9.6 | 33.9 |
| Question | N | Data Presentation | Invalid | Little Valid | I Do Not Know | Moderately Valid | Highly Valid | Mean | SD |
|---|---|---|---|---|---|---|---|---|---|
| 1 | 2 | 3 | 4 | 5 | |||||
| SQ25. The faculty member was using SRS to measure our tribal knowledge before the lecture started | 4089 | Responses (n) | 860 | 247 | 313 | 671 | 1998 | 3.66 | 1.61 |
| Responses (%) | 21.0 | 6.0 | 7.7 | 16.4 | 48.9 | ||||
| SQ26. The faculty member was using SRS to assess our understanding during the lecture | 4089 | Responses (n) | 536 | 173 | 136 | 541 | 2703 | 4.15 | 1.42 |
| Responses (%) | 13.1 | 4.2 | 3.3 | 13.2 | 66.1 | ||||
| SQ27. The faculty member was using SRS to assess our understanding at the end of the lecture | 4089 | Responses (n) | 338 | 171 | 125 | 567 | 2888 | 4.34 | 1.24 |
| Responses (%) | 8.3 | 4.2 | 3.1 | 13.9 | 70.6 | ||||
| SQ28. The faculty member was using SRS in exams | 4089 | Responses (n) | 1671 | 185 | 417 | 473 | 1343 | 2.91 | 1.76 |
| Responses (%) | 40.9 | 4.5 | 10.2 | 11.6 | 32.8 | ||||
| SQ29. The faculty member was using SRS to monitor attendance | 4089 | Responses (n) | 1642 | 167 | 498 | 394 | 1388 | 2.93 | 1.76 |
| Responses (%) | 40.2 | 4.1 | 12.2 | 9.6 | 33.9 |
| Question | N | Data Presentation | Invalid | Little Valid | I Do Not Know | Moderately Valid | Highly Valid | Mean | SD |
|---|---|---|---|---|---|---|---|---|---|
| 1 | 2 | 3 | 4 | 5 | |||||
| FQ9. SRS use enhanced my teaching strategy | 151 | Responses (n) | 3 | 3 | 1 | 40 | 104 | 4.58 | 0.786 |
| Responses (%) | 2.0 | 2.0 | 0.7 | 26.5 | 68.9 | ||||
| FQ13. Overall, using SRS made the lectures interesting and attractive | 151 | Responses (n) | 1 | 2 | 2 | 27 | 119 | 4.73 | 0.621 |
| Responses (%) | 0.7 | 1.3 | 1.3 | 17.9 | 78.8 | ||||
| FQ14. I want to continue using the SRS during the subsequent semesters | 151 | Responses (n) | 3 | 0 | 2 | 13 | 133 | 4.81 | 0.650 |
| Responses (%) | 2.0 | 0.0 | 1.3 | 8.6 | 88.1 | ||||
| FQ15. I recommend spreading the SRSs experience among colleges and departments | 151 | Responses (n) | 0 | 1 | 3 | 17 | 130 | 4.83 | 0.473 |
| Responses (%) | 0.0 | 0.7 | 2.0 | 11.3 | 86.1 | ||||
| FQ16. The advantages of SRS exceeded its problems and disadvantages | 151 | Responses (n) | 1 | 1 | 0 | 26 | 123 | 4.78 | 0.540 |
| Responses (%) | 0.7 | 0.7 | 0.0 | 17.2 | 81.5 |
| Question | N | Data Presentation | Invalid | Little Valid | I Do Not Know | Moderately Valid | Highly Valid | Mean | SD |
| 1 | 2 | 3 | 4 | 5 | |||||
| SQ16. I want to continue using the SRS during next coming semesters | 3437 | Responses (n) | 121 | 124 | 82 | 499 | 2611 | 4.56 | 0.97 |
| Responses (%) | 3.5 | 3.6 | 2.4 | 14.5 | 76.0 | ||||
| SQ17. The advantages of SRS exceed its problems and disadvantages | 3437 | Responses (n) | 91 | 129 | 95 | 656 | 2466 | 4.54 | 0.92 |
| Responses (%) | 2.6 | 3.8 | 2.8 | 19.1 | 71.7 | ||||
| SQ18. I recommend spreading the SRSs experience among college departments | 3437 | Responses (n) | 130 | 141 | 71 | 480 | 2615 | 4.54 | 0.99 |
| Responses (%) | 3.8 | 4.1 | 2.1 | 14.0 | 76.1 | ||||
| SQ21. Overall, using SRS made the lectures interesting and attractive | 3437 | Responses (n) | 76 | 120 | 38 | 586 | 2617 | 4.61 | 0.86 |
| Responses (%) | 2.2 | 3.5 | 1.1 | 17.0 | 76.1 | ||||
| SQ22. I want to use the device for the rest of the courses | 7526 | Responses (n) | 481 | 511 | 214 | 1314 | 5006 | 4.31 | 1.20 |
| Responses (%) | 6.4 | 6.8 | 2.8 | 17.5 | 66.5 | ||||
| SQ23. I prefer the courses that utilize SRSs over the others | 7526 | Responses (n) | 721 | 558 | 337 | 1509 | 4401 | 4.10 | 1.33 |
| Responses (%) | 9.6 | 7.4 | 4.5 | 20.1 | 58.5 | ||||
| Question | N | Data presentation | Never | Sometimes | Always | Mean | SD | ||
| 1 | 3 | 5 | |||||||
| SQ24. I talk to my classmates in other classes about our use of SRS in this course | 4089 | Responses (n) | 1079 | 1981 | 1029 | 2.98 | 1.44 | ||
| Responses (%) | 26.4 | 48.4 | 25.2 | ||||||
Publisher’s Note: MDPI stays neutral with regard to jurisdictional claims in published maps and institutional affiliations. |
© 2022 by the authors. Licensee MDPI, Basel, Switzerland. This article is an open access article distributed under the terms and conditions of the Creative Commons Attribution (CC BY) license (https://creativecommons.org/licenses/by/4.0/).
Share and Cite
Altwijri, O.; Alsadoon, E.; Shahba, A.A.-W.; Soufan, W.; Alkathiri, S. The Effect of Using “Student Response Systems (SRS)” on Faculty Performance and Student Interaction in the Classroom. Sustainability 2022, 14, 14957. https://doi.org/10.3390/su142214957
Altwijri O, Alsadoon E, Shahba AA-W, Soufan W, Alkathiri S. The Effect of Using “Student Response Systems (SRS)” on Faculty Performance and Student Interaction in the Classroom. Sustainability. 2022; 14(22):14957. https://doi.org/10.3390/su142214957
Chicago/Turabian StyleAltwijri, Omar, Elham Alsadoon, Ahmad Abdul-Wahhab Shahba, Walid Soufan, and Saud Alkathiri. 2022. "The Effect of Using “Student Response Systems (SRS)” on Faculty Performance and Student Interaction in the Classroom" Sustainability 14, no. 22: 14957. https://doi.org/10.3390/su142214957
APA StyleAltwijri, O., Alsadoon, E., Shahba, A. A.-W., Soufan, W., & Alkathiri, S. (2022). The Effect of Using “Student Response Systems (SRS)” on Faculty Performance and Student Interaction in the Classroom. Sustainability, 14(22), 14957. https://doi.org/10.3390/su142214957


