Article

Comprehensive Life Cycle Assessment Analysis of an Italian Composting Facility concerning Environmental Footprint Minimization and Renewable Energy Integration

Research Center for Energy, Environment and Landscape, Università Telematica eCampus, Via Isimbardi 10, 22060 Novedrate, Italy
*
Author to whom correspondence should be addressed.
Sustainability 2022, 14(22), 14961; https://doi.org/10.3390/su142214961
Submission received: 28 September 2022 / Revised: 14 October 2022 / Accepted: 10 November 2022 / Published: 11 November 2022
(This article belongs to the Special Issue Feature Papers in Energy Sustainability)

Abstract

:
The present paper aims to investigate the environmental impacts of a real municipal solid waste management facility operating in Italy including two power units, i.e., a combined heat and power system and an internal combustion engine, fed by the biogas produced from anaerobic digestion and waste disposal in sanitary landfill. The Life Cycle Assessment study is carried out in Simapro 9.1.1.7 and, in addition to the base case scenario, the implementation of additional renewable energy and circular economy solutions is evaluated. More precisely a PV plant on the roof of the anaerobic digesters section and the use of plastic and paper residues in a gasification process for additional heat and power production are considered. The main outcomes of the simulations demonstrate the following: (i) the benefits in terms of energy and fuel savings provided by the two power units; (ii) the environmental impact reduction due to the compost obtained from the anaerobic digestion of the organic waste as potential fertilizer; (iii) a potential power capacity of 2 MW through the gasification of the plastic and paper residues. With reference to the latter, despite bringing an increase of the carbon emissions (+48%) compared to the base case, it could contribute to reach higher environmental standards for MSW composting facilities.

1. Introduction

In the last few decades, the energy system has been subjected to significant changes driven by the growing diffusion of renewable energy technologies in many sectors. According to Puertas and Marti [1], an increase of about 46.7% in renewable electrical energy production was achieved in Europe in 2019 compared to 2010. Among the different renewable energy sources, biomass is expected to play a significant role in the near future because of its large diffusion worldwide and its capability in backing up intermittent energy sources. Indeed, biomass can be obtained from many sources: besides wood, other examples are agricultural and industrial residues or municipal solid waste (MSW). With respect to the latter, according to recent EU statistics [2] and the national ISPRA waste report 2021 [3], the average annual amount of MSW in Italy is estimated to be around 27 Mtons which corresponds to about 500 kg/person, and it is expected to increase in upcoming years. Hence, the huge potential of its recycling and reuse to reduce the related environmental impact is evident. Besides recycling, among the possible treatment solutions, waste-to-energy (WtE) plants represent a valuable option in many circumstances such as in the case of organic matter. Indeed, 30–33% of the annual municipal waste is recycled, 22–23% sent to composting facilities, 20% to WtE incinerator systems [3] and the residual fraction to final disposal at sanitary landfills. In the literature, there are many studies related to the techniques adopted in waste management, focusing on the potential benefits achievable by means of renewable energy integration. Anaerobic digestion, the biological conversion process that effectively converts wet organic wastes into raw biogas [4], is used worldwide, but there is still a vast difference in its adoption [5]. The process parameters that rule the extent of the reactions involved in the digestion require the provision of low temperature heat for the conversion of the organic waste to high-quality biogas, which is characterized by a remarkable lower heating value due to the dominant presence of the methane fraction [6]. The exploitation of the obtained biogas usually takes place in internal combustion engines (ICEs) for electricity generation or the combined heat and power (CHP) production. Hence, part of the thermal power produced by the CHP unit can be directly used in the anaerobic digestion reactors for the temperature control which is set within the range of 35–45 °C to establish a mesophilic regime inside [7]. According to Terna [8], the installation of ICEs/CHP units fed with biomass-related resources in Italy has exceeded 4 GW corresponding to almost 7% of the total renewable energy capacity (58 GW) of the country. In addition, in waste management facilities the residual fraction of MSW (RMSW), i.e., the net non-perishable waste material after recycling, is sometimes valorized with high-temperature thermal treatments for energy generation. Despite the significant role of the logistic involved in a prudent end-of-life governance, little conception about the environmental impacts of the waste management policies is generally shared among the population. Waste treatment facilities like composting sites [9], landfills or incinerator plants can be successfully investigated using a Life Cycle Assessment (LCA) approach. For example, Khandelwal et al. [10] analyzed a series of LCA investigations on the multiple solutions for WtE management solutions. With reference to incineration, the work of Morselli et al. [11] showed the positive contribution of the energy generation despite the potential harmful pollutants for human health released into the environment. Broadly speaking, LCA is a widely known holistic methodology that assesses the environmental footprint through the entire life of the product investigated, from its manufacturing to disposal. The LCA has four major steps: goal and scope, Life Cycle Inventory (LCI), Life Cycle Impact Assessment (LCIA) and an interpretation phase on the results obtained. These steps present an iterative framework in which many assumptions are revised, especially for background data in the LCI. The outcome of an LCA study has multiple benefits. Firstly, LCIA is able to identify the major burdens on the system, such as sources of intensive material and energy usage or process inefficiencies. Secondly, once the target is defined, appropriate actions may be evaluated as alternative scenarios of the base case. Indeed, LCA can support policymakers in planning optimal measures. The burden-shifting issue, always discussed in a LCA analysis, is a statement about the side implications of plausible solutions in an environmental concern. This is the reason why appropriate analyses need to focus on the consistency of the data, the uncertainty quantification and the sensitivity scenarios [12]. Indeed, when a comparison between different treatment systems is performed, critical aspects may arise, and sensitivity studies are recommended. For example, Fruergard et al. [13] expressed the performance of different solution for WtE recovery systems in a comparative study. Incineration with energy recovery can be used both for residual waste and organic waste in Denmark when appropriate flue gas cleaning is sought. Grosso et al. [14], instead, highlighted the importance of the implementation of anaerobic digestion beside the existing WtE systems, quantified in a maximum potential environmental improvement of +37%. Güereca et al. [15] quantified the impact reduction of biowaste with respect to traditional landfilling. Cusenza et al. [16] assessed the impacts concerning the residual waste from the agro–food industry in Sicily, when energy recovery from biomass-based wastes is achieved. According to their study, a reduction of 66% in climate change emissions can be reached with the utilization of a CHP unit. Buttol et al. [17] investigated the district of Bologna, using the LCA as a decision-supporting tool for local authorities, highlighting the importance of LCA in developing a sustainable path for waste valorization. The same outcome is discussed in other studies [13,18,19]. In particular, Fantin et al. [20] reported the environmental impact of an anaerobic digestion plant integrating the energy recovery from the biogas conversion according to ISO standards 14040 [21]. The outcomes of the investigation expressed a positive reduction of emissions which are responsible of global warming and acidification during the entire life of the plant. Starr et al. [22] investigated the avoided impact of different advanced biogas upgrading techniques, such as chemical/amine scrubbing and bottom-ash recovering, showing that the latter is the most environmentally efficient. Eventually, Blengini et al. [23] and Cadena et al. [24] applied the same approach to aerobic composting facilities located in Italy and Spain, respectively. Both highlighted the importance of the collecting mechanism, the avoided products such as recovered materials and fertilizers and the characterization of the waste input. In fact, the impact of the landfills are successfully analyzed [25,26,27] with the same flexible methodology that LCA can offer. In particular, Sauve et al. [25] reported a footprint perspective about MSW landfills in Europe. A proper energy recovery may result in a reduction of the impact categories by up to 20–40%. In [26], Lee et al. quantified the green-house gas (GHG) emissions from a typical sanitary landfill, highlighting the impact of the methane as the main harmful gas produced by these waste treatments. Damgaard et al. [27], instead, focused also on the impact of the leaches produced in a landfill on groundwaters in a long-term timeframe.
Despite the large amount of studies in the field, several intrinsic issues arise for the development of a clear green framework: data uncertainties [28], emission quantification related to specific timeframes [29,30] and background system modelling [31]. Geography influence is a critical aspect, too [10], with different LCA studies accomplished more often in Europe and Asia [32,33]. Nevertheless, to the best of the authors’ knowledge there are not any comprehensive paper addressing the impacts of an integrated MSW landfill and evaluating specific scenarios related to the implementation of renewable energy technologies and circular economy measures.
Hence, in this paper the LCA approach is applied to an integrated composting facility in Italy, coupled with an anaerobic digestion plant of the organic matter from municipal solid waste (OFMSW) and a sanitary landfill. In particular, the main novelties of the work rely on the following: (i) the comparative scenarios analysis for the environmental impact reduction of a MSW site; (ii) the photovoltaic integration in the site; (iii) the environmental impact analysis of plastic and paper residues use in the gasification process.

2. Materials and Methods

2.1. System Description

The system under investigation is in the countryside of an Italian Municipality. The system is designed for the treatment of 100,000 metric tons per year of MSW, including both OFMSW and residual MSW. The construction of the composting section was completed in 2018, and, after a preliminary assessment phase for its start-up, it became fully operative in 2019. During the first period of the pandemic, the capacity of the facility was saturated due to the increased amount of waste to be processed, mainly because of the temporary closure of other treatment facilities nearby, affecting the related quality of the produced biogas as later discussed.
Different functional areas characterize the site as shown in Figure 1: (i) the mechanical-biological treatment (MBT) unit, where materials from unrecyclable MSW, such as fermentable organic matter, scrap metals, glass and bulk debris, are recovered; (ii) the anaerobic digesters operating in mesophilic regime; (iii) a CHP unit for 700 kWe/400 kWt production at full load; (iv) the aerobic stabilization section for the compost production, mainly obtained by the refinement of the digestate produced; (v) a volumetric dome for biogas storage and combustion flare for safety and quality control; (vi) an air treatment section, represented by six scrubbers and a biofiltration unit for air treatment; (vii) the sanitary landfill for the disposal of the residual MSW, either from MBT or external supply; and (viii) an ICE unit fed with the biogas produced in the sanitary landfill with nominal power capacity of 250 kWe. It is worth noting that the electrical energy produced by the CHP unit is almost entirely self-consumed in the air treatment process which is by far the most energy intensive process in the site. On the contrary, the entire energy output produced at the landfill ICE is sent to the grid.
The incoming 100 ktons of annual waste are treated as follows: more than 50 ktons/years of residual MSW, produced by external treatment facilities, are directly sent to the sanitary landfill, while almost 50 ktons/year are sent to the composting facility and the MBT-composting section. The heterogenous residual wastes produced in these units are sent to the landfill as well, for an annual volume of 30 ktons, of which 11 ktons are low quality compost (LQC). Hence, the overall amount of residual waste landfilled is 80 ktons/year, while the amount of high-quality compost (HQC) sold in the market is about 2 ktons/year. The main advantage brought by the MBT process is the reduction of the landfilled material and the avoided GHG emissions that inevitably arise in a typical incinerator system. Figure 2 depicts the general influence of such a unit in the composting process. The machineries used in the separation compel an increase of the commodities consumption (water, energy, fuel), but also an enhancement of the compost and biogas production. Furthermore, the residual solid waste material may be used in the production of refuse-derived fuels (RDF) [34,35], a solid pellet-like material used in energy-intensive applications (blast furnaces, clinker production, steel manufacturing). RDF production is also a suitable path for the reduction of landfilled materials, and the plausible implementation in the system is justified by the 19 ktons/year of RMSW produced in the MBT unit that, in the actual scenario, exerts a faster exploitation of the available capacity of the sanitary landfill.

2.2. Goal and Scope

The goal of the present environmental analysis is twofold: to give an objective quantification of the real performances of the entire site during its current operability; to provide an evaluation of the environmental impact in the case of additional renewable energy and circular economy solutions being implemented. According to ISO standard, these goals fall in the “A” category, where the evaluation of the primary energy consumption and the carbon footprint of the product/process is requested. This was done with a balance of the emissions and the benefits highlighted in the system. The emissions, either liquid (wastewaters and leachates), gaseous (flue gases of generator units) or solids (pollutants present in the compost) were obtained from primary data. Similar approach has been followed for the energy production. On the contrary, the benefits brought by the composting facility in terms of avoided fertilizer production and metal recovery are taken from background data. The functional unit assumed for the LCA is equal to 1 ton of waste treated by the system which is commonly used in different environmental analyses [10,36,37]. Hence, different LCA analyses were carried out for a complete comprehension of the impacts as follows:
  • The assessment of the environmental performances of the base case configuration and the sensitivity analyses of relevant operational parameters by means of the Monte–Carlo technique (MC);
  • The comparison between the impacts of the aforementioned system with those of a general sanitary landfill present in Ecoinvent database as benchmark;
  • A sensitivity analysis for the determination of the benefits introduced by the CHP unit coupled with the anaerobic digesters;
  • The installation of a PV plant on the roof of the anaerobic digesters section. A Monte Carlo analysis is also performed in this case to estimate the influence of the data deviation;
  • The environmental impact generated by the gasification of the residual solid waste and its comparison with secondary data related to incineration and landfill treatment processes as reported in Ecoinvent database.

2.3. System Boundaries

In this work, the LCA study was conducted according to the methodology described in the ISO standard 14044 [21]. A gate-to-grave approach [13] has been used in the description of the system as also showed in Figure 3. In the literature, different studies included also the contribution of waste collection and transport [36,38,39], which here has not been included. Indeed, the present study aims for the quantification of the direct emissions of the treatment facility thus considering only the fuel consumption within its boundaries.
The system has been characterized by different sub-processes linked together. As previously stated, the annual input of the system is more than 100 ktons/year of solid waste, split in two main input flows. An average amount of 48 ktons/year of waste enters the composting section, while the second stream of 56 ktons/year is directly sent to the landfill. As a primary step, the MBT unit refines the MSW to separate further the OFMSW, which is later sent to anaerobic digestion and compost production. The amount of residual waste produced by the MBT unit and landfilled is around 19 ktons/year. The composting section produces HQC for a total of 2 ktons/year, 12 ktons/year of LQC to be used in landfill covering, 9.4 ktons/year of digester sludge, 750 tons/year of biogas, 233 tons of recovered scrap metals and 4.6 ktons/year of liquid wastewaters. Therefore, 87 ktons/year (56 + 19 + 12) of total waste material are conveyed to the sanitary landfill in a heterogeneous mixture of residual MSW.

2.4. Inventory Analysis

The system was modelled by relying on the primary data provided by the company and others from the Ecoinvent database—more precisely, whenever possible data have been annually averaged, according to the energy, material and emissions registered in the period from 2019 to 2021. Secondary data are taken from EcoInvent version 3.6 database [40,41]. The simulations were run with Simapro v. 9.1.1.8. CML-IA baseline impact method [42] of the Institute of Environmental Sciences (CML); it was chosen in the LCIA, since it has been commonly used in several studies [14,36,43,44]. The material and energy flows have been modelled according to Figure 3. Different emissions points were considered in the site, varying from liquid to gaseous ones. Liquid emissions are relevant to wastewater, mainly produced in the composting section and from landfill leachates. Gaseous emissions, instead, concern mainly the air treatment unit. Six scrubbers extract air from the MBT, the digesters and the compost stabilization section to avoid overpressure and odour leakages into the environment. Other gaseous emission points are the CHP and ICE sub-sections, where flue gas is constantly checked for law regulations. The pollutants such metals present in the high-quality compost are assumed as soil emissions.

2.4.1. Residual Solid Waste Characterization

The most important feature of the composting facility is the MBT unit. The municipal solid waste is shredded and sorted. Organic fraction is separated, too, and is sent to stabilisation and composting together with the OFMSW. The residual matter is an heterogenous mixture of different materials, such as plastics, paper and textile, with minor presence of metals and glass. According to a series of analyses commissioned between 2019 and 2021, the average composition of the treated waste had 45% of unrecovered plastics, 27% of paper and cardboard, 13% of textiles, 5% of diapers, 4% of leather and the leftover of other materials.

2.4.2. Energy Production and Biogas Profile

Table 1 reports the main performance data of the CHP unit with load variation. As concerns the ICE unit, only the nominal power (250 kW) is known; no further data are available beside the energy production.
The monthly-averaged annual production of biogas from the anaerobic digestion is 612,350 m3 (around 64 tons) plus 218,052 m3 (15 tons) sent to flare. The related electricity production is about 961,881 kWh mainly used for self-consumption. The biogas produced at the landfill, instead, is equal to 970,228 m3 (98.5 tons) which is converted to 1,264,968 kWh of electric energy.

2.4.3. Electricity and Fuel Consumption

The equipment used in the process require a consistent amount of energy. The ratio of the CHP electric generation to the system energy intake ranges from 3.5% (worst case) to 52% (best case), with a monthly average equal to 21%. This value has been used in the evaluation of the energy required by the system, i.e., 4.5 GWh. Table 2 reports the distribution of the energy consumption in the relevant sub-systems of the site.
Diesel and Liquid Petrol Gas (LPG) are used in the process as well. LPG, however, is designated to office heating only, and the quantity is negligible (1.76 tons) compared to the annual diesel consumption: 200 m3/year for machinery operations (internal movement, shredding, digestate mixing, company vehicles) and 35 m3/year for anaerobic digestion in a back-up boiler. The thermal power generated by the CHP unit involved a 37% reduction of the diesel consumption required by the anaerobic digestion. Despite the positive outcome in terms of fuel savings, the CHP operates at partial load. Primary data on instantaneous operability, e.g., on CHP and biogas storage, is not given, and only a qualitative assumption of continuous operation has been formulated. In this context, it has been estimated that the electrical efficiency ranges from a minimum value of 0.22 to a maximum of 0.34, lower than the efficiency of 50% load. The characterization of the energy commodity has been done according to the data of the municipality [8] where the facility was built.

2.4.4. Gaseous Emissions

Gaseous emissions come mainly from the biofilter, CHP and ICE units as reported in Table 3. The specific values are then multiplied according to the annual production of biogas as reported in Section 2.4.2.
A simplified chemical approach has been used in the quantification of the CO2 obtained from the combustion of the methane fraction of the biogas. Since such emission comes from a renewable source, these compounds have been set as biogenic source [45]. The following reaction (R1) implies the determination of CO2 and water after methane combustion in the CHP and ICE once the biogas composition is known.
CH 4 g + 2 O 2 g CO 2 g + 2 H 2 O g ,
The data given by the company does not specify a clear composition of the biogas from the landfill and the anaerobic digestion. According to previous studies [16,26,46,47,48], a typical composition of biogas may have 50–60% of methane content and the residual fraction of carbon dioxide. In this study, the composition has been reconstructed based on the values of the biogas net volume and mass, i.e., V [Nm3] and M [kg], its density ρ [kg/m3] and the monthly-averaged energy production from the CHP and ICE, E. The mass balance is easily obtained according to Equation (1), where subscript I either stands for Anaerobic Digestion (AD) and Landfilling (LF) and ρ is expressed at the normal conditions (0.72 kg/m3 for methane and 1.87 kg/m3 for carbon dioxide), while other minor elements like nitrogen and oxygen are neglected:
M i = ρ CO 2 , i V CO 2 , i + ρ CH 4 , i V CH 4 , i
The average biogas yield, α i [kWh/m3] can be defined as the ratio of the total energy produced, E [kWh], and the total volume of biogas V produced, reduced by the biogas sent to flares. With some manipulation, Equation (2) is obtained and can be used for methane estimation and carbon dioxide content derivation.
V CH 4 , i = ρ CO 2 , i E i α i M i α i ρ CO 2 , i ρ CH 4 , i

2.4.5. Liquid Emissions

Similarly to the airborne pollutants, the leachate and wastewater compositions have been considered as the main liquid emissions of the system. On average, 11,000 m3 of leachates and 4600 m3 of wastewater are sent to external treatment plants. Table 4 reports the basic composition of such liquid emissions.

2.4.6. Soil Emissions

Soil emissions are assessed according to the composition of the HQC multiplied by the annual production (2082 tons). The nitrogen content of the compost is around 95% on a dry basis (d.b.). Further details about compost composition are reported in Table 5.

2.5. Impact Categories and Life Cycle Impact Assessment

The overall goal of a LCA study is the impact assessment on the basis of a specific characterization method. According to CML-IA baseline V3.06 methodology, eleven impact categories are defined as midpoint indicators: Abiotic Depletion (AB) [kg Sbeq], Abiotic Depletion from fossil fuels (ABFF) [MJ], Global Warming Potential (GWP) [kg CO2eq], Ozone layer Depletion (ODP) [kg CFC-11eq], Human Toxicity (HT) [kg 1,4-dBeq], Fresh–Marine water Ecotox (FW-MWEX) [kg 1,4-dBeq], Terrestrial Ecotox (TREX) [kg 1,4-dBeq], Photochemical Oxidation (PHOX) [kg C2H4eq], Acidification (AC) [kg SO2eq] and Eutrophication (EU) [kg PO4eq]. The normalization of the previous scores is usually done according to specific weights, generally site-specific. Some of these midpoint indicators are present in other studies [20,23,24,44] where the interpretation of the analyses is based upon GWP, ODP, AC, EU, PHOX and HT. In this study, the set of normalization factors related to EU-25 zone has been used. The aggregation of the normalized impacts to an endpoint indicator of the system has not been expressed.

3. Results and Discussions

The results of the LCA analyses have been reported in this section. First, the study of the base case scenario is obtained from inventory data. The results obtained from the simulation are supported by a set of three auxiliary investigations that assess a sensitivity scenario, a comparison with a sanitary landfill depicted by secondary data available in Ecoinvent and a quantification of the data uncertainty with the Monte–Carlo method, implemented in Simapro by default. Second, a sensitivity scenario concerning the implementation of a photovoltaic plant to be installed on the top of the digesters’ rooftop was performed. The point of the analysis is represented by the possible reduction of electrical energy required in the waste treatment, which represents a remarkable utility (Section 2.4.3). Similar to the approach above, the Monte–Carlo method was used as a complement of the main results obtained in the environmental assessment of the photovoltaic plant integration. The last section discussed in this paper reports the benefit achievable by the gasification of the RDF and the consequent energy valorisation of the produced syngas in a steam power plant. The results are reported according to the mass and energy balance of the system by means of Figure 3, and a comparison of the different treatment systems is reported for a concise comprehension of the environmental footprint of each treatment system. Besides the environmental investigation of the photovoltaic plant, of which construction materials have been accounted according to the secondary data implemented in Ecoinvent, each scenario does not account for the impact of the realisation: concrete and steel structures, piping and machinery have a design life beyond twenty years; hence the loads associated to the construction would be minor compared to operational ones. Furthermore, long-term emissions have not been accounted.

3.1. Base Case Scenario

In Figure 4 the environmental analysis of the base case is reported. Different colours highlight each subprocess modelled in the system. The first result comes from the system-expansion approach that brings a positive environmental load due to the avoided production of nitrogen fertilizer (dark red colour) replaced by HQC sold to the market. Further positive contributions to the environmental load are the energy recovered from biogas combustion in the ICE located in the landfill (cyan) and in the CHP unit (yellow), as well as the little amount of scrap steel recovered in the MBT unit (bright red). The maxima reductions obtained are as follows: ODP −42%, ABFF −38%, AC −25% and −15% for AB. The material sent to the landfill has a heterogeneous composition of organic matter, paper and unrecyclable plastic, the latter accounting for about 45% on a mass base. Waste plastic mixture that is sent to landfill represents the main environmental load for different categories. As supposed, the indicator of terrestrial ecotoxicity is mainly dependent on the pollutants within the HQC. The trend is similar to that reported in [23] where the compost and steel recovery reduced the environmental load of the composting system. GWP, ODP and PHOX are lower, as follows: 137.35 vs. 1081 kg CO2eq, 2.18 × 10⁻⁶ vs. 4.8 × 10⁻⁵ kg CFC-11eq and 0.026 vs. 0.185 kg C2H4eq. Since the impact of transportation and plastic bags is not included within the system boundary, it is difficult to perform a clear comparison. The GWP in Cadena [24] is, instead, lower (63 kg CO2eq) whereas EU is far higher (7.13/3.7 vs. 0.138 kg PO4eq). The studies [23,24] report a similar amount of HT (15.86/14.54 vs. 13.95 kg 1,4-DBeq).
The values of the impact categories reported in Figure 4 are then normalized as shown in Figure 5. MWEX (172,603 kg 1,4-DBeq and 1.479 × 10⁻⁹ after normalization) represents the main impact, and it is associated with the waste disposed at the landfill. The index estimates the long-term pollution of the water ecosystem, such as rivers, oceans and groundwaters. Therefore, the rupture of the safety-containment layers of the LF landfill may cause long-term environmental damage. The second impact category is Eutrophication (5.282 × 10⁻¹¹) and the Global Warming immediately after (3.733 × 10⁻¹¹). If the MWEX index is not considered, then the following allocation percentages are obtained for the other impact categories: EU 47.92%, GWP 25.8%, TREX 6.89% (7.528 × 10⁻¹²), ABFF 6.7% (7.344 × 10⁻¹²), FWEX 4.84% (5.339 × 10⁻¹²), AC 4.45% (4.9 × 10⁻¹²), PHOX 2.75% (3.029 × 10⁻¹²), HU 1.63% (1.799 × 10⁻¹²), AD 0.1% (1.105 × 10⁻¹³) and ODP 0.02% (2.446 × 10⁻¹⁴).

3.1.1. Monte–Carlo Analysis

In a LCA, study data must be consistent, and numerous measurements should be associated to any process. However, this is not always possible, but with a Monte–Carlo Analysis the influence of the input values on the impact categories can be evaluated. The Monte–Carlo approach is based on a numerical method to define the overall probability of a complex system influenced by a set of variables with their unique probability distribution. The method simplifies the mathematical formulation since the algebra of random variables would require more computational efforts for systems with many parameters involved. The error of the simulation is evaluated according to Equation (3), where δ M is the standard deviation of the mean, δ the deviation of the system generated data and N the number of samples.
δ M = δ N
Appropriate probabilistic density functions should be assumed for the best description of the data. In this model, the normal distribution is assumed based on the historical time data series, when possible. Data with a significant deviation have been modelled as a uniform distribution around the mean value of the data given while 30,000 iterations were sufficient to have a total standard error lower than 1 × 10⁻⁶ and a 95% confidence interval. Table 6 reports the results of the MC analysis while Figure 6 and Figure 7 show the characterization and the normalization of the impact categories. Best- and worst-case scenarios are defined in the facility performances as if attention were focused on the maxima spreading variation of each impact category. The most affected one is the terrestrial ecotoxicity, related to the trace pollutants in the HQC. Fantin et al. [20] reported lower variations for ODP, EU and resources depletion, the latter with the highest coefficient of variation (111%). The higher fluctuation of the index may be due to the pandemic influence since the restrictions have led to the closure of nearby treatment systems, and more waste has been disposed at the landfill. Hence, biogas and compost productions have been affected in terms of quality and composition, too. The normalization expresses higher variation for MWEX (as expected), FWEX and EU.

3.1.2. System Comparison with Ecoinvent Database

Due to the high amount of waste sent to landfilling (87 ktons/year), a high portion of the environmental impacts are shared with that section. For this reason, a comparison between the system and a sanitary landfill present in Ecoinvent database was performed, and the main results are shown shown in Figure 8.
In general, there may be different reasons why a specific impact category is better in a scenario rather than in the other. For what concerns the abiotic depletion, the material and the energy recovered with the composting + MBT give a positive benefit (25%), but the same does not apply to ABFF; in a traditional sanitary landfill, indeed, fossil fuels are used for waste compaction and movement, but there is no thermal demand. The anaerobic digestion, instead, requires heat to maintain the internal temperature suitable for the decomposing bacteria, as suggested by the index increment of about 54%. The histogram does not provide the most prominent contribution of pure fuel consumption and fossil fuels used in the energy mix of the municipality where the plant is located. The same reason may be applied to the ODP index since it is slightly correlated to fossil fuel combustion. Global warming is positively affected by energy recovery and biogas combustion (−75%); either biogenic or not, such compound contributes to atmospheric warming. For HT, the reduction of 30% is attributed to miscellaneous factors (gaseous emissions, electricity usage, liquid emissions, etc.). It is worth noting the controversial difference among FWEX (+18%) and MWEX (−30%) trends; the latter is probably due to the lower wastes attributed to 1 ton of functional unit, while the FWEX increase may be due to the wastewaters produced in the composting section, which are sent to external treatment plants together with landfill leachates. As regards the TREX, it has a remarkable increase (+733%) due to the pollutants present in the compost and associated with soil emissions while the PHOX is reduced by almost −80%, and, lastly, eutrophication is slightly increased (+16%). In terms of normalized results, similar considerations shown for Figure 5 can be expressed. MWEX, GWP and EU represent the dominant impact categories.
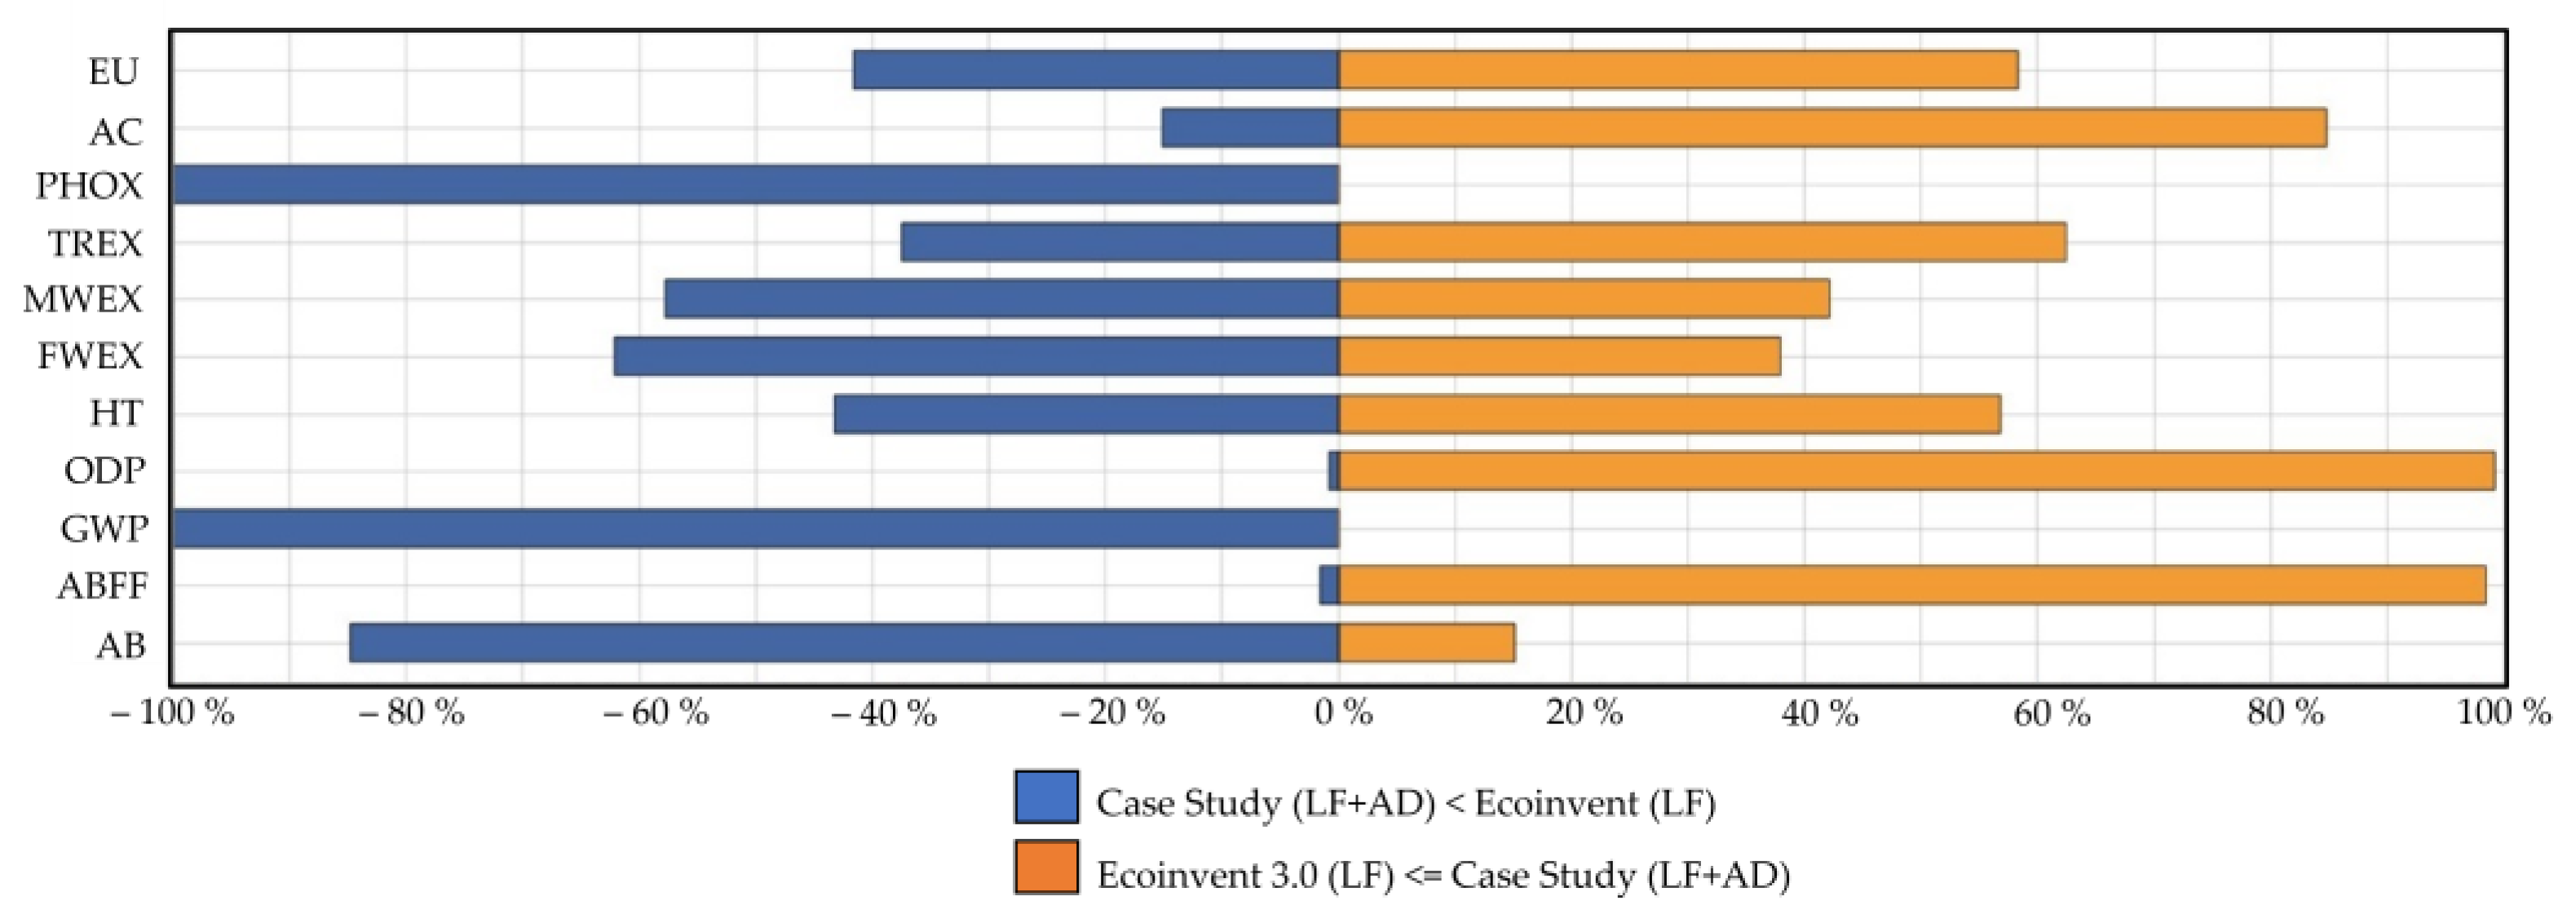
The uncertainty analysis performed with respect to this comparison is reported in Figure 9. The Ecoinvent database brings a lower footprint in the following impact categories: AB 15.17%, ABFF 98.43%, AC 84.83%, EU 58.33%, FWEX 37.9%, GWP 0%, HT 56.77%, MWEX 41.16%, ODP 99.2%, PHOX 0% and TREX 62.5%.

3.1.3. Sensitivity Analysis

The last sensitivity analysis regarding the base case scenario is related to the operability of the CHP unit. So far, indeed, the CHP unit has worked at part-load conditions (reaching a peak power production of 235 kWe in 2020), and as a consequence, it was of interest to assess the real environmental benefits. A comparison of the base case with that without the CHP unit was performed considering that after the installation of the CHP unit, the registered consumption of diesel for the heating of the anaerobic digesters reduced by almost 40% (from 27,000 L to 17,000 L per year). With reference to the scenario without the CHP unit, the following assumptions are considered: (i) no electricity is produced; (ii) no thermal energy available to substitute the fuel used in the anaerobic digestion; and (iii) direct atmospheric emissions due to methane combustion in the safety flare, according to Equation (1). As can be noticed in Figure 10, four impact indexes (ABFF, ODP, AC and GWP) benefit significantly from the use of the CHP unit. In detail, the GWP impact reduces by about 9% (151 to 137 kg of CO2eq), AC by 25% (0.185 to 0.138 of kg C2H4eq), ODP by 31% (3.17 × 10⁻⁶ kg CFC-11 to 2.18 × 10⁻⁶) and ABFF by 46% (426 MJ to 231 MJ). Minor reductions (0–5%) are obtained for the other impact categories (PHOX, AB, HU, FWEX, MWEX, TREX and EU) as expected.
According to Figure 11, the Monte–Carlo analysis confirms the benefits stated above. Indeed, four out of eleven indicators perform better in 100% of the total cases (ABFF, AC, ODP and GWP), followed by PHOX (86%), AB (80%) and TREX (76%). Eutrophication, human toxicity, and fresh and marine water are not affected by the sensitivity analysis since these impact categories are related only to the liquid emissions and the waste disposal at the landfill. Terrestrial toxicity has no variations, too, as mainly linked to the HQC.

3.2. Photovoltaic Implementation

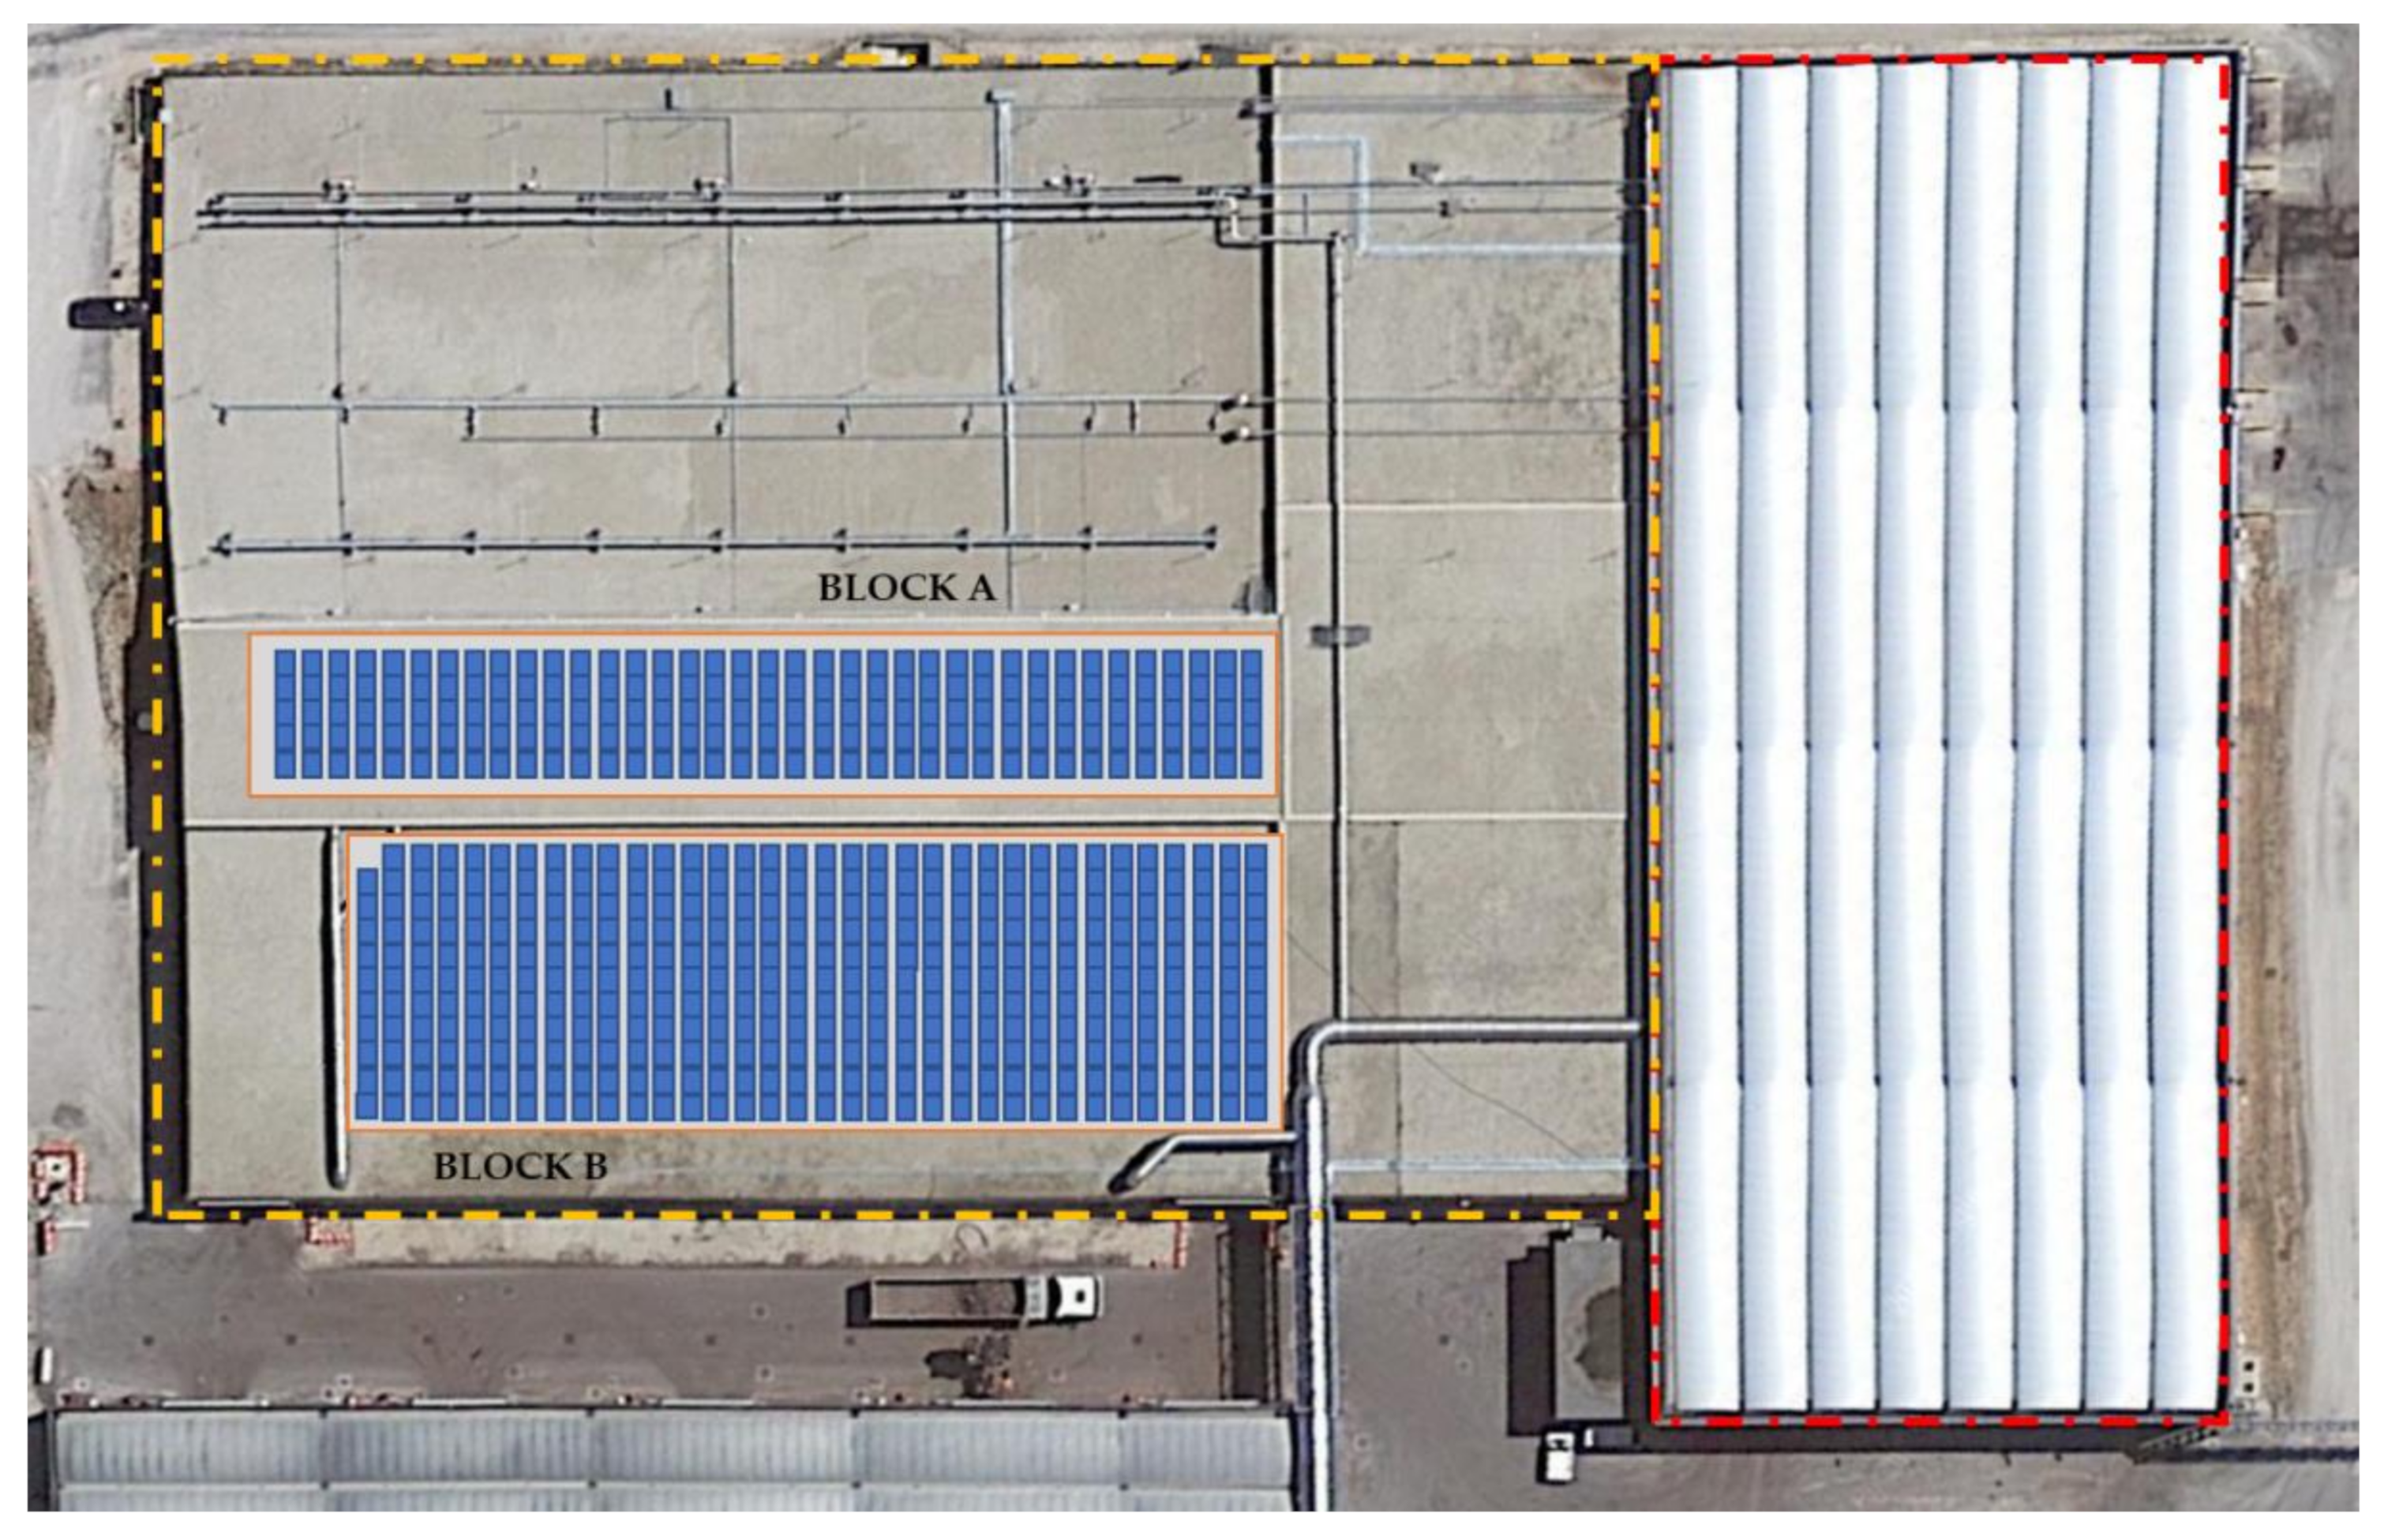
The second type of renewable energy investigated in this paper is the integration of a photovoltaic (PV) plant on the digesters’ rooftop. As depicted in Figure 12, the PV plant is divided into two different blocks (A and B) due to the presence of some obstacles. More precisely block A has 185 modules (5 × 37) while block B has 373 modules (11 × 33 plus a string with 10 modules). Considering a power nominal capacity of 330 W per panel [49], the total power of the PV plant is about 184 kW. Hence, an annual electricity production of around 232,000 kWh can be expected for the considered location, which is about 5% of the electricity required by the whole system. This corresponds to 43.4 TOE (tons of oil equivalent) savings. The results of the LCA analyses are reported in Figure 13 and Figure 14. The PV plant slightly affects three impact categories, i.e., the ABFF, the ODP and the AC, bringing a reduction of 6%, 5% and 2% respectively as shown in Figure 13. Indeed, the electricity production from PV gives a positive contribution to the impact categories related to fossil fuels consumption (ABFF and ODP) but not much to the GWP which has a positive variation of 1% only. The higher variations of the indexes above reflect also in the tornado chart of Figure 14. AC (85.77%), ODP (77.33%) and AC (75.07%) are the most affected indexes in the photovoltaic implementation, followed by GWP (55.93%), PHOX (54.17%), AB (53.57%) and TREX (51.77%). Other impact categories are not affected since neither variation of the waste process treatment nor negative effects of land use (the solar panels are located on the facility rooftop) are foreseen.
To the best of the authors’ knowledge, no LCA papers addressing the integration of PV in waste treatment facilities are found for reference. On the contrary, some investigations have been done in residential buildings. For example, the work of Herrando et al. [50] compared different LCA scenarios related to PV implementation in residential areas finding a CO2 emissions reduction of 29% with a PV plant able to cover 35% of the total energy consumption of the building in the Mediterranean climate. However, as highlighted by Roux et al. [51], PV integration may lead to low variation of the carbon footprint if a remarkable renewable-based mix characterizes the production-side energy market.

3.3. Gasification Process Implementation

Although the most common solution adopted in waste-to-energy is the excess air combustion, pyrolysis and gasification represent more environmentally friendly options. Indeed, typical incineration systems release into the environment huge amounts of carbon dioxide and nitrogen oxides emissions. Furthermore, the heterogeneity of the MSW composition may results in a significant variation range of the corresponding heating value of the fuel. Gasification, instead, converts a solid-based feedstock material into syngas and produces lower emissions due to the lower amount of air involved in the process. The most common chemical reactions that take place during the gasification process both heterogenous reactions (Bouduard, Water-Gas, Hydrogasification) and homogeneous ones (Water-Gas shift, Metanation, Reforming) evolve parallelly inside the gasifier in a complicated interaction that is difficult to predict with the available thermochemical models. To predict the amount of the produced syngas from 20 ktons/year RDF, a gasifier model has been developed, but its detailed analysis is out of scope of the present paper. The model has been validated against the data reported by Arena et al. [52] and Parrillo et al. [53] related to different configurations of a fluidized-bed air gasifier fed with waste plastic and biomass-based feedstocks. The properties of the RDF material are based upon the chemical data of the residual MSW produced in the MBT unit under investigation in the present paper and listed in Table 7.
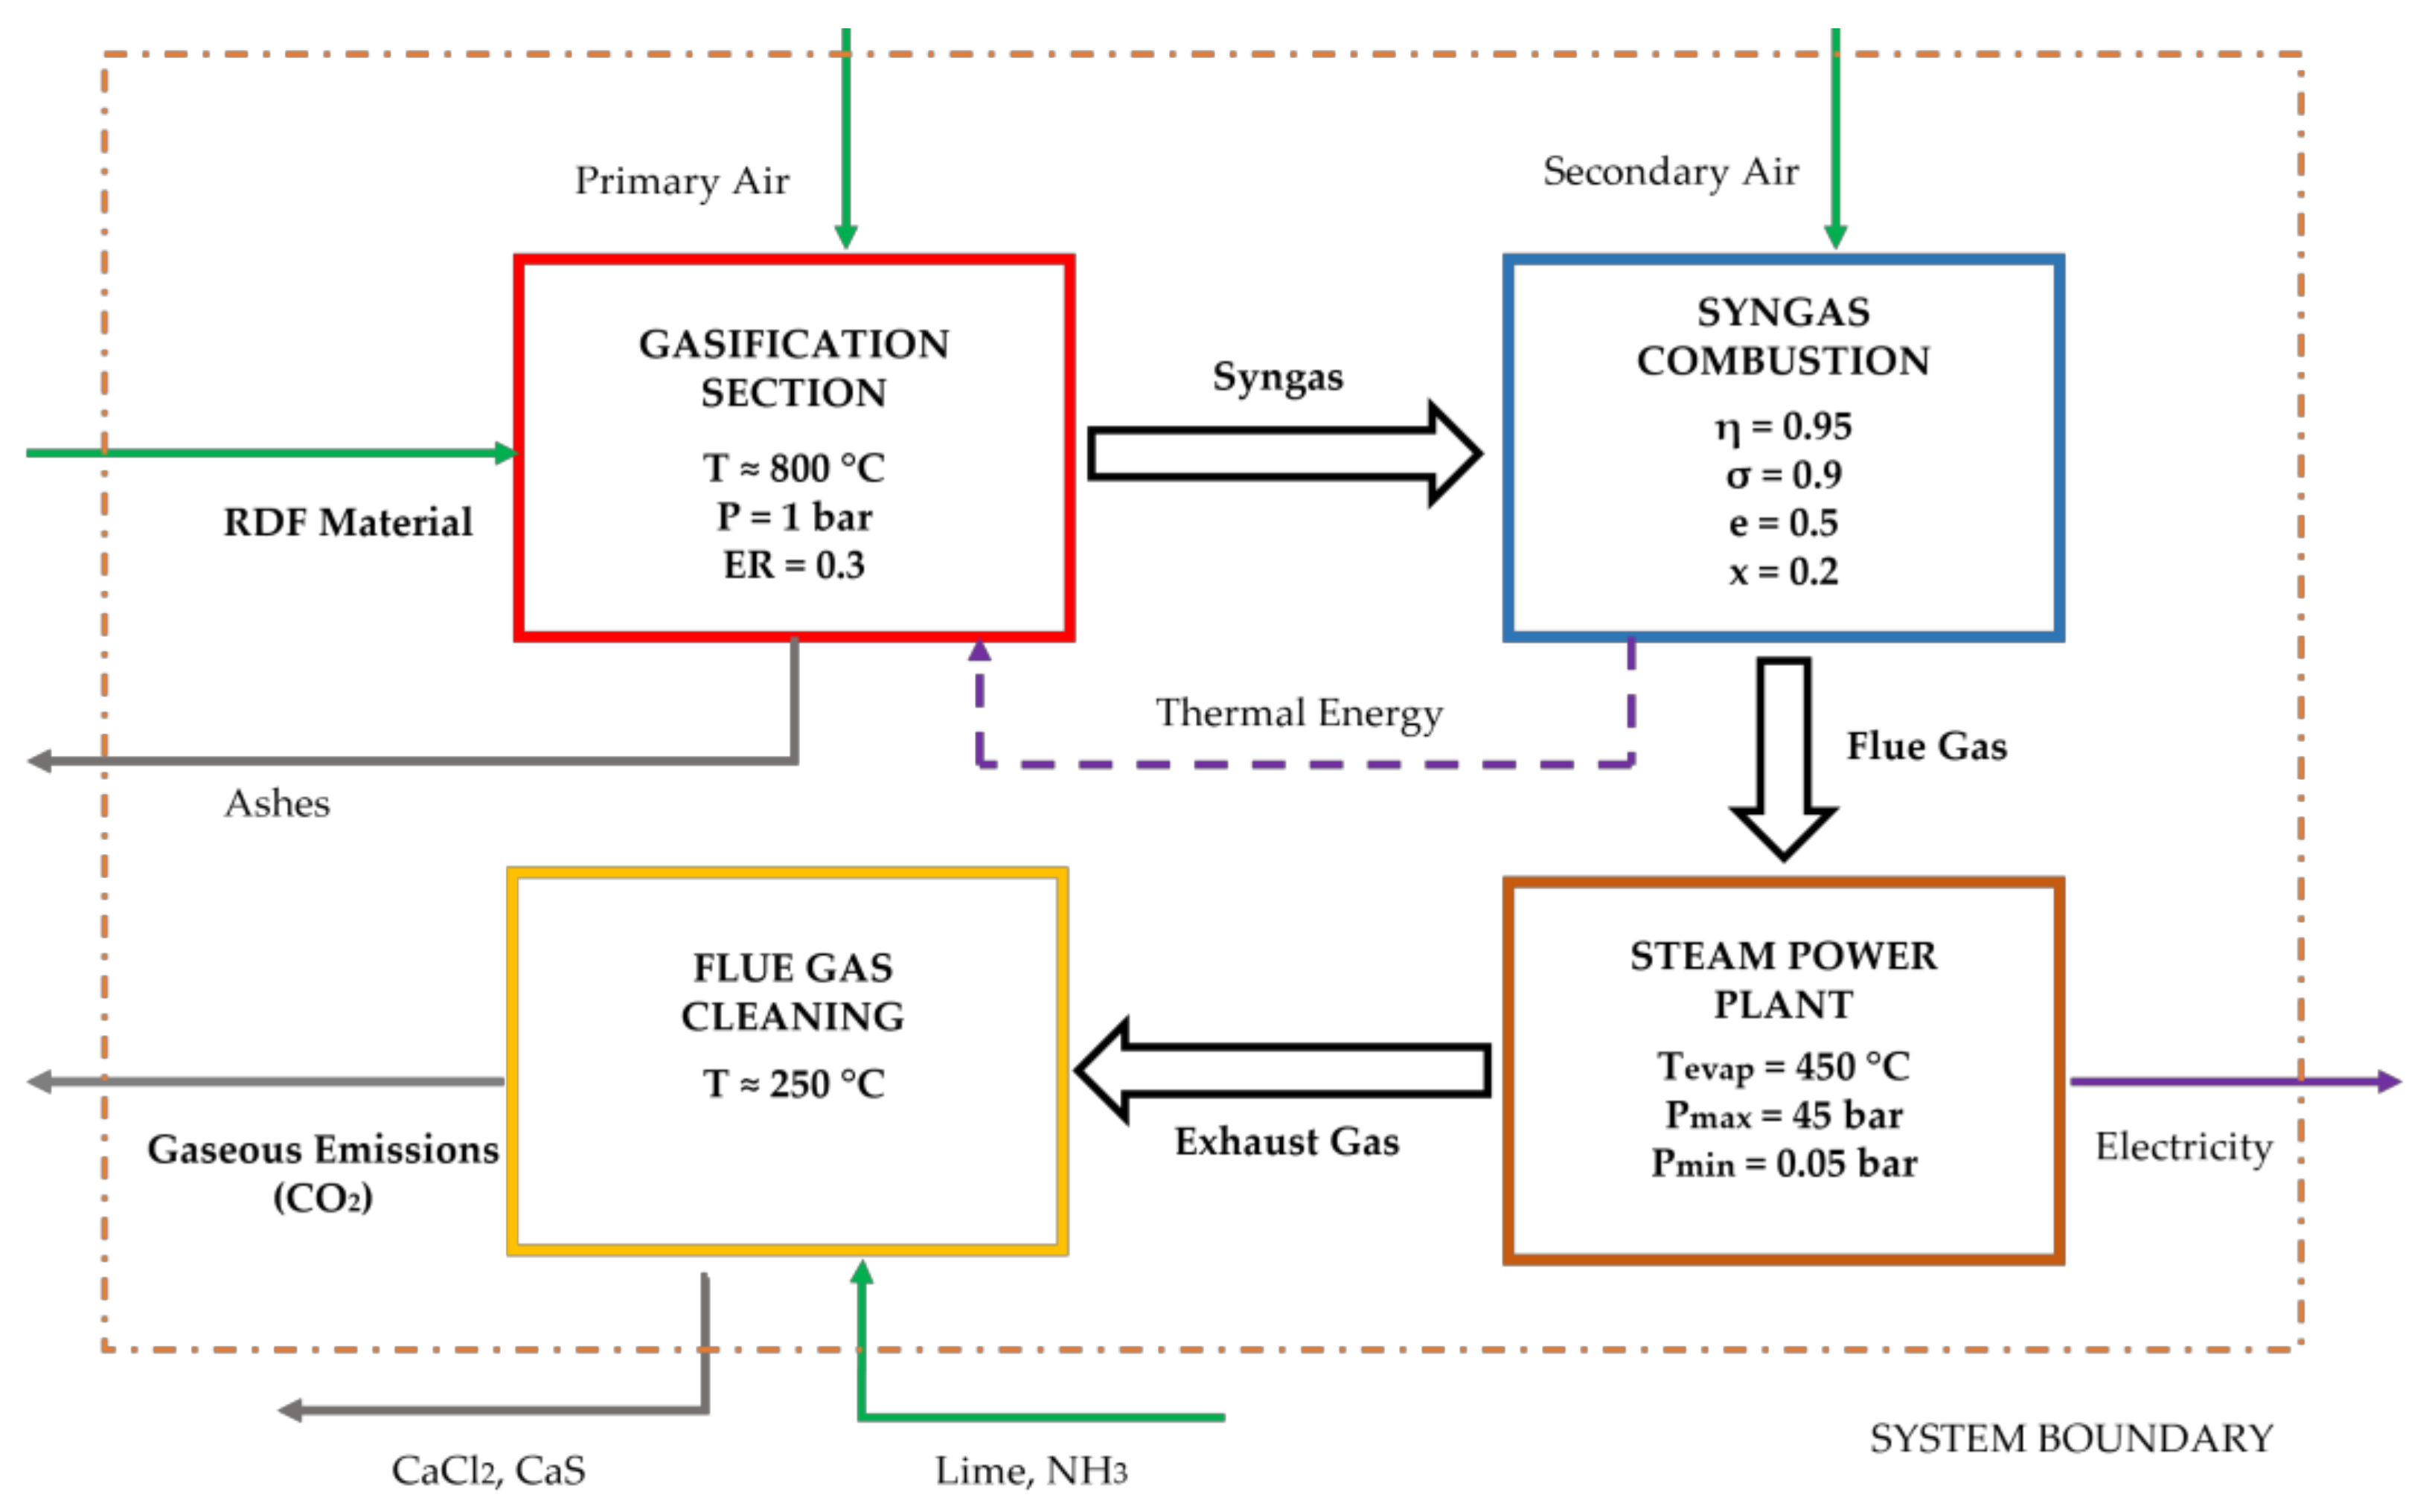
More precisely, 2281 kg/h of RDF enter the gasifier following the energy conversion process shown in Figure 15 in which the most significant process parameters are reported. In particular, the syngas is sent to an external combustion chamber (combustion efficiency η = 0.95, air excess e = 0.5, recirculation factor x = 0.2), and the flue gas enters the shell-and-tube evaporator of the steam power plant (heat exchange efficiency σ = 0.9), which works according to a single pressure level Hirn cycle (turbine inlet conditions of 45 bar and 450 °C). Activated carbons (Ca(OH)2 and CaO) and ammonia (NH4) are used in the gas cleaning section for the acid compounds removal (H2S and HCl) at 250 °C [54]. The steam power plant has a nominal power output of 2.064 MW, and a capacity factor of 0.8 is assumed for the subsequent calculation. The inventory analysis is based on the system boundary defined in Figure 15, where the green and grey colours are used for material-based inputs and outputs and violet colour for energy streams (straight line for electrical type and dashed for thermal). The total amount of air required in the gasification (primary air) and in the combustion (secondary air) is about 16,838 kg/h, which yields 4250 Nm3/h of flue gases. The latter are mainly composed of carbon dioxide (3205 kg/h), which is split: 45% from fossil-based emission (i.e., the amount of plastic content in the RDF) and 55% from biogenic materials (paper, board, textiles, leather and so forth), vapor (1882 kg/h), oxygen (971 kg/h) and nitrogen (12,942 kg/h). Also, 7 kg/h of activated carbon (lime) and ammonia are used for the removal of acid compounds, and the overall quantity of ashes, unreacted char and metals produced is equal to 133 kg/h.
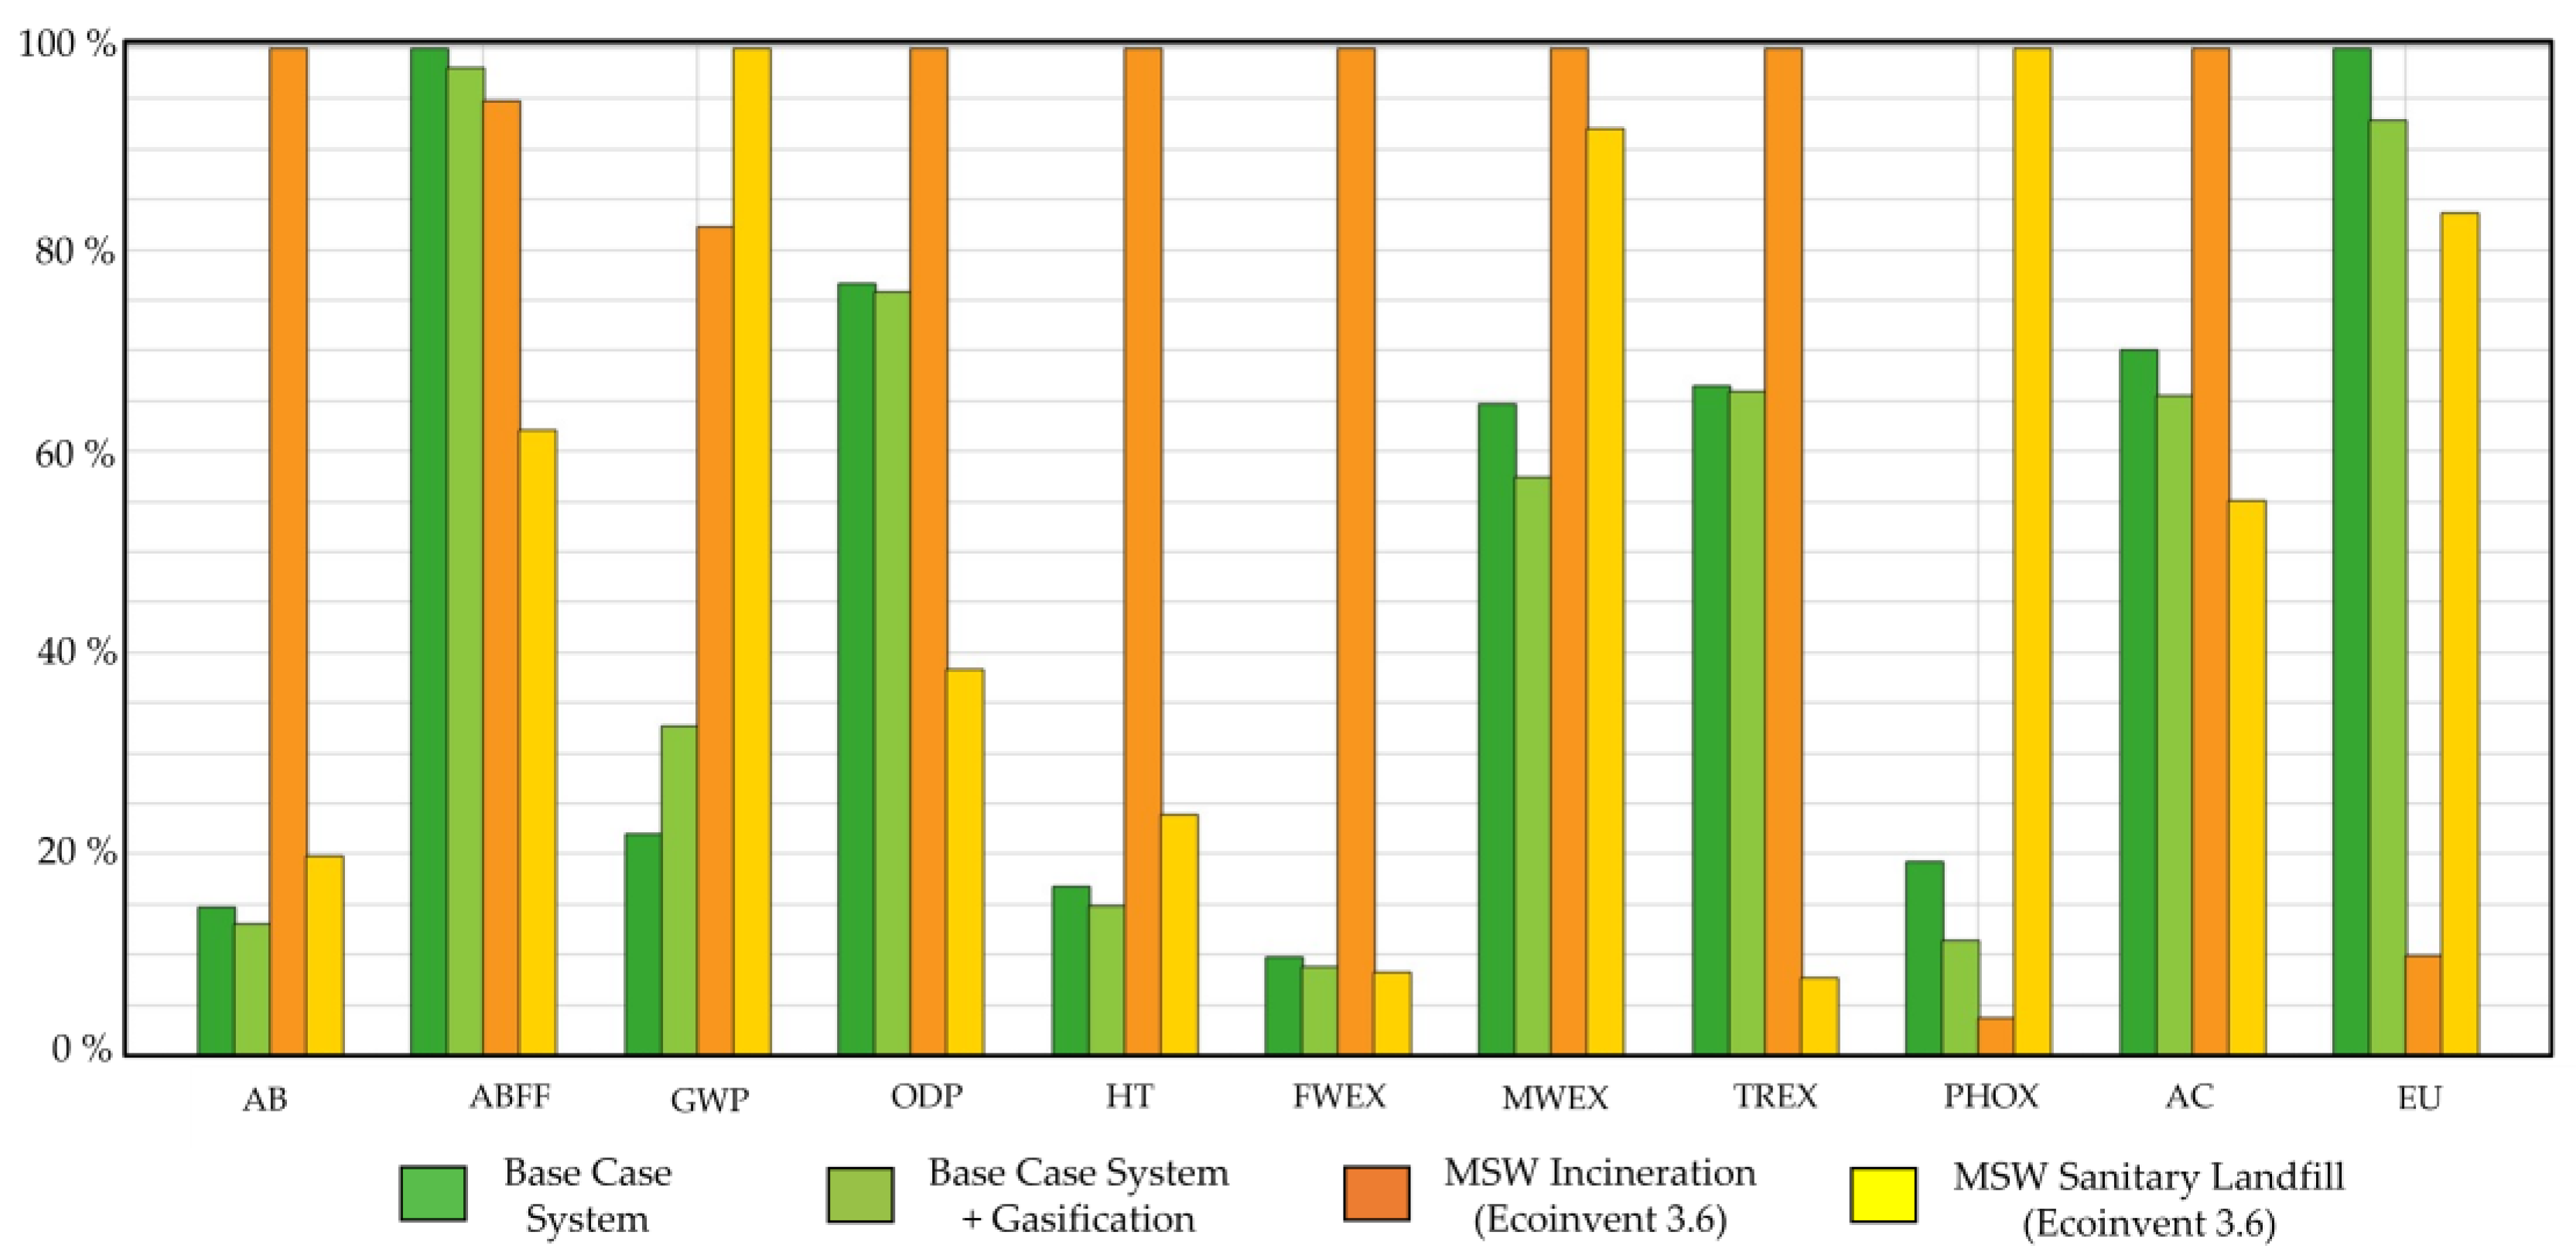
The results of the corresponding LCIA are reported in Figure 16. The RDF gasifier system is compared with the base case scenario, with an incineration system (Italy background data) and a standard sanitary landfill in Europe. In general, incineration is the worst solution for most of the impact categories (AB, ODP, HT, FWEX, MWEX, TREX, AC); landfilling is worst for GWP and PHOX while the basic system is worst for the ABFF. The gasification implementation does not dominate any impact category, but it is worse than the nominal scenario in terms of GWP emissions (+48%). The reason lies in the increased amount of CO2 production due to the syngas combustion. However, this negative effect is counter-balanced by the lower amount of waste that is sent to the facility landfill. Indeed, the variations of the other indicators are as follows: AB −10%, ABFF −2%, ODP −1%, HT −11%, FWEX −10%, MWEX −11%, PHOX −41%, AC −7% and EU −7%, calculated according to the data of Table 8.

4. Conclusions

The analysis carried out in this work demonstrates that implementing renewable energy technologies and energy efficiency measures in a composting facility for MSW can bring to a significant reduction of the related environmental impact. More precisely, the following main conclusions can be formulated:
  • The use of biogas from anaerobic digestion and sanitary landfill in power units can reduce the contribution of composting facilities in many impact categories. In particular, for the case study under investigation, the CHP and the ICE units contribute to a reduction of the ODP by up to −42%, of the ABFF by about −38%, of the AC by −25% and of the AB by −15%;
  • Despite the fact that the quality of the organic fraction of MSW may be subjected to strong deviations (reflecting in a wide range of the impact categories such as TREX LB and UB +246%), its valorisation through anaerobic digestion brings clear benefits from an environmental point of view;
  • The integration of a PV plant in the site under investigation marginally contributes to the reduction of the environmental impact (6% for ABFF and 5% for ODP), due to the limited space available on the roofs;
  • The RDF gasification and the use of the produced syngas in a conventional steam power plant has a significant influence on many impact categories. In particular, for the case study under investigation, characterized by 20 ktons/year of RMSW, corresponding syngas production can add 2 MW of power capacity with consistent variations of PHOX (−41%), MWEX-HT (−11%) and AB-FWEX (−10%).
In conclusion, this study has shown that energy efficiency measures and renewable energy technologies integration in composting facilities can remarkably contribute to reach higher environmental standards for the sector and support a sustainable development worldwide.

Author Contributions

Methodology, G.B.; Software and Data Curation, G.B.; Data analysis, G.B.; Supervision, L.C.; Writing—Original Draft Preparation, G.B.; Writing—Review and Editing, B.M., L.C. and M.M.; Funding Acquisition, B.M., L.C. and M.M. All authors have read and agreed to the published version of the manuscript.

Funding

This research received no external funding.

Institutional Review Board Statement

Not applicable.

Informed Consent Statement

Not applicable.

Data Availability Statement

The data presented in this study are available on request from the corresponding author.

Conflicts of Interest

The authors declare no conflict of interest.

Nomenclature

ABAbiotic Depletion, kg Sbeq
ABFFAbiotic Depletion Fossil Fuel, MJ
ACAcidification, kg SO2eq
ADAnaerobic digestion
CHPHeat and Power cogeneration
CML-IAInstitute of Environmental Sciences (CML) Baseline Method
CODChemical Oxygen Demand, mg/L
eAir excess
EEnergy production, kWh
EUEutrophication, kg PO4eq
FWEXFresh Water Ecotoxicity, kg 1,4-DBeq
GHGGreenhouse gas (emissions)
GWPGlobal Warming Potential, kg CO2eq
HTHuman Toxicity, kg 1,4-DBeq
ICEInternal Combustion Energy
LBLower Bound
LCALife Cycle Assessment
LCILife Cycle Inventory
LCIALife Cycle Impact Assessment
LFLandfill
LPGLiquid Petrol Gas
LQCLow quality compost
LQCHigh Quality Compost
MMass, kg
MBTMechanical biological treatment unit
MCMonte–Carlo
MSWMunicipal Solid Waste
MWEXMarine Water Ecotoxicity, kg 1,4-DBeq
NNumber of samples (Monte–Carlo)
ODPOzone Layer Depletion, kg CFC-11eq
OFMSWOrganic Fraction of Municipal solid waste
PPressure, bar
PHOXPhotochemical Oxidation, kg C2H4eq
RMSWResidual Municipal solid waste
TTemperature, °C
TOCTotal Organic Carbon, g/kg
TOETon of Oil Equivalent
TONTotal Organic Nitrogen
TREXTerrestrial Ecotoxicity, kg 1,4-DBeq
UBUpper Bound
VVolume, Nm3
VOSVolatile organic Substances, g/kg
WtEWaste to Energy
xFlue gas recirculation
Greek Letters
αAverage biogas yield, kWh/m3
ρDensity, kg/m3
ηCombustion efficiency
δStandard deviation
δMStandard error of the mean (Monte–Carlo)
σHeat exchanger efficiency

References

  1. Puertas, R.; Marti, L. Renewable Energy Production Capacity and Consumption in Europe. Sci. Total Environ. 2022, 853, 158592. [Google Scholar] [CrossRef] [PubMed]
  2. Municipal Waste Statistics. Available online: https://ec.europa.eu/eurostat/statistics-explained/index.php?title=Municipal_waste_statistics (accessed on 14 July 2022).
  3. Rapporto Rifiuti Urbani-Edizione. 2021. Available online: https://www.isprambiente.gov.it/it/pubblicazioni/rapporti/rapporto-rifiuti-urbani-edizione-2021 (accessed on 23 July 2022).
  4. Demirbas, A. Biogas Production from the Organic Fraction of Municipal Solid Waste. Energy Sources Part A Recovery Util. Environ. Eff. 2006, 28, 1127–1134. [Google Scholar] [CrossRef]
  5. Vasco-Correa, J.; Khanal, S.; Manandhar, A.; Shah, A. Anaerobic Digestion for Bioenergy Production: Global Status, Environmental and Techno-Economic Implications, and Government Policies. Bioresour. Technol. 2018, 247, 1015–1026. [Google Scholar] [CrossRef] [PubMed]
  6. Zhang, L.; Kuroki, A.; Tong, Y.W. A Mini-Review on In Situ Biogas Upgrading Technologies via Enhanced Hydrogenotrophic Methanogenesis to Improve the Quality of Biogas From Anaerobic Digesters. Front. Energy Res. 2020, 8, 69. [Google Scholar] [CrossRef]
  7. Kim, M.; Ahn, Y.-H.; Speece, R.E. Comparative Process Stability and Efficiency of Anaerobic Digestion; Mesophilic vs. Thermophilic. Water Res. 2002, 36, 4369–4385. [Google Scholar] [CrossRef]
  8. Pubblicazioni Statistiche-Terna Spa. Available online: https://www.terna.it/it/sistema-elettrico/statistiche/pubblicazioni-statistiche (accessed on 14 July 2022).
  9. Al-Rumaihi, A.; McKay, G.; Mackey, H.R.; Al-Ansari, T. Environmental Impact Assessment of Food Waste Management Using Two Composting Techniques. Sustainability 2020, 12, 1595. [Google Scholar] [CrossRef] [Green Version]
  10. Khandelwal, H.; Dhar, H.; Thalla, A.K.; Kumar, S. Application of Life Cycle Assessment in Municipal Solid Waste Management: A Worldwide Critical Review. J. Clean. Prod. 2019, 209, 630–654. [Google Scholar] [CrossRef]
  11. Morselli, L.; De Robertis, C.; Luzi, J.; Passarini, F.; Vassura, I. Environmental Impacts of Waste Incineration in a Regional System (Emilia Romagna, Italy) Evaluated from a Life Cycle Perspective. J. Hazard. Mater. 2008, 159, 505–511. [Google Scholar] [CrossRef]
  12. European Commission; Joint Research Centre; Institute for Environment and Sustainability. International Reference Life Cycle Data System (ILCD) Handbook: General Guide for Life Cycle Assessment: Detailed Guidance; Publications Office: Luxembourg, 2010. [Google Scholar]
  13. Fruergaard, T.; Astrup, T. Optimal Utilization of Waste-to-Energy in an LCA Perspective. Waste Manag. 2011, 31, 572–582. [Google Scholar] [CrossRef]
  14. Grosso, M.; Nava, C.; Testori, R.; Rigamonti, L.; Viganò, F. The Implementation of Anaerobic Digestion of Food Waste in a Highly Populated Urban Area: An LCA Evaluation. Waste Manag. Res. 2012, 30, 78–87. [Google Scholar] [CrossRef]
  15. Güereca, L.P.; Gassó, S.; Baldasano, J.M.; Jiménez-Guerrero, P. Life Cycle Assessment of Two Biowaste Management Systems for Barcelona, Spain. Resour. Conserv. Recycl. 2006, 49, 32–48. [Google Scholar] [CrossRef]
  16. Cusenza, M.A.; Cellura, M.; Guarino, F.; Longo, S. Life Cycle Environmental Assessment of Energy Valorization of the Residual Agro-Food Industry. Energies 2021, 14, 5491. [Google Scholar] [CrossRef]
  17. Buttol, P.; Masoni, P.; Bonoli, A.; Goldoni, S.; Belladonna, V.; Cavazzuti, C. LCA of Integrated MSW Management Systems: Case Study of the Bologna District. Waste Manag. 2007, 27, 1059–1070. [Google Scholar] [CrossRef]
  18. Dong, J.; Chi, Y.; Zou, D.; Fu, C.; Huang, Q.; Ni, M. Energy–Environment–Economy Assessment of Waste Management Systems from a Life Cycle Perspective: Model Development and Case Study. Appl. Energy 2014, 114, 400–408. [Google Scholar] [CrossRef]
  19. Ekvall, T.; Finnveden, G. The Application of Life Cycle Assessment to Integrated Solid Waste Management: Part 2—Perspectives on energy and material recovery from paper. Process Saf. Environ. Prot. 2000, 78, 288–294. [Google Scholar] [CrossRef]
  20. Fantin, V.; Giuliano, A.; Manfredi, M.; Ottaviano, G.; Stefanova, M.; Masoni, P. Environmental Assessment of Electricity Generation from an Italian Anaerobic Digestion Plant. Biomass Bioenergy 2015, 83, 422–435. [Google Scholar] [CrossRef]
  21. International Organization for Standardization. Environmental Management: Life Cycle Assessment; Principles and Framework; ISO: Geneva, Switzerland, 2006. [Google Scholar]
  22. Starr, K.; Gabarrell, X.; Villalba, G.; Talens, L.; Lombardi, L. Life Cycle Assessment of Biogas Upgrading Technologies. Waste Manag. 2012, 32, 991–999. [Google Scholar] [CrossRef]
  23. Blengini, G.A. Using LCA to Evaluate Impacts and Resources Conservation Potential of Composting: A Case Study of the Asti District in Italy. Resour. Conserv. Recycl. 2008, 52, 1373–1381. [Google Scholar] [CrossRef]
  24. Cadena, E.; Colón, J.; Artola, A.; Sánchez, A.; Font, X. Environmental Impact of Two Aerobic Composting Technologies Using Life Cycle Assessment. Int. J. Life Cycle Assess. 2009, 14, 401–410. [Google Scholar] [CrossRef] [Green Version]
  25. Sauve, G.; Van Acker, K. The Environmental Impacts of Municipal Solid Waste Landfills in Europe: A Life Cycle Assessment of Proper Reference Cases to Support Decision Making. J. Environ. Manag. 2020, 261, 110216. [Google Scholar] [CrossRef]
  26. Lee, U.; Han, J.; Wang, M. Evaluation of Landfill Gas Emissions from Municipal Solid Waste Landfills for the Life-Cycle Analysis of Waste-to-Energy Pathways. J. Clean. Prod. 2017, 166, 335–342. [Google Scholar] [CrossRef]
  27. Damgaard, A.; Manfredi, S.; Merrild, H.; Stensøe, S.; Christensen, T.H. LCA and Economic Evaluation of Landfill Leachate and Gas Technologies. Waste Manag. 2011, 31, 1532–1541. [Google Scholar] [CrossRef] [PubMed] [Green Version]
  28. Lo, S.; Ma, H.; Lo, S. Quantifying and Reducing Uncertainty in Life Cycle Assessment Using the Bayesian Monte Carlo Method. Sci. Total Environ. 2005, 340, 23–33. [Google Scholar] [CrossRef] [PubMed]
  29. Doka, G.; Hischier, R. Waste Treatment and Assessment of Long-Term Emissions (8pp). Int. J. Life Cycle Assess. 2005, 10, 77–84. [Google Scholar] [CrossRef]
  30. Ekvall, T.; Assefa, G.; Björklund, A.; Eriksson, O.; Finnveden, G. What Life-Cycle Assessment Does and Does Not Do in Assessments of Waste Management. Waste Manag. 2007, 27, 989–996. [Google Scholar] [CrossRef] [PubMed]
  31. Clift, R.; Doig, A.; Finnveden, G. The Application of Life Cycle Assessment to Integrated Solid Waste Management: Part 1—Methodology. Process. Saf. Environ. Prot. 2000, 78, 279–287. [Google Scholar] [CrossRef]
  32. Havukainen, J.; Zhan, M.; Dong, J.; Liikanen, M.; Deviatkin, I.; Li, X.; Horttanainen, M. Environmental Impact Assessment of Municipal Solid Waste Management Incorporating Mechanical Treatment of Waste and Incineration in Hangzhou, China. J. Clean. Prod. 2017, 141, 453–461. [Google Scholar] [CrossRef]
  33. Kim, M.-H.; Kim, J.-W. Comparison through a LCA Evaluation Analysis of Food Waste Disposal Options from the Perspective of Global Warming and Resource Recovery. Sci. Total Environ. 2010, 408, 3998–4006. [Google Scholar] [CrossRef]
  34. Násner, A.M.L.; Lora, E.E.S.; Palacio, J.C.E.; Rocha, M.H.; Restrepo, J.C.; Venturini, O.J.; Ratner, A. Refuse Derived Fuel (RDF) Production and Gasification in a Pilot Plant Integrated with an Otto Cycle ICE through Aspen PlusTM Modelling: Thermodynamic and Economic Viability. Waste Manag. 2017, 69, 187–201. [Google Scholar] [CrossRef]
  35. Chiemchaisri, C.; Charnnok, B.; Visvanathan, C. Recovery of Plastic Wastes from Dumpsite as Refuse-Derived Fuel and Its Utilization in Small Gasification System. Bioresour. Technol. 2010, 101, 1522–1527. [Google Scholar] [CrossRef]
  36. Rigamonti, L.; Grosso, M.; Giugliano, M. Life Cycle Assessment of Sub-Units Composing a MSW Management System. J. Clean. Prod. 2010, 18, 1652–1662. [Google Scholar] [CrossRef]
  37. Istrate, I.-R.; Iribarren, D.; Gálvez-Martos, J.-L.; Dufour, J. Review of Life-Cycle Environmental Consequences of Waste-to-Energy Solutions on the Municipal Solid Waste Management System. Resour. Conserv. Recycl. 2020, 157, 104778. [Google Scholar] [CrossRef]
  38. Menikpura, S.N.M.; Sang-Arun, J.; Bengtsson, M. Integrated Solid Waste Management: An Approach for Enhancing Climate Co-Benefits through Resource Recovery. J. Clean. Prod. 2013, 58, 34–42. [Google Scholar] [CrossRef]
  39. Gentil, E.C.; Damgaard, A.; Hauschild, M.; Finnveden, G.; Eriksson, O.; Thorneloe, S.; Kaplan, P.O.; Barlaz, M.; Muller, O.; Matsui, Y.; et al. Models for Waste Life Cycle Assessment: Review of Technical Assumptions. Waste Manag. 2010, 30, 2636–2648. [Google Scholar] [CrossRef] [PubMed]
  40. Ecoinvent Database. Ecoinvent. Available online: https://ecoinvent.org/the-ecoinvent-database/ (accessed on 27 September 2022).
  41. Wernet, G.; Bauer, C.; Steubing, B.; Reinhard, J.; Moreno-Ruiz, E.; Weidema, B. The Ecoinvent Database Version 3 (Part I): Overview and Methodology. Int. J. Life Cycle Assess. 2016, 21, 1218–1230. [Google Scholar] [CrossRef]
  42. CML-IA Characterisation Factors. Available online: https://www.universiteitleiden.nl/en/research/research-output/science/cml-ia-characterisation-factors (accessed on 14 July 2022).
  43. Rigamonti, L.; Falbo, A.; Grosso, M. Improving Integrated Waste Management at the Regional Level: The Case of Lombardia. Waste Manag. Res. 2013, 31, 946–953. [Google Scholar] [CrossRef] [PubMed]
  44. Giugliano, M.; Cernuschi, S.; Grosso, M.; Rigamonti, L. Material and Energy Recovery in Integrated Waste Management Systems. An Evaluation Based on Life Cycle Assessment. Waste Manag. 2011, 31, 2092–2101. [Google Scholar] [CrossRef]
  45. Rabl, A.; Benoist, A.; Dron, D.; Peuportier, B.; Spadaro, J.V.; Zoughaib, A. How to Account for CO2 Emissions from Biomass in an LCA. Int. J. Life Cycle Assess. 2007, 12, 281. [Google Scholar] [CrossRef]
  46. Dastjerdi, B.; Strezov, V.; Rajaeifar, M.A.; Kumar, R.; Behnia, M. A Systematic Review on Life Cycle Assessment of Different Waste to Energy Valorization Technologies. J. Clean. Prod. 2021, 290, 125747. [Google Scholar] [CrossRef]
  47. You, S.; Ok, Y.S.; Chen, S.S.; Tsang, D.C.W.; Kwon, E.E.; Lee, J.; Wang, C.-H. A Critical Review on Sustainable Biochar System through Gasification: Energy and Environmental Applications. Bioresour. Technol. 2017, 246, 242–253. [Google Scholar] [CrossRef]
  48. Ayodele, T.R.; Ogunjuyigbe, A.S.O.; Alao, M.A. Life Cycle Assessment of Waste-to-Energy (WtE) Technologies for Electricity Generation Using Municipal Solid Waste in Nigeria. Appl. Energy 2017, 201, 200–218. [Google Scholar] [CrossRef]
  49. Modulo Fotovoltaico HF330KA Monocristallino 330 W 24 V. Available online: http://www.solarenergypoint.it/shop/sun-earth-hf330ka-modulo-fotovoltaico-monocristallino-330w (accessed on 16 September 2022).
  50. Life Cycle Assessment of Solar Energy Systems for the Provision of Heating, Cooling and Electricity in Buildings: A Comparative Analysis|Elsevier Enhanced Reader. Energy Convers. Manag. 2022, 257, p. 115402.
  51. Integrating Climate Change and Energy Mix Scenarios in LCA of Buildings and Districts|Elsevier Enhanced Reader. Appl. Energy. 2016, 184, pp. 619–629.
  52. Arena, U. Fluidized Bed Gasification. In Fluidized Bed Technologies for Near-Zero Emission Combustion and Gasification; Elsevier: Amsterdam, The Netherlands, 2013; pp. 765–812. ISBN 978-0-85709-541-1. [Google Scholar]
  53. Parrillo, F.; Ardolino, F.; Calì, G.; Marotto, D.; Pettinau, A.; Arena, U. Fluidized Bed Gasification of Eucalyptus Chips: Axial Profiles of Syngas Composition in a Pilot Scale Reactor. Energy 2021, 219, 119604. [Google Scholar] [CrossRef]
  54. Inceneritore F3 Rifiuti Urbani e Speciali Di Ravenna-HERAmbiente. Available online: https://ha.gruppohera.it/impianti/rifiuti_industriali/impianto_incenerimento_ravenna (accessed on 19 September 2022).
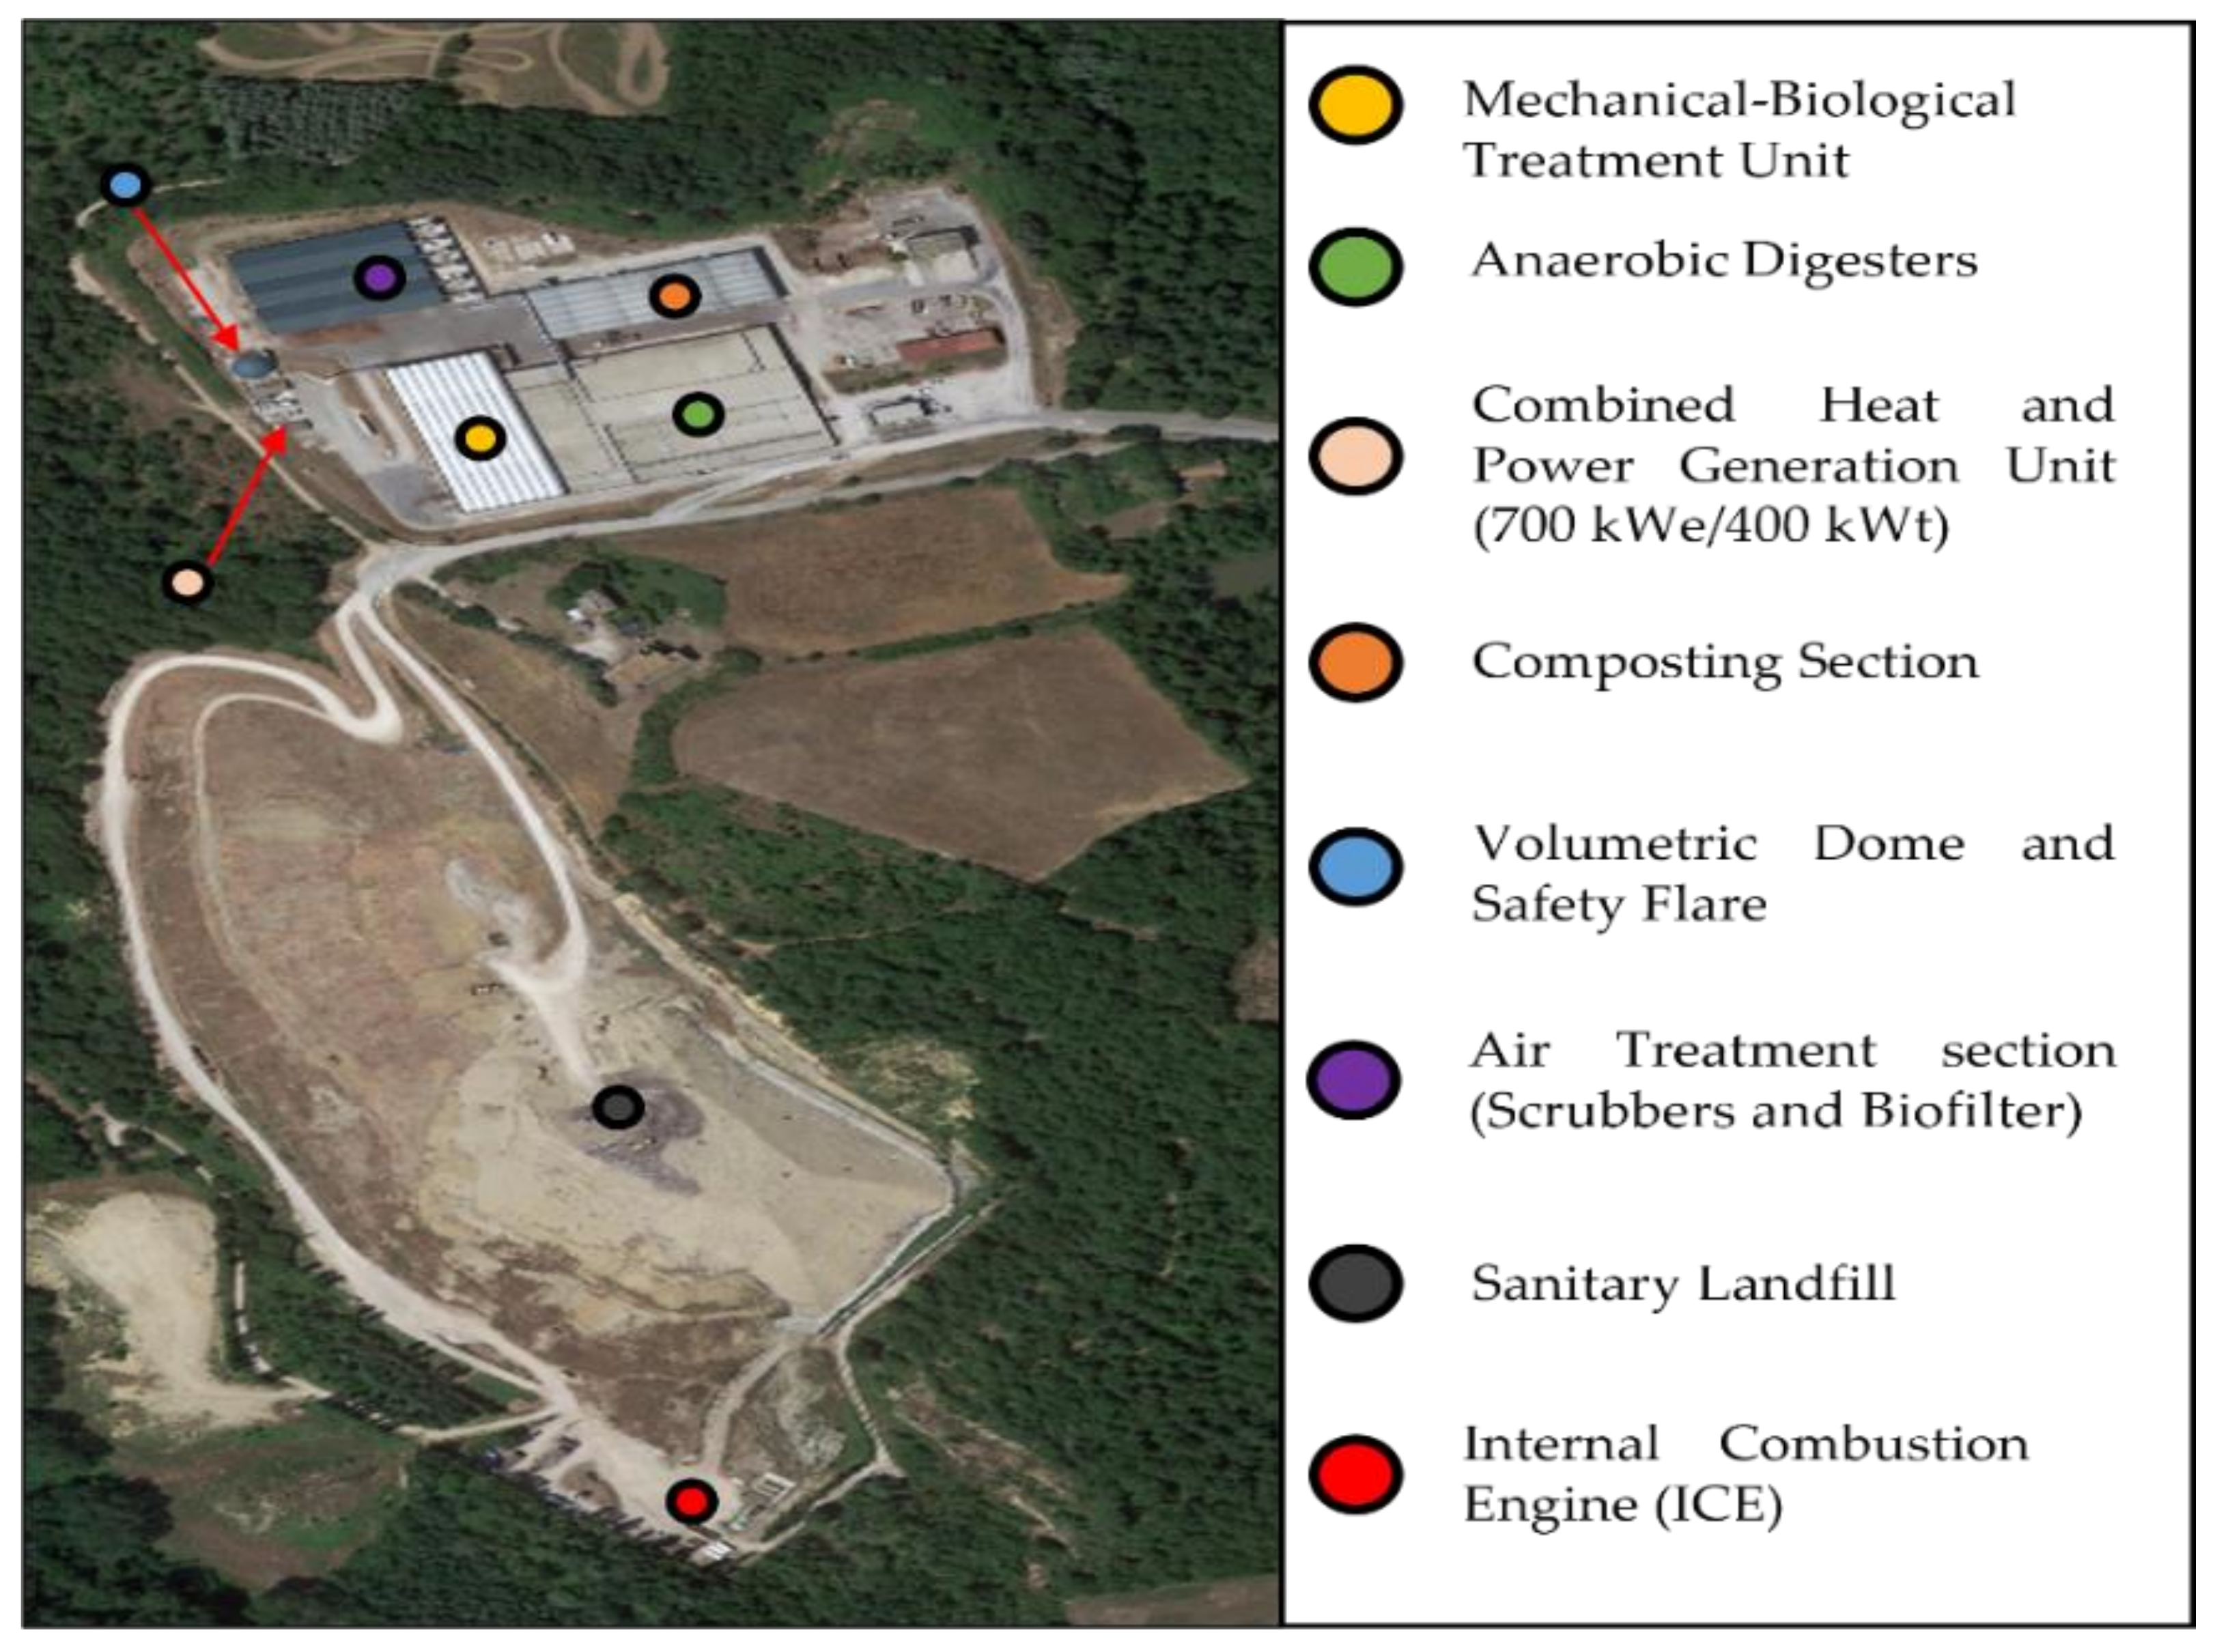
Figure 1. Top view of the site under investigation.
Sustainability 14 14961 g001
Figure 2. Material and energy flows in a standard composting facility, (a); Material and energy flows in a composting facility implementing MBT, (b).
Sustainability 14 14961 g002
Figure 3. Detailed diagram of the material and energy flows in the analyzed domain (blue lines for energy and waste inputs, red for material outputs, violet for energy output and orange for internal flows).
Sustainability 14 14961 g003
Figure 4. Results of the LCA for the facility under investigation (colours represent the different subprocesses).
Sustainability 14 14961 g004
Figure 5. Normalization of the impact factors according to CML baseline method.
Sustainability 14 14961 g005
Figure 6. Impact factors variations according to the results of the uncertainty analysis. The deviation is expressed according to the median value.
Sustainability 14 14961 g006
Figure 7. Deviation of the normalized impact factors coming from Monte–Carlo analysis.
Sustainability 14 14961 g007
Figure 8. Comparison of the impact categories in the facility under investigation with those of a standard sanitary landfilling treatment process.
Sustainability 14 14961 g008
Figure 9. Sensitivity analysis between the base case system (blue) and that with Ecoinvent data (orange).
Sustainability 14 14961 g009
Figure 10. Evaluation of the benefit brought by the CHP unit in the system.
Sustainability 14 14961 g010
Figure 11. Comparison analysis of the system with and without the CHP functioning.
Sustainability 14 14961 g011
Figure 12. Top view of the proposed PV plant (dashed red lines represent the building area where the MBT is located, and yellow ones denote the perimeter of the digester section).
Sustainability 14 14961 g012
Figure 13. LCIA of the system with PV integration.
Sustainability 14 14961 g013
Figure 14. Uncertainty analysis related to PV implementation.
Sustainability 14 14961 g014
Figure 15. Process diagram of the gasifier combined with the steam power plant unit.
Sustainability 14 14961 g015
Figure 16. LCIA of the facility integrated with the gasifier compared to incineration (orange) and landfilling (yellow).
Sustainability 14 14961 g016
Table 1. Performance data of the CHP unit.
ParameterCHP
100% Load75% Load50% Load
Electrical Power [kW]700525350
Thermal Power [kW]379309242
Fuel Consumption [kW]16641290920
El. Efficiency42.140.738
Th. Efficiency41.543.746.8
Total Efficiency83.684.484.8
Table 2. Energy distribution in the system boundary.
ActivityAmount [mg/Nm3]
Nominal Power [kW]Annual Consumption [kWh]% of the Total
Anaerobic Digesters50247,8475.5
Volumetric Dome82467,35910.4
Biofilter5852,160,23148.1
Aerobic stabilization114441,3439.8
Biotunnel105483,26710.8
Landfill75197,8924.4
Waste pre-treatment203496,50711
Table 3. Gaseous emissions from the system.
ElementAmount [mg/Nm3]
BiofilterCHPICE
Particulates-1.243
TOC64.511693
CO-89373
NOX-147272
SO2--1
HCL--3
H2S0.035--
NH34.64--
VOS4.71--
Table 4. Liquid Pollutants present in the wastewaters.
ElementAmount [mg/L]
LeachatesWastewater
COD16,11013,678
N (as Ammonia)352820,791
Chlorine280921,109
Metals37559
Phenols435
Toluene0.01-
Table 5. High quality compost composition.
ElementHigh-Quality Compost (HQC)
AmountU.M.
Metals (1)224.46mg/kg
Potassium1.53% d.b.
Sodium1.26
Calcium3.92
Magnesium0.77
TOC45.48
TON95.83
C/N ratio19.41
(1) Contains lead, nickel, cadmium, mercury, copper, chromium, selenium, arsenic and zinc.
Table 6. Outcome of the Monte–Carlo simulation.
Impact FactorMonte Carlo Analysis—Variation in Percentage Terms
Best CaseWorst Case
Abiotic depletion−33%64%
Abiotic depletion (fossil fuels)−25%24%
Acidification−23%44%
Eutrophication−44%97%
Fresh water aquatic ecotox.−58%140%
Global warming (GWP100a)−41%71%
Human toxicity−54%108%
Marine aquatic ecotoxicity−52%100%
Ozone layer depletion (ODP)−43%76%
Photochemical oxidation−47%81%
Terrestrial ecotoxicity−66%246%
Table 7. Chemical properties of the residual waste produced by the MBT unit.
Residual MSW PropertyValue (Best Estimate)U.M.
Dry residual at 105 °C25%
Ash content (600 °C)1.2
Hydrogen (d.b.)8.43
Total Organic Carbon (TOC)418g/kg
Density0.61g/cm3
LHV21800KJ/kg
Table 8. Characterization of the impact factors related to the scenarios compared to RDF gasification implementation.
Impact Factor
Characterization
CASE
Base CaseRDF GasificationIncinerationSanitary Landfill
AB[kg Sbeq]9.36864 × 10−68.37439 × 10−66.40124 × 10−51.26672 × 10−5
ABFF[MJ]230.9462169226.421873218.839066143.3276608
GWP[kg CO2eq]137.3503973203.8017347512.6599606623.1065875
ODP[kg CFC-11eq]2.18394 × 10−62.16154 × 10−62.85011 × 10−61.09273 × 10−6
HT[kg 1,4-DBeq]13.9451891512.424043583.3846656819.89651147
FWEX[kg 1,4-DBeq]2.766457322.48051932628.297276252.329612823
MWEX[kg 1,4-DBeq]172603.0985153130.3439266897.9012245536.5574
TREX[kg 1,4-DBeq]0.3654224280.3621407460.5491523470.042360738
PHOX[kg C2H4eq]0.0256671170.0151706770.004873310.133445373
AC[kg SO2eq]0.1380551570.1290161360.1969959170.108478345
EU[kg PO4eq]0.6967893950.6474383670.0690822040.582796912
Publisher’s Note: MDPI stays neutral with regard to jurisdictional claims in published maps and institutional affiliations.