Abstract
This paper presents a detailed analysis to optimize natural ventilation performance in educational buildings to minimize the probability of viral infection (POI) and avoid draught discomfort. A whole building energy simulation tool has been coupled with the Wells–Riley equation to predict the probability of infection and Fanger’s draught equation to estimate the draught risk for classroom environments. Several parameters have been investigated, including window opening fraction (WOF), volume-to-student ratio, number of source patients, and exposure time. The analysis confirmed a dual effect of space volume on the POI where the POI can be increased or decreased simultaneously when the space volume is increased. Therefore, the WOF/(Volume/Student) ratio is introduced, and an optimization analysis is performed to determine the optimum ratio that delivers the lowest POI. The results showed that a WOF/(Volume/Student) ratio between 0.1 and 0.17 is recommended to guarantee low values of POI for a standard Volume/Student ratio of 6 m3. Even though high ventilation rates are required to prevent viral infection, it will certainly increase the draught risk. Therefore, optimal ventilation rates are required to maintain low POI and minimum draught risk, which can be achieved by optimum design of windows and implementing control systems for window operations to minimize turbulence effects and reduce the possibility of draught discomfort.
1. Introduction
Building ventilation is the main strategy for replacing contaminant indoor air with fresh outdoor air through natural or mechanical means [1]. Natural ventilation is the intentional movement of air from the outdoors to the indoors typically driven by wind forces or buoyancy effect caused by temperature differences without the use of mechanical systems. These natural driving forces are normally produced through operable windows and pressure differences between spaces. These forces can drive the flow of fresh air through and within a building, moving from a high-pressure to a low-pressure zone. Indeed, natural ventilation is considered an efficient strategy for reducing cooling energy use of buildings in some cases in addition to improving indoor air quality by diluting pollutants and minimizing the impact of bacterial and viral infections.
From an operational standpoint, natural ventilation could be considered a simple system; however, high air change rates can be achieved when specific design techniques are implemented. It is worth noting that buildings operating with mechanical ventilation systems are associated with more Sick Building Syndromes (SBS) such as headache, dizziness, and throat irritation compared to buildings depending merely on natural ventilation systems [2,3,4]. Nevertheless, the extensive use of mechanical ventilation systems and their possible negative impact on the occupants and the environment offered the opportunity to sustainable strategies and passive systems, such as natural ventilation systems, to spread widely as a sustainable supplementary solution [5]. On the other hand, natural ventilation could be a reliable system to improve IAQ for most buildings, especially for those characterized as high occupancy density buildings, such as educational buildings. For classrooms, natural ventilation is considered as one of the most commonly used sustainable solutions capable of providing high ventilation rates to ensure healthy and productive indoor environment while reducing energy use compared to other ventilation strategies [6,7].
IAQ is associated strongly with human health, and is usually defined as the ability to meet human needs [8]. Human needs have many requirements that must be considered during the designing stage of a building. Recently and after the COVID-19 pandemic, people have been showing a special interest in the health aspect of the indoor environment where air pollution levels often exceed the outdoor environment, while approximately 90% of the people spend most of their time in indoor spaces [9,10]. Nevertheless, improving the IAQ of existing classrooms can be challenging if conventional design features are considered. High ventilation rates could be achieved with natural ventilation as stated above; however, there are several factors that could influence the performance of natural ventilation such as outdoor climate conditions, building geometry, and the design of the building envelope [11]. Recent studies discussed the important role of natural ventilation in improving the quality of the indoor environment. One of the studies investigated the IAQ in eight different schools while evaluating and proposing solutions to improve it through natural ventilation strategies, which showed positive results [12]. A study conducted by Ma’bdeh et al. [13] proved that through some architectural modifications to a classroom building, especially in hot climate areas, the IAQ can be enhanced, which in turn improves students’ academic performance and provides a healthy environment for them. The study used computer simulations to analyze the rate of natural ventilation in the classroom building before and after the architectural improvement. The results showed positive indicators and improvement of the rate of natural ventilation after the architectural modifications. Furthermore, natural ventilation systems can directly affect IAQ; however, due to the large number of parameters such as opening types, dimensions, orientations, air distribution, etc., accurate predictions of the performance of natural ventilation can be hard to quantify and control [14].
Moreover, a number of studies investigated the interaction between human and indoor microbial contamination in indoor spaces [10,15,16]. The transmission and spread of these microbial and viral particles typically happen through airborne means and the interaction with indoor building surfaces. It is worth mentioning that a large number of studies routed the impact of airborne transmission diseases to human health [17,18,19]. Many previous studies indicated that natural ventilation reduces the risks of infection and airborne diseases, and there is recent scientific evidence that supports the validity of the outcomes of these studies [20]. In fact, the relationship between airborne infection and ventilation systems has been discussed extensively in the literature. Most of these studies have introduced mathematical models to explore the viral dynamics and investigate pathogenic characters of viral infection [21]. However, the most recognized method used for evaluating the impact of ventilation strategies on viral transmission in buildings is Computational Fluid Dynamics (CFD). In addition, CFD modeling has also been used to monitor microbial spread and airborne cross-infection [22]. In fact, CFD has long been utilized as an effective and efficient method to accurately analyze air distribution and precisely visualize airflow patterns and contaminant movements in enclosed spaces. For example, a recent numerical study conducted by Wang et al. [23] explored cross-transmission of pollutants for a single-sided natural ventilation. This study indicated that the risk of infection decreases when increasing the ventilation rate; however, the risk of infection is not quantified in this research study. In another study presented by Lipinski et al. [24], several ventilation strategies have been analyzed using CFD to examine risk reduction in pathogen transmission in buildings. Furthermore, a recent study investigated the likelihood of COVID-19 airborne transmission for various scenarios of aerosol droplets dilution and transport using CFD along with Monte-Carlo simulations to quantify the exposure time of aerosol for indoor environments [25]. Moreover, Peng et al. [26] reviewed several studies that have investigated pathogen transmission through CFD simulations and concluded that natural ventilation is considered the main method to dilute pathogen concentrations. CFD modeling has also been utilized to explore the evolution of coughed droplets for various ventilation patterns in air-conditioned space [27]. Additionally, airborne contaminant transmission has been evaluated in a hospital and laboratory settings using airflow simulation environment that couples CFD with a multizone network software [28]. Some research studies utilized other modeling techniques besides CFD such as empirical models and dynamic airflow modeling using EnergyPlus to evaluate indoor pollutants and viral infection transmission in naturally ventilated buildings [29,30].
The Wells–Riley model has been used in various recent research studies to estimate the probability of infection in buildings to enhance ventilation techniques in order to minimize the probability of airborne infection. This mathematical model assumes a steady-state quanta generation rate delivered by infected people and a ventilation rate term responsible for diluting the quanta concentration of the virus [31]. Therefore, according to this model, increasing the ventilation rate will exponentially reduce the probability of infection in buildings. Hence, many research studies explored the influence of ventilation rates on infection transmission in buildings either delivered naturally through windows or delivered by mechanical ventilation systems. For instance, Dai and Zhao [32] evaluated the relationship between ventilation rates and the probability of infection in buildings using the Wells–Riley model and determined the quantum generation rate value of COVID-19. Additionally, Kurnitski et al. [33] used the Wells–Riley model to develop a simplified ventilation equation capable of estimating the ventilation rate of particular quanta emission rates in order to reduce infection risk in buildings. On the other hand, mechanical ventilation has also been evaluated to improve ventilation performance to minimize infection risks. A recent study by Sha et al. [34] presented a modified Wells–Riley model to investigate the effect of mechanical ventilation on airborne viral infection by combining ventilative cooling rate and dilution ventilation rate. Another recent study introduced by Stabile et al. [35] performed simulation analysis of typical school scenarios to estimate the required mechanical and natural ventilation rates to prevent virus transmission. It is worth noting that limited research studies applied the Wells–Riley model to estimate the probability of infection in the context of multizone building environments. For instance, Yan et al. [36] estimated viral infection risk of SARS-CoV-2 for a mechanically ventilated multizone building using CONTAM simulation software. Additionally, Alaidroos et al. [30] investigated the probability of infection of a naturally ventilated historical building using the EnergyPlus Airflow-Network model along with the Wells–Riley model to estimate the probability of infection for various natural ventilation rates.
Indeed, high ventilation rates are most of the time necessary to maintain acceptable indoor air quality as mentioned above; however, high ventilation rates might cause high indoor air velocities that could lead to uncomfortable draught in the occupied spaces [37]. According to ASHRAE Handbook of Fundamentals [38], draught is “an undesired local cooling of the human body caused by air movement” and is classified as one of the most annoying factors affecting indoor environmental comfort in ventilated spaces. Therefore, it is crucial to investigate the characteristics of airflow within the indoors and its impact on draught and occupant comfort especially for naturally ventilated spaces where airflow turbulence is commonly occurred due to air velocity fluctuations [39]. Generally, in ventilated spaces, periodic fluctuation of air velocity commonly exists which causes turbulence. In fact, air turbulence is known to cause draught complaints more than laminar (nonfluctuating) airflow [40]. Moreover, several studies showed that complaints of draught increase with the increase in turbulence intensity [37]. This explicit relationship between turbulence intensity and draught complaints is due to the increase in convective heat transfer when turbulence increases [41].
The earlier studies that investigated the effect of draught on occupants’ discomfort focused on examining the local air movement around an occupant’s head and ankles, which was the first to conclude that indoor discomfort is increased with the increase in indoor air velocity [42,43]. However, these studies did not take occupants’ thermal perceptions into account; thus, it was hard to determine the exact influence of draught in contrast to the overall occupant’s comfort. Afterwards, a series of experiments were conducted to analyze the characteristics of air movement and its impact on the overall comfort for occupants who were thermally neutral. Specifically, Fanger and Pedersen [44] explored the effect of air velocity, periodical fluctuation of airflow, and air temperature on draught discomfort. They confirmed the relationship between air velocity and draught discomfort in addition to finding that a fluctuating airflow leads to more discomfort conditions than a constant airflow. Furthermore, Fanger and Christensen [45] also found in another experimental study that turbulent airflow significantly influences the sensation of draught. Yet, in this study, the turbulence intensity was kept within the range of 30% to 60%. Therefore, another related study conducted by Fanger et al. [40] expanded the previous findings by applying three levels of turbulence intensities (low: less than 12%; medium: between 20% and 35%; high: greater than 55%). Hence, turbulence intensity was integrated into the new draught model which has since been adopted in indoor thermal comfort standards such as ASHRAE 55 [46] and ISO 7730 [47] to predict the percentage of dissatisfaction from draught.
Few recent studies have discussed the influence of ventilation on draught risk; for instance, Mumovic et al. [48] revealed that mechanical and hybrid ventilation systems in new secondary schools usually causes draught problems where the draught risk is above 15% most of the time. It is to be noted that the risk of draught should always be less than 15% in the occupied spaces according to the ASHRAE thermal comfort standard [49]. Another investigation conducted by Deng and Tan [50] explored the effect of low air temperatures and outdoor wind speed on the draught risk in a naturally ventilated office building. Moreover, Markov et al. [51] also discussed the possible problems with the draught assessment procedure provided by ISO 7730:2005 [47] when strong fluctuations in airflow is anticipated in university classrooms. Additionally, Conceição et al. [52] a conducted a numerical study to predict the draught risk in addition to IAQ and indoor thermal comfort for a classroom with desk-type personalized ventilation system.
As discussed earlier, numerical simulation methods are commonly used to analyze and evaluate ventilation system effectiveness on minimizing airborne infection transmission in buildings. The numerical modeling techniques presented in the literature are used successfully to visualize contaminants distribution and airflow patterns; however, the vast majority of these numerical simulation packages are not capable of estimating the impact of airborne viral transmission on occupant’s infection rate inside buildings. In fact, there is a lack of research studies to predict the probability of infection based on the ventilation rates in naturally ventilated buildings, especially for educational buildings where occupancy density is commonly high. In addition, occupants’ discomfort due to draught caused by high ventilation rates is a common issue in naturally ventilated buildings that has not been extensively studied yet. Hence, optimal ventilation rates that serve the right balance of both viral infection prevention and minimum draught risk is a research gap that should be investigated. Therefore, the contribution of this research study is to provide a list of design recommendations to prevent airborne viral infection while avoiding draught discomfort through a comprehensive analysis of the effectiveness of natural ventilation for educational buildings.
This study will use a classical mathematical model that predicts the probability of infection using several variables such as ventilation rates, duration of exposure to infectors, and the number of source patients. In addition, Fanger’s draught model will be used to estimate the draught risk in this study. A whole building energy simulation tool is utilized to investigate the influence of climate conditions and building design characteristics and to predict hourly ventilation rates which are then fed to the models to analyze the probability of infection and the draught risk for each time step.
2. Materials and Methods
A typical classroom building in King Abdulaziz University–Rabigh branch has been selected as a case study for a thorough investigation of the effectiveness of natural ventilation for educational buildings. Rabigh is located in the western region of the Kingdom of Saudi Arabia on the red sea cost which features a sweltering and muggy days during summer and mild windy days during winter. The average annual wind speed is around 4 m/s while the maximum wind speed reaches up to 7.5 m/s. This prevalent outdoor wind speed commonly promotes desirable natural ventilation rates if the building is well designed to harvest and distribute the air evenly throughout the indoors. The analyses have been performed using EnergyPlus [53] to simulate natural ventilation using Rabigh’s TMY weather file. The 3D building model and the actual prototype building are shown in Figure 1. In particular, the Airflow-Network module in EnergyPlus has been utilized to analyze the building’s airflow distribution and ventilation rates. The Airflow-Network model can accurately simulate the airflows of multizone indoors produced from cross ventilation and stack effects, which has been validated through several experimental studies [54]. The selected classroom building is a three-story building with a gross floor area of 2758 m2 and an overall window to wall ratio of about 20%. Classrooms are rectangular and their dimensions are around 7 × 9 × 3 m (W × L × H) as illustrated in Figure 2. The classrooms buildings at KAU-Rabigh have a linear disposition which enables the placement of openings along the longer side of the rooms. This is a typical and representative case study in terms of construction, typology, and integration of environmentally driven design principles, and due to its standard characteristics, it has been selected to assess natural ventilation and spread of viral infection within classrooms.
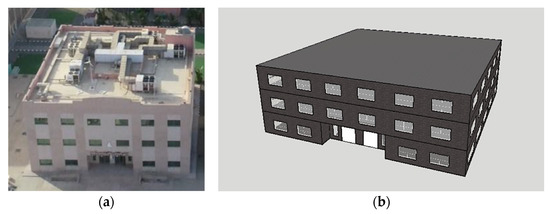
Figure 1.
The selected classroom building at KAU-Rabigh: (a) real building, (b) 3D rendering of the prototypical building model.
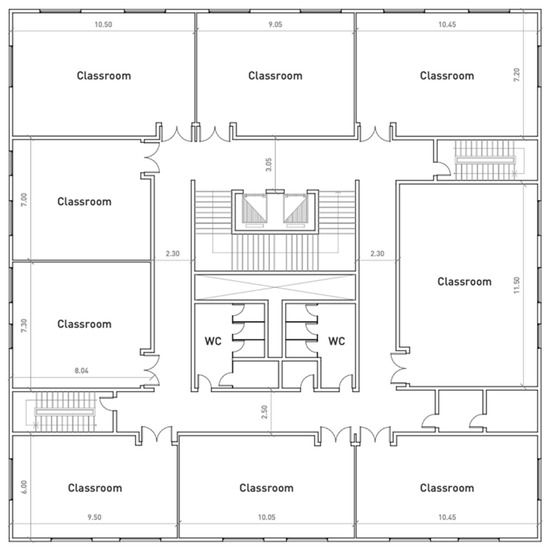
Figure 2.
Sample of the floor plan of the selected classrooms building.
There are several known means typically employed to improve indoor air quality in buildings. However, this research study focuses on evaluating the effectiveness of natural ventilation in controlling the spread of airborne virus transmission in buildings and to assess draught discomfort caused by high ventilation rates. As stated earlier, previous studies suggest a strong relationship between ventilation rates and concentrations of particulate matter in addition to microbial and virus transmission within buildings. However, ventilation rates, in the case of natural ventilation, are directly affected by specific parameters such as wind speed, building orientation, window to wall ratio, space volume, and window opening fraction; thus, these parameters could also affect the behavior of airborne transmission of viruses and the probability of infection in buildings. Accordingly, the emphasis will be on assessing the impact of ventilation rates produced by natural ventilation on the likelihood of infection of occupants in educational buildings to eventually recommend a list of design guidelines based on selected building parameters. Specifically, general analysis of the performance of natural ventilation is performed throughout the year for the selected educational building including the impact of building orientation and window opening fraction on the air change per hour of the building. Correlation analysis is then implemented for classrooms volume, ventilation rates, window opening fraction (WOF) and ventilation rates. Furthermore, sensitivity analysis is conducted to analyze the impact of selected parameters on the probability of infection (POI) including the number of source patients, class volume, window opening fraction. For easier and efficient analysis, new ratios are introduced such as the classroom volume to the number of students ratio which will be analyzed further against the WOF to explore their impact on the POI. Based on the outlined results, correlations are developed for a selected set of variables and stepwise regression is performed to develop a fit model to predict POI through specific design parameters. Optimization is then performed to find the optimum ventilation rate, classroom volume and WOF/(volume/student) ratio that delivers the lowest POI. Furthermore, draught risk is estimated for three levels of indoor airflow turbulence intensities, and the relationship between the probability of infection, draught risk and ventilation rates is analyzed. Finally, design guidelines for educational buildings are presented to optimize the performance of natural ventilation to prevent airborne transmission of viral infection in classroom spaces while reducing the chances of occupant’s complaints from draught discomfort.
3. Results and Discussion
3.1. General Analysis of Natural Ventilation
To analyze natural ventilation performance for the educational building, an initial model has been set for extreme conditions where all windows in all zones are assumed to be fully opened. It is to be noted that the analysis has been performed for the first floor to account for the worst-case scenario of wind speed since wind speed is normally found to be higher at higher elevations. An hourly simulation was performed for the whole year to analyze the ventilation rate of the building. In contrast, mechanical ventilation was turned off, and infiltration was set to minimum values, so it does not interfere with natural ventilation. As presented in Figure 3, the simulation results show typical average daily ventilation rate variations for the whole year. The annual ventilation rate values fluctuate between 13 and 43 Air Change Per Hour (ACH) with an annual average of 23 ACH. It is to be noted that ACH represents the number of times indoor air is completely replaced by fresh outdoor air in one hour. The average ventilation rate values presented in Figure 3 are desirable for an acceptable indoor air quality performance. However, as stated above, the building’s floorplan consists of several zones distributed around the building in different orientations. In Rabigh and the areas around it, most of the wind blows from the northwest; therefore, those zones located on the building’s northwestern orientation should have the highest ventilation rates. On the other hand, the northeastern exposures get the least wind. This, in turn, affects the overall performance of natural ventilation in the building, especially if cross-ventilation design techniques are not considered.
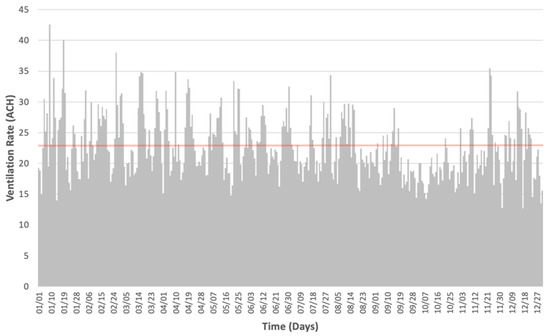
Figure 3.
Annual average ventilation rate for the building.
The selected classroom building design is considered typical where each classroom is isolated; thus, cross-ventilation could not be applicable in this case. Consequently, ventilation rates in classrooms for each orientation have been investigated to evaluate the impact of orientation on ventilation rates. Figure 4 shows the ventilation rate for building zones located in four different orientations. It is clear from the simulation results that most of the wind activity is coming from the northwest direction, which reflects the high ventilation rates in the building zones located on that side, which can reach up to 85 ACH in some incidences, while the average is found to be 39 ACH. On the other hand, ventilation rates in the northeast zones are constant for the whole year with around 7 ACH. Classrooms in different orientations, southeast, and southwest, have an acceptable average ventilation rate that swings between 17 and 25 ACH. According to the previous results, the northeastern direction should be avoided when distributing classrooms in the design stage to prevent low ventilation rates if natural ventilation is considered when designing the building.
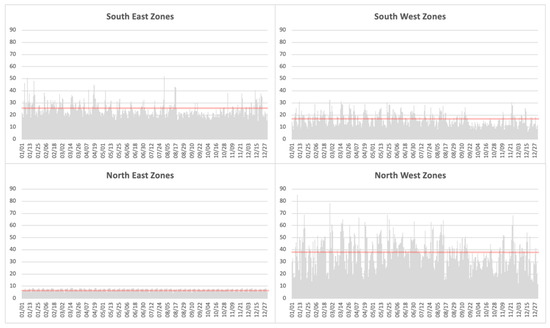
Figure 4.
Annual average ventilation rate for the building zones by orientation.
3.2. Influence of Window Opening on Ventilation Rates
Typically, windows are not opened fully all the time, especially for educational buildings located in inappropriate outdoor weather conditions; thus, it is necessary to assess the effect of the window opening area on the ventilation rates for the building. For this analysis, one zone located on the northwest side of the building has been selected. The average annual ventilation rate has been computed for various WOF, starting from 10% up to 100% with a 10% increment. As depicted in Figure 5, there is a clear linear relationship between the window opening fraction and ventilation rates for the selected classroom. Even though 10% window opening is considered small, there is still an acceptable ventilation rate, around 4 ACH, due to continuous and high wind speeds from the northwest. Ventilation rates higher than 15 ACH could cause drafting, which is undesirable, especially for classrooms. Therefore, a 30% opening fraction could be the right choice in this case. According to the results, for enhanced utilization of natural ventilation, it is recommended to use a control system to regulate the window opening based on the requirements of ventilation rates and indoor environmental quality constraints such as indoor temperature, humidity, air quality, and drafting if existed due to high wind speeds.
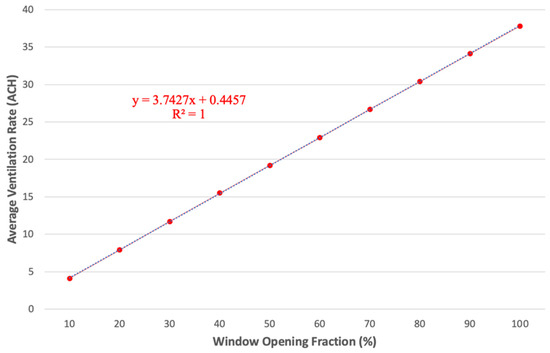
Figure 5.
Average ventilation rates for various window opening fractions for a classroom sample located on the northwest side of the building.
Based on the above findings, adequate ventilation rates could not be a problem if abundant wind is available. However, what is the effectiveness of the obtained ventilation rates on improving the indoor air quality of the building? According to ASHRAE standard 62.1 (Ventilation for Acceptable Indoor Air Quality) [55], the minimum outdoor air rate for lecture classrooms is 0.3 L/s⸱m2 this corresponds to 0.36 ACH for the analyzed classroom in this study. Accordingly, the building exceeds the minimum requirements by ASHRAE standard 62.1 to maintain acceptable indoor air quality. Yet, the question here is whether the obtained ventilation rates of the classroom analyzed above can minimize airborne transmission of viruses, thus lowering the probability of virus infection. In contrast, the World Health Organization (WHO) issued a guideline report for infection control in hospitals through natural ventilation requirements [56]. The guidelines stated an average ventilation rate of 160 L/s per patient for airborne precaution rooms. WHO’s above recommendation is presented solely for health care facilities; however, it is worth investigating the recommended ventilation rates by WHO in an educational building setting to determine if the available ventilation rates in the selected building are capable of eliminating the airborne cross-infection. According to the Neufert Architects’ Data [57], the classroom area should be 2 m2/student. The classroom analyzed in this study has an area of 71 m2, which means the acceptable number of students should be 35. If 10% of the students in the classroom are assumed to be infected, the number of infected students is about 4. Suppose the number of infected students is multiplied by the ventilation rate recommended by WHO (160 L/s per patient). In that case, it will return 640 L/s (about 11 ACH) as the required ventilation rate for this specific classroom. According to the simulation results presented in Figure 5, a 30% window opening fraction will provide a ventilation rate of 12 ACH, which exceeds the WHO’s ventilation rate for health care settings.
3.3. Analysis of Airborne Infection Risk
The above discussion indicates the effectiveness of natural ventilation on providing adequate ventilation rates that could exceed the WHO recommendations assigned for airborne precaution rooms. However, further analysis is necessary to confirm that the obtained ventilation rates for the building are sufficient to prevent airborne infection transmission. Therefore, to explore the impact of ventilation rates on the probability of infection, the Wells–Riley equation [58] is used to predict the probability of infection as presented below:
where P is the probability of infection transmission, I is the number of patients (infection source), q is the quantum generation rate produced by an infector, p is the respiratory ventilation rate of each susceptible, t is the exposure time, V is the volume of the enclosed space, and n is the air change rate of the ventilation system.
To apply this equation for COVID-19 specifically, this particular virus’s quantum generation rate should be determined. A recent research study by Dai and Zhao [32] introduced the range of quantum generation rates for COVID-19 through regression analysis using available quantum generation rates and basic reproductive numbers of other airborne transmitted infectious diseases from previous studies. The range of quantum generation rate (q) for COVID-19, according to Dai and Zhao [32], is found to be between 14 and 48 (quanta/h).
Before continuing further with the analysis, validation of the Wells–Riley model is performed. Actual data of COVID-19 cases reported in the literature [59,60,61] were used and a comparison between the predicted POI and the real cases POI is presented. Table 1 summarizes the details of the actual infection cases of COVID-19 along with the values of reported ventilation rates, exposure duration, respiratory ventilation rate, and the quantum generation rate for each case. Table 2 shows the comparison between the predicted results and actual values of POI and number of infected people for each case. According to the results presented in Table 2, acceptable agreement is observed between the predicted results of the Wells–Riley model and the actual reported values of the infection cases with an average difference of 6.9% between the predictions and actual data.

Table 1.
Summary of the reported information of the COVID-19 actual cases.
Table 2.
Comparison between the prediction and actual values of POI and number of infected people.
For a preliminary analysis, the parameters of the Wells–Riley equation have been assumed and summarized in Table 3. Only one infection source (patient) is assumed for the initial analysis. Since the students are seated in the classroom, a value of 0.3 m3/h is assumed for the respiratory ventilation rate, which corresponds to occupants with indoor light activity. A five-hour duration of exposure has been set to examine an extremely long exposure to the infectors. A sensitivity analysis of the number of source patients is presented afterward.
Table 3.
List of the parameter’s values used in the Wells–Riley equation.
The annual ventilation rate values obtained from the simulation results of the fully opened window scenario have been substituted in the Wells–Riley equation, and the probability of infection has been predicted for this particular case. The results shown in Figure 6 demonstrate a clear exponential decay curve where the probability of infection is diminished with the increase in ventilation rate. The results indicate that the probability of infection is found to be below 0.1 when the window opening fraction is set to 30% or larger. In fact, the dilution of contaminants could reach high levels when the window opening fraction is set to 80% or larger. This is depicted in Figure 6 where the probability of infection diminishes with values lower than 0.04. Keep in mind that the results shown in Figure 6 represent the results of a one-source patient. Indeed, the probability of infection will increase with the increase in the number of source patients. Therefore, to explore the effect of the number of patients that can transmit the infection on the probability of infection in the analyzed class, a sensitivity analysis has been performed. The simulation results in Figure 7 shows that the more infection sources are inside the space, the larger the probability of infection it will get. Yet, the results indicate the high impact of ventilation rates on the probability of infection even with large numbers of source patients. Infection transmission could reach very high levels if the ventilation rate is lower than 5 ACH, which could get close to 0.9 if the number of source patients equals 10. On the other hand, moderate ventilation rates above 35 ACH help keep the probability of infection below 0.1 despite the number of source patients. It is worth noting that these high values of ventilation rates are commonly obtained through natural ventilation. Detailed analysis is recommended if mechanical ventilation is utilized to deliver high ventilation rates such as those presented in this analysis to prevent high energy consumption implications.
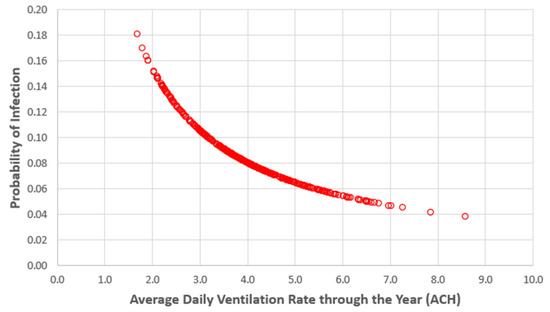
Figure 6.
Probability of infection as a function of average ventilation rate for one infector.
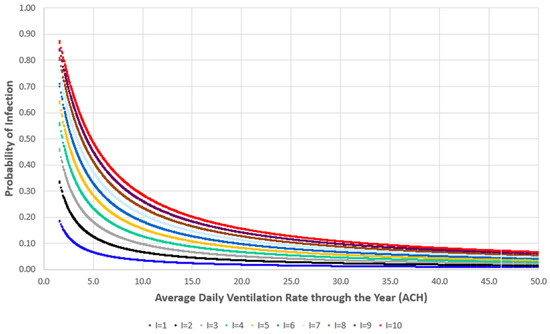
Figure 7.
Probability of infection as a function of average ventilation rate and number of source patients (infectors) in the building.
3.4. Optimized Classrooms to Minimize Airborne Infection
The above discussion demonstrated the significant impact of ventilation rates on the probability of infection for educational buildings. However, the main point worth discussing is what are the design parameters that have the most influence on natural ventilation? Additionally, what are the optimum values of these parameters to ensure optimum performance of natural ventilation? In order to answer these questions, two variables have been selected assumed to have the highest effect on ventilation performance, which are the opening fraction of windows and the volume of the space. For this analysis, the classroom volume has been varied by a fraction from 0.1 to 1 with a 0.1 increment where 1 means 100% of the actual volume of the classroom and 0.1 means 10% of the actual original classroom volume. Figure 8 illustrates the values of ventilation rates based on the change of volume (represented as normalized volume) and the change of window opening fraction. According to the simulation results, there is an exponential relationship between the space volume and the ventilation rate, where ventilation rates increase exponentially with the decrease in space volume. On the other hand, ventilation rates will increase with the increase in window opening fraction, as stated previously. So far, the results make sense as long as high ventilation rates are the only target. However, after a closer look at Equation (1), an inverse relationship is observed between the space volume and the probability of infection, meaning that increasing the volume of the space will decrease the probability of infection, as shown clearly in Figure 9. According to the stated observation, a dilemma is emerged, and the following question should be answered: should the volume be increased to reduce the probability of infection, or should the volume be decreased to increase the ventilation rate that will in turn minimize the probability of infection? Indeed, there should be an optimum value of the space volume that can assist in delivering the acceptable ventilation rate to maintain the lowest probability of infection for the classrooms.
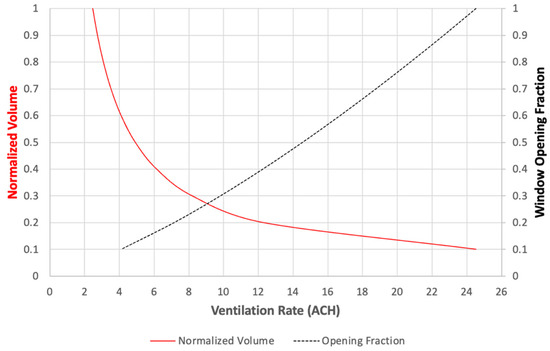
Figure 8.
The effect of classroom volume and window opening fraction on ventilation rate in classrooms.
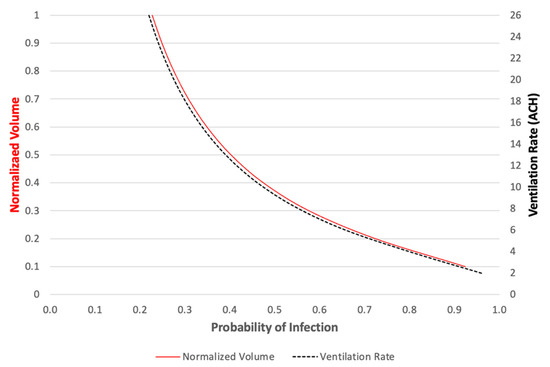
Figure 9.
Comparison between the effect of classroom volume and ventilation rate on the probability of infection in classrooms.
According to the analysis presented so far, two parameters are considered critical when analyzing the probability of infection (POI) for classrooms, which are WOF and the enclosed space volume. For efficient and easier analysis, the two stated parameters are presented in one inclusive ratio defined as the WOF by the volume-to-student ratio. An optimization analysis has been performed to determine the optimum ratio of WOF and volume that delivers the lowest POI. Based on the optimization results shown in Figure 10, the higher the ratio of WOF/(Volume/Student) the lower the POI values. For this particular classroom design condition, the value of the optimum WOF/(Volume/Student) ratio is found to be one that returns a POI value of 0.006. For a ratio of 1, the WOF should equal to 100%, and the Volume/Student equals to 1 m3. The recommended Volume/Student value is very small and unacceptable according to standards even though the POI has been eliminated. For practical values of Volume/Student ratio and WOF, constraints have been applied for Volume/Student ratio values that correspond to minimum area requirements for classrooms according to Neufert Architects’ Data [42]. Figure 10 shows the results in red dots, which denotes the Volume/Student ratio values that are equal to or greater than 6 m3/student. Hence, POI with values less than 0.05 could be achievable for WOF/(Volume/Student) ratio between 0.1 and 0.17 which corresponds to Volume/Student ratio of 6 m3 and an optimum WOF of 100%. However, due to the large window opening fraction, ventilation rates exceed acceptable limits, which can reach up to 120 ACH and produce undesirable air draught currents. Yet, POI with values around 0.07 is observed when ventilation rates swing between 40 and 60 ACH, which is considered acceptable.
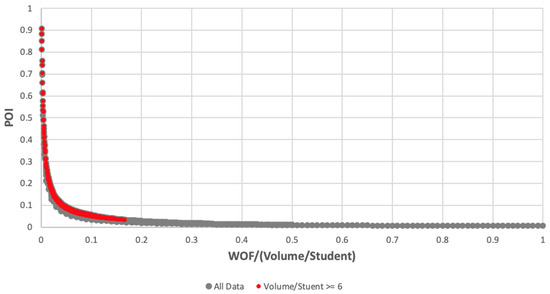
Figure 10.
Impact of the ratio of window opening fraction to the classroom volume-to-student ratio on the probability of infection.
The above results and discussion demonstrate the implications of outlining an ideal design solution of natural ventilation to minimize the probability of infection in classrooms, especially when standard space areas and number of students are considered. Optimum design solutions, for this case, could be even more complicated when considering outdoor climate conditions in addition to building design parameters and indoor conditions. Utilizing control systems tailored to achieve optimal natural ventilation performance to eliminate virus infection in classrooms is a promising strategy. Optimized control algorithms can be developed to operate windows with specific cost functions and constraints where all related parameters are measured instantaneously for accurate control decisions.
The data obtained through simulations in this research study have been used to produce an empirical model that can predict the probability of infection with new input variables such as WOF and WOF/(Volume/Student) ratio for classrooms. This model can be utilized for initial design stages when evaluating natural ventilation and its impact on airborne infection transmission. The following variables are considered: ventilation rates, WOF, space volume, number of students, and number of infected students. Stepwise regression analysis is carried out using R (a data analysis programing language) [62] to develop a fit model for POI with two independent variables: WOF and WOF/(Volume/Student) ratio. Equation (2) below represents the regression model used to predict the POI. The values of the model coefficients shown in Equation (2) are listed in Table 4.
Table 4.
Coefficients values of the POI fit model presented in Equation (2).
The model offers acceptable accuracy with an R2 of 0.78. Verification analysis has been performed to verify the accuracy of the model through a validation set of data selected from the simulation predictions. The results suggest fair predictions compared to the original simulation results with a coefficient of variation of the Root Mean Square Error (RMSE) equal to 3.9% which measures the variability of errors between the original data and model predictions. The developed empirical model presented above has been used to re-predict the probability of infection (POI) based on a wide range of WOF and volume-to-student ratio (V/St) for classrooms located in Rabigh’s climate. The results are then used to produce a contour plot, as shown in Figure 11, that demonstrate the relationship between WOF and V/St and their combined effect on the probability of infection for the classrooms. The contour plot illustrated in Figure 11 reveals that low POI is achievable when about 10% increment of WOF is applied for each 0.5 increase in classroom volume-to-student ratio. In this case, the POI is kept below 0.1 for all classroom sizes and occupancy density. Furthermore, Figure 11 can be used as a simple guide for the required opening fraction of the windows depending on the size of the classroom and the number of students occupying the classroom. However, it is worth noting that this particular POI contour plot is only applicable for classroom buildings located in climate conditions such as that of Rabigh with its special wind speed and wind direction which is considered a limitation. Hence, comparable contour plots accounting for wind speed and wind direction as independent variables should be produced to develop general correlations that work for various climate conditions.
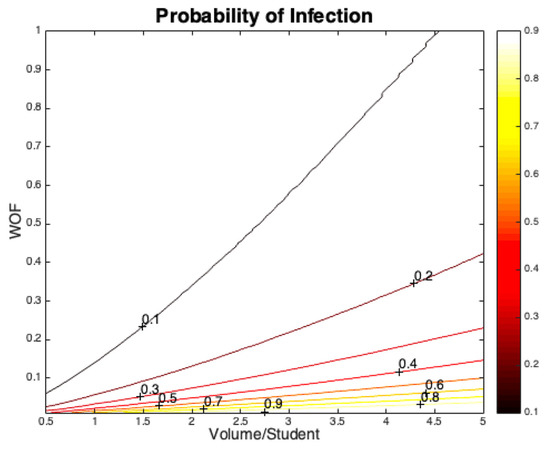
Figure 11.
Predictions of the probability of infection for a classroom based on windows opening fraction and volume-to-student ratio using Equation (2).
3.5. Analysis of Draught Risk
Designing optimum ventilation systems that deliver air distribution without draught issues is an essential design requirement to prevent indoor thermal comfort dissatisfaction and draught complaints. The latest Fanger et al. model [40] has been used in this study to quantify the draught risk of the natural ventilation system in the building. The turbulence intensity is first calculated by dividing the root mean square of the velocity fluctuation inside the building by the mean velocity as shown in Equation (3) below.
The root mean square of the velocity fluctuation (RMS) can also be estimated for three levels of turbulence (low, medium, and high) using the following regression equations developed by Fanger et al. [40]:
The mean indoor air velocity in the building is dependent on the window opening fraction and the average ventilation rates throughout the building. Figure 12 illustrates a selected sample of indoor mean air velocity against calculated turbulence intensities using the above correlations for various turbulence intensity levels. Typically, in actual operational settings of ventilated spaces, various turbulence intensities might occur depending on the indoor and outdoor conditions. Therefore, the three levels of turbulence intensities shown in Figure 12 were used to predict the draught discomfort rating for the indoors. The draught rating is estimated as a function of mean air velocity, indoor air temperature and turbulence intensity as shown in Equation (5), where Ta is the average indoor air temperature, is the mean indoor air velocity, and Tu is the turbulence intensity. The average indoor air temperature has been assumed to be 23 °C since the DR model was developed in an experimental setting at 23 °C. It is to be noted that this model is applicable for certain conditions where the occupant’s body is at thermal neutrality, and occupants are wearing normal indoor clothing while conducting sedentary activities [40].
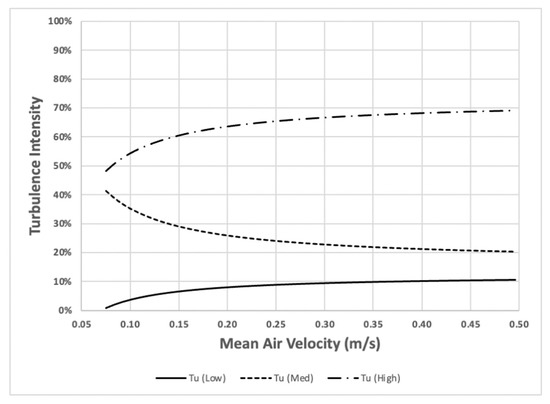
Figure 12.
Turbulence intensity as a function of mean air velocity for the analyzed building.
The simulation results show a clear and expected correlation between ventilation rates, air velocity, and draught rating. As depicted in Figure 13, increasing ventilation rates leads to increasing indoor air velocity which in turn increases the draught rating. For instance, a significant increase in ventilation rate from 45 to 90 ACH increases the indoor mean air velocity from 0.1 to 0.2 m/s which in turn will increase the average DR from 7% to 19%. These results confirm the significant impact of the ventilation rate on the draught rating and eventually on occupant’s discomfort. In fact, draught risk could reach up to 100%, which means 100% discomfort due to draught, when very high ventilation rates are observed (above 200 ACH). These high ventilation rates are achievable when all windows of the building are fully opened.
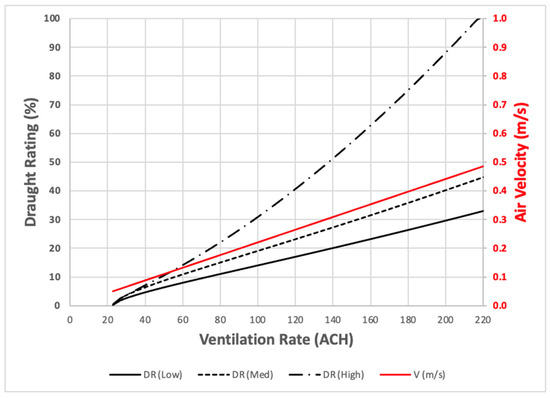
Figure 13.
Relationship between ventilation rates, air velocity, and draught rating for the analyzed building.
The effect of ventilation rate on the probability of infection and viral transmission has been demonstrated and discussed in the previous section. The analysis confirms the logical consequences of increasing the delivery of fresh air into the building by increasing the dilution of contaminants (reducing the concentration of viruses in this case). However, high rates of ventilation might cause occupants’ discomfort as illustrated in Figure 13. Therefore, a precise ventilation rate is required to prevent viral infection (minimum POI) while lowering the risk of draught discomfort (minimum DR). A detailed simulation analysis was performed to analyze the interrelationship between ventilation rates with both POI and DR. The number of infectors has a significant influence on the estimated POI, as discussed earlier in Figure 7; therefore, the analysis has been conducted for a range of number of infectors to number of students ratio (#infectors/#students). A priority constraint has been specified by defining a POI threshold equal to 0.01. The value of required ventilation rate is then identified, and DR is computed for three levels of turbulence intensity (low, medium, and high). Figure 14 shows a sample of the analysis results. The results clearly suggest that very low POI can be maintained, as low as 0.01, for all #infectors/#students ratios; however, very high ventilation rates are required for higher infectors ratios to keep the POI constant at 0.01 which can easily cause DR values to rise significantly and thus increasing the risk of draught discomfort especially when assuming high turbulence intensity cases. It is worth noting that the higher the ventilation rate the larger the gap between DR of low turbulence intensity and DR of high turbulence intensity. In specific, the difference between DR for high and low turbulence intensities for 27 ACH is about 25% required for a 3% infector/student ratio. On the other hand, the difference between DR for high and low turbulence intensities for 200 ACH is about 67% required for a 25% infector/student ratio.
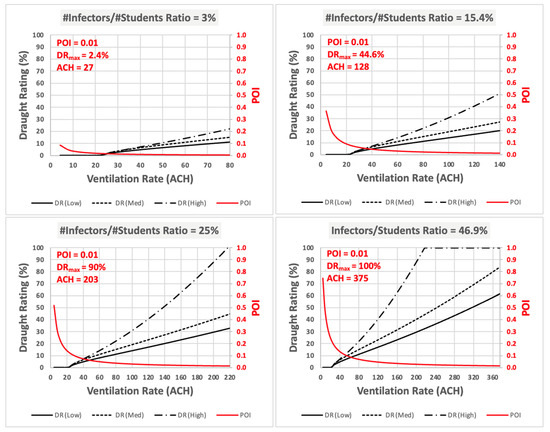
Figure 14.
Selected results of the effect of the number of infectors to number of students ratio on the optimal ventilation rate and the resultant draught rating for a 0.01 POI threshold.
It is to be noted that ventilation rates in naturally ventilated buildings are significantly influenced by several factors such as wind speed, wind direction, opening area, orientation of the building, and the volume of the space. Therefore, high ventilation rates, including extreme rates, could be achievable if certain conditions are met through factors mentioned above. In fact, some research studies available in the literature demonstrated high ventilation rates through simulations and experimentations as listed in Table 5.
Table 5.
Previous studies demonstrating high ventilation rates for naturally ventilated buildings.
Table 6 below shows the results for more values of the infectors/students ratio and the amount of increase in DR between high and low turbulence intensities. The results indicate a clear exponential increase in DR with the increase in the infectors/students ratio until it reaches a 100% maximum draught rating at 27% infectors/students ratio where the difference in DR between high and low turbulence intensities start to decline. As the simulation results imply, a large reduction in draught risk is achieved if the turbulence intensity within the space is controlled to ensure low turbulent airflow of the ventilated indoors. Successful control of turbulence intensity will offer a chance for delivering higher ventilation rates to prevent viral infections without jeopardizing occupants’ comfort due to high draught ratings. The following important question arises out of this analysis: is it possible to control the turbulence intensity of naturally ventilated spaces to minimize the draught risk when high ventilation rates of fresh air are supplied? This particular topic is worth being investigated to develop effective natural ventilation systems capable of preventing viral infection while reducing possible draught discomfort.
Table 6.
Ventilation rates and draught ratings to limit the probability of infection at 0.01 for different ratios of number of infectors by number of students in classrooms.
According to the analysis and results discussed in this study, some design recommendations are listed below to help in delivering optimal natural ventilation performance for acceptable indoor air quality and minimizing the probability of virus airborne infection:
- Classrooms should be located on the building side that provide enough wind speed for adequate ventilation rates. In general, for Rabigh and the surrounding west coast provinces, classrooms should not be located on the northeastern side of the building. While other orientations can provide sufficient ventilation rates, the northwestern orientation offers the highest wind speed throughout the year.
- There is an apparent association between classroom volume and air change per hour (ACH). In contrast, the opposite relationship is found between the classroom volume and the probability of infection (POI). This interrelationship between volume, ACH, and POI makes it challenging to determine the exact classroom volume that will offer adequate ACH with the lowest POI. Based on the analysis presented in this research study, the optimum value of Volume/Student is found to be 6 m3, and the ideal WOF is 100%. Yet, acceptable POI values are achieved for WOF between 30% and 100% depending on wind speed conditions.
- To keep the POI as low as possible in classrooms, about 8% of WOF is required for a volume-to-student ratio of 0.5. The WOF should then be increased exponentially for each additional 0.5 of volume-to-student ratio as denoted in Figure 11.
- Even though high ventilation rates are required to maintain a low POI, it will most likely affect occupants’ comfort by increasing draught risks due to turbulence effects. Therefore, a precise ventilation rate is required to achieve the right balance between POI and DR. This balance can be accomplished through an optimum design configuration of windows and classrooms in addition to control systems to operate the windows in order to minimize turbulence effects and reduce the possibility of draught discomfort.
4. Conclusions
This research study introduced a detailed analysis to evaluate the performance of natural ventilation in educational buildings to minimize the probability of viral infection (POI) and avoid draught discomfort. The study has been implemented for a selected classroom building at KAU-Rabigh and went through systematic analyses including parametric, sensitivity, and optimization analyses to investigate a list of parameters such as window opening fraction (WOF) and volume-to-student ratio. The results indicated a clear linear relationship between WOF and ventilation rates for the classrooms. A value of 30% WOF found to provide an acceptable ventilation rate that exceeds WHO’s recommended ventilation rates assigned for airborne precaution health care spaces. The analysis results confirmed achieving low values of POI when the WOF is set to 30% or larger. Moreover, the analysis revealed significant influence of both WOF and space volume on the ventilation rates; thus, these two variables were combined into one inclusive ratio defined as the WOF by the volume-to-student ratio. This ratio has been used in an optimization analysis to determine the optimum ratio that delivers the lowest POI. The optimization results suggested a ratio between 0.1 and 0.17 to achieve less than 0.05 POI values. This WOF by the volume-to-student ratio corresponds to a Volume/Student ratio of 6 m3. Additionally, a regression model has been developed using a large set of data from simulation results to predict the probability of infection with new independent variables including WOF and WOF/(Volume/Student) ratio. The analysis indicates that 8% of WOF is required to maintain low POI values for each additional 0.5 volume-to-student ratio.
This research study is not intended to provide finalized guidelines for preventing viral infections. Instead, the principal objective behind this research study is to identify the significant design parameters and their relationship to selected dependent variables through parametric and sensitivity analysis to deliver a balanced ventilation rate capable of minimizing viral infection transmission while avoiding draught discomfort. Finally, experimental measurements of natural ventilation rates and viral concentrations for educational buildings should be considered in future research to validate current simulation results and to develop generic correlations suited for a wide range of climates and building conditions.
Author Contributions
Conceptualization, A.A. and M.K.F.; methodology, A.A. and M.K.F.; software, A.A.; formal analysis, A.A.; investigation, A.A. and M.K.F.; resources, A.A. and M.K.F.; writing—original draft preparation, A.A. and M.K.F.; writing—review and editing, A.A. and M.K.F.; visualization, A.A. and M.K.F.; supervision, A.A.; project administration, A.A. and M.K.F.; funding acquisition, M.K.F. All authors have read and agreed to the published version of the manuscript.
Funding
This research was funded by Deanship of Scientific Research (DSR) at King Abdulaziz University, Jeddah, grant number G:377-829-1443.
Data Availability Statement
Data is available upon request.
Acknowledgments
This research project was funded by the Deanship of Scientific Research (DSR) at King Abdulaziz University, Jeddah (No. G:377-829-1443). The authors would like to acknowledge with thanks DSR’s technical and financial support.
Conflicts of Interest
The authors declare no conflict of interest.
Nomenclature
| Symbols | |
| P | Probability of Infection |
| I | Number of infection source |
| q | Quantum generation rate |
| p | Respiratory ventilation rate |
| t | Exposure time |
| V | Volume of the enclosed space |
| n | Air change rate of the ventilation system |
| St | Number of students in classroom |
| Ta | Average indoor air temperature |
| Tu | Turbulence intensity |
| Mean indoor air velocity | |
| RMS | Root mean square of the velocity fluctuation |
| DR | Draught Risk |
| Abbreviations | |
| WOF | Window Opening Fraction |
| POI | Probability of Infection |
| ACH | Air Change per Hour |
| TMY | Typical Meteorological Year |
| IAQ | Indoor Air Quality |
| CFD | Computational Fluid Dynamics |
| ASHRAE | American Society of Heating, Refrigerating and Air Conditioning Engineers |
References
- Kwan, S.E.; Shaughnessy, R.; Haverinen-Shaughnessy, U.; Kwan, T.A.; Peccia, J. The impact of ventilation rate on the fungal and bacterial ecology of home indoor air. Build. Environ. 2020, 177, 106800. [Google Scholar] [CrossRef]
- Mendell, M.J.; Smith, A.H. Consistent pattern of elevated symptoms in air-conditioned office buildings: A reanalysis of epidemiologic studies. Am. J. Public Health 1990, 80, 1193–1199. [Google Scholar] [CrossRef] [PubMed]
- Seppänen, O.; Fisk, W.J. Association of ventilation system type with SBS symptoms in office workers. Indoor Air 2002, 12, 98–112. [Google Scholar] [CrossRef] [PubMed]
- Seppanen, O.A.; Fisk, W.J.; Seppänen, O.A. Publication Date Summary of Human Responses to Ventilation; Lawrence Berkeley National Laboratory: Berkeley, CA, USA, 2004; p. 30. [Google Scholar]
- Chenari, B.; Carrilho, J.D.; da Silva, M.G. Towards sustainable, energy-efficient and healthy ventilation strategies in buildings: A review. Renew. Sustain. Energy Rev. 2016, 59, 1426–1447. [Google Scholar] [CrossRef]
- Ji, Y.; Lomas, K.J.; Cook, M.J. Hybrid ventilation for low energy building design in south China. Build. Environ. 2009, 44, 2245–2255. [Google Scholar] [CrossRef]
- El Asmar, M.; Chokor, A.; Srour, I. Are Building Occupants Satisfied with Indoor Environmental Quality of Higher Education Facilities? Energy Procedia 2014, 50, 751–760. [Google Scholar] [CrossRef]
- Fanger, P.O. What is IAQ? Indoor Air 2006, 16, 328–334. [Google Scholar] [CrossRef]
- Zhao, Y.; Sun, H.; Tu, D. Effect of mechanical ventilation and natural ventilation on indoor climates in Urumqi residential buildings. Build. Environ. 2018, 144, 108–118. [Google Scholar] [CrossRef]
- Meadow, J.F.; Altrichter, A.; Kembel, S.; Kline, J.; Mhuireach, G.; Moriyama, M.; Northcutt, D.; O’Connor, T.K.; Womack, A.M.; Brown, G.Z.; et al. Indoor airborne bacterial communities are influenced by ventilation, occupancy, and outdoor air source. Indoor Air 2014, 24, 41–48. [Google Scholar] [CrossRef]
- Zhao, B.; Liu, Y.; Chen, C. Air purifiers: A supplementary measure to remove airborne SARS-CoV-2. Build. Environ. 2020, 177, 106918. [Google Scholar] [CrossRef]
- Almeida, R.M.S.F.; Pinto, M.; Pinho, P.G.; de Lemos, L.T. Natural ventilation and indoor air quality in educational buildings: Experimental assessment and improvement strategies. Energy Effic. 2017, 10, 839–854. [Google Scholar] [CrossRef]
- Ma’Bdeh, S.N.; Al-Zghoul, A.; Alradaideh, T.; Bataineh, A.; Ahmad, S. Simulation study for natural ventilation retrofitting techniques in educational classrooms–A case study. Heliyon 2020, 6, e05171. [Google Scholar] [CrossRef] [PubMed]
- Zhang, X.; Weerasuriya, A.U.; Tse, K.T. CFD simulation of natural ventilation of a generic building in various incident wind directions: Comparison of turbulence modelling, evaluation methods, and ventilation mechanisms. Energy Build. 2020, 229, 110516. [Google Scholar] [CrossRef]
- Qian, H.; Zheng, X. Ventilation control for airborne transmission of human exhaled bio-aerosols in buildings. J. Thorac. Dis. 2018, 10, S2295–S2304. [Google Scholar] [CrossRef]
- Jayaweera, M.; Perera, H.; Gunawardana, B.; Manatunge, J. Transmission of COVID-19 virus by droplets and aerosols: A critical review on the unresolved dichotomy. Environ. Res. 2020, 188, 109819. [Google Scholar] [CrossRef]
- Morawska, L.; Tang, J.W.; Bahnfleth, W.; Bluyssen, P.M.; Boerstra, A.; Buonanno, G.; Cao, J.; Dancer, S.; Floto, A.; Franchimon, F.; et al. How can airborne transmission of COVID-19 indoors be minimised? Environ. Int. 2020, 142, 105832. [Google Scholar] [CrossRef]
- Xu, C.; Wei, X.; Liu, L.; Su, L.; Liu, W.; Wang, Y.; Nielsen, P.V. Effects of personalized ventilation interventions on airborne infection risk and transmission between occupants. Build. Environ. 2020, 180, 107008. [Google Scholar] [CrossRef]
- Yao, M.; Zhang, L.; Ma, J.; Zhou, L. On airborne transmission and control of SARS-Cov-2. Sci. Total Environ. 2020, 731, 139178. [Google Scholar] [CrossRef]
- Hobday, R.; Dancer, S. Roles of sunlight and natural ventilation for controlling infection: Historical and current perspectives. J. Hosp. Infect. 2013, 84, 271–282. [Google Scholar] [CrossRef]
- Wang, S.; Pan, Y.; Wang, Q.; Miao, H.; Brown, A.N.; Rong, L. Modeling the viral dynamics of SARS-CoV-2 infection. Math. Biosci. 2020, 328, 108438. [Google Scholar] [CrossRef]
- Chow, T.; Yang, X. Ventilation performance in operating theatres against airborne infection: Review of research activities and practical guidance. J. Hosp. Infect. 2004, 56, 85–92. [Google Scholar] [CrossRef] [PubMed]
- Wang, J.; Huo, Q.; Zhang, T.; Wang, S.; Battaglia, F. Numerical investigation of gaseous pollutant cross-transmission for single-sided natural ventilation driven by buoyancy and wind. Build. Environ. 2020, 172, 106705. [Google Scholar] [CrossRef] [PubMed]
- Lipinski, T.; Ahmad, D.; Serey, N.; Jouhara, H. Review of ventilation strategies to reduce the risk of disease transmission in high occupancy buildings. Int. J. Thermofluids 2020, 7–8, 100045. [Google Scholar] [CrossRef]
- Vuorinen, V.; Aarnio, M.; Alava, M.; Alopaeus, V.; Atanasova, N.; Auvinen, M.; Balasubramanian, N.; Bordbar, H.; Erästö, P.; Grande, R.; et al. Modelling aerosol transport and virus exposure with numerical simulations in relation to SARS-CoV-2 transmission by inhalation indoors. Saf. Sci. 2020, 130, 104866. [Google Scholar] [CrossRef]
- Peng, S.; Chen, Q.; Liu, E. The role of computational fluid dynamics tools on investigation of pathogen transmission: Prevention and control. Sci. Total Environ. 2020, 746, 142090. [Google Scholar] [CrossRef]
- Kang, Z.; Zhang, Y.; Fan, H.; Feng, G. Numerical Simulation of Coughed Droplets in the Air-Conditioning Room. In Proceedings of the Procedia Engineering-9th International Symposium on Heating, Ventilation and Air Conditioning (ISHVAC) and the 3rd International Conference on Building Energy and Environment (COBEE), Tianjin, China, 12–15 July 2015; Volume 121, pp. 114–121. [Google Scholar]
- Perazzo, B.; Barbosa, P.; de Carvalho, N.; Brum, L. Validation and assessment of the CFD-0 module of CONTAM software for airborne contaminant transport simulation in laboratory and hospital applications. Build. Environ. 2018, 142, 139–152. [Google Scholar]
- Martins, N.R.; Carrilho, G. Simulation of the effect of fine particle pollution on the potential for natural ventilation of non-domestic buildings in European cities. Build. Environ. 2017, 115, 236–250. [Google Scholar] [CrossRef]
- Alaidroos, A.; Almaimani, A.; Baik, A.; Al-Amodi, M.; Rahaman, K.R. Are historical buildings more adaptive to minimize the risks of airborne transmission of viruses and public health? A study of the hazzazi house in Jeddah (Saudi Arabia). Int. J. Environ. Res. Public Health 2021, 18, 3601. [Google Scholar] [CrossRef]
- Aganovic, A.; Bi, Y.; Cao, G.; Drangsholt, F.; Kurnitski, J.; Wargocki, P. Estimating the impact of indoor relative humidity on SARS-CoV-2 airborne transmission risk using a new modification of the Wells-Riley model. Build. Environ. 2021, 205, 108278. [Google Scholar] [CrossRef]
- Dai, H.; Zhao, B. Association of infected probability of COVID-19 with ventilation rates in confined spaces: A Wells-Riley equation based investigation. Build. Simul. 2020, 13, 1321–1327. [Google Scholar] [CrossRef]
- Kurnitski, J.; Kiil, M.; Wargocki, P.; Boerstra, A.; Seppänen, O.; Olesen, B.; Morawska, L. Respiratory infection risk-based ventilation design method. Build. Environ. 2021, 206, 108387. [Google Scholar] [CrossRef] [PubMed]
- Sha, H.; Zhang, X.; Qi, D. Optimal control of high-rise building mechanical ventilation system for achieving low risk of COVID-19 transmission and ventilative cooling. Sustain. Cities Soc. 2021, 74, 103256. [Google Scholar] [CrossRef] [PubMed]
- Stabile, L.; Pacitto, A.; Mikszewski, A.; Morawska, L.; Buonanno, G. Ventilation procedures to minimize the airborne transmission of viruses in classrooms. Build. Environ. 2021, 202, 108042. [Google Scholar] [CrossRef]
- Yan, S.; Wang, L.; Birnkrant, M.J.; Zhai, J.; Miller, S.L. Evaluating SARS-CoV-2 airborne quanta transmission and exposure risk in a mechanically ventilated multizone office building. Build. Environ. 2022, 219, 109184. [Google Scholar] [CrossRef] [PubMed]
- Melikov, A. Quantifying Draught Risk; Technical Review no. 2; Bruel & Kjaer: Nzrum, Denmark, 1988; Available online: https://www.google.com/url?sa=t&rct=j&q=&esrc=s&source=web&cd=&cad=rja&uact=8&ved=2ahUKEwiJtvnf0qX7AhVAQvEDHcdlCD8QFnoECAsQAQ&url=https%3A%2F%2Fwww.bksv.com%2Fdoc%2Fbv0034.pdf&usg=AOvVaw2Tj6L9n8mDf6LV_eULlv9O (accessed on 10 April 2022).
- ASHRAE. ASHRAE Handbook of Fundamentals; The American Society of Heating, Refrigeration and Air-Coniditioning Engineers: Peachtree Corners, GA, USA, 2005. [Google Scholar]
- Hanzawa, H.; Melikow, A.; Fanger, P. Airflow Characteristics in the occupied zone of ventilated spaces. ASHRAE Trans. 1987, 93, 524–538. [Google Scholar]
- Fanger, P.; Melikov, A.K.; Hanzawa, H.; Ring, J. Air turbulence and sensation of draught. Energy Build. 1988, 12, 21–39. [Google Scholar] [CrossRef]
- Mayer, E. Influence of air turbulence on the convective surface heat transfer coefficient. In Proceedings of the Third International Conference on Indoor Air Quality and Climate, Stockholm, Sweden, 20–24 August 1984; pp. 377–382. [Google Scholar]
- Berglund, L.; Fobelets, A. Subjective human response to low-level air current and asymmetric ratiation. ASHRAE Trans. 1987, 93, 497–523. [Google Scholar]
- McIntyre, D. The effect of air movement on thermal comfort and sensation. In Indoor Climate; Fanger, P.O., Valbjorn, O., Eds.; Danish Building Research Institute: Copenhagen, Denmark, 1979; pp. 541–560. [Google Scholar]
- Fanger, P.O.; Pedersen, C.J.K. Discomfort due to air velocities in spaces. In Proceedings of the Meeting of Commission B1, B2, E1 of International Institute Refrigeration, Paris, France, 16–18 November 1977; Volume 4, pp. 289–296. [Google Scholar]
- Fanger, P.O.; Christensen, N.K. Perception of draught in ventilated spaces. Ergonomics 1986, 29, 215–235. [Google Scholar] [CrossRef]
- ANSI/ASHRAE Standard 55-2013; Thermal Environmental Conditions for Human Occupancy. Tullie Circle NE: Atlanta, GA, USA, 2013.
- ISO 7730; Ergonomics of the Thermal Environment. Analytical Determination and Interpretation of Thermal Comfort Using Calculation of the PMV and PPD Indices and Local Thermal Comfort Criteria. International Organization for Standardization: Geneva, Switzerland, 2005.
- Mumovic, D.; Palmer, J.; Davies, M.; Orme, M.; Ridley, I.; Oreszczyn, T.; Judd, C.; Critchlow, R.; Medina, H.; Pilmoor, G.; et al. Winter indoor air quality, thermal comfort and acoustic performance of newly built secondary schools in England. Build. Environ. 2009, 44, 1466–1477. [Google Scholar] [CrossRef]
- Charles, K.E. Fanger’s Thermal Comfort and Draught Models; IRC Research Report RR-162; National Research Council of Canada: Ottawa, Canada, 2003.
- Deng, X.; Tan, Z. Numerical analysis of local thermal comfort in a plan office under natural ventilation. Indoor Built Environ. 2019, 29, 972–986. [Google Scholar] [CrossRef]
- Markov, D.; Ivanov, N.; Pichurov, G.; Zasimova, M.; Stankov, P.; Smirnov, E.; Simova, I.; Ris, V.; Angelova, R.A.; Velichkova, R. On the Procedure of Draught Rate Assessment in Indoor Spaces. Appl. Sci. 2020, 10, 5036. [Google Scholar] [CrossRef]
- Conceição, E.Z.E.; Santiago, C.I.M.; Lúcio, M.M.J.R.; Awbi, H.B. Predicting the Air Quality, Thermal Comfort and Draught Risk for a Virtual Classroom with Desk-Type Personalized Ventilation Systems. Buildings 2018, 8, 35. [Google Scholar] [CrossRef]
- US Department of Energy. EnergyPlus_Development_Team. EnergyPlus Programming Standard; US Department of Energy: Washington, DC, USA, 2013.
- Gu, L. Airflow Network Modeling in EnergyPlus. In Proceedings of the 10th International Building Performance Simulation Association Conference and Exhibition, Beijing, China, 9–10 January 2007. [Google Scholar]
- ASHRAE. ANSI/ASHRAE Standard 62.2; Ventilation and Acceptable Indoor Air Quality in Residential Buildings. American Society of Heating, Refrigerating, and Air conditioning Engineers: Peachtree Corners, GA, USA, 2016.
- WHO. Natural Ventilation for Infection Control in Health-Care Settings; WHO Guidelines: Geneva, Switzerland, 2009. [Google Scholar]
- Neufert, E.; Neufert, P.; Baiche, B.; Walliman, N. Neufert Architects Data; Wiley-Blackwell: Hoboken, NJ, USA, 2000. [Google Scholar]
- Riley, R.R.E.; Murphy, G. Airborne spread of measles in a suburban elementary school. Am. J. Epidemiol. 1978, 107, 421–432. [Google Scholar] [CrossRef] [PubMed]
- Li, Y.; Qian, H.; Hang, J.; Chen, X.; Cheng, P.; Ling, H.; Wang, S.; Liang, P.; Li, J.; Xiao, S.; et al. Probable airborne transmission of SARS-CoV-2 in a poorly ventilated restaurant. Build. Environ. 2021, 196, 107788. [Google Scholar] [CrossRef] [PubMed]
- Hijnen, D.; Marzano, A.V.; Eyerich, K.; GeurtsvanKessel, C.; Giménez-Arnau, A.M.; Joly, P.; Vestergaard, C.; Sticherling, M.; Schmidt, E. SARS-CoV-2 transmission from presymptomatic meeting attendee, Germany. Emerg. Infect. Dis. 2020, 26, 1935–1937. [Google Scholar] [CrossRef]
- Miller, S.L.; Nazaroff, W.W.; Jimenez, J.L.; Boerstra, A.; Buonanno, G.; Dancer, S.J.; Kurnitski, J.; Marr, L.C.; Morawska, L.; Noakes, C. Transmission of SARS-CoV-2 by inhalation of respiratory aerosol in the Skagit Valley Chorale superspreading event. Indoor Air 2021, 31, 314–323. [Google Scholar] [CrossRef]
- The R Foundation. R for Statistical Computing. 2022. Available online: https://www.r-project.org (accessed on 20 January 2022).
- Nurjannah, A.; Trihamdani, A.R. Energy Saving Effort for Residential Buildings in the Hot and Humid Climate: A Review on Ventilation Performance Requirements. IOP Conf. Series: Earth Environ. Sci. 2022, 1058, 012005. [Google Scholar] [CrossRef]
- Sachta, H.; Lukiantchuki, M. Windows Size and the Performance of Natural Ventilation. Procedia Eng. 2017, 196, 972–979. [Google Scholar] [CrossRef]
- McCabe, C.; Roaf, S. The wind towers of Bastakiya: Assessing the role of the towers in the whole house ventilation system using dynamic thermal modelling. Archit. Sci. Rev. 2013, 56, 183–194. [Google Scholar] [CrossRef]
- Huang, Z.; Wu, Z.; Yu, M.; Dong, Y. The Measurement of Natural Ventilation in Huizhou Traditional Dwelling in Summer. Procedia Eng. 2017, 205, 1439–1445. [Google Scholar] [CrossRef]
- Moosavi, L.; Mahyuddin, N.; Ab Ghafar, N.; Ismail, M.A. Thermal performance of atria: An overview of natural ventilation effective designs. Renew. Sustain. Energy Rev. 2014, 34, 654–670. [Google Scholar] [CrossRef]


Publisher’s Note: MDPI stays neutral with regard to jurisdictional claims in published maps and institutional affiliations. |
© 2022 by the authors. Licensee MDPI, Basel, Switzerland. This article is an open access article distributed under the terms and conditions of the Creative Commons Attribution (CC BY) license (https://creativecommons.org/licenses/by/4.0/).