1. Background
One of the major achievements of smart grids was the development of the Advanced Metering Infrastructure (AMI) system [
1]. This system reduces the danger associated with electricity theft by using its fine-grained computations and tracing ability [
2]. However, an increase in the system’s usage increases energy theft and consequently leads to a loss of electricity [
3]. The loss of electricity is among the problems that reduce the performance of the power grids. There are two types of electricity losses. The first are known as Technical Losses (TLs) and the second are known as Non-Technical Losses (NTLs) [
4]. The electric heating of resistive components in transformers, transmission lines, and other types of equipment causes TL, while electricity thefts, billing mistakes, and meter faults are the most common cause of NTL [
3]. Electricity companies are particularly interested in reducing NTLs, since it accounts for a significant portion of the overall energy losses. Energy theft is the major type of NTL that involves bypassing meters, modifying the meter’s readings, etc. The Electricity Consumption (EC) behavior of users may vary from customer to customer. Nonetheless, identifying NTL patterns among all of the usual patterns of EC is a crucial task. In order to capture different types of NTL behaviors, handcrafted feature engineering approaches have been used. However, these approaches are costly as well as time-consuming due to their reliance on expert knowledge [
3].
On the one hand, energy theft has resulted in losses of more than 20% of India’s total energy supply and 16% of China’s accumulative energy supply [
5]. On the other hand, financial losses due to energy theft are approximately 100 million and 6 billion dollars per year for Canada and USA, respectively [
6], while Pakistan faces an annual loss of approximately 0.89 billion rupees as a result of NTLs [
7]. Theft of energy has long been a severe problem in conventional power networks worldwide. Different users show different patterns of Electricity Consumption (EC). Nonetheless, distinguishing NTL patterns from regular EC patterns is challenging. To detect and address these NTLs, many approaches are employed [
8,
9]. These approaches are classified into three fundamental groups: hybrid-oriented, network-oriented, and data-driven-oriented detection systems. The data-driven methods have attracted the attention of academics and research scholars for performing Electricity Theft Detection (ETD) over the last few years.
The data-driven method is composed of machine learning-based classifiers that are used to detect NTLs [
7]. These solutions are also used in various fields like healthcare, education, and transport. In [
10], deep learning models were trained as binary classifiers to detect energy thefts. The authors investigated several deep learning models, such as the Convolutional Neural Network (CNN), Multi-Layer Perceptron (MLP), Long-Short Term Memory (LSTM), and Gated Recurrent Unit (GRU) networks. However, due to inefficient tuning of hyperparameters, these models exhibit poor generalization. To tackle the generalization issue, previous studies used the Grid Search Algorithm (GSA) to tune the hyperparameters of the models. However, the GSA requires high computational resources to find the optimal combination of parameters.
According to [
11,
12], ensemble models fail to identify diverse theft patterns of EC due to a significant imbalance in data, resulting in a high False Positive Rate (FPR). Therefore, we propose the use of a hybrid of neural networks referred as MLP-GRU to detect energy theft. Actual smart meter data and auxiliary information from the consumers are used for the data analysis.
The authors of [
12] conducted a detailed analysis of ensemble models based upon boosting and bagging methods. They observed that the Random Forest (RF) model obtained the highest DR and the lowest FPR. Moreover, the authors implemented two data balancing techniques, i.e., the Synthetic Minority Oversampling Technique (SMOTE) and near-miss, to compare both oversampling and undersampling algorithms. However, there may be an increase in the chances of overlapping classes when using SMOTE, as it can increase the existence of noise. The problem of anomaly detection was addressed in [
13]. In the proposed work, the authors used a deep learning approach this is capable of distinguishing between regular and anomalous consumption patterns. They also handled the drift concept by discriminating between nonmalicious and real anomalies. However, there is a substantial delay between the occurrence of an anomaly and its detection in the proposed approach.
Existing Machine Learning (ML) algorithms require an equal number of instances for each class during model training. For minority classes, these models have a poor predictive performance. For the detection of electricity thefts, there is a lack of theft data in the real world. Therefore, we synthetically generated the theft data using data balancing techniques [
14]. Many studies have used different balancing techniques; however, such techniques have a high computational time and executional complexity. In [
14], the authors proposed a hybrid technique, K-SMOTE, for data balancing. In the model, a k-means clustering algorithm is used to determine k clusters for abnormal samples. Afterwards, SMOTE is applied on the clusters of theft samples for interpolation to balance the complete data. Based on the balanced data, Random Forest (RF) classification is performed to detect electricity theft behavior. However, to determine optimal values of k and perform tuning of other hyperparameters for data balancing, an optimization algorithm is required.
With the emergence of smart meters, diverse types of energy theft cases have been introduced, and these are difficult to detect using the existing techniques. The authors of [
15] presented a statistical and ML-based system designed to identify and alert customers about energy theft. In previous studies, several data-driven techniques for the NTL identification issue have been used. The majority of these studies have concentrated on boosting approaches while ignoring bagging methods, such as Extra Trees (ET) and RF. Furthermore, ML models, such as the Support Vector Machine (SVM) and neural networks, have high FPR values and low detection rates. Neural networks were used in [
16] for the prediction of coalbed methane well production.
In [
17], the authors employed an Extreme Gradient Boosting (XGBoost) technique to classify the malicious users. However, because of the imbalanced dataset, this technique has a high FPR and requires more onsite inspections. The authors of [
18] introduced a boosting method called the Gradient Boosting Theft Detector (GBTD), which is based on three existing boosting models: XGBoost, light gradient boosting, and categorical boosting.
The data-driven methods can be broken down into nonsupervised and supervised learning. The nonsupervised learning techniques have acquired significant attention for their use in identifying energy theft nowadays. However, on big datasets, these techniques lack generalization and can also lead to high FPR values due to the fluctuations in load patterns. The authors of [
19] exploited an unsupervised learning model called the Stack Sparse Denoising Auto-Encoder (SSDAE) detector, which extracts abstract features from large datasets. However, auto-encoders tune many hyperparameters, thereby consuming more processing time. Moreover, the SSDAE detector must be rectified regularly with incoming training samples. In [
20], the authors introduced a novel solution to data augmentation and relevant feature extraction from high dimensional data using a Conditional Variational Auto-Encoder (CVAE) in conjunction with a CNN classifier.
Various experiments on energy theft identification in AMI have been carried out using ML techniques. The authors of [
21] presented an unsupervised learning based anomalous pattern recognition technique to identify energy theft in data streams provided by smart meters. The technique only uses regular consumer usage data for model training. However, the classifier may recognize high energy usage patterns over weekdays and holidays. Furthermore, in [
22], the authors proposed a Consumption Pattern-Based Energy Theft Detection (CPBETD) approach to leverage the predictability of consumers’ benign and fraudulent class samples. However, the SVM misclassification rate limited the DR, resulting in a high FPR.
Most researchers have focused on EC nonmalicious patterns [
23]. However, previous studies have shown poor detection rates and accuracy regarding NTL detection. In [
23], the authors developed a hybrid K-means-DNN approach, which is a combination of the K-Nearest Neighbor (KNN) and Deep Neural Network (DNN). The approach detects electricity theft in power grids. However, its detection performance is low. The authors of [
24] suggested a hybrid method that enhances the internal structure of the standard LSTM model combined with the Gaussian Mixture Model (GMM). However, the proposed method is applicable only for low dimensional space data and is not very robust. In [
25], the authors proposed a hybrid technique based on the SVM and Decision Tree (DT) for detecting illegal consumers. However, no effective performance measures were used for the combined technique’s evaluation.
Contribution List
The key contributions of this paper are as follows:
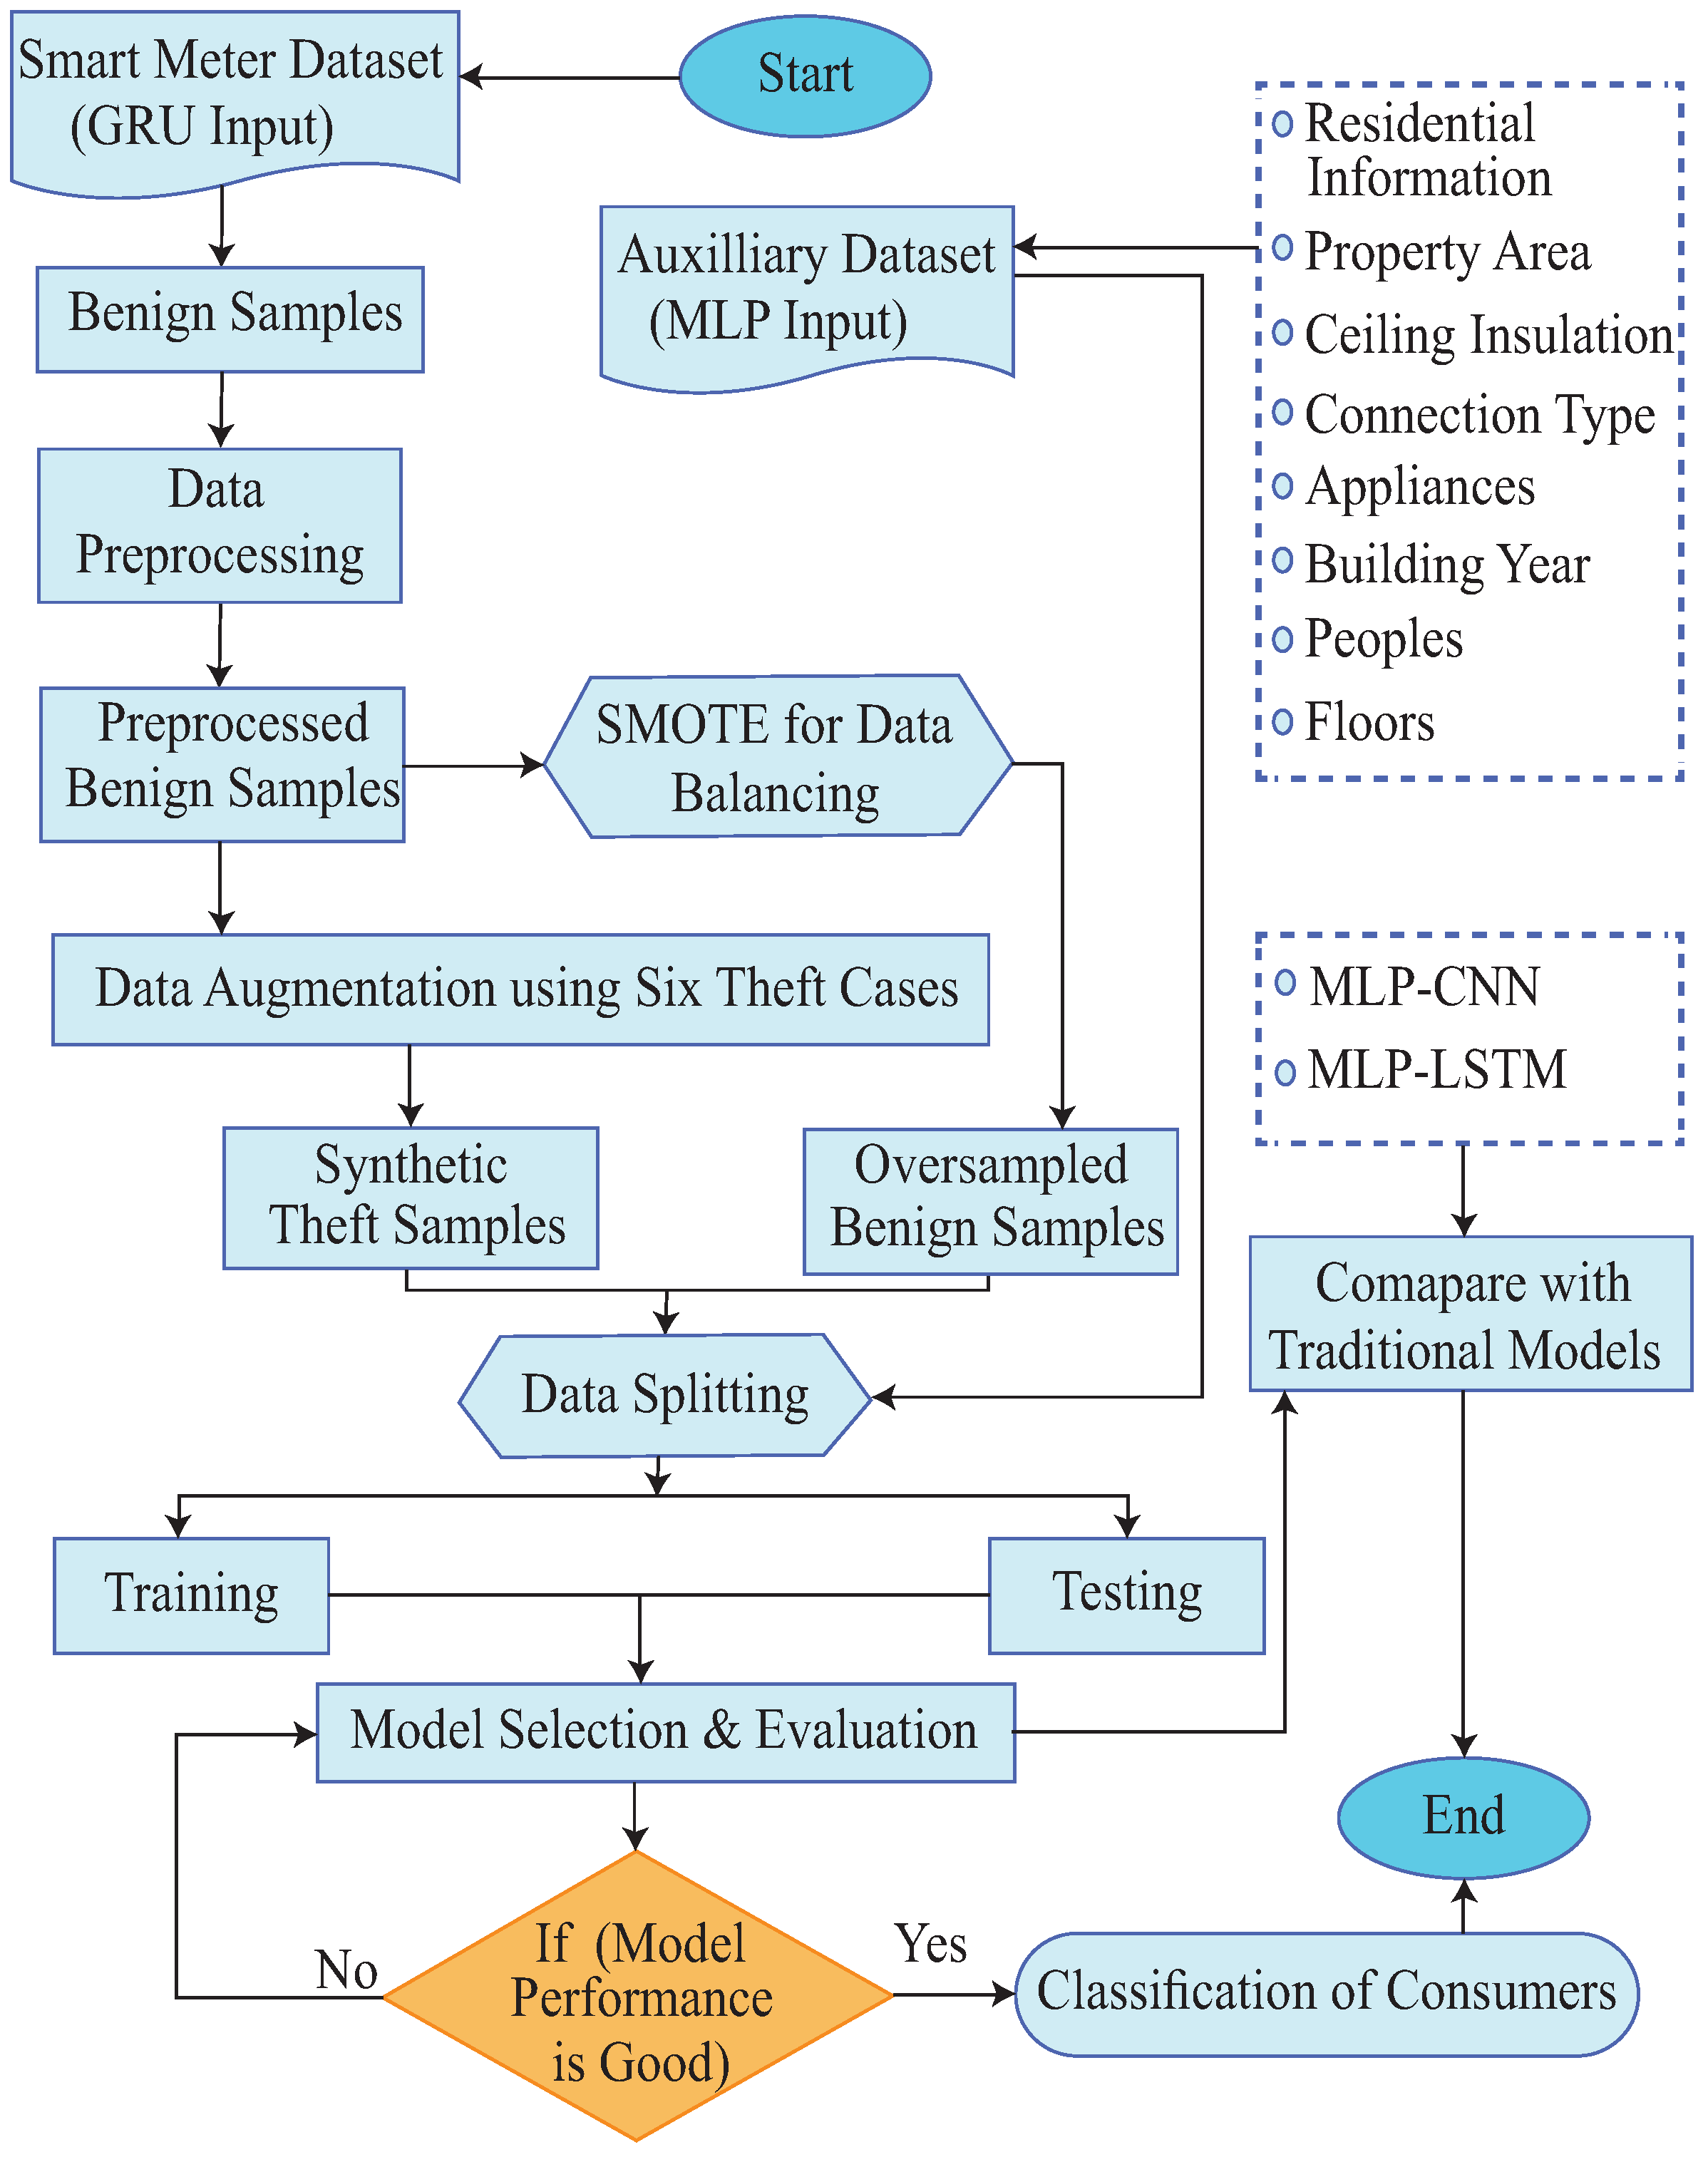
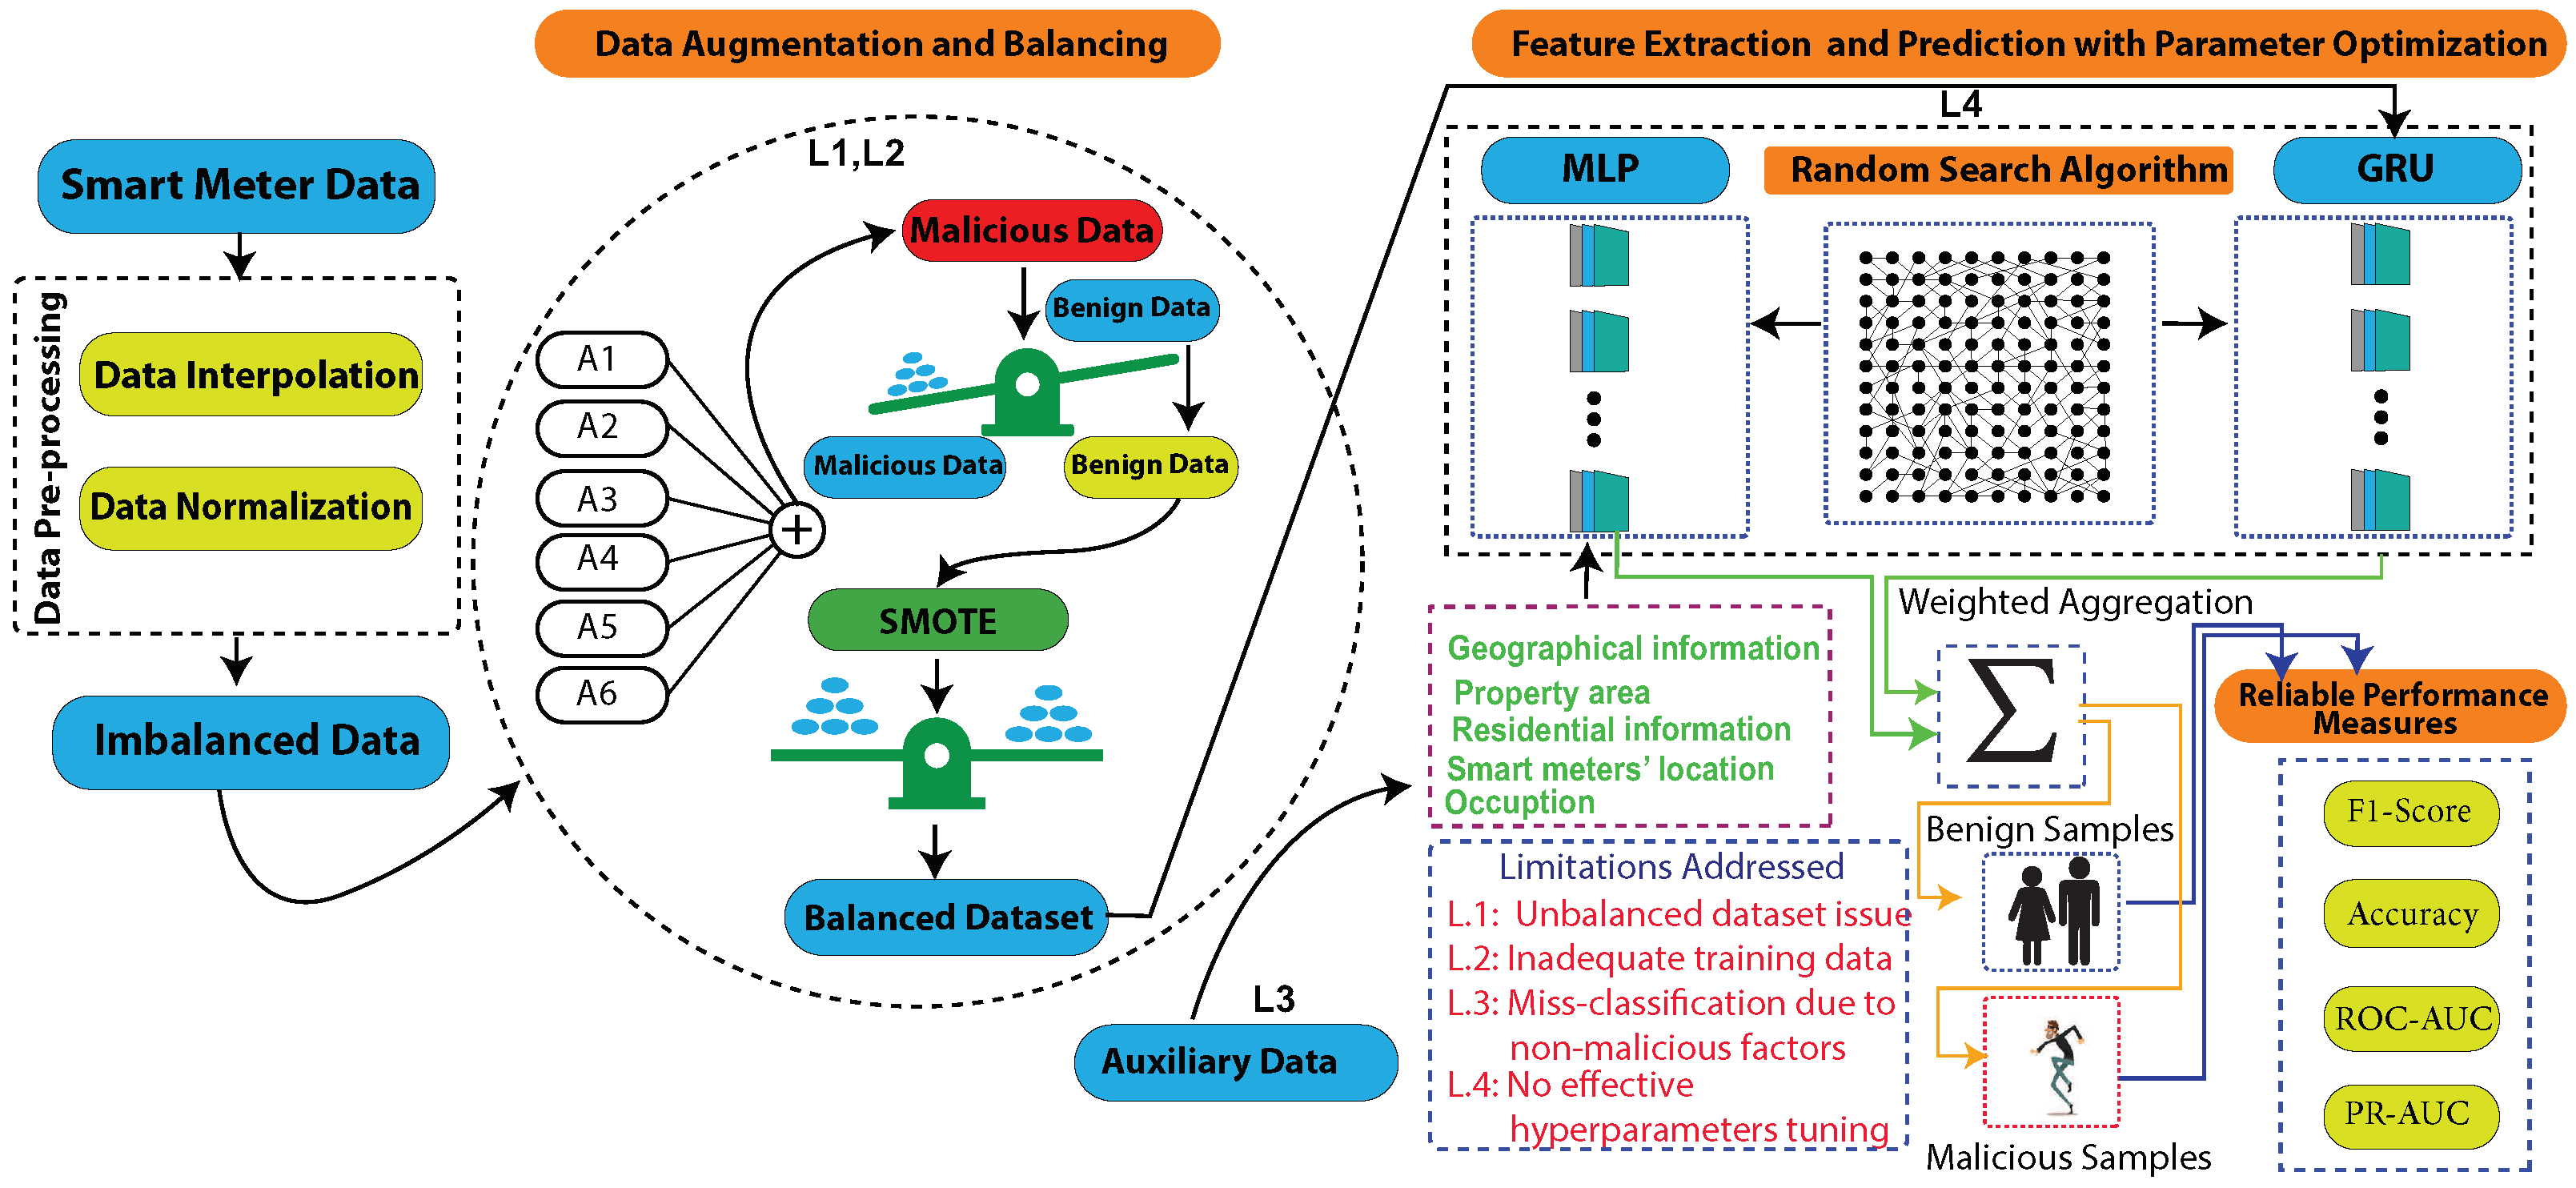
A hybrid model, referred as MLP-GRU, that identifies NTLs using both metering data and auxiliary data is proposed.
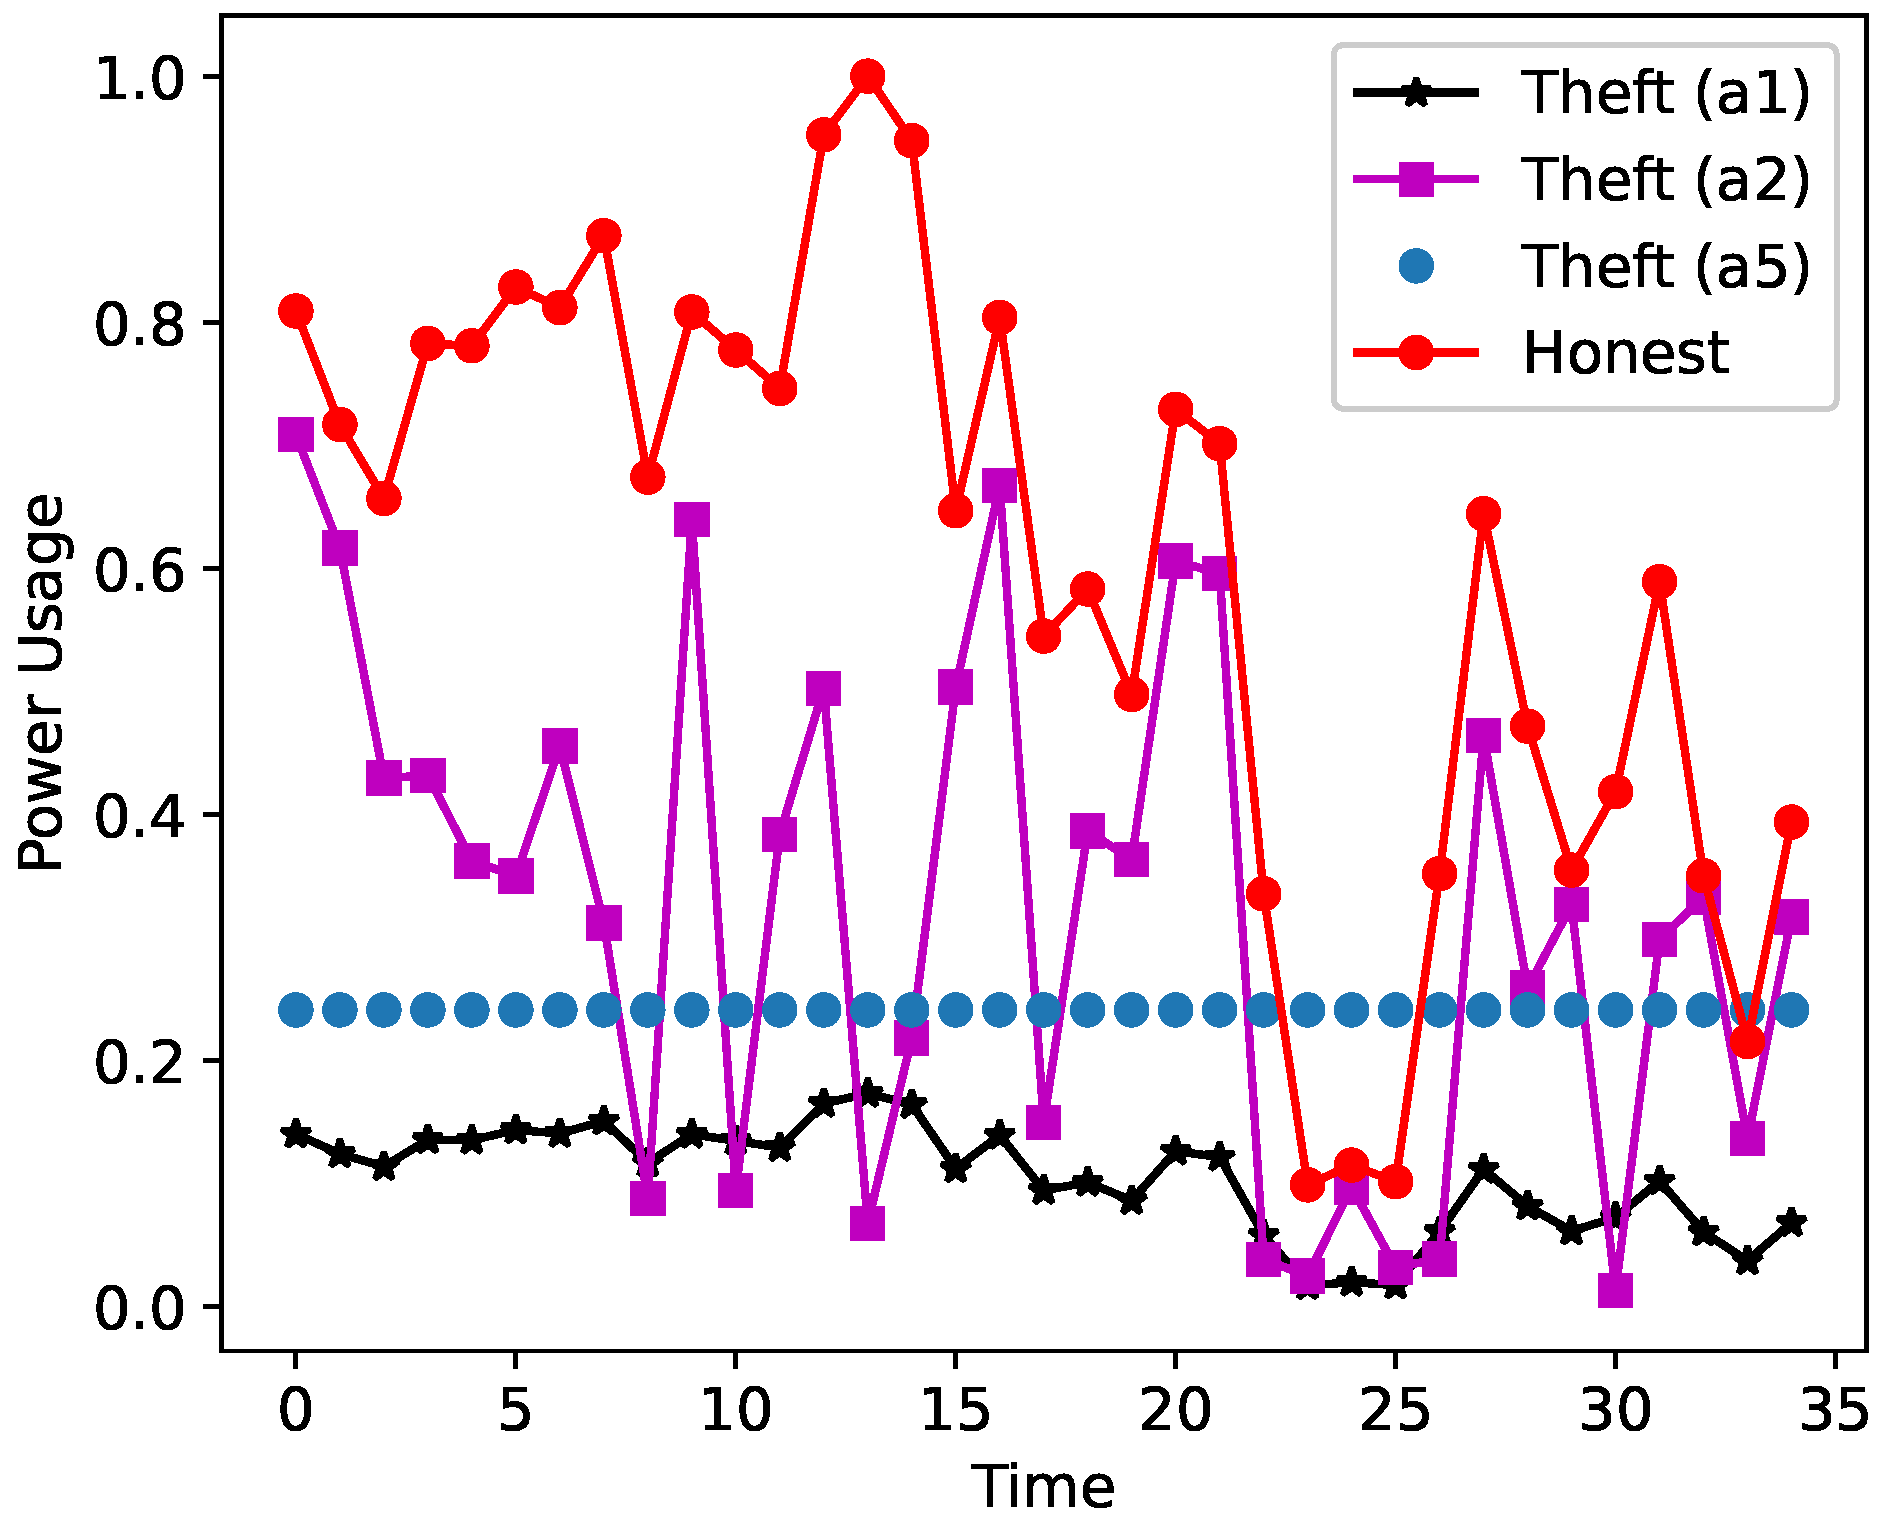
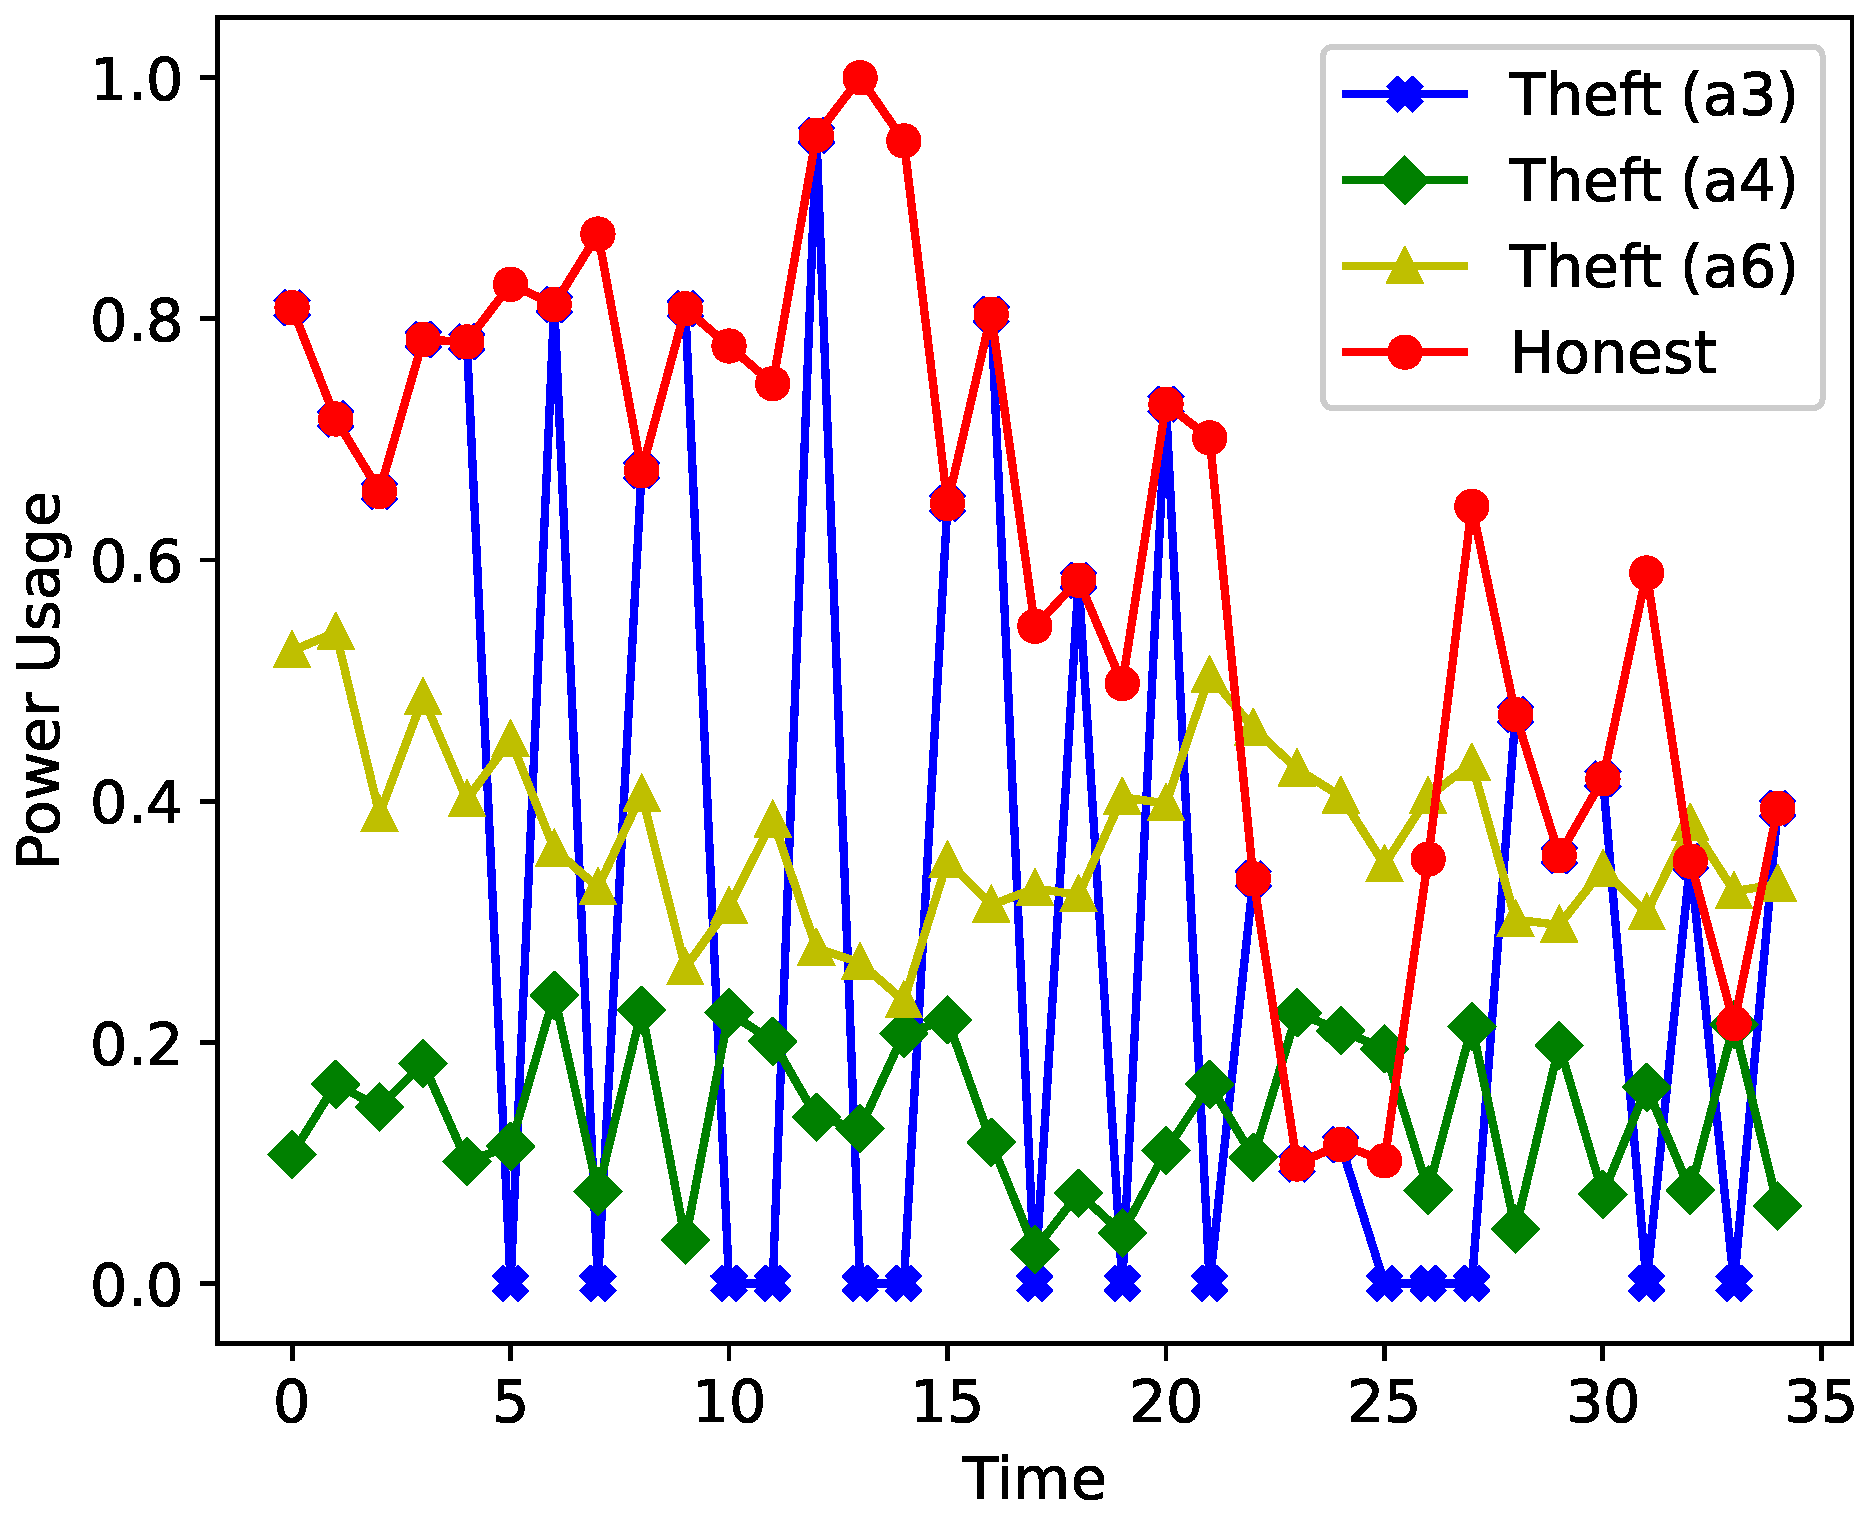
A data augmentation technique is used due to the scarcity of theft samples. This study uses six theft scenarios to create synthetic instances of EC by modifying the honest samples.
Meanwhile, a Synthetic Minority Oversampling Technique (SMOTE) is employed to maintain a balance between synthetic and benign samples.
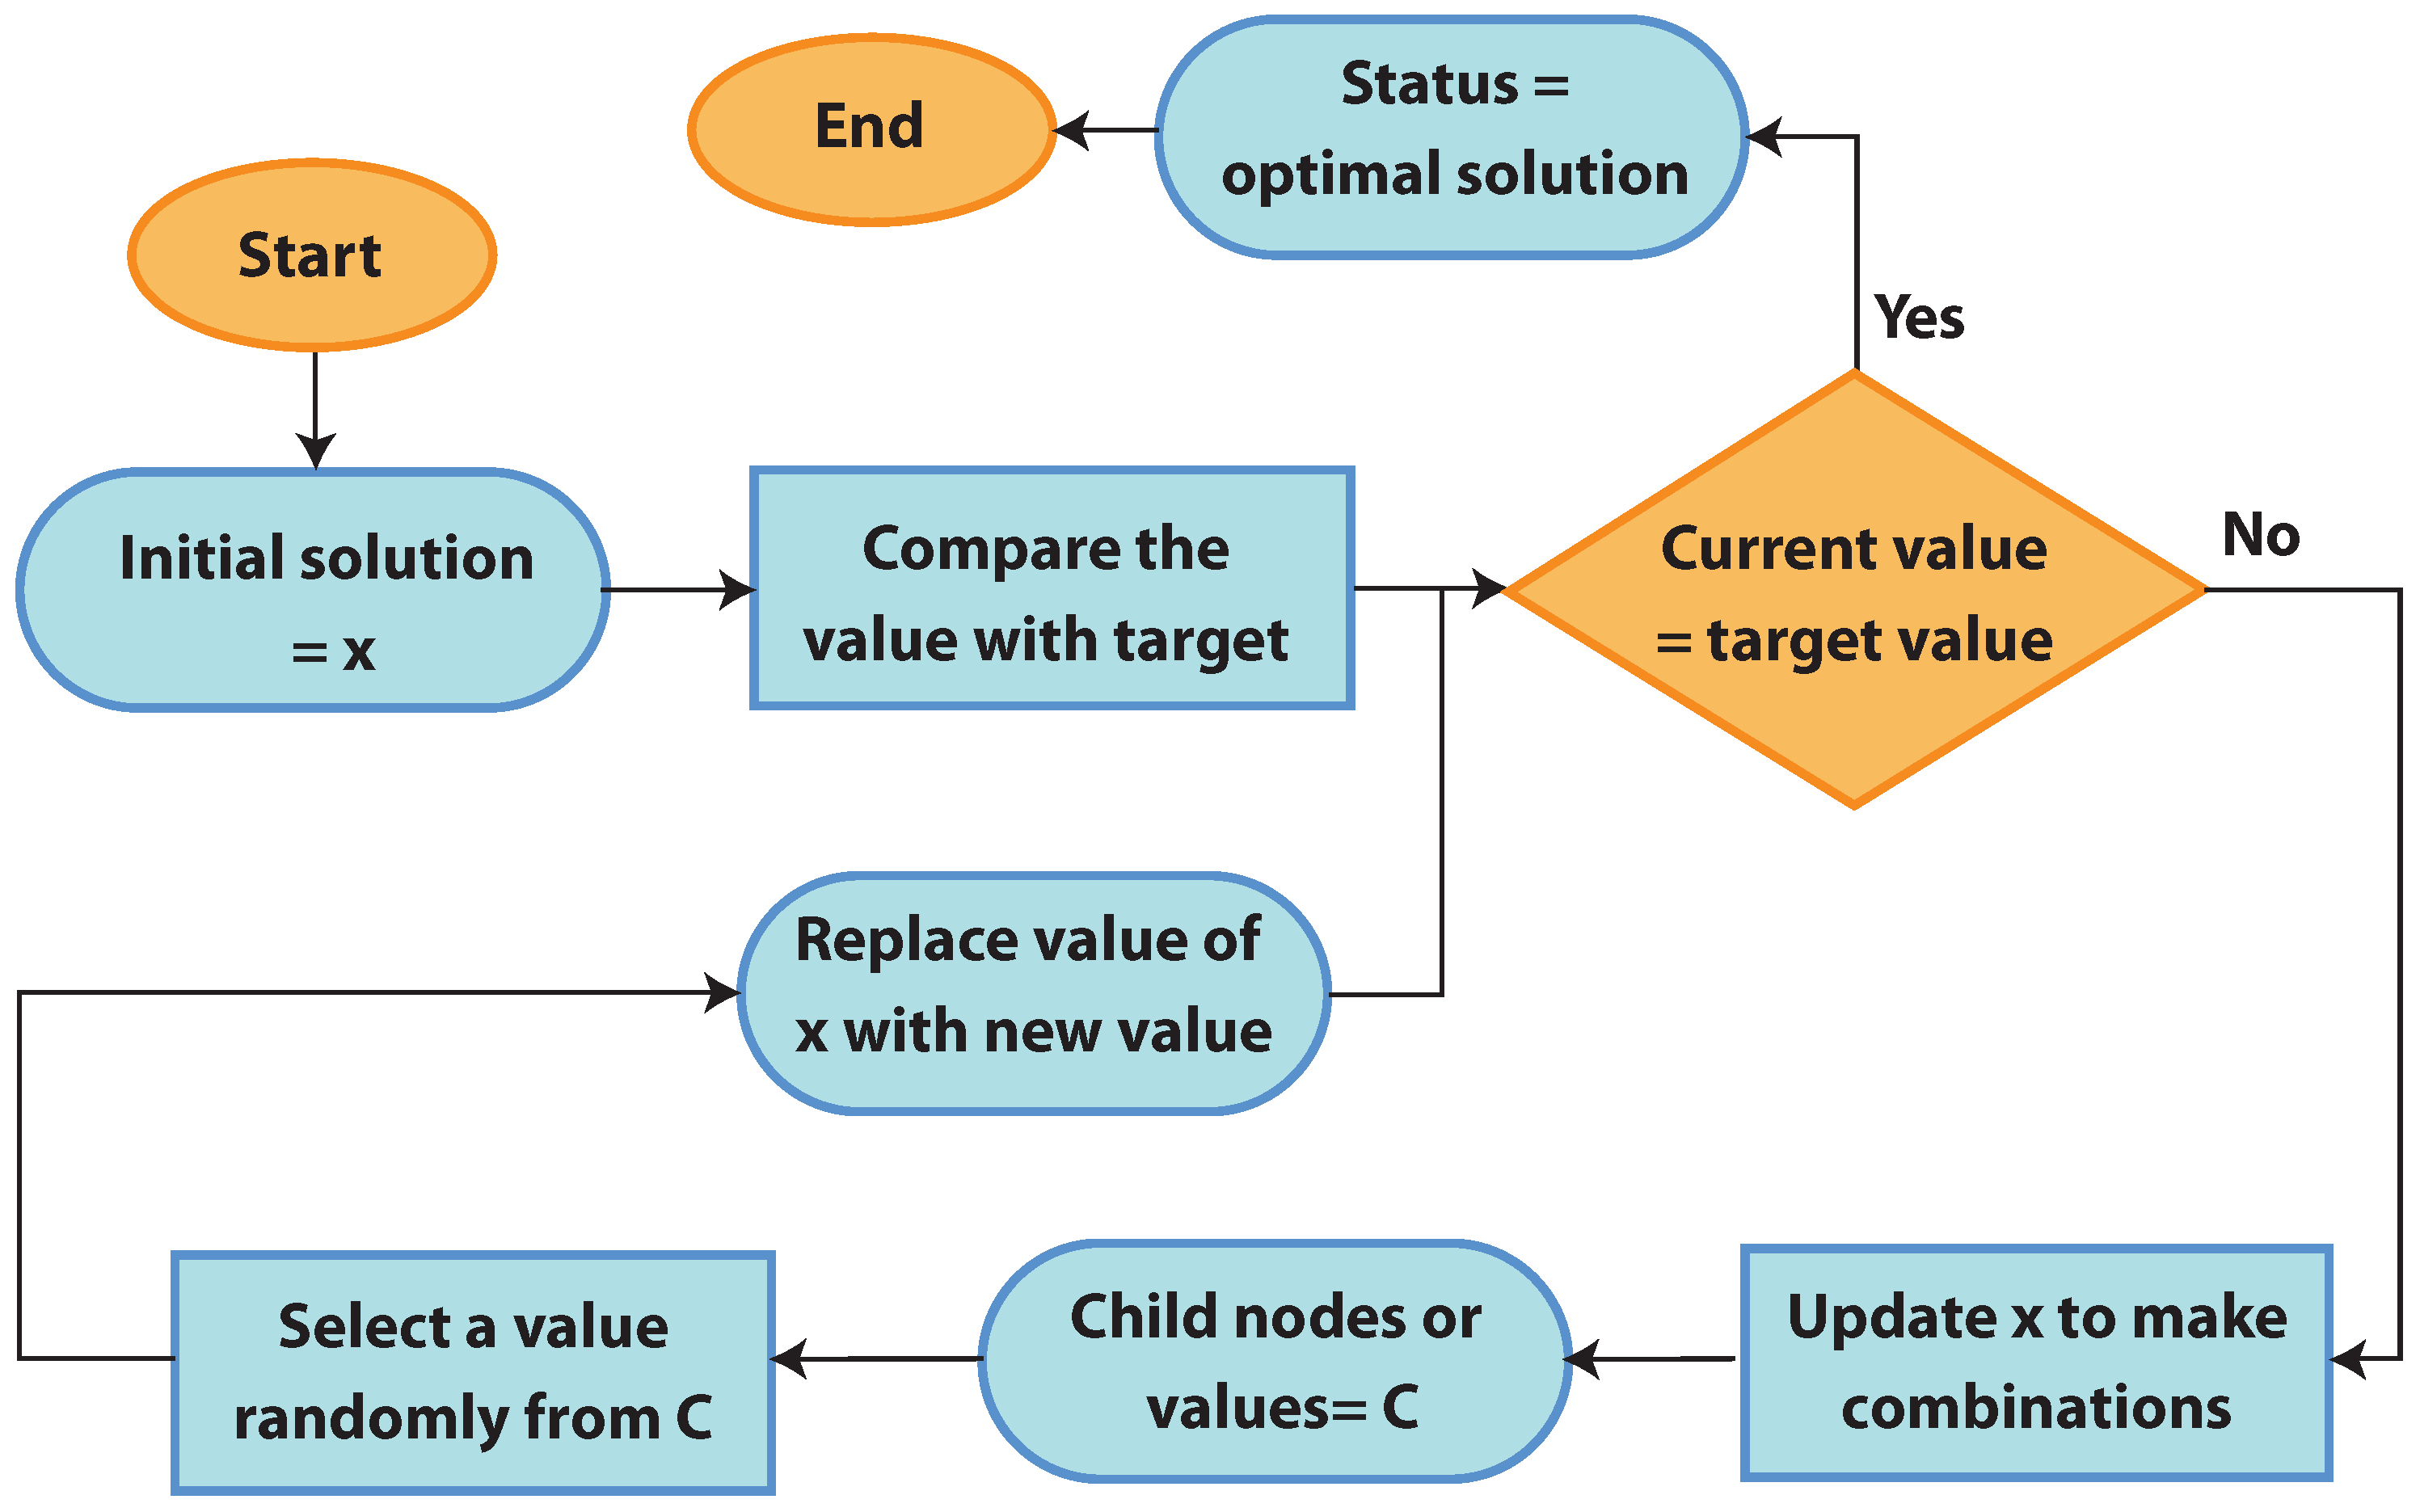
An optimization algorithm, known as the Random Search Algorithm (RSA), is used to effectively tune the MLP-GRU model’s hyperparameters.
The rest of the manuscript is structured as follows. A detailed discussion of the proposed model is provided in
Section 2. Afterwards, performance evaluation metrics are described in
Section 3.
Section 4 discusses the simulation results, while the conclusion of the paper is given in
Section 5.


 ,
, 


