Abstract
Land resources are being depleted due to global climate change, and as a result, infrastructures such as expressways and high-speed railways have no option but to be built in soft soil regions. Hence, the cyclic and post-cyclic behaviors of soft soil are vitally important. However, little attention has been devoted to this issue. In the current study, a series of cyclic triaxial tests and standard monotonic loading tests were carried out in order to investigate the cyclic and post-cyclic behavior of stabilized sand-containing soft soil. In addition, the stiffness evolution index model was proposed to describe the characteristics of stiffness evolution. The results show that for a given number of loading cycles, stiffness almost linearly decreases with the increase in sand content. The higher the confining pressure is, the greater the stiffness is. The cement content has the greatest impact on the stiffness evolution index. The stiffness evolution index model can provide a good description of experimental data. The initial value of post-cyclic axial strain is non-zero due to the accumulative strain caused by previous cyclic loading. Post-cyclic stress increases rapidly within a small range of strain and can reach peak stress with great speed. The post-cyclic initial tangent modulus increases from 1602 kPa to 4803 kPa as the cement content increases from 6% to 12%.
1. Introduction
It is widely recognized that land resources are being depleted due to global climate change. Take China as an example: according to the Report on the State of the Ecology and Environment in China 2021, the national average temperature was 10.53 °C, which was 1 °C higher than that of 2020. In 2021, the area of water and soil loss was 2.6927 million km2 [1]. In addition, Borrelli [2] studied the land use and climate change impacts on global soil erosion by water (2015–2070) and pointed out that a 30% growth in the area of water and soil loss due to the possible exacerbation of climatic conditions may occur by 2030. As a result, a large number of infrastructures, such as expressways (e.g., Foqingcong Expressway [3] and Xintai Expressway [4]) and high-speed railways (e.g., Beijing–Shanghai high-speed railway [5] and Lian-Yan high-speed Railway [6]), have no option but to be built in soft soil regions. In addition, it is widely accepted that soft soil with the characteristics of high moisture content [7], high void ratio [8], low permeability [9], and poor bearing capacity [10] is not fit for engineering constructions such as expressways and high-speed railways. For this reason, in the context of global climate change, the reinforcement of foundations is a subject of prime importance [11,12,13,14]. In recent years, physical stabilization reinforcement [15,16] and chemical stabilization reinforcement [17,18] have been conducted to improve the engineering performance of soft soil. Cement-based stabilization is widely used in geotechnical engineering.
Soil with a higher stiffness cannot be compressed easily. As a result, the deformation of soil subjected to long-term, low-level, repeated cyclic loading, such as traffic loading, is smaller. In addition, some important structures, such as expressways and high-speed railways, should not undergo even small displacements [19]. Hence, the mechanical properties of soft soil are vitally important for the long-term reliable operation of expressways and high-speed railways in coastal areas [20,21]. Numerous studies have shown that the stress history induced by previous cyclic loading has a significant effect on post-cyclic mechanical properties. Kaya [22] suggested that if the deformations induced by previous cyclic loading were greater than the critical deformation level, the post-cyclic strength of soil exhibited a decreasing trend. Wang [23] found that cyclic loading can change the critical state line of soil and the prediction will be better if state parameters were calculated according to the post-cyclic critical state line. Noorzad [24] investigated the effect of silt on the post-cyclic shear strength of sand. The results indicated that the maximum strain and pore water pressure induced by previous cyclic loading can strongly affect the post-cyclic behavior of sand. Wang [25] highlighted that compared with the soil without previous cyclic loading, the soil subjected to cyclic loading showed more strain-hardening phenomena and more dilative behavior. Hence, it is necessary to further understand the cyclic and post-cyclic behavior of soft soil. Dahl [26] discussed how the initial stress–strain responses were relatively soft until the shear strain reached its peak value, developed during previous cyclic loading. Liu [27] found that for the sample without previous cyclic loading, the volume strain was less than that of the sample after cyclic loading. Soroush [28] investigated the pre- and post-cyclic behavior of mixed clayey soils. The results indicated that the pore-water pressures during the post-cyclic tests were extraordinarily lower than during the monotonic tests due to previous cyclic loading. Paramasivam [29] highlighted the post-cyclic shear strength was higher than that of the sample without prior cyclic loading, and the axial strain (to reach the peak deviatoric stress) decreased with the increase in cyclic strain amplitude. Lu et al. [30] analyzed the post-cyclic mechanical behavior of soft clay and pointed out that accumulative strain increases obviously at the beginning of the test. The initial values of axial strain are different due to the strains generated by previous cyclic loading. Huang [31] found that the initial value of post-cyclic axial strain was non-zero. The starting points were 1.29%, 2.11%, 5.55%, and 11.93%, corresponding to the repeated cyclic stress amplitudes of 40, 50, 55, and 60 kPa. Lei [32] stressed that resistance to the shear can be enhanced due to the cycling reconsolidation process, resulting in an increase in post-cyclic shear strength. Lu [33] observed that for the fully reconsolidated specimens subjected to previous cyclic loading, the shear strength increased from 33.0 to 39.5 kPa as the confining pressure increased from 20 to 60 kPa. Jana [34] found that for the intact specimens, the over-consolidation ratio did not significantly affect the magnitudes of post-cyclic volumetric strain and the maximum excess pore pressure generated during cyclic shear had a significant effect on post-cyclic behavior. Chitravel [35] pointed out that the post-cyclic normalized undrained strength ratios of loose soil were between three and five, which reveals that cyclic loading can rearrange the internal fabric.
It should be pointed out that similar to soft soil, sand-containing soft soil (which also has the characteristics of high moisture content, high compressibility, and low strength) is widely distributed in soft soil regions [36,37,38]. However, compared with soft soil, few investigations have been undertaken on sand-containing soft soil.
Huang [31] suggested that the post-cyclic behavior of soil was strongly influenced by previous cyclic loading (e.g., the pore water was allowed to be discharged under cyclic loading such as traffic loads), however, post-cyclic behavior is usually assessed by a conventional triaxial test which does not take stress history into account. Furthermore, a lot of studies on cyclic and post-cyclic behavior of soft soil subjected to short-term, high-level cyclic loading, such as earthquakes or storms, have been undertaken previously. Zhu [39] highlighted that because the disturbance induced by the cyclic loads, such as storm waves, to the microstructure of soft clay is unique, the softening effect of both the cyclic and post-cyclic stiffness is synchronous. Kafodya [40] analyzed the cyclic and post-cyclic shear behaviors of natural fiber-reinforced soil under a seismic load and found that the post-cyclic energy absorbing capacity of 1% fiber content was 1.6 kJ. However, little is known about the cyclic and post-cyclic behavior of sand-containing soft soil subjected to long-term, low-level, repeated cyclic loading, such as traffic loading.
In this paper, a series of cyclic triaxial tests and standard monotonic loading tests were carried out in order to study the cyclic and post-cyclic behavior of stabilized sand-containing soft soil in coastal areas in more detail. The stiffness and post-cyclic stress–strain curve were used to characterize the cyclic and post-cyclic behavior of stabilized sand-containing soft soil. The impacts of sand content, cement content, confining pressure, and repeated cyclic stress amplitude on stiffness were analyzed. In addition, the stiffness evolution index model was proposed to describe experimental data. Finally, the effects of stress history and other influencing factors, such as cement content and confining pressure, on the post-cyclic stress–strain curve were analyzed. The implications of this paper for practical projects are to provide the reference and basis for engineering design, which should allow for (1) long-term, low-level, repeated cyclic loading such as traffic loading and (2) the stress history induced by previous cyclic loading.
2. Laboratory Test Program
2.1. Materials and Test Device
The soil used in this paper is a remolded specimen and can be obtained by excavator from the embankment along the Fuzhou–Xiamen Expressway, China, as shown in Figure 1. The sand content, moisture content, dry density, liquid limit, and plastic limit are 10%, 43.51%, 1.26 g/cm3, 41.3%, and 26.8%, respectively.
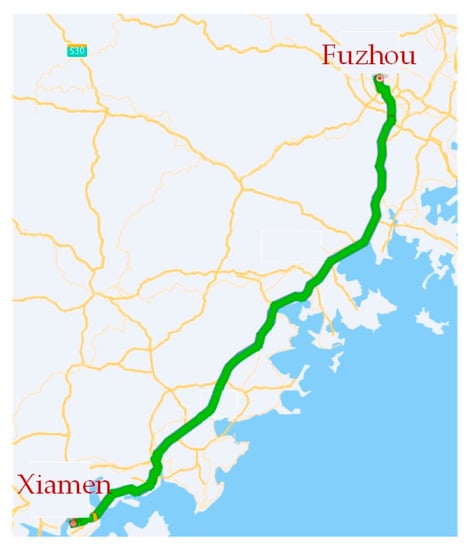
Figure 1.
The Fuzhou–Xiamen Expressway.
As presented in Figure 2, the sand obtained from the sand stratum of an embankment along the Fuzhou–Xiamen Expressway was adopted in this research to investigate the effect of sand content on cyclic and post-cyclic behavior. In the current study, the sand is medium sand, and the grain size distribution curve of sand is shown in Figure 3.
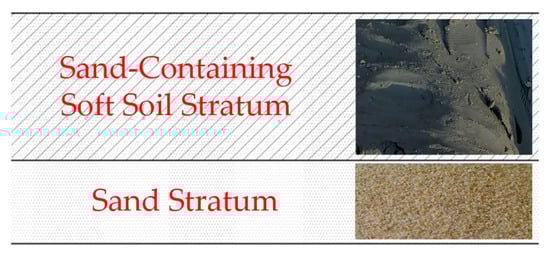
Figure 2.
The sand used in the present study.
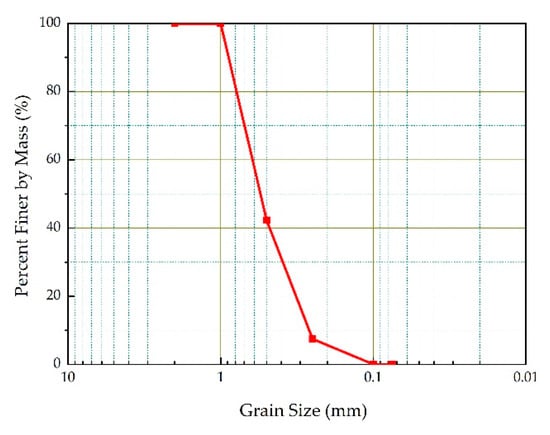
Figure 3.
The grain-size distribution curve of sand.
The cement produced by Zhejiang Wan Ning Technology Co., Ltd. (Hangzhou, China) was used in the current study. The main components are 3CaO·SiO2, 2CaO·SiO2, 3CaO·Al2O3, 4CaO·Al2O3·Fe2O3. The initial and final setting time are 180 min and 240 min, respectively. The flexural strength of 3 d and 7 d are 4 MPa and 7 MPa, respectively. The compressive strength of 3 d and 28 d are 18 MPa and 38 MPa, respectively.
The anhydrous sodium silicate (Na2SiO3) produced by Tianjin Fuchen Chemical Reagent Factory (Tianjin, China) was used as the activator in this study. The activator can react with cement as follows:
NaO·nSiO2 + Ca(OH)2 + mH2O→CaO·nSiO2·mH2O + 2NaOH
Note that the content of anhydrous sodium silicate was 2% and the curing time was 14 d in this paper.
The long-term, low-level cyclic triaxial tests were performed in the Key Laboratory of Underground Engineering, Fujian Province University (Fujian University of Technology). The test device in this paper is the GDS Triaxial Testing System (GDS Instruments Ltd., London, UK) which is equipped with an axial loading system, confining pressure loading system, back pressure loading system, automatic measuring system, and data acquisition system, as shown in Figure 4. The sine wave, triangular wave, and user-defined wave can be applied on the specimens. The maximum axial load, maximum confining pressure, and maximum frequency are 10 kN, 2 MPa, and 5 Hz, respectively.
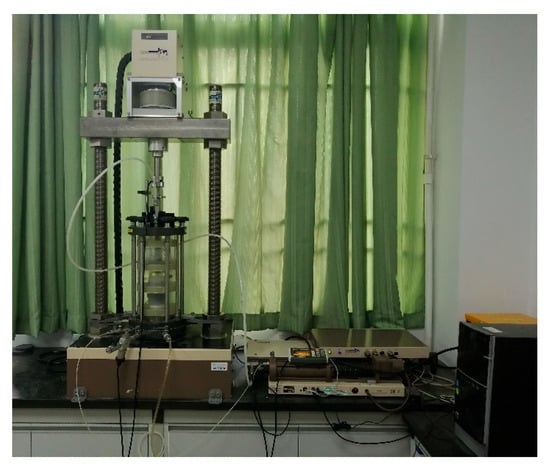
Figure 4.
The GDS triaxial testing system.
2.2. Test Procedures and Experimental Scheme
The experimental procedure can be divided into 3 stages: isotropic consolidation, cyclic loading, and post-cyclic monotonic loading, as shown in Figure 5. (1) In the isotropic consolidation stage, the vacuum-pumping and back pressure saturation were conducted in order to ensure the specimens were fully saturated. The saturation was deemed to be completed when Skempton’s B-value was equal to 0.95 in all tests. Following that, the specimens were subjected to isotropic consolidation under the required confining pressure according to the experiment scheme. (2) In the cyclic loading stage, long-term, low-level cyclic triaxial tests were performed under different conditions. Long-term, low-level cyclic loading was applied only to specimens in the axial direction and the lateral stress was invariable, as shown in Figure 6. The details of the experiment scheme are summarized in Table 1 in detail. Note that the loading frequency was 1 Hz in this paper. (3) In the post-cyclic monotonic loading stage, a series of strain-controlled standard monotonic loading tests with the loading rate of 1%/min were conducted to study the post-cyclic behavior.
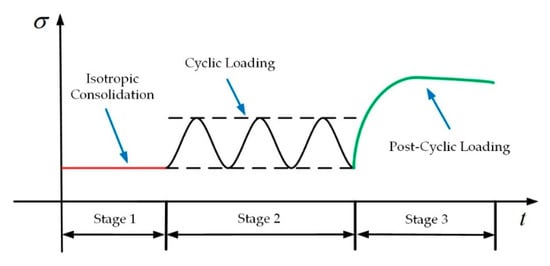
Figure 5.
The experiment procedure.
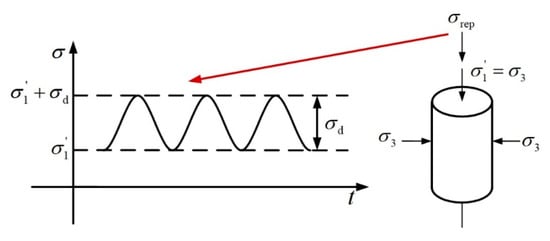
Figure 6.
Load-on pattern of cyclic loading.

Table 1.
Details of cyclic loading scheme.
The results of the field measurement [41] show that the range of repeated load is 14.6 kPa to 46.4 kPa when the truck speed is 70 km/h. In order to investigate the impact of repeated cyclic stress amplitude on the cyclic and post-cyclic behavior in more detail, the repeated cyclic stress amplitudes range from 0.124 kN to 0.25 kN. According to previous studies [42,43], the conclusion that the confining pressures of 50 kPa, 100 kPa, and 150 kPa can represent the actual confining pressures of traffic loading can be achieved. Moreover, in order to investigate the influence law of confining pressure on the cyclic and post-cyclic behavior in more detail, the maximum confining pressure is 300 kPa. Sukmak [44] and Ho [45] conducted a series of laboratory tests to analyze the engineering performance of stabilized soft soil and suggested that the range of cement content was 5–15%. In order to investigate the influence of cement content on cyclic and post-cyclic behavior in more detail, the cement contents range from 3% to 15%. As mentioned previously, the sand content of soft soil is 10% in actual engineering; therefore, in order to investigate the impact of sand content on cyclic and post-cyclic behavior in more detail, the sand contents range from 10% to 30%.
3. Cyclic Behavior of Stabilized Sand-Containing Soft Soil
As mentioned previously, the cyclic behavior of stabilized sand-containing soft soil can be characterized by stiffness. In this section, the effects of sand content, cement content, confining pressure, and repeated cyclic stress amplitude on stiffness were analyzed.
3.1. Influence of Sand Content on Stiffness
In order to study the influence law of sand content on stiffness, five cyclic loading tests with different sand contents (10%, 15%, 20%, 25%, and 30%) were carried out. The effect of sand content on stiffness is presented in Figure 7. As presented in Figure 7a, stiffness is strongly influenced by sand content and decreases with the increase in sand content throughout the loading process. The results may be caused by the fact that the lower the sand content is, the denser the specimen is. As a result, the specimen cannot be compressed easily and the stiffness of the specimen with a low sand content is greater. As shown in Figure 7b, for a given number of loading cycles, stiffness almost linearly decreases with the increase in sand content. When the number of loading cycles is 20, stiffness decreases from 75 MPa to 50 MPa as the sand content increases from 10% to 30%. The results may be caused by the fact that the lower the sand content is, the denser the specimen is. As a result, the stiffness of the specimens with low sand content is greater.
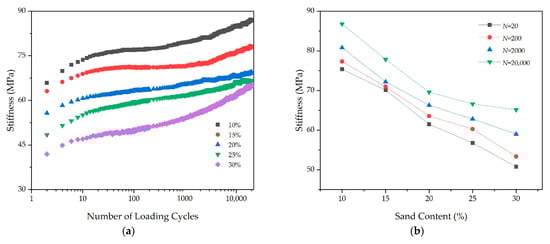
Figure 7.
The effect of sand content on the relationship between stiffness and number of loading cycles: (a) the effect of sand content on stiffness; and (b) the stiffness for a given number of loading cycles.
3.2. Influence of Cement Content on Stiffness
The impact of cement content on stiffness was studied by five cyclic loading tests with different cement contents (3%, 6%, 9%, 12%, and 15%) and can be indicated by Figure 8. As presented in Figure 8a, it is apparent that cement content has the greatest impact on stiffness. The stiffness increases significantly as the cement content increases from 3% to 15%. One reason which can explain this phenomenon is that the inter-particle bonding strength is greater for the specimens with a high cement content. As shown in Figure 8b, for each number of loading cycles, the biggest increasing degree of stiffness can be found as the cement content increases from 3% to 6%.
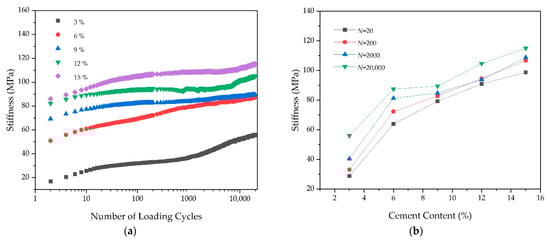
Figure 8.
The effect of cement content on the relationship between stiffness and number of loading cycles: (a) the effect of cement content on stiffness; and (b) the stiffness for a given number of loading cycles.
3.3. Influence of Confining Pressure on Stiffness
In order to study the influence of confining pressure on stiffness, four cyclic loading tests with different confining pressures (50 kPa, 100 kPa, 200 kPa, and 300 kPa) were carried out. The effect of confining pressure on stiffness is shown in Figure 9. According to the measured results shown in Figure 9a, stiffness is strongly influenced by confining pressure. It is obvious that for a given number of loading cycles, the higher the confining pressure is, the greater the stiffness is. As shown in Figure 9b, when the number of loading cycles is 2000, a 109% growth in stiffness can be found as the confining pressure increases from 50 kPa to 300 kPa. One reason may contribute to the occurrence of this phenomenon: the higher confining pressure can give rise to the ordered rearrangement of soil particles.
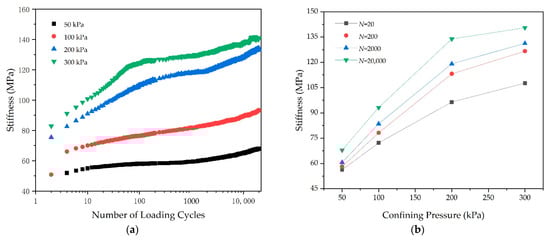
Figure 9.
The effect of confining pressure on the relationship between stiffness and number of loading cycles: (a) the effect of confining pressure on stiffness; and (b) the stiffness for a given number of loading cycles.
3.4. Influence of Repeated Cyclic Stress Amplitude on Stiffness
The impact of repeated cyclic stress amplitude on stiffness was investigated by five cyclic loading tests with different repeated loads (0.124 kN, 0.15 kN, 0.19 kN, 0.22 kN, and 0.25 kN) and can be indicated by Figure 10. As shown in Figure 10a, for the specimens subjected to a higher repeated load (0.19 kN, 0.22 kN, and 0.25 kN), the stiffness decreases with the increase in repeated cyclic stress amplitude. One reason which can explain this phenomenon is that the internal structure of soil (e.g., soil skeleton) can be destroyed under long-term, high-level repeated cyclic loading (0.19 kN, 0.22 kN and 0.25 kN) and leads to the fact that the specimen can be compressed easily. As a result, the stiffness of the specimen subjected to a higher repeated load (0.19 kN, 0.22 kN and 0.25 kN) is lower. In addition, for the specimens subjected to a lower repeated load (0.124 kN and 0.15 kN), the stiffness increases with the increase in repeated cyclic stress amplitude. The results may be due to the fact that the specimens can become denser continuously under long-term, low-level, repeated cyclic loading and leads to the fact that the resistance to the deformation of specimens is enhanced. As a result, the stiffness of the specimen subjected to a lower repeated load (0.124 kN and 0.15 kN) is greater.
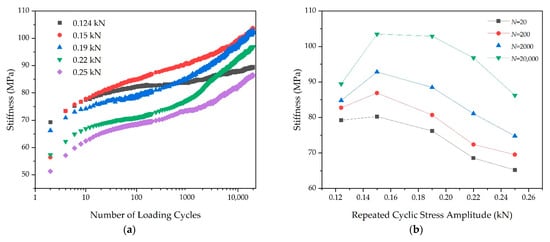
Figure 10.
The effect of repeated cyclic stress amplitude on the relationship between stiffness and number of loading cycles: (a) the effect of repeated cyclic stress amplitude on stiffness; and (b) the stiffness for a given number of loading cycles.
It should be pointed out that all test data points are located in particular ranges, as shown in Figure 11. The top-bound curve and bottom-bound curve are test data (B4) and test data (B10), respectively. The average value of stiffness ranges from 59 MPa to 90 Mpa.
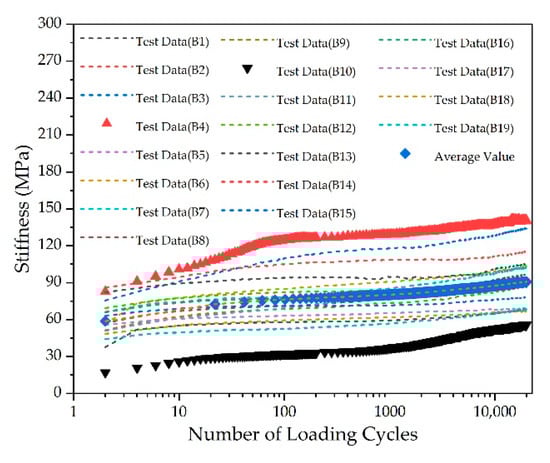
Figure 11.
The distribution of stiffness.
4. Stiffness Evolution Index Model
4.1. Stiffness Evolution Index
In this paper, the stiffness evolution index proposed by Idriss [46] was introduced to characterize the evolution law of stiffness.
The stiffness evolution index can be described by Equation (2).
where and are the stiffness at loading cycles N and 1, respectively.
The influences of sand content, cement content, confining pressure, and repeated cyclic stress amplitude on the stiffness evolution index can be indicated by Figure 12. It is quite clear that stiffness evolution index is greater than one for each cyclic loading test. Although the stiffness evolution index is extremely influenced by sand content, cement content, confining pressure, and repeated cyclic stress amplitude, cement content is the most important influencing factor. When the number of loading cycles is equal to 20,000, the stiffness evolution index decreases from 3.3 to 1.2 as the cement content increases from 3% to 15%, as shown in Figure 12b.
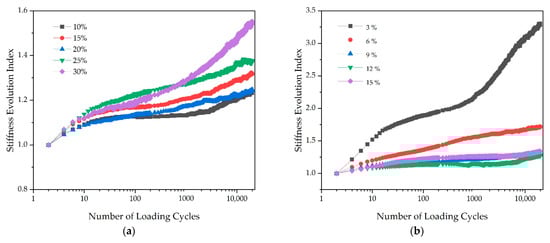
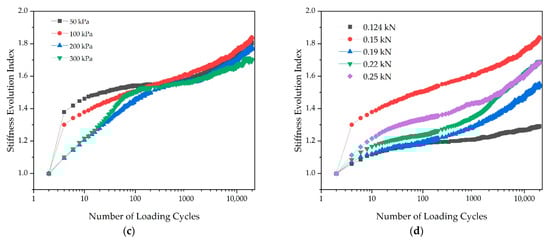
Figure 12.
The effects of various influencing factors on stiffness evolution index: (a) sand content; (b) cement content; (c) confining pressure; and (d) repeated cyclic stress amplitude.
It should be noted that all the test data points are located in particular ranges, as shown in Figure 13. The top-bound curve and bottom-bound curve are the test data (B10) and test data (B15), respectively. The average value of stiffness evolution index ranges from 1 to 1.6.
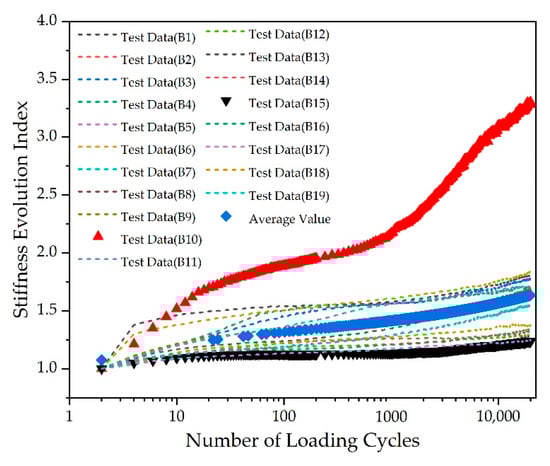
Figure 13.
The distribution of stiffness evolution index.
4.2. Improved Yasuhara Model
The Yasuhara model [47] which can be written by Equation (3) is frequently used to describe the stiffness evolution index of soil.
Unfortunately, it should be noted that the Yasuhara model cannot well describe the non-linear relationship between the stiffness evolution index and lgN. As a result, the Yasuhara model is not suitable for the description of the stiffness evolution index in this study, as presented in Figure 14.
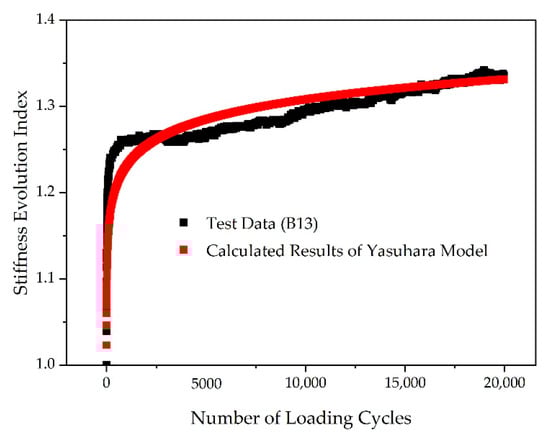
Figure 14.
The comparison of test data and calculated results of Yasuhara model.
In order to describe the stiffness evolution index accurately, the Yasuhara model needs to be improved. Based on the Yasuhara model, many researchers [48,49] have proposed various improved models and found that the improved model (which can be expressed by high-order polynomials) can describe the non-linear relationship between the stiffness evolution index and lgN. By referencing previous research results, it is assumed that the stiffness evolution index model can be expressed by three-order polynomials. In this study, based on the Yasuhara model, the improved model can be written as Equation (4):
4.3. Model Calibration
The effectiveness of the improved model was validated by comparing test data and calculated results from the improved model, as presented in Figure 15. The parameters, root mean square error (RMSE) and coefficient of determination (COD) of the improved model are listed in Table 2. The results in Figure 15 make it clear that the calculated results from the improved model show a good agreement with laboratory data. Take sample B13 as an example: the RMSE of the proposed model and the Yasuhara model are 0.048 and 0.054, respectively. The COD of the proposed model and the Yasuhara model are 0.9604 and 0.6008, respectively. Hence, the improved model proposed in this paper can provide a good description of the stiffness evolution index.
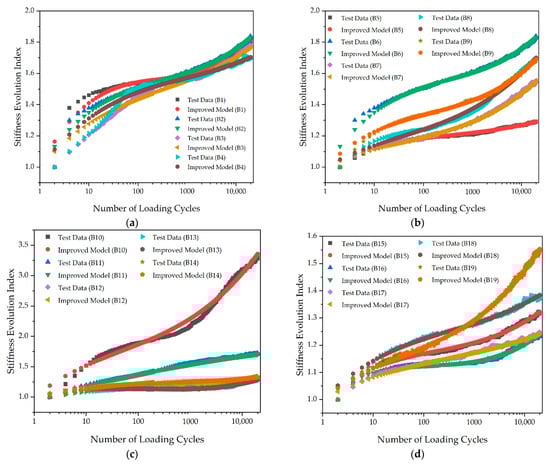
Figure 15.
The calibration of improved model: (a) B1-B4; (b) B5-B9; (c) B10-B14; and (d) B15-B19.
Table 2.
The parameters, RMSE, and COD of improved model.
5. Post-Cyclic Behavior of Stabilized Sand-Containing Soft Soil
As mentioned previously, the post-cyclic stress–strain curve can be used to characterize the post-cyclic behavior of stabilized sand-containing soft soil. The stress history and other influencing factors, such as cement content and confining pressure, can affect the post-cyclic stress–strain curve. In order to study the post-cyclic behavior in more detail, the effects of stress history and other influencing factors on the post-cyclic stress–strain curve were analyzed in this section.
Figure 16 illustrates the influence law of stress history on the post-cyclic stress–strain curve. The stress–strain curve of specimens under standard monotonic loading tests without previous cyclic loading is also plotted for comparison in Figure 16. Note that means cement content, means confining pressure, PCMLT means post-cyclic monotonic loading test, and MLT means standard monotonic loading test without previous cyclic loading in Figure 16.
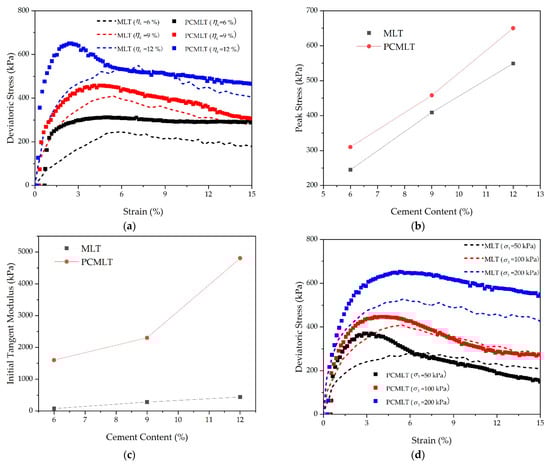
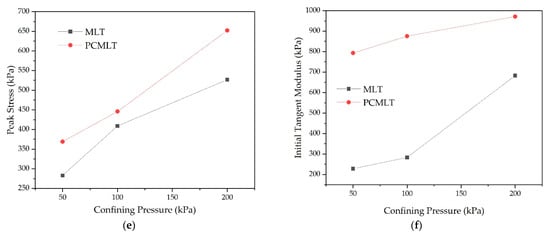
Figure 16.
The post-cyclic stress–strain curve: (a) the effect of cement content on the post-cyclic stress–strain curve; (b) the effect of cement content on the post-cyclic peak stress; (c) the effect of cement content on the post-cyclic initial tangent modulus; (d) the effect of confining pressure on the post-cyclic stress–strain curve; (e) the effect of confining pressure on the post-cyclic peak stress; and (f) the effect of confining pressure on the post-cyclic initial tangent modulus.
As presented in Figure 16a,d, the type and development of each stress–strain curve are similar, but the initial value of the post-cyclic axial strain is non-zero due to the accumulative strain caused by previous cyclic loading. Take Figure 16a as an example: the initial values of the post-cyclic axial strain are 0.67%, 0.29%, and 0.18% corresponding to the cement contents of 6%, 9%, and 12%. In addition, compared with MLT, post-cyclic stress increases rapidly within a small range of strain and can reach peak stress with great speed.
As presented in Figure 16b,e, post-cyclic peak stress is significantly different from the peak stress of MLT. Take Figure 16b as an example: when the cement content is 6%, the peak stresses of PCMLT and MLT are 321 kPa and 245 kPa, respectively. As presented in Figure 16c,f, stress history has a significant effect on initial tangent modulus. Take Figure 16f as an example: when the confining pressure is 50 kPa, the post-cyclic initial tangent modulus is about 3.5 times that of the initial tangent modulus of PCMLT. The possible reason for this difference is that the specimens are compacted continuously under long-term, low-level, repeated cyclic loading and the specimen has enough ability to resist deformation and failure.
At the same time, Figure 16 can also reveal the effects of other influencing factors, such as cement content and confining pressure, on the post-cyclic stress–strain curve. It can be seen that all specimens present strain-softening phenomena in general. As presented in Figure 16a,b, it is quite clear that post-cyclic stress–strain curve is strongly influenced by cement content, and that post-cyclic peak stress exhibits an almost linearly increasing trend with the increase in cement content. The post-cyclic initial tangent modulus increases from 1602 kPa to 4803 kPa as the cement content increases from 6% to 12%, as shown in Figure 16c. As presented in Figure 16d, the initial values of post-cyclic axial strain are 0.52%, 0.43%, and 0.27%, corresponding to the confining pressures of 50 kPa, 100 kPa, and 200 kPa. As presented in Figure 16e,f, a general conclusion that post-cyclic peak stress and the initial tangent modulus increase with the increase in confining pressure for all tests can be achieved.
6. Conclusions
In order to investigate the cyclic and post-cyclic behavior of stabilized sand-containing soft soil in coastal areas accurately, a series of cyclic triaxial tests and standard monotonic loading tests in a laboratory were performed. Furthermore, the stiffness evolution index model was proposed in this study. Based on the test data, the following conclusions can be drawn:
- When the number of loading cycles is 20, the stiffness decreases from 75 MPa to 50 MPa as the sand content increases from 10% to 30%. The inter-particle bonding strength is greater for the specimens with a high cement content.
- When the number of loading cycles is 2000, a 109% growth in stiffness can be found as the confining pressure increases from 50 kPa to 300 kPa. The improved model proposed in this paper can provide a good description of the stiffness evolution index.
- Due to stress history, the initial values of post-cyclic axial strain are 0.67%, 0.29%, and 0.18%, corresponding to the cement contents of 6%, 9%, and 12%. When the confining pressure is 50 kPa, the post-cyclic initial tangent modulus is approximately 3.5 times that of the initial tangent modulus of PCMLT.
- The cyclic and post-cyclic behavior of soft soil can be characterized by stiffness and pore pressure. Unfortunately, the experimental data of pore pressure was not recorded due to the failure of the pore pressure sensor. This paper investigated the evolution law of stiffness, and future extensions of the current work will analyze the evolution law of pore pressure.
Author Contributions
Conceptualization, L.A.; data curation, P.L.; formal analysis, L.Y.; investigation, X.Z.; methodology, L.Y.; resources, D.L.; software, L.G.; validation, D.L.; writing—original draft, L.W. All authors have read and agreed to the published version of the manuscript.
Funding
This research was funded by (1) Jiangxi Provincial Natural Science Foundation (No. 20202BABL204052 and No. 20202BABL214047); (2) Doctoral Natural Science Foundation of East China University of Technology (No. DHBK2019229 and No. DHBK2019243); (3) the National Natural Science Foundation of China, grant number 52108346; (4) the State Key Laboratory Project of China, grant number SKLFSE202019; and (5) Hunan Provincial Natural Science Foundation, grant number 2019JJ70084.
Institutional Review Board Statement
Not applicable.
Informed Consent Statement
Not applicable.
Data Availability Statement
Not applicable.
Acknowledgments
The authors gratefully thank the anonymous reviewers for their constructive comments on improving the presentation. All authors have agreed to the listing of authors.
Conflicts of Interest
The authors declare no conflict of interest.
References
- Ministry of Ecology and Environment of People’s Republic of China. Available online: https://www.mee.gov.cn/hjzl/ (accessed on 6 November 2022).
- Borrelli, P.; Robinson, D.; Panagos, P.; Lugato, E.; Yang, J.; Alewell, C.; Wuepper, D.; Montanarella, L.; Ballabio, C. Land Use and Climate Change Impacts on Global Soil Erosion by Water (2015–2070). Proc. Natl. Acad. Sci. USA 2020, 117, 21994–22001. [Google Scholar] [CrossRef] [PubMed]
- Jiang, Z.; Gao, X.; Feng, X.; Chen, D. Research on the Application of Foamed Lightweight Concrete (FLC) in the Construction of Highway Soft Soil Foundation Engineering with Buried High-Pressure Gas Pipes. Appl. Sci. 2022, 12, 10119. [Google Scholar] [CrossRef]
- Gu, S.; Liu, W.; Ge, M. Failure and Remediation of an Embankment on Rigid Column-Improved Soft Soil: Case Study. Adv. Civ. Eng. 2020, 2020, 2637651. [Google Scholar] [CrossRef]
- Zhang, D.; Zhang, Y.; Kim, C.; Meng, Y.; Garg, A.; Garg, A.; Fang, K. Effectiveness of CFG Pile-Slab Structure on Soft Soil for Supporting High-Speed Railway Embankment. Soils Found. 2018, 58, 1458–1475. [Google Scholar] [CrossRef]
- Duan, W.; Liu, S.; Cai, G. Evaluation of Engineering Characteristics of Lian-Yan Railway Soft Soil Based on CPTU Data—A Case Study. Proc. Eng. 2017, 189, 33–39. [Google Scholar] [CrossRef]
- Wang, F.; Shao, J.; Li, W.; Wang, Y.; Wang, L.; Liu, H. Study on the Effect of Pile Foundation Reinforcement of Embankment on Slope of Soft Soil. Sustainability 2022, 14, 14359. [Google Scholar] [CrossRef]
- Wang, A.; Zhan, Q.; Dong, W.; Gu, W.; Zhou, J.; Pan, Z. Influence of Recycled Fine Aggregate Content on Properties of Soft Soil Solidified by Industrial Waste Residue. Materials 2022, 15, 7580. [Google Scholar] [CrossRef]
- Elsawy, M.B.D.; Alsharekh, M.F.; Shaban, M. Modeling Undrained Shear Strength of Sensitive Alluvial Soft Clay Using Machine Learning Approach. Appl. Sci. 2022, 12, 10177. [Google Scholar] [CrossRef]
- Li, P.-Y.; Dou, H.-Q.; Wang, H.; Nie, W.-F.; Chen, F.-Q. Stability Analysis of Pile-Supported Embankments over Soft Clay Considering Soil Failure between Piles Based on Upper Bound Theorem. Sustainability 2022, 14, 11652. [Google Scholar] [CrossRef]
- Wang, X.; Cui, J.; Zhu, C.Q.; Wu, Y.; Wang, X.Z. Experimental Study of the Mechanical Behavior of Calcareous Sand under Repeated Loading-Unloading. Bull. Eng. Geol. Environ. 2021, 80, 3097–3113. [Google Scholar] [CrossRef]
- Wang, X.; Wang, Y.; Liao, C.; Cui, J.; Shen, J.H.; Wang, X.Z.; Zhu, C.Q. Particle Breakage Mechanism and Particle Shape Evolution of Calcareous Sand under Impact Loading. Bull. Eng. Geol. Environ. 2022, 81, 372. [Google Scholar] [CrossRef]
- Wang, X.; Wu, Y.X.; Lu, Y.; Cui, J.; Wang, X.Z.; Zhu, C.Q. Strength and Dilatancy of Coral Sand in the South China Sea. Bull. Eng. Geol. Environ. 2021, 80, 8279–8299. [Google Scholar] [CrossRef]
- Wang, X.; Cui, J.; Wu, Y.; Zhu, C.Q.; Wang, X.Z. Mechanical Properties of Calcareous Silts in A Hydraulic Fill Island-Reef. Mar. Georesour. Geotec. 2020, 39, 1–14. [Google Scholar] [CrossRef]
- Liu, C.; Lv, Y.; Yu, X.; Wu, X. Effects of Freeze-Thaw Cycles on the Unconfined Compressive Strength of Straw Fiber-Reinforced Soil. Geotext. Geomembr. 2020, 48, 581–590. [Google Scholar] [CrossRef]
- Anggraini, V.; Asadi, A.; Huat, B.B.K.; Nahazanan, H. Effects of Coir Fibers on Tensile and Compressive Strength of Lime Treated Soft Soil. Measurement 2015, 59, 372–381. [Google Scholar] [CrossRef]
- Silveira, M.R.; Lodi, P.C.; Correia, N.S.; Rodrigues, R.A.; Giacheti, H.L. Effect of Recycled Polyethylene Terephthalate Strips on the Mechanical Properties of Cement-Treated Lateritic Sandy Soil. Sustainability 2020, 12, 9801. [Google Scholar] [CrossRef]
- Wu, J.; Liu, L.; Deng, Y.; Zhang, G.; Zhou, A.; Wang, Q. Distinguishing the Effects of Cementation versus Density on the Mechanical Behavior of Cement-Based Stabilized Clays. Constr. Build. Mater. 2021, 271, 121571. [Google Scholar] [CrossRef]
- Li, Q.; Cui, K.; Jing, X.; Li, P.; Dong, H. Influence of Stress History on the Cyclic Behavior of Compacted Soils in the Frozen State: Deviator Stress History. Soil Dyn. Earthq. Eng. 2022, 153, 107074. [Google Scholar] [CrossRef]
- Yu, J.; Sun, M.; He, S.; Huang, X.; Wu, X.; Liu, L. Accumulative Deformation Characteristics and Microstructure of Saturated Soft Clay under Cross-River Subway Loading. Materials 2021, 14, 537. [Google Scholar] [CrossRef]
- Kong, B.; Dai, C.-X.; Hu, H.; Xia, J.; He, S.-H. The Fractal Characteristics of Soft Soil under Cyclic Loading Based on SEM. Fractal Fract. 2022, 6, 423. [Google Scholar] [CrossRef]
- Kaya, Z.; Erken, A. Cyclic and Post-Cyclic Monotonic Behavior of Adapazari Soils. Soil Dyn. Earthq. Eng. 2015, 77, 83–96. [Google Scholar] [CrossRef]
- Wang, S.Y.; Luna, R.; Onyejekwe, S. Effect of Initial Consolidation Condition on Postcyclic Undrained Monotonic Shear Behavior of Mississippi River Valley Silt. J. Geotech. Geoenviron. 2016, 142, 04015075. [Google Scholar] [CrossRef]
- Noorzad, R.; Shakeri, M. Effect of Silt on Post-Cyclic Shear Strength of Sand. Soil Dyn. Earthq. Eng. 2017, 97, 133–142. [Google Scholar] [CrossRef]
- Wang, S.Y.; Luna, R.; Zhao, H.H. Cyclic and Post-Cyclic Shear Behavior of Low-Plasticity Silt with Varying Clay Content. Soil Dyn. Earthq. Eng. 2015, 75, 115–120. [Google Scholar] [CrossRef]
- Dahl, K.; DeJong, J.; Boulanger, R.; Pyke, R.; Wahl, D. Characterization of an Alluvial Silt and Clay Deposit for Monotonic, Cyclic, and Post-Cyclic Behavior. Can. Geotech. J. 2014, 51, 432–440. [Google Scholar] [CrossRef]
- Liu, Y.; Liang, Z.; Liu, Z.; Nie, G. Post-Cyclic Drained Shear Behaviour of Fujian Sand under Various Loading Conditions. J. Mar. Sci. Eng. 2022, 10, 1499. [Google Scholar] [CrossRef]
- Soroush, A.; Soltani-Jigheh, H. Pre- and Post-Cyclic Behavior of Mixed Clayey Soils. Can. Geotech. J. 2009, 46, 115–128. [Google Scholar] [CrossRef]
- Paramasivam, B.; Banerjee, S. Factors Affecting Post-Cyclic Undrained Shear Strength of Marine Clay. Geotech. Geol. Eng. 2017, 35, 1783–1791. [Google Scholar] [CrossRef]
- Lu, Y.; Chen, J.; Huang, J.; Feng, L.; Yu, S.; Li, J.; Ma, C. Post-Cyclic Mechanical Behaviors of Undisturbed Soft Clay with Different Degrees of Reconsolidation. Appl. Sci. 2021, 11, 7612. [Google Scholar] [CrossRef]
- Huang, J.; Chen, J.; Ke, W.; Zhong, Y.; Lu, Y.; Yi, S. Post-Cyclic Mechanical Behaviors of Laterite Clay with Different Cyclic Confining Pressures and Degrees of Reconsolidation. Soil Dyn. Earthq. Eng. 2021, 151, 106986. [Google Scholar] [CrossRef]
- Lei, J.; Wang, T.; Zhang, B.; Li, F.; Liu, C. Cyclic and Post-Cyclic Characteristics of Marine Silty Clay under the Multistage Cycling-Reconsolidation Conditions. Ocean. Eng. 2022, 258, 111803. [Google Scholar] [CrossRef]
- Lu, Y.; Chen, D.; Chen, J.; Yu, S.; Huang, J.; Fu, X.; Ma, C. Post-cyclic strength behaviors of undisturbed soft soils with different degrees of reconsolidation. Chin. J. Geotech. Eng. 2021, 43, 189–192. [Google Scholar]
- Jana, A.; Stuedlein, W. Monotonic, Cyclic, and Postcyclic Responses of an Alluvial Plastic Silt Deposit. J. Geotech. Geoenviron. 2021, 147, 04020174. [Google Scholar] [CrossRef]
- Chitravel, S.; Otsubo, M.; Kuwano, R. Effects of Internal Erosion on the Cyclic and Post-Cyclic Mechanical Behaviours of Reconstituted Volcanic Ash. Soils Found. 2022, 62, 101111. [Google Scholar] [CrossRef]
- Wu, D.; Zhang, Z.; Chen, K.; Xia, L. Experimental Investigation and Mechanism of Fly Ash/Slag-Based Geopolymer-Stabilized Soft Soil. Appl. Sci. 2022, 12, 7438. [Google Scholar] [CrossRef]
- Liu, Y.; Liu, Z.; Oh, E.; Ong, D.E.L. Strength and Microstructural Assessment of Reconstituted and Stabilised Soft Soils with Varying Silt Contents. Geosciences 2021, 11, 302. [Google Scholar] [CrossRef]
- Kovačević, M.S.; Bačić, M.; Librić, L.; Gavin, K. Evaluation of Creep Behavior of Soft Soils by Utilizing Multisensor Data Combined with Machine Learning. Sensors 2022, 22, 2888. [Google Scholar] [CrossRef]
- Zhu, J.; Zhao, H.; Luo, Z.; Liu, H. Investigation of the Mechanical Behavior of Soft Clay under Combined Shield Construction and Ocean Waves. Ocean. Eng. 2020, 206, 107250. [Google Scholar]
- Kafodya, I.; Okonta, F. Cyclic and Post-Cyclic Shear Behaviours of Natural Fibre Reinforced Soil. Int. J. Geotech. Eng. 2019, 15, 1145–1154. [Google Scholar] [CrossRef]
- An, L.; Zhang, F.; Geng, Y.; Lin, B. Field Measurement of Dynamic Compressive Stress Response of Pavement-Subgrade Induced by Moving Heavy-Duty Trucks. Shock Vib. 2018, 2018, 1956906. [Google Scholar] [CrossRef]
- Dai, D.; Peng, J.; Bai, L.; Li, G.; Lin, H. The Effect of Superabsorbent Polymer on the Resilient and Plastic Strain Behavior of Cemented Soil under Traffic Load. Polymers 2022, 14, 929. [Google Scholar] [CrossRef] [PubMed]
- Jaffar, S.T.A.; Muneeb Abid, M.; Khan, S.Z.; Jafri, T.; Rehman, Z.U.; Tariq, M.A.U.R.; Ng, A.W.M. Evaluation of Conventional and Sustainable Modifiers to Improve the Stiffness Behavior of Weak Sub-Grade Soil. Sustainability 2022, 14, 2493. [Google Scholar] [CrossRef]
- Sukmak, P.; Sukmak, G.; Horpibulsuk, S.; Kassawat, S.; Suddeepong, A.; Arulrajah, A. Improved Mechanical Properties of Cement-Stabilized Soft Clay Using Garnet Residues and Tire-Derived Aggregates for Subgrade Applications. Sustainability 2021, 13, 11692. [Google Scholar] [CrossRef]
- Ho, T.O.; Chen, W.B.; Yin, J.H.; Amiri, O.; Wu, P.C.; Tsang, D.C.W. Stress-Strain Behaviour of Cement-Stabilized Hong Kong marine deposits. Constr. Build. Mater. 2021, 274, 122103. [Google Scholar] [CrossRef]
- Idriss, I.; Dobry, R.; Singh, R. Nonlinear Behavior of Soft Clays during Cyclic Loading. J. Geotech. Eng. Div. 1978, 104, 1427–1447. [Google Scholar] [CrossRef]
- Yasuhara, K.; Hyde, A.; Toyota, N. Cyclic Stiffness of Plastic Silt with an Initial Drained Shear Stress. In Pre-Failure Deformation Behaviour of Geomaterials; ICE Publishing: London, UK, 1998. [Google Scholar]
- Liu, X.; Pan, S.; Yuan, S.; Chen, K.; Ma, J.; Chen, Y. Study on Stiffness Softening and Attenuation Characteristics of Compacted Red Mudstone. J. Railway. Sci. Eng. 2022, 19, 2629–2636. [Google Scholar]
- Zhong, Z.; Zou, H.; Hu, X.; Liu, X. Experimental Study on Stiffness Softening of Soil-Rock Mixture Backfill under Metro Train Cyclic Load. Adv. Mater. Sci. Eng. 2021, 2021, 3024490. [Google Scholar] [CrossRef]


Publisher’s Note: MDPI stays neutral with regard to jurisdictional claims in published maps and institutional affiliations. |
© 2022 by the authors. Licensee MDPI, Basel, Switzerland. This article is an open access article distributed under the terms and conditions of the Creative Commons Attribution (CC BY) license (https://creativecommons.org/licenses/by/4.0/).