1. Introduction
Green innovation is defined by Driessen and Hillebrand as “a rather pragmatic definition” of trading decisions, stating that “it does not have to be developed with the goal of reducing the environmental burden” [
1]. Others have defined green innovation as a competitive resource for business strategy because it takes a sustainable approach to new markets and applications [
2]. Green innovation is also an important way for enterprises to achieve long-term economic benefits and environmental protection [
3].
The research on green innovation was first active in European countries [
4]. China’s green transition started relatively late, and there is little research on green innovation in China, but China’s green innovation ability is very strong, and the future of China’s economy is moving towards a “carbon peaking and carbon neutrality” target [
5]. In the future, China could play a key role in the global transition to a low-carbon economy. Therefore, it is of practical and theoretical significance to study the impact of board diversity on China’s green innovation and global low-carbon economic transformation and green transition.
With China’s recent high-quality economic growth and green innovation being in a prominent position in the development strategy, green development has become an inevitable trend. China actively responded to the global call for green and low-carbon by establishing a unified carbon emission system in 2014 [
6]. Government policies also actively promote industrial upgrading to sustainable development [
7,
8]. However, China’s current overall innovation level is still characterized by having a large quantity but low quality, and the proportion of green innovation remains low. Environmental pollution is a salient problem that cannot be ignored in China’s sustainable development [
9].
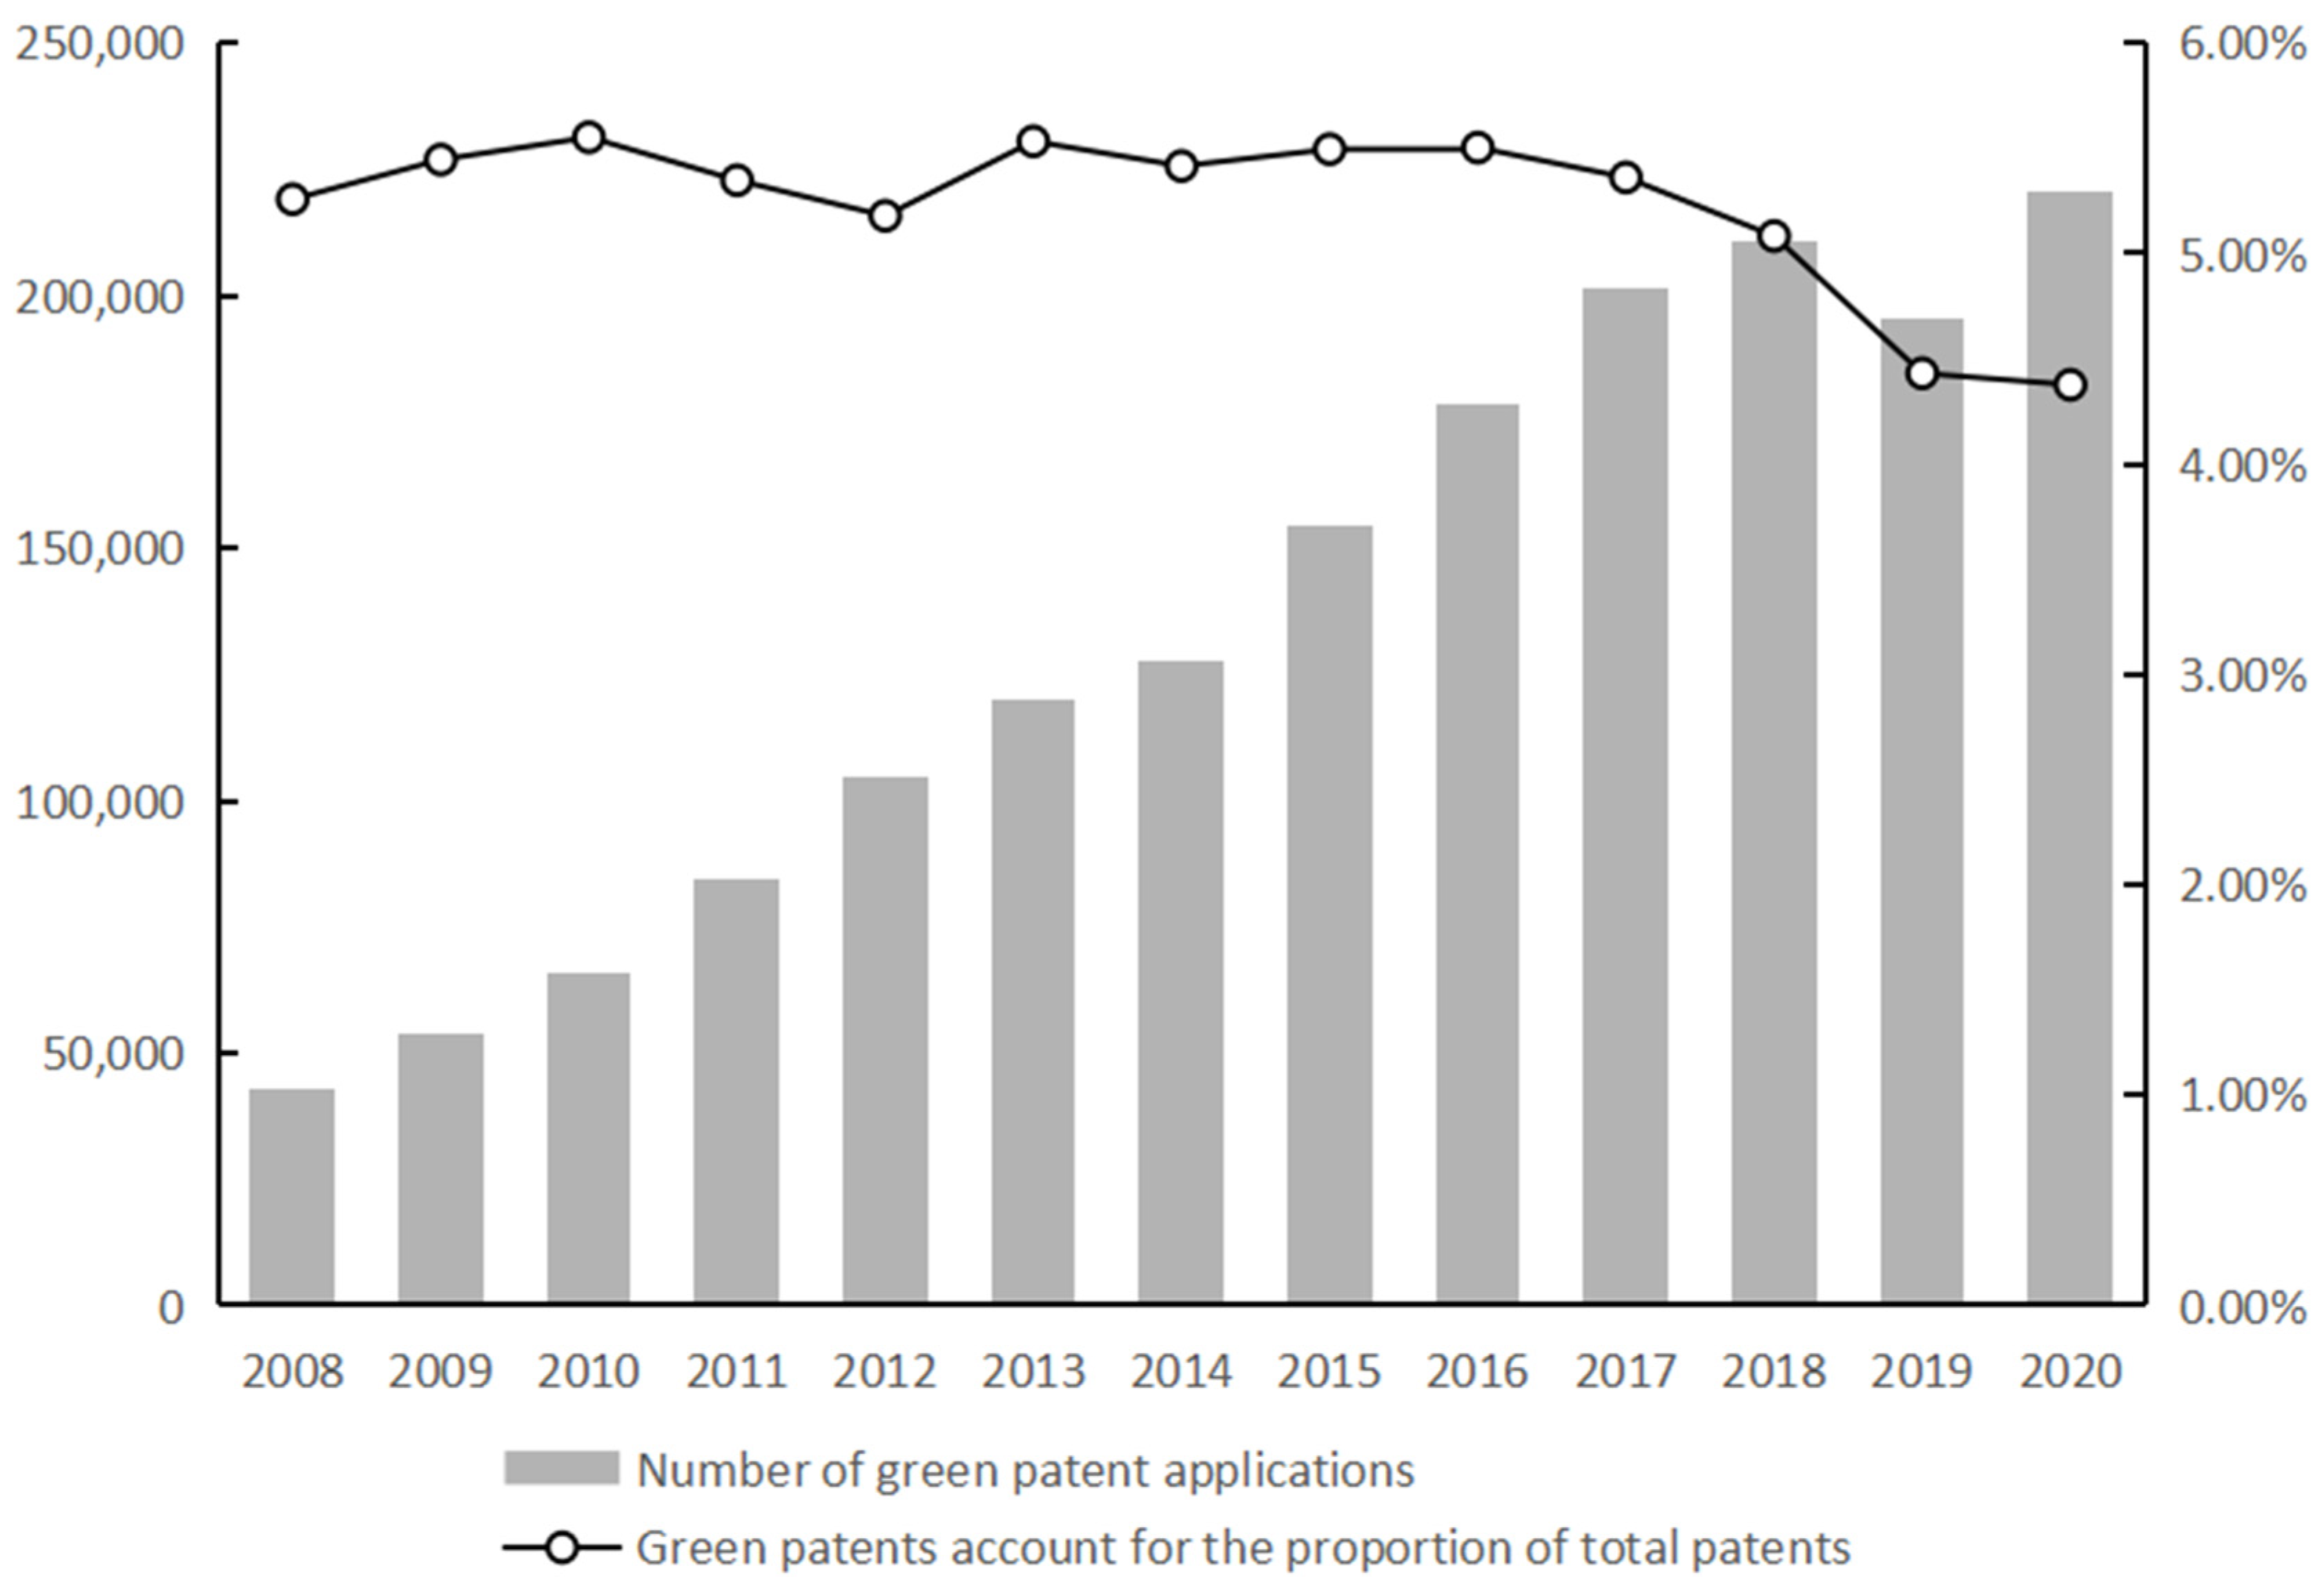
Figure 1 shows the expanding of the overall trend of the number of green patent applications in China from 2008 to 2020. However, there was a slight decline in 2019. This is probably due to China’s inclusion of innovation-driven strategy in one of its national development strategies in 2018. Therefore, the total number of innovation patents in China increased sharply in 2019. Compared with the total number of patents, the growth rate of green patents is slightly slower.
While pursuing economic benefits, enterprises should also consider ecological benefits—studies found that the gender of leaders, their governance style [
8,
9,
10], and their personal education background also have an impact on environmental investment. Accordingly, this study focuses on women’s contribution to environmental decision-making in enterprises, contributing to the larger gender equality movement and the global improvement of women’s social status.
According to CS Gender 3000 (2019), women make up 20.6% of board members worldwide, compared with 11.0% in China, up from 0.9% in 2010. This set of data clearly shows that Chinese women’s voice in the enterprise still has a lot of room for improvement. We are heartened by the growing “Her power” of women in business around the world, and research has confirmed that female chief technology officers (CTOS) have a positive impact on corporate innovation [
11]; a study of 472 transnational corporations demonstrated a positive correlation between gender diversity and firm innovation [
12]. But in China, the question of whether board diversity has a positive impact on companies’ green innovation has yet to be proven. Studying the impact of board diversity on green innovation in China can improve the voice of Chinese women in business and, to a large extent, positively encourage female directors in existing companies to play to their strengths; increasing the “Her power” of Chinese women in business will have a positive impact on both the environment and the economy.
Sustainable development is China’s long-term goal—economic stimulus measures in the wake of the pandemic likely spur further development of green innovation, channeling economic stimulus funds into green projects [
13,
14,
15]. The United Nations Intergovernmental Panel on Climate Change (IPCC) proposed in 2018 following the Paris Agreement that limiting global warming to 1.5 °C has apparent ecological benefits. Various governments and communities increasingly hope that enterprises follow the green agenda when carrying out innovation, thereby unleashing the vitality of the global economy, promoting a comprehensive green socio-economic transformation, providing wide social impact, and enabling the joint creation of a better post-pandemic global community [
16,
17].
It is necessary to understand the importance of reflecting the green innovation decisions of enterprises since these inevitably achieve sustainable development of companies. Simultaneously, these decisions also garner favorable regard from national policy [
17,
18]. Green innovation is closely related to the international strategy of “emission reduction and carbon reduction” and maintains the implementation of sustainable strategies within enterprises. The size of the board of directors and the level of board governance both influence the green innovation strategy of the enterprise, with the board of directors playing an influential role in promoting the enterprise’s green innovation decisions [
19,
20,
21]. As an important aspect of the board, the gender diversity of the board of directors is deeply discussed in the relationship between gender diversity of the board of directors and green innovation, exploring its capacity to improve the enterprise’s green innovation and other environment related decisions.
The 2020 policy brief on COVID-19 issued by UN secretary-general António Guterres also highlighted the value of green innovation in the sustainable development of human societies. Green innovation and sustainable development are the foundations of the global economic recovery from the pandemic. He also mentioned that the pursuit of gender equality and green economic recovery was an essential aspect of achieving sustainable development goals.
The fourth World Conference on Women emphasized that “Unless women’s contributions to environmental management are recognized and noted, sustainable development will be an elusive goal”. Companies with gender-diverse boards are more environmentally friendly. Even the academic community widely recognizes the strategic benefit of women directors: McCright et al. found that after controlling for gender socialization and social role variables, women indeed pay more attention to the natural environment than their male counterparts [
22]. Gender also significantly modulates environmental concerns and green buying behavior. Socialization theory proposes that the new social role of women and how gender affects green buying behavior should be studied in the future [
23]. Women may also have a positive impact on the decision-making of environmental preference for green innovation—women on the board of directors have the right to speak in decision-making and effectively affect green innovation.
Unlike existing literature [
24,
25,
26], this study provides a more comprehensive perspective on the link between green innovation and the gender diversity of a board of directors. It uses the data of listed companies from the Shanghai and Shenzhen sectors from 2010 to 2020. Using the OLS and fixed effects models, the number of green patents and quality of green innovation were used to define green innovation, while the proportion of female directors in board members were used to define the reflections of board gender diversity. After replacing the industry-wide sample with manufacturing (a result that is also tested), results show that board gender diversity promotes green innovation. It also used the bootstrap method to test the intermediary effect of R&D and found the mechanism between board gender diversity and green innovation, which remains effective for board gender diversity in driving the number and quality of green innovation.
Furthermore, the positive intermediary mechanism of government support was reflected in the number of green innovations. Further research explored the heterogeneity of this study and found that in large enterprises, gender diversity on the board of directors jointly played a positive role in the quantity and quality of green innovation. In state-owned enterprises and enterprises with high ESG level, the gender diversity of the board of directors has a greater effect on both the quantity and quality of green innovation.
The possible contributions of this study include the following: (1) Enrichment on the research on corporate green innovation and female executives participation in corporate governance and provide empirical evidence for the future development strategies of female executives in emerging green markets; (2) emphasis on R&D and the degree of government support as important mechanisms between both by discussing the impact of the inherent mechanisms of board gender diversity on the green innovation of enterprises. Specifically, the intermediary mechanism’s active role in the level of R&D and government support; and (3) Given the heterogeneity of female directors on green innovation under different corporate governance environments and different corporate characteristics, incentivize governments to strengthen policy concerns and disseminate ecological ideas to achieve green economic development.
The following parts of this paper are organized as follows:
Section 2 provides a literature review and presents the hypotheses development.
Section 3 presents the data samples and variables.
Section 4 discusses the main empirical results, robustness analysis, and potential mechanisms. Last,
Section 5 summarizes the research and discusses its theoretical contributions.
2. Literature Review and Hypotheses Development
As the world’s largest coal producer and emitter of greenhouse gases, China’s energy sector faces many challenges in dealing with climate change as it becomes an issue of global concern. The development of green technologies for practical renewable energy has been incorporated into China’s national economic plan, and green innovation has been widely supported by policies, leading to rapid-scale development of green innovation [
27].
There are different dimensions in the selection of green innovation variables in the existing literature, including management innovation and technology innovation aiming at environmental protection [
28,
29]; enterprises can only realize green management innovation by reorganizing or adopting a new management system. The scope of green technology innovation should start from the characteristics of green technology; studies have also been conducted through green product innovation and green process innovation [
30], developmental green innovation and exploratory green innovation [
31], and green patent intensity [
32]. On this basis, this paper explores the quantity and quality of green innovation from a new perspective to observe whether the quality of green innovation will be affected under the background of rapid green transition in China.
Previous studies have shown green innovation from various perspectives. From the perspective of internal enterprises mainly concerned with corporate performance management [
33], corporate social responsibility [
34], and from the perspective of society, the existing research is mainly concerned with eco-environmental governance and renewable energy [
27]. However, there is little literature on how to influence the implementation effect of enterprise green innovation. The existing literatures show that green innovation is influenced by knowledge level, government support, and green finance [
35,
36].
Broom et al. (2009) revealed the intersection of gender and environment [
37]. In social and cultural rights, developed countries have more literature on feminist environmentalism, mainly conceptualizing the link between gender and the environment from an ideological perspective. Various studies have recognized the strategic nature of women directors [
38]. The current status of women’s representation on the board of directors explains why the company’s board of directors needs women and describes the characteristics of women who become board members from an international perspective [
39]. Gender-diverse boards are more flexible, better able to process information, and are more willing to innovate [
40].
According to upper echelons theory [
41], the demographic characteristics of the board of directors greatly affect the strategic decisions of the enterprise, such as the environmental performance of the enterprise. Female board members with unique values can provide different perspectives for decision-making [
42], and women’s unique sensitivity to nature is conducive to promoting sustainable corporate decision-making [
43,
44]. According to the ecofeminism theory, women have stronger environmental preferences [
45,
46], and women directors also minimize negative environmental problems. However, this theory often applies to the fields of sociology and psychology, and our study tests this theory in the framework of economics. Research in Italy found that female directors can strengthen environmental sustainability orientation and have a positive impact on green innovation, which supports this view. For the same reason, this paper also argues that board diversity is more likely to promote green innovation decisions [
31]. This study therefore provides a more comprehensive perspective on the link between green innovation and female directors of the board. Based on the above literature review, the following hypothesis is presented:
H1. Gender diversity in boards of directors is more likely to promote the quantity and quality of green innovation in enterprises.
Female directors both promote and inhibit corporate R&D. Essentially, this is because female directors have their own unique and stable psychology [
44]. Therefore, investment risks supervise the innovation of enterprises [
47,
48]. Gender diversity’s positive impact on R&D is also undermined if female directors have family ties to male directors [
49], but nonetheless provides information and social benefits throughout the innovation process [
50].
Female directors likewise improve the efficiency of the board of directors in the risk management of R&D investment, therein explaining why female directors weaken the role of R&D investment in promoting the future performance of enterprises [
51]. Studies on the mechanism of R&D and gender diversity in R&D teams contribute to the efficiency of corporate innovation by providing the same information and social benefits throughout the innovation process as green innovation [
50,
51]. Hence, the following hypothesis is also forwarded:
H2. R&D can be used as an intermediary mechanism to promote the quantity and quality of green innovation through board diversification.
Considerable gender differences in personal characteristics of people’s preferences exist [
42]. Women tend to support the implementation of government policies due to their environmental preferences [
52] and are likelier to receive government support [
53]. Board gender diversity also significantly boosts corporate reputation [
54] as female directors may pay more attention to the company’s environmental reputation and thus gain more corporate support. Government support is often reflected in government subsidies, which provide important opportunities for the green transformation of enterprises [
55]. A U-shaped relationship also exists between government subsidies and corporate green innovation in China’s new-energy vehicle firms [
56]. Following this stream of literature, the following hypothesis is forwarded:
H3. Government support can be used as an intermediary mechanism to promote the quantity and quality of green innovation through board diversification.
3. Data and Methodology
3.1. Data
This paper explores the data on green innovation and business operation of Chinese A-share listed companies in Shanghai and Shenzhen from 2010 to 2020. The company’s green innovation data comes from the State Intellectual Property Office. The green patent classification system refers to the list of green patents launched by the IPC Expert Committee of the World Intellectual Property Organization (WIPO) in September 2010, including seven green patented technologies for alternative energy production, transportation, energy conservation, waste management, agriculture or forestry, administration, regulation or design, and nuclear power generation according to IPC classification of listed companies of green invention patents and utility model patent data.
Business information was extracted from the CSMAR, RESSET, and CNRDS databases. To ensure that the selected sample has no errors in the model, the data was processed in turn. First, this paper excluded the financial industry and real estate enterprises from the industry classification of listed companies. Hence, the industries herein have financial attribute preference in enterprise investment. The paper also excludes the samples of enterprises with missing data and enterprises processed by special treatment and delisted enterprises. This is because the abnormal management status of these enterprises cannot correctly reflect the green innovation status of enterprises. Moreover, the data are extreme in the total sample. Then, continuous variables were winsorized at the 1% and 99% levels to mitigate concerns of extreme values.
3.2. Main Variables
Explanatory variable: board gender diversity () is the proportion of female board members in a public company. In robustness tests, the chairwoman of the board () is the dummy variable of chairwoman, the value allocated was 1 when the chairman of the board was a woman, otherwise it was 0.
Explained variable: green innovation or
, is the logarithm of adding 1 to the number of green utility model patent applications (
), the logarithm of adding 1 to the number of green utility model patents granted (
) and the quality of green utility model patents (
) of the enterprise in the current year. The natural logarithms of the variables were used to obtain decentralized and smooth continuous sample data. In addition, samples with zero number of green utility model patent applications and grants remained zero and unchanged after processing. It would take months or even more than a year for a company to get an inspector’s authorization for a green utility model patent applied for in the current year, and the application could also be rejected; this causes the number of authorizations to be lower than the number of applications. To measure the impact of green patents, we focused on the number of citations of green patents as a key indicator to measure the quality of green patents. Since the impact of green patents is long-lasting, we considered the impact of time and the cumulative number of applications and the cumulative number of citations. Following Wu & You (2022) for variables on the quality of green innovation [
57], we calculated the numerator in the formula as the cumulative number of green patents cited from 2000 to t years, and the denominator as the cumulative number of green patent applications from 2000 to t years. If the cumulative number of green patent applications of the enterprise was zero, then we assigned the quality of green utility model patents a value of zero. We then set the indicator as follows:
We used innovation investment to describe the R&D intensity of enterprises (), and innovation investment is expressed by the proportion of R&D personnel to the total number of employees.
Compared with financial indicators, government support () for enterprises was exogenous, indicating that it comes from external support for green innovation to help enterprises perform better in green innovation using the amount of government subsidies obtained by enterprises.
In the control variables, we referred to the practices of Wu et al. (2021) and Zhao (2022) to select control variables that reflected the characteristics of enterprises, because the development of green innovation of enterprises is based on a good business environment and the importance of non-financial performance. The size of the company (
) is expressed as a logarithm of the company’s total assets, the level of leverage (
) is expressed as the company’s ratio of assets to liabilities, and corporate cash holding ratio (
); fixed assets (
) are expressed as the ratio of a company’s net fixed assets to its total assets; and Tobin’s Q (
) is expressed as the ratio of the market value of the enterprise to the total assets. Meanwhile, shareholding concentration (
) is expressed as the share held by the largest shareholder, enterprise growth ability (
) is expressed as the ratio of current revenue to last revenue, and age of the enterprise (
Age) is expressed as the current year minus the year in which the company was founded. Controlled variables can help us get more accurate and robust regression coefficients, although some of the variables and the relationship between green innovation is not intuitive enough, but because these variables together can represent the characteristics of the enterprise, they should not be discarded wherever possible. The variable definitions shows in
Table 1.
Corporate Green Innovation (GI) Regression Model
To test the regression results of Hypothesis 1, we controlled the annual fixed effect, the industry fixed effect, and individual fixed effect, and the OLS regression model was established as follows:
To test the intermediary effect of corporate innovation investment on female director and green innovation in Hypothesis 2, the following model was established:
To test the intermediary effect of government support on female director and green innovation in Hypothesis 3, the following model was established:
3.3. Summary Statistics
Following
Table 2, The maximum numbers of green utility model patents applied for and authorized by enterprises during that year are 2.833 and 2.89, respectively. Dummy variables show that the level of green innovation is generally low, the probability of green innovation is 17.4% and 18%, and the observation standard deviation shows that there are large differences between enterprises. The proportion of female directors is only at 13.5%, and the proportion of boards with a chairwoman is as low as 4.8%.
4. Empirical Results
4.1. Effect of Board Gender Diversity and Corporate Green Innovation
The explanatory variable is represented by proportion of female directors in board members (), and the explained variables are represented by green innovations (), (), and (). We also replaced the explained variables with a sample of the forward green innovation to test the impact of board gender diversity on next year’s green innovation (), (), and (). Subsequently, we reported the regression results of the current and future green innovation variables while controlling individual, industry, and annual fixed effects.
There was a gradual regression between board gender diversity and enterprise green innovation. First, we only introduced board gender diversity and controlled the fixed effect, showing that the statistical coefficient was positive, but only in the quality of green innovation. Since then, all the control variables have been introduced without board gender diversity, and the value of VIF has averaged 2.15 with a maximum of 5.52, showing no significant multicollinearity problems. Because when the value of VIF is less than 10, it can be considered that the results are not disturbed by the serious multicollinearity problem. Furthermore, after the introduction of board gender diversity and all the control variables, the average VIF value was 2.03 and the maximum value was 5.53. In a further study, VIF averaged 2.03 and peaked at 5.57 after the explanatory variable was replaced with the next year’s green innovation, with no significant change.
Following
Table 3, the gender diversity of the board of directors has a significantly positive return on the number of green innovations of enterprises. This promotion effect will increase in the future, and the promotion effect will be enhanced. The gender diversity of the board of directors has a positive effect on green patents. The coefficients of the number of applications and the number of obtained patents were 0.057 and 0.068, respectively. The number of green patents obtained is not significant in the current period, but it will be at the 1% level in the next period. When using the number of green patents in the next period, this coefficient rises to 0.107 and 0.121, where the gender diversity of the board of directors continues to promote the number of green innovations in enterprises.
Because the process of forming green patents takes time, the number of green patents can only be increased after female directors influence it for a certain period. The role of female directors in promoting the number of green utility model patents indicates that female directors have played an active role in green innovation activities due to their unique preferences for non-financial performance. The role of female directors in promoting the quality of corporate green innovation is significantly positive in both current and the future periods with coefficients of 0.175 and 0.139, respectively. Female directors improve the quality of corporate green innovation and will continue to play an active role in the future. Thus, results illustrated in
Table 3 above verify H1.
4.2. Robustness Tests
After benchmark regression, the robustness test was carried out by replacing explained variables, replacing explanatory variables, replacing samples, replacing control variables and replacing research models. First, we replaced the research sample, set the industry as manufacturing, and performed fixed-effect regression. Second, we used dummy variables to replace the number of green utility model patents applied for and obtained by enterprises in the current year. Third, we replaced some of the control variables, replaced the variable describing financial performance from Tobin’s Q to ROE (), replaced the variable describing the growth ability of the enterprise from the growth rate of operating income to the growth rate of total assets (), and replaced the variable describing the level of enterprise debt from the debt to assets ratio to the ratio of interest-bearing debt to total investment capital (IntDbCap). Last, the probit model was used for the regression test.
Following
Table 4, Columns (1)–(3) show the OLS regression using manufacturing as a sample. Female directors continue to promote the number of green innovations: the coefficients of gender diversity of the board of directors on the number of green patent applications and the number of green patent applications in the current period are 0.1 and 0.092, respectively, both remaining significant. Female directors also maintain the quality of promoting green innovation, with a coefficient of 0.242. Paralleling the full sample, the manufacturing sample likewise showed that the gender diversity of the board of directors does increase the promoting of green innovation.
Columns (4) and (5) were regressed using the probit model, where board gender diversity maintained a positive effect on the number of green innovations. Since innovation quality is not suitable for binary variables, there is no probability regression for green innovation quality. Robustness tests likewise show that female directors play a unique role in driving green innovation activities, therein increasing the number of green innovations. Yearly regressions illustrate that female directors clearly play a role in the green innovation of enterprises from scratch. Regression results remain robust by changing explained variables, explanatory variables, research samples, and research models.
Columns (6)–(8) present the result of replacing some of the control variables to alleviate the problem of sample selection bias. It can be seen from the empirical results that the impact of total asset growth rate on green innovation is significantly negative, which is consistent with the benchmark regression results, but the significance of ROE and interest-bearing debt ratio has decreased. Further, the coefficient of gender diversity of the board of directors is significantly positive, with coefficients of 0.077, 0.09, and 0.161, respectively, which may indicate that the results of the benchmark regression are not affected by the selective error of control variables, and the regression results are robust.
Chairwomen enrich the gender diversity of the board of directors and the position is a key role in the board of directors [
58], which often has an obvious impact on decision-making dynamics [
59]. In Columns (9)–(11) of
Table 4, the use of a chairwoman as an explanatory variable considering the position of a board chair may be more important in the presentation of resolutions and quality control, full sample regression, lag one-stage green quality regression, and manufacturing sample regression were carried out. Results show that chairwomen play a positive role in promoting green innovation, although this role is lower than the result of gender diversity on boards, with a coefficient of 0.102 in Column (9), the coefficient of green quality in the future phase is 0.087, while the coefficient in the manufacturing industry rises to 0.161, positively affecting overall performance. China’s green wave is becoming more and more intense. Faced with the pressure of environmental reputation, some enterprises may exhibit “Greenwash” behavior to obtain environmental benefits and win the favor of environmental preference investors. The stronger influence of chairwomen on the quality of green innovation suggests that when women have a stronger voice on boards, they may reduce the incidence of unethical “Greenwash” events.
Using the average board gender diversity in the industry as an instrumental variable mitigates endogenous problems. Average board gender diversity in the industry is not directly related to enterprise green innovation, so the selection of instrumental variables is exogenous.
Using the IV-GMM model for regression, the Anderson canon statistic in the instrumental unidentifiable test was at 18.52, significantly rejecting the hypothesis that the instrumental variable was unidentifiable at the 1% level. The Anderson–Rubin Wald statistic was 22.88 in the weak instrumental variable test, which is significant at the 1% level. From
Table 5, the gender diversity of the board of directors is significantly positive for the number of green utility model patent applications, authorizations, and quality of green innovation with coefficients of 4.999, 5.277, and 7.976, respectively.
4.3. Further Analysis
A group regression test of different ownership attributes of enterprises found heterogeneity in green innovations between state-owned enterprises and non-state-owned enterprises. Following
Table 6, Female directors of state-owned enterprises had a more significant effect on the quantity of green innovation, while female directors of non-state-owned enterprises had a significantly increased regression coefficients on the quality of green innovation. This is because of the different functions given by the board of different shareholding companies; existing studies have found that state-owned enterprises (SOEs) play a stronger role in promoting green innovation in China’s institutional environment, possibly because of the closer relationship between SOEs and the government [
60,
61]. In this paper, we obtained consistent empirical results. State-owned enterprises prioritize and demonstrate in the implementation of green plans by government departments, the governance structure of state-owned enterprises is better, and non-state-owned enterprises prefer operating performance, hence the significance of female directors in green innovation in non-state-owned enterprises has declined.
Simultaneously, women directors of non-state-owned enterprises play an important role in promoting the quality of green innovation. Most non-state-owned enterprises actively respond to the government’s environmental policies, which reduce the cost of communication between enterprises and the government and attract government attention. Most importantly, enterprises pay more attention to the intrinsic value of green patents and efforts to improve the quality of green innovation, which is crucial to their development.
The concept of environmental social and governance (ESG) forwards requirements for corporate strategic objectives from three aspects: environmental responsibility, social responsibility, and corporate governance. ESG has become an important indicator generally recognized by various countries to measure the sustainable development of enterprises. Positive ESG performance promotes green innovation, and ESG performance and green innovation output have short-term and long-term causal relationships [
51,
52]. To reduce environmental costs from a long-term perspective and achieve green and sustainable development, many companies actively disclose their ESG information to increase the trust of institutional investors and ease financing constraints. Enterprises actively undertake environmental responsibilities, leading to a significant increase in the level of investment in green innovation, ESG plays a significant role in promoting green technology innovation [
62], but less research has focused on the impact on the quality of green innovation. This paper focused on the quality of green innovation, and in the green innovation quantity research consistent promotion function results were obtained. Enterprises actively fulfilling their social responsibilities help enterprises transform into sustainable development and promote enterprises to pay attention to green innovation. Female directors are notably more stable in corporate governance and more active in pollution control and social responsibility issues. Therefore, these directors bring a higher level of ESG to enterprises, helping companies perform better in green innovation.
Results in
Table 7 show that at high ESG levels and the gender diversity of the board of directors had a greater effect on the promotion of green innovation: the promotion effect on green patent application was at 0.124 and the promotion effect on obtaining greens patent was at 0.142. However, female directors did not play a significant role in the impact on the quality of green innovation. At low levels of ESG, the gender diversity of the board of directors had a negative effect on the number of green patent applications (−0.158) but had no significant effect on the number of green patents obtained (0.138). Meanwhile, female directors played a significant role in promoting the quality of green innovation and the regression coefficient rose to 0.644. Based on the ecofeminism theory, female directors have a greater preference for ESG in terms of environment, social responsibility, and corporate governance; the gender diversity of boards is a good confirmation of the literature, which argues that at high ESG levels and the role of gender diversity of boards in driving green innovation is higher than the effect of the entire sample. The current study further found that women directors improve the quality of green innovation at lower levels of ESG, possibly because green innovation is generally smaller at lower levels of ESG, and the low number of green innovations leads women directors to focus on improving quality to help businesses perform better on green innovations.
Table 8 reports the gender diversity of boards of directors by company sales size and the heterogeneity of female directors in corporate green innovation. The sample covered the manufacturing sector and large-scale enterprises with annual sales of over USD 400 million, with small and medium enterprises below this level. In the sample of large-scale enterprises, the gender diversity of the board of directors significantly promoted the quantity of green innovation, with coefficients of 0.072 and 0.092, respectively, while the promotion coefficient of board gender diversity to green innovation quality was 0.158. In the sample on SMEs however, gender diversity on the board of directors no longer played a significant role in green innovation.
Notably, large enterprises have abundant green resources in green innovation, including investment in green innovation, personnel dedicated to R&D, green technology, and the necessary conditions to buy green enterprises and obtain the needed green resources; large enterprises perform better in green organization identification, environmental organization legitimacy, and green innovation performance, so they have greater enthusiasm in green innovation [
63]. Our study obtained consistent results from the heterogeneity test. The board of directors can also actively use the advantages of large enterprises to promote the process of green innovation.
Meanwhile, large enterprises likewise have strong demands for green innovation, and green patents can create high green performance for enterprises with large annual sales. Among small and medium-sized enterprises however, this effect is greatly reduced. This makes it difficult for small and medium-sized enterprises to obtain financing, contend with poor economic performance, as well as introducing other development difficulties. This hinders them from devoting energy to participating in green innovation.
4.4. Potential Mechanism
This section extends the preceding results to clarify the potential mechanisms of why the mechanism of female directors affect corporate green innovation. The gender diversity of the board of directors positively influences an enterprise’s innovation decision-making and brings lower financial risk and more effective innovation processes to the enterprise [
42,
64]; the results of this paper on board gender diversity and corporate green innovation are consistent with this. To avoid bias of the main variables on the regression results due to the endogeneity problem, we refer to the research of Al-Shammari in the mechanism test [
65], this study used the causal analysis method to conduct the regression step by step. It then used the lag variables of innovation input and green innovation to finally carry out the regression. Among these, R&D used a variable with a lag of one period (
), while green innovation used a variable with a lag of two periods (
,
and
).
Following
Table 9, Columns (1)–(3) are direct effects and the results of the regression are similar to those of the baseline regression. The gender diversity of boards positively affects the number of green patent applications by increasing the proportion of R&D personnel. In Column (4), gender diversity in the board of directors played a role in stimulating input from enterprise R&D with a positive effect of 1.9%. After introducing the gender diversity of the board of directors and R&D input, Column (5) shows that the impact coefficient of the gender diversity of the board of directors on the number of green utility model patent applications is 0.168; the impact coefficient of innovation input on green innovation is 0.409. Given these abovementioned regression methods, bootstrap was subsequently used to carry out sampling regression for 500 samples. The regression coefficient of indirect effect was 0.008, and the effective range of the 95% level was 0.001~0.163. Gender diversity in boards is also achieved through human resources development, which has a positive impact on enterprise green innovation.
The explanatory variable in Column (6) was changed to the number of patents granted for green utility models. After the introduction of gender diversity and R&D, the gender diversity coefficient of the board of directors was at 0.129, and the innovation investment coefficient was at 0.39. These coefficients are slightly lower than the number of green patent applications, but are nonetheless significant, thus confirming H2. A regression analysis of 500 samples was performed using bootstrap with a regression coefficient of 0.007 for indirect effects on the 95% confidence level with a valid range of 0.002–0.016, which was similar to previous regression results.
In Column (7), the explanatory variable was changed to the quality of green innovation with a lag of two periods, and the intermediary variable was the lag of one period of R&D staff input to the board of gender diversity pair. The results of this bootstrap sampling showed that the indirect effect coefficient was 0.03 (which is significant at the 1% level), the 95% level confidence interval was 0.015~0.047, and the direct effect coefficient was 0.407, (which is significant at 5% level). In promoting the development of green innovation, female directors mainly achieve green innovation by recruiting more R&D personnel, thereby increasing investment in R&D. Board diversity therefore promotes the quality of green innovation through R&D, thus verifying H2.
The environmental preference of female directors tends to support the environmental protection policies carried out by the government, which makes enterprises likelier to obtain government support and promotes the increase of the level of government subsidies, funds provided by government subsidies can provide important impetus for green innovation of enterprises [
66,
67,
68], therein playing a positive role in the continuous improvement of enterprises’ green innovation output. Using future government subsidy (
) as an intermediary variable between board gender diversity (
) and a lag of period green innovation (
,
, and
) may prove to be useful in the future.
From
Table 10 below, Columns (1)–(3) show the direct impact of board gender diversity on the number of green utility model patent applications through government support, paralleling the baseline regression. In Column (4), the gender diversity of the board of directors played an important role in enhancing the degree of government support, with a statistical coefficient of 0.189 and played a positive economic role in the decision-making process. This is because women are more responsive to the government’s green policies and have a better chance of getting high levels of government support.
Columns (5)–(7) introduced board gender diversity and government support to observe the indirect and total effects. When the explained variable is the application number of enterprise green utility, the regression coefficient of government support is 0.015 in the total effect, which plays the part of intermediary role. Results obtained through the three-step causal inference method are therefore robust. Column (6) shows the impact of board gender diversity on the number of government-supported green utility model patents, with a regression coefficient of 0.017 for the overall effect of government support. The gender diversity coefficient of the board of directors also rose to 0.094. Column (7) shows that government support has a complete intermediary effect, with the coefficient of government support rising to 0.044, indicating that enterprises produce high-quality green innovation to obtain government support. Government support can be used as an intermediary mechanism to promote the quantity of green innovation through board diversification but plays a completely intermediary role in the quality of green innovation. This may suggest that in the government departments, in an economic sense, the quality of green innovation of enterprises is deeply affected by green policies and government subsidies. A good policy has a strong incentive effect on the quality of green innovation, and policymakers can achieve the effect of continuously promoting green innovation by adjusting government subsidies.
5. Conclusions
Studies on the relationship between gender diversity of the board of directors and green innovation is an emerging and growing area of research that has yielded some exciting results. Our study enriches the research on green innovation through diversity of the board of directors, and also provides theoretical experience for the global green transformation. Our results are similar to Ciasullo’s study, but Ciasullo et al. (2022) are more concerned with environmental sustainability [
31], and we are more interested in the economic and ecological benefits of green innovation. The board of directors has an extraordinary impact on the company’s strategy. As an essential part of the company’s strategy, green innovation will be affected to a considerable extent. Our research mainly found that the gender diversity of the board of directors promotes the quantity and quality of enterprise green innovation and that R&D and government support as an intermediary mechanism positively influences this relationship. Additionally, the study found that state-owned and large enterprises play an exemplary role in responding to green policies and transitions, and that ESG levels are greatly important to green innovation, providing practical implications for green policy pilots. The policy suggestions of this paper include the following:
This study highlights the importance of adding women to the senior management team for a proactive environmental strategy. Consistent with other research, empirical tests support the upper echelons and ecofeminism theories that women have stronger attributes of environmental concern than men. Following the upper echelons theory, due to the significant differences between women and men in terms of social background, market experience, family role division, and club experience, women bring different perspectives and information in corporate governance. This brings more discussion to the decision-making process and makes the decision more scientific. The research results pay more attention to the green orientation of the diversity of the board of directors and encourage enterprises to include women’s career plans in the strategic dimension. This shows that listed companies in China should break the “gender barrier” and incorporate women’s career planning into the strategic agenda of enterprises. Listed companies should also encourage women to participate in decision-making and let women assist in the construction of emerging green markets.
Empirical tests further revealed the positive intermediary mechanism of R&D investment and government support. Under this mechanism, the performance of green innovation is better, thereby enriching the theoretical basis of international market practice. The gender diversity of the board of directors has a relatively weak effect on the quality of green innovation due to policy subsidies and the need for a national green development strategy, which makes enterprises pursue the number of green innovations but ignore the quality of green innovation in rapid development. This shows that the government needs to strengthen the supervision from the policy and system to avoid the “Greenwash” behavior of enterprises exhibit in order to obtain government subsidies. This paper recommends enhancing the voice of Chinese women in business, enhancing Chinese women’s “Her power” in business, as the chairwoman of the board of directors pays more attention to the quality of green innovation in the green orientation. The delicacy and responsibility of women’s roles often make them pay more attention to the follow-up process of green patents rather than focusing on appearance. This also reduces the occurrence of “Greenwash” from another level.
Companies with high ESG provide the possibility of diversified development for green innovation and corporate environmental performance. Female directors play a supervisory and governance role in non-financial performance, which requires companies to actively pay attention to environmental protection, assume social responsibilities, and strengthen internal governance. Enterprises need to create a smooth governance environment, empower female directors and equal workplace environment, and exert greater influence on innovation.
With high-speed economic development in China’s background, R&D investment and government support are shown to be two positive intermediary mechanisms, which have been closely related to the policy of encouraging innovation and environmental construction in China in recent years. By making use of these findings, we are also able to provide recommendations to the government and enterprises. For one, enterprises should take R&D innovation as the anchor and green development strategy as a part of their programs. For another, it is suggested that the government should increase the scale of green innovation subsidy, reduce the risk of enterprise innovation, improve the ability of enterprise green innovation, and implement the decision-making practice of enterprise under the “carbon peaking and carbon neutrality goals” to further promote the vigorous development of a green ecological economy.
Our study has its potential limitations. On the one hand, our dataset only covers listed companies on the Chinese A-share market. Domestic unlisted companies and companies that are not listed on the A-share market but produce and sell in China were not subject to investigation. Since we used panel data from 2010 to 2020, our analysis did not include some companies, especially emerging SMEs since 2016. On the other hand, since the dataset is missing some important interaction variables associated with female directors, this article may have missed a good economic story in research design. Future studies should consider these overlooked factors, the selection of data can be considered to take samples of SMEs to explore the results provided by these data samples.
Owing to women’s unique risk preference, non-financial performance preference, social responsibility, and corporate governance, Future studies adjacent to this can investigate from more dimensions to explore the value of women to enterprises. Moreover, further research on women’s participation in corporate governance and gender diversity affecting green innovation may also provide much theoretical significance for the global green economy and low-carbon strategy development.


