Abstract
Three-dimensional numerical models of potential underground storage and compositional simulation are a way to study the feasibility of storing carbon dioxide in the existing geological formations. However, the results of the simulations are affected by many numerical parameters, and we proved that the refinement of the model grid is one of them. In this study, the impact of grid discretization on CO2 trapping when the CO2 is injected into a deep saline aquifer was investigated. Initially, the well bottom-hole pressure profiles during the CO2 injection were simulated using four different grids. As expected, the results confirmed that the overpressure reached during injection is strongly affected by gridding, with coarse grids leading to non-representative values unless a suitable ramp-up CO2 injection strategy is adopted. Then, the same grids were used to simulate the storage behavior after CO2 injection so as to assess whether space discretization would also affect the simulation of the quantity of CO2 trapped by the different mechanisms. A comparison of the obtained results showed that there is also a significant impact of the model gridding on the simulated amount of CO2 permanently trapped in the aquifer by residual and solubility trapping, especially during the few hundred years following injection. Conversely, stratigraphic/hydrodynamic trapping, initially confining the CO2 underground due to an impermeable caprock, does not depend on gridding, whereas significant mineral trapping would typically occur over a geological timescale. The conclusions are that a fine discretization, which is acknowledged to be needed for a reliable description of the pressure evolution during injection, is also highly recommended to obtain representative results when simulating CO2 trapping in the subsurface. However, the expedients on CO2 injection allow one to perform reliable simulations even when coarse grids are adopted. Permanently trapped CO2 would not be correctly quantified with coarse grids, but a reliable assessment can be performed on a small, fine-grid model, with the results then extended to the large, coarse-grid model. The issue is particularly relevant because storage safety is strictly connected to CO2 permanent trapping over time.
1. Introduction
Geological carbon dioxide sequestration offers a promising solution to reduce greenhouse gases in the atmosphere. The experience gained from CO2 injection in many existing enhanced oil recovery (EOR) projects [1,2,3,4], as well as from operating CO2 storage sites [5,6], indicates that it is feasible to store CO2 in geological formations as a mitigation option to climate change [7,8,9,10,11].
Geological storage sites should fulfill the following conditions: the capacity to store an adequate volume of CO2 under the overlying impermeable layers; the ability to accept the injected CO2 at the rate that is supplied; and the seismic stability and geomechanical integrity of the storage site [12,13,14,15,16]. The carbon capture and storage (CCS) technology in deep geological formations involves the injection of CO2 in the supercritical phase in order to achieve high fluid density and therefore maximize the storage capacity. Both depleted reservoirs and saline aquifers can provide adequate storage, with the depleted reservoirs typically having smaller capacity but confirmed confinement ability and the aquifers potentially offering much larger storage capacity but requiring system assessment to ensure the existence of suitable conditions for CO2 injection and containment. At the end of 2021, more than 50% of the existing CCS projects involved deep saline aquifers [17,18,19,20,21]; out of the 27 CCS network facilities operating at the end of 2021 or planned for operation before 2030, some 80% are saline aquifers and only 20% are depleted reservoirs [22].
Fluid dynamics and geochemical phenomena at the thermodynamic conditions of the storage site, especially when a massive injection of CO2 occurs into the deep saline aquifers, are responsible for the development of different trapping mechanisms [23,24,25,26], namely structural/stratigraphic and hydrodynamic trapping, residual or capillary trapping, solubility trapping, ionic trapping, mineral trapping.
A way to evaluate the feasibility and safety of a CO2 storage project, including the effects of each trapping mechanism under the conditions of interest, is the use of numerical models [27].
In ref. [28,29], the key parameters affecting solubility trapping and the effect of convective flow were investigated. Structural or hydrodynamic trapping was investigated by [30,31,32,33], among others. Capillary trapping, which has a fundamental contribution to sedimentary formations, was studied by [34,35], while dissolution and mineral trapping, which can be observed in both basaltic and sedimentary rocks, were studied by [36,37,38].
In ref. [39], the authors focused their study on the distribution of CO2 between the aqueous and the gaseous phases for several aquifer scenarios. In ref. [40], the authors demonstrated the importance of considering hysteresis effects in saline aquifers since they contribute to reducing CO2 migration and accumulation along seal layers. In ref. [41,42,43], the authors investigated both mineral and solubility trapping during CO2 disposal in aquifers, analyzing porosity and permeability variations. In ref. [44], the authors carried out sensitivities analyses to study the contribution of solubility and mineral trapping under different pressure and temperature conditions. In ref. [4,45,46,47], the authors conducted simulation studies to investigate the CO2 plume behavior and trapping under different injection strategies.
The results of these studies confirmed that the contribution of each trapping mechanism largely depends not only on the fluid-rock and mineral properties of the aquifer under consideration but also on the CO2 injection strategy. Furthermore, trapping mechanisms are dependent on one another [48].
However, one aspect that—to the best of the authors’ knowledge—was not thoroughly investigated by previous works concerns how spatial discretization of the volume of interest affects the simulation of CO2 storage. While discretization is recognized as strongly impacting simulated pressure and saturations when fluids are produced from, or injected into, a reservoir, the impact on the simulated CO2 migration and trapping mechanisms is uncertain. In this study, the effects of grid discretization on CO2 solubility and residual trapping were investigated. Initially, the sensitivities were performed on the well bottom-hole pressure during CO2 injection to identify which grids could correctly reproduce the pressure increase. Then, the same grids were used to simulate the CO2 trapping by solubility and residual trapping during the 100, 200, and 500 years after injection. The target was to assess if and to what extent block dimensions could affect the accuracy of the simulated quantity of the CO2 permanently captured underground. Given that permanently captured CO2 is no longer of concern because it cannot leak to the surface, the implication is that adequate model gridding can contribute to correctly framing the safety issues potentially related to geological storage.
2. Model Description
A simplified 3D numerical model representing a portion of a deep saline aquifer was set up using compositional commercial software, namely GEM by CMG, which is able to simulate coupled geochemical reactions and fluid flow. The GEM software has been used for simulations of CO2 storage by various authors, such as ref. [49,50], among others.
The model dimensions were selected in order to represent all the phenomena of interest and are 1350 × 1350 × 31 m3. The extension of the model size to that of a full aquifer, with a consequent significant increase in the simulation run time, was unnecessary because the target was the investigation of the solubility and the residual trapping mechanisms, which are independent of the system dimensions.
The aquifer thickness is 20 m, which is a typical value for a sedimentary formation, and this ensures that the CO2 upward migration due to gravitational segregation can be observed. The overlying caprock thickness is 10 m and is sufficient to provide the aquifer sealing under the simulated operational conditions. However, a monitoring layer above the caprock was also defined to monitor any possible leak of the injected CO2 through the caprock. The monitoring layer is 1 m thick.
A single injector well was defined; it was located in the middle of the model to avoid any boundary effects on the CO2 plume migrating through the aquifer.
The depth of the aquifer top was set at 1500 m. The initial conditions applied to the aquifer were a pressure equal to 15 MPa and a temperature equal to 50 °C, both set at the reference depth of 1500 m. Therefore, the CO2 in the aquifer can only exist as a supercritical fluid, as is recommended to grant maximum storage capacity.
Four different grid discretization options were considered. The simulations were performed with the aim of assessing the impact of discretization on the CO2 fluid-flow behavior and the trapped quantities according to the different mechanisms. Initially, the bottom-hole pressure during the CO2 injection was monitored. Under the assumption that multiphase fluid flow prevails during the CO2 early injection, the commercial black-oil simulator Eclipse 100 (Schlumberger) was also used to benchmark the obtained results, while the commercial black-oil simulator Rubis (Kappa) was used to assess more gridding options. Then, the impact of the model discretization on the CO2 trapped by the different mechanisms was assessed by simulating CO2 injection and a subsequent monitoring period using GEM.
The petrophysical characteristics and the rock-fluid interaction properties were the same for all the models. Conversely, as described in the following, the boundary conditions and the PVT properties had to be set differently in the used software due to their different capabilities.
2.1. Rock and Fluid Properties
The rock and fluid properties used for characterizing the synthetic model are typical values for a 1500 m-deep sandstone aquifer [51,52] and are summarized in Table 1.

Table 1.
Rock and fluid properties.
The porosity and the permeability of the caprock were set to be equal to 20% and 10−7 mD, respectively [53]. The porosity and permeability of the monitoring layer were set to be equal to those of the aquifer (Table 1).
Water salinity is compatible with a deep aquifer; yet, it was assumed to be low in order to maximize the amount of CO2 that could be solubilized [54,55].
The relative permeability curves were calculated according to the Corey–Brooks method [56], using the following exponents and endpoints from the literature: NW = 5 [57], NCO2 = 2 [58], Swi = 0.307, Sgc = 0.106, and Sghys = 0.4 [59]. The capillary pressure curves were also taken from the experimental data reported in the literature [60]. The relative permeability and capillary pressure curves are shown in Figure 1.
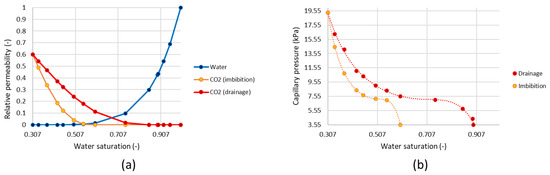
Figure 1.
(a) Relative permeability curves; (b) capillary pressure curves.
The rock mineralogy was selected among the default options available in GEM as the rock composition was irrelevant to the scope of this study. In fact, mineral trapping was not taken into consideration as it typically occurs over thousands of years after injection.
2.2. PVT Properties
In GEM, the CO2 PVT properties were calculated by the software based on the CO2 critical properties and acentric factor [61]; the Peng–Robinson [62] equation of state was used. The same rock-fluid properties, as well as the PVT model used in GEM, were also adopted in Eclipse 100. In Rubis, the CO2 PVT properties were taken from the software’s internal database for pure CO2.
2.3. Gridding Options
The effect of grid discretization on the simulated bottom-hole pressure and trapping mechanisms was evaluated using GEM by considering four grids with different discretizations (G1, G2, G3, and G4). The vertical layering of the aquifer was kept constant, with each layer having a thickness of 2 m. In grids G1, G2, and G3, the block areal dimensions were constant in the area close to the well (Figure 2a). Conversely, G4 was built using blocks whose dimensions increased according to their distance from the well: in the area surrounding the well, the blocks had a 2 × 2 m2 areal dimension, which progressively increased as they moved towards the model boundaries, up to 145 × 145 m2 (Figure 2b). The grid parameters for the four investigated cases are reported in Table 2.
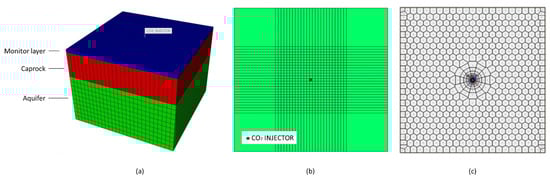
Figure 2.
Gridding: (a) 3D synthetic model used in GEM showing the three zones: aquifer, caprock and monitoring layer, and the uniform discretization; (b) grid refinement for grid G2 (top view); (c) unstructured Voronoi grid R4 used in Rubis (top view).
Table 2.
Grid parameters.
The bottom of the aquifer was set as a no-flow boundary. An analytical infinite Carter–Tracy aquifer was adopted as a lateral boundary condition allowing water to exit and enter the model domain. Because the water is the only component allowed to flow through the boundary, a sufficient distance between the CO2 plume and the interface with the analytical aquifer was guaranteed so as to prevent the accumulation of CO2 in the external blocks of the model.
The same grid options used in GEM (Table 2), as well as the same aquifer initial conditions, were also used in Eclipse 100. The grids were named E1, E2, E3, and E4.
A different approach was used for Rubis as the software does not allow the definition of an analytical aquifer. In order to reproduce an infinite aquifer, the model dimensions were increased to 300 × 300 km2. The software uses an unstructured Voronoi grid with a refinement in the near-wellbore area (Figure 2c). The grid refinement area developing around the well is controlled by the progressive ratio (PR): by decreasing the PR value the refinement increases. This grid refinement approach is particularly effective in simulating the pressure history during CO2 injection. Four different grids (named R1, R2, R3, and R4), were generated adopting four different progressive ratios (Table 3). The depth of the aquifer top as well as the initial conditions of the aquifer used in Rubis are the same as those used in GEM.
Table 3.
Grids parameters in Rubis.
2.4. Simulation Strategy
In every simulation, the perforations of the injector well, which was placed at the center of the model, were open in the 1510–1518 m depth interval. The well radius was equal to 0.0762 m, while the rate of injected CO2 was constant and equal to 200,000 sm3/day, which is equivalent to a mass rate of 0.136 Mt/y. The duration of the injection was 120 days so that the CO2 plume did not reach the model boundary over the entire simulation period (Figure 3). The same simulation strategy was adopted in Eclipse 100 and in Rubis.
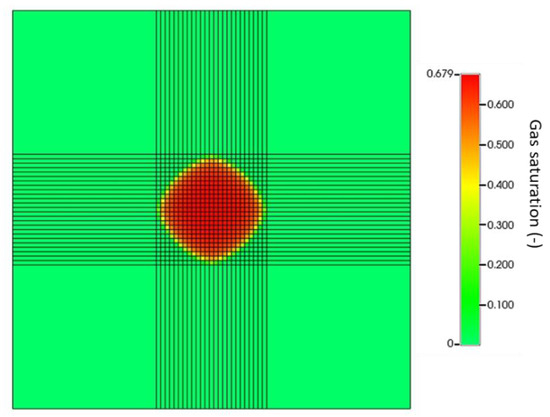
Figure 3.
CO2 saturation at the end of injection in grid G3 (top layer of the aquifer).
3. Methodology
Numerical simulations were aimed at assessing how spatial discretization of the volume of interest affects permanent CO2 trapping by solubility and capillarity, which are the mechanisms ensuring safe CO2 storage in the short term. In fact, the following considerations can be provided on the main trapping mechanisms occurring when CO2 is injected into deep saline aquifers (the trapping mechanisms and a brief explanation of their effects are summarized in Table 4). In the short term, stratigraphic–structural trapping is the dominant mechanism and relies on the geological characteristics of the system. Then, when brine replaces the volume previously occupied by the injected CO2, which is thus partially trapped by capillary forces, residual trapping occurs. Solubility trapping is triggered by CO2 dissolution into the brine. Even though the kinetics of this reaction is extremely fast, the dissolution of the injected CO2 is a rather slow process: only a fraction of the injected volume is sequestered due to aqueous solubility over hundreds of years [48,63]. Mineral trapping occurs when the carbonate minerals precipitate due to the reaction of the dissolved CO2 and the aquifer minerals or dissolved solids. Dissolution of supercritical CO2 into brine controls the rate of dissolution and the precipitation of the minerals constituting the porous rocks. Volume changes in the solid phase can modify the pore structure, affecting both porosity and permeability and, therefore, altering the pathways of the injected CO2. However, mineral trapping is typically not considered in storage capacity estimation due to the complexity of the process and because it usually becomes significant only over thousands of years [64,65]. Therefore, while the extension of the CO2 plume mainly depends on the aquifer geometry and the petrophysical properties and on the injection strategy, only solubility and residual trapping concur to permanently block CO2 underground in the short term.
Table 4.
CO2 trapping mechanisms.
To estimate the impact of the model discretization on the simulation results when CO2 is injected into the aquifer, numerical simulations were carried out using the different grids described in Section 2.1. The results were analyzed in terms of pressure response at the well and in the aquifer, the amount of CO2 confined by stratigraphic–structural trapping, and the amount of CO2 sequestered by solubility and residual trapping.
The first step of the study focused on the impact of the discretization on the well bottom-hole pressure profiles. To this end, numerical simulations were performed using GEM and using Eclipse 100 as a benchmark, based on the assumption that multiphase fluid flow dominates during the very first stage of injection; thus, the compositional capabilities would have a limited impact on the wellbore pressure trend. Rubis was also used due to the possibility of defining very refined grids in the near-wellbore area. In the second step, three different injection history scenarios were assigned to the model. The analysis of the simulation results concentrated on the induced well bottom-hole pressure profiles because it is well-known that coarse grids can generate unrealistically high pressure values, invalidating the representativeness of the whole simulation [67,68].
Then, the impact of discretization on residual and solubility trapping was investigated by simulating 100, 200, and 500 years after CO2 injection, respectively, and monitoring the CO2 distribution and dissolution. In these cases, the rate of CO2 injection was reduced to 10,000 sm3/day (the injection period was kept equal to 120 days) in order to limit the extension of the plume of CO2, both in free phase and in solution, to the near-wellbore area. This is where the grid refinements were applied with respect to the base case scenario (having uniform grid blocks) and thus where the potential impact of gridding on the simulation results was expected to be detectable.
Mineral trapping was not accounted for because of its negligible contribution to the total amount of CO2 trapped in the considered time frame [48]. The different scenarios are summarized in Figure 4.
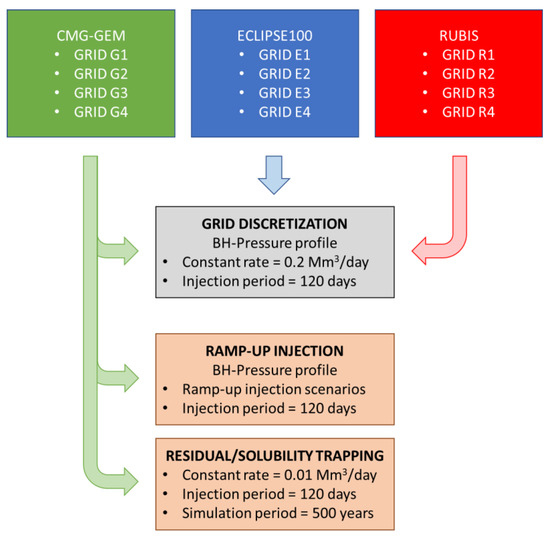
Figure 4.
Rate injection scenarios.
4. Results
4.1. Grid Discretization
The results of the simulations performed with GEM show that when injection starts, the well bottom-hole pressure reaches a peak; then, the pressure progressively decreases until stabilizing (Figure 5). The value of this peak and the time to reach it are proportional to the dimension of the blocks (Table 5). The pressure peak ranges from 113% (G4) to 125% (G1) of the initial aquifer pressure; at the end of the injection, the bottom-hole pressure reaches values ranging between 106.2% (G4) and 107.5% (G1).
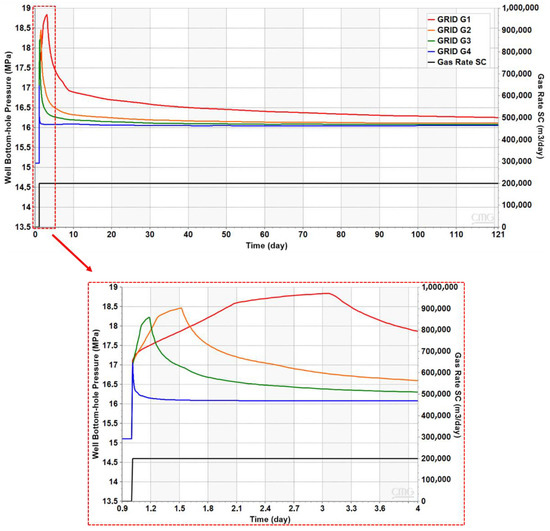
Figure 5.
Well bottom-hole pressure profiles for grids G1, G2, G3, and G4.
Table 5.
Grid discretization effects on well bottom-hole pressure profiles.
The same pressure trends observed with GEM were confirmed by the Eclipse100 simulation results, even though the values of the overpressure peaks were different (Table 5 and Figure 6). Furthermore, the reservoir pressure reached at the end of injection, ranging from 104.6% (E4) to 108.7% (E1), also showed significant dependency on the gridding.
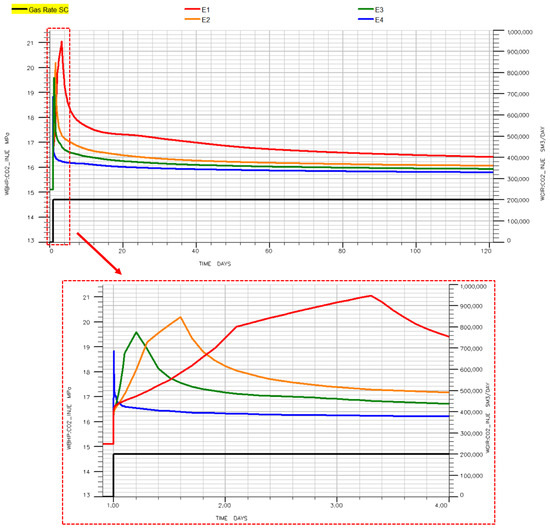
Figure 6.
Well bottom-hole pressure profiles for grids E1, E2, E3, and E4.
When Rubis was used for the simulation of the same scenarios, the bottom-hole pressure peaks were much lower with respect to the ones observed in the GEM and Eclipse 100 simulations, as well as to the time needed to reach the peak values (Figure 7). By increasing the near-wellbore grid refinement through the PR parameter, the bottom-hole pressure peak decreases from 110.4% (grid R1, PR = 4.0) to 108.5% (grid R4, PR = 1.4) of the initial aquifer pressure. No significant effects on the bottom-hole pressure at the end of the CO2 injection were detected for the four grids (Figure 7).
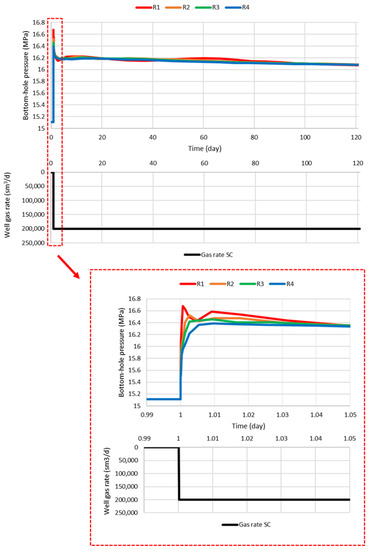
Figure 7.
Well bottom-hole pressure profiles for the grids R1, R2, R3, and R4.
In summary, all the sensitivities showed that the grid block dimensions always have a significant impact on the simulated overpressure during injection, and in most cases, the maximum bottom-hole pressure largely exceeded the final overpressure value. To further confirm these results, it can be observed that the simulations performed with Rubis, which allowed the adoption of a very refined grid around the wellbore, were those providing the lower values of the local pressure increase at the wellbore.
Even though no CO2 above the caprock was detected due to leakage induced by overpressure conditions, it should be noted that the effects of the caprock threshold pressure and most of the geomechanics of the system were not simulated. Should a more comprehensive assessment be performed, the simulated peak pressure values would likely not be acceptable. However, these pressure peaks at the wellbore are not due to physical phenomena but are only due to modeling issues; thus, they are not representative of the response of the real system. Furthermore, while the results on the pressure trend induced during injection were expected, the question is the extent to which the model discretization can affect the quantity of CO2 trapped in the aquifer by the different trapping mechanisms.
4.2. Ramp-Up Injection Scenarios
Ideally, a highly refined grid should be used to correctly model the pressure trend during CO2 injection. However, considering that a number of injector wells would be typically simulated in a full reservoir study, the need for grid refinement might significantly increase the number of grid blocks and thus also dramatically increase the simulation run time and/or the computing requirements.
A good strategy to compromise between grid refinement and the fictitious local pressure increase at the wellbore could be to inject CO2 according to a rate ramp-up. To this end, three scenarios were simulated. Each scenario consisted in ramping the rate up to the original value of 200,000 sm3/day, with a different duration and increase in the subsequent rate steps. The three ramp-up scenarios are reported in Table 6 along with the corresponding values of the maximum well bottom-hole pressure and of the well bottom-hole pressure after injection. The results show that a ramp-up injection rate can effectively mitigate the non-physical well pressure increase as well as a progressive convergence between the maximum well bottom-hole pressure and the final aquifer overpressure after injection. The results are also shown in Figure 8.
Table 6.
Ramp-up injection scenarios.
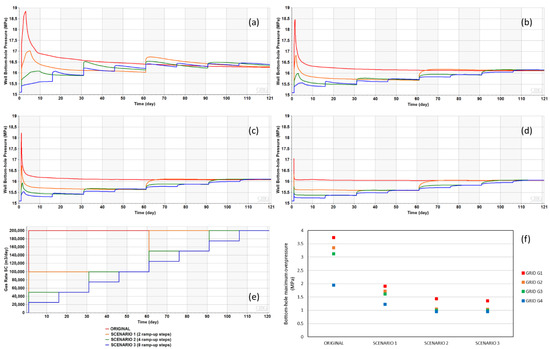
Figure 8.
Well bottom-hole pressure profiles for the grids (a) G1, (b) G2, (c) G3, and (d) G4 for ramp-up injection scenarios 1, 2, and 3; (e) well gas rate SC for ramp-up injection scenarios 1, 2, 3; (f) well bottom-hole maximum overpressure for the grids G1, G2, G3, and G4 for ramp-up injection scenarios 1, 2, and 3.
4.3. Gridding Effects on CO2 Solubility and Residual Trapping
The grid discretization also proved to strongly affect CO2 trapping. The simulations were performed for monitoring periods of 100, 200, and 500 years, respectively, after injection. The three monitoring periods were defined so as to validate the obtained results.
As expected, stratigraphic/hydrodynamic trapping does not depend on gridding, whereas mineral trapping does not concur to constrain the CO2 underground in the short term. However, given that only a small volume of CO2 was injected into the aquifer, in our simulations all the CO2 was either dissolved into the water or trapped by capillary forces some 100 years after injection. The results showed that the model discretization strongly affects the solubility trapping and, consequently, the residual trapping of the CO2. A different trend is observed between these trapping mechanisms (Figure 9). The CO2 immobilized by residual trapping decreases from the coarse grid to the fine grid (i.e., from G1 to G4), while an opposite trend is observed for solubility trapping. This translates into an average of a 15% discrepancy between the trapped CO2 by both residual and solubility trapping for the monitoring periods of 100 and 200 years. After 500 years of simulation, the CO2 was almost completely dissolved into the brine for all the simulated grids, except for G1 in which 5% of the CO2 remained trapped by capillary forces. This is due to the supercritical CO2–formation water interface surface, which is larger in fine grids compared to coarse grids; as supercritical CO2 dissolves into the aqueous phase only at the CO2–water interface, the solubility trapping of CO2 is strongly dependent on the extension of this interface [48]. The higher the amount of CO2 dissolved into the formation water, the lower the CO2 which remains trapped as a supercritical phase by residual trapping.
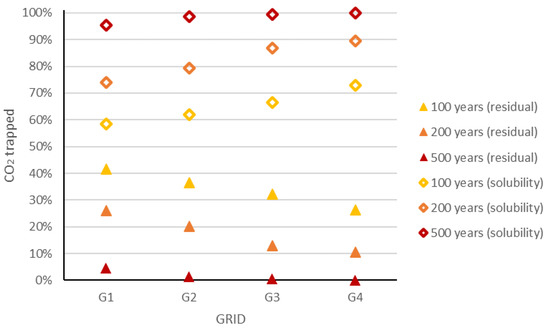
Figure 9.
Percentage of CO2 trapped by residual and solubility trapping mechanisms for grids G1, G2, G3, and G4 after 100, 200, and 500 years, respectively.
5. Discussion and Conclusion
In the oil field, reservoir simulation has been used for decades; thus, extensive knowledge has been gained. Model discretization is recognized to strongly affect the simulation results, with fine grids leading to more reliable results than coarse grids but requiring significant—and sometimes prohibitive—simulation run time and/or computational resources. For this reason, when we simulated CO2 injection into a deep saline aquifer, the impact of the model discretization on the simulated pressure values was expected. Conversely, the potential impact of model discretization on the amount of permanently trapped CO2 could not be anticipated because dedicated studies were not found in the technical literature.
Our simulation results showed that a coarse grid in the near-wellbore area generates an unrealistically high bottom-hole pressure profile at the beginning of injection, as well as a higher average aquifer pressure over the years with respect to a fine grid. The reason for this is that, initially, there is no CO2 in the aquifer (i.e., the CO2 saturation is zero); thus, the effective permeability is also null. For CO2 to become mobile, the saturation must reach a critical value; however, the larger the grid blocks, the larger the volume of CO2 needed to reach this critical saturation and thus the higher the grid block pressure. This is why fine grids exhibit a much smaller pressure increase than coarse grids. Even if to a slightly different extent, this phenomenon is well represented by all the software used in this work for the simulations. The main issue related to a fictitious overpressure in the near-well grid blocks is that the pressure might exceed the limiting value, which is usually imposed to avoid damaging the well completion and fracturing the formation. If the assigned pressure constraint is exceeded, the CO2 injection rate is automatically reduced so that the induced pressure decreases below the constraint. As a consequence, the rate at which CO2 can be injected is underestimated. Furthermore, an overestimation of the average aquifer pressure might be misleading when the integrity of the aquifer and caprock is investigated under operational conditions through geomechanical analyses. In this study, we demonstrated that the maximum pressure values at the well and the aquifer average pressure can be much more realistic if an injection strategy with a rate ramp-up is implemented. By increasing the number of rate steps and decreasing the rate increments, the fictitious increase in the well bottom-hole pressure, especially during early CO2 injection, can be avoided even if adopting a coarse discretization. Thus, a well-calibrated ramp-up injection strategy can be very efficient in obtaining consistent simulation results without excessive grid refinement in the near-wellbore area. Avoiding fine grids or grid refinements, and thus reducing the number of grid blocks, is particularly important in view of large models and multiple injectors.
Discretization also proved to impact the amount of CO2 permanently trapped in the aquifer. In fact, our results showed that the CO2 trapped by residual and solubility trapping is highly affected by the block dimensions. Smaller blocks lead to a higher quantity of CO2 dissolved into the formation water and to a lower amount of CO2 trapped by residual trapping. Based on the simulation results obtained for the pressure increase induced by the CO2 injection, we deem it reasonable to confirm that fine grids provide more reliable results. Therefore, it can be affirmed that coarse grids lead to an underestimation of the CO2 trapped by solubility and to an overestimation of the CO2 trapped by residual trapping. Even though mineral trapping was not simulated, because it typically occurs over a very long timescale and it was beyond the scope of this study, it is evident that an underestimation of the CO2 trapped by solubility will also lead to an underestimation of the quantity of mineralized CO2 in the long term. This underestimation of the amount of CO2 trapped by solubility and mineral trapping compromises the reliability of the entire CCS simulation and directly translates into an incorrect evaluation of the storage safety.
In conclusion, high-resolution models would be needed to reliably simulate the pressure evolution during CO2 injection and accurately describe the migration paths of the injected CO2 in the aquifer and its trapping by the different mechanisms. However, as already discussed, discretization also plays a key role in the simulation run time and/or computational requirements. Thus, a compromise is needed between these two conflicting targets. The use of a CO2 injection strategy with a rate ramp-up and sensitivities on a small model such as the one we presented in this paper can help to improve the confidence in the simulation results from large full-aquifer models when a coarse discretization is adopted.
Author Contributions
Conceptualization, methodology, formal analysis, data curation, writing, original draft preparation and editing: A.S.; conceptualization, methodology, formal analysis, resources, writing—review, supervision: F.V.; model conceptualization, resources, writing, original draft preparation, supervision: C.P.; resources, writing—review and editing: C.B. All authors have read and agreed to the published version of the manuscript.
Funding
This research received no external funding.
Institutional Review Board Statement
Not applicable.
Informed Consent Statement
Not applicable.
Data Availability Statement
No new data were created or analyzed in this study. The data are included in the literature presented in this manuscript.
Acknowledgments
The authors are very thankful to CMG for providing the academic license of GEM, to Schlumberger for providing the academic license of Eclipse 100, and to Kappa for providing the academic license of Rubis.
Conflicts of Interest
The authors declare no conflict of interest.
References
- Bachu, S. Identification of oil reservoirs suitable for CO2-EOR and CO2 storage (CCUS) using reserves databases, with application to Alberta, Canada. Int. J. Greenh. Gas Control. 2016, 44, 152–165. [Google Scholar] [CrossRef]
- Balch, R.; McPherson, B. Integrating Enhanced Oil Recovery and Carbon Capture and Storage Projects: A Case Study at Farnsworth Field, Texas. In Proceedings of the SPE Western Regional Meeting, Anchorage, AK, USA, 23–26 May 2016. [Google Scholar]
- Eide, L.I.; Batum, M.; Dixon, T.; Elamin, Z.; Graue, A.; Hagen, S.; Hovorka, S.; Nazarian, B.; Nøkleby, P.H.; Olsen, G.I.; et al. Enabling Large-Scale Carbon Capture, Utilisation, and Storage (CCUS) Using Offshore Carbon Dioxide (CO2) Infrastructure Developments—A Review. Energies 2019, 12, 1945. [Google Scholar] [CrossRef]
- Li, P.; Liu, X.; Lu, J.; Zhou, D.; Hovorka, S.D.; Hu, G.; Liang, X. Potential evaluation of CO2 EOR and storage in oilfields of the Pearl River Mouth Basin, northern South China Sea. Greenh. Gases Sci. Technol. 2018, 8, 954–977. [Google Scholar] [CrossRef]
- Ringrose, P.S.; Mathieson, A.; Wright, I.; Selama, F.; Hansen, O.; Bissell, R.; Saoula, N.; Midgley, J. The In Salah CO2 Storage Project: Lessons Learned and Knowledge Transfer. Energy Procedia 2013, 37, 6226–6236. [Google Scholar] [CrossRef]
- Kalam, S.; Olayiwola, T.; Al-Rubaii, M.M.; Amaechi, B.I.; Jamal, M.S.; Awotunde, A.A. Carbon dioxide sequestration in underground formations: Review of experimental, modeling, and field studies. J. Petrol. Explor. Prod. Technol. 2021, 11, 303–325. [Google Scholar] [CrossRef]
- Rocca, V.; Viberti, D. Environmental sustainability of oil industry. Am. J. Environ. Sci. 2013, 9, 210–217. [Google Scholar] [CrossRef]
- Bocchini, S.; Castro, C.; Cocuzza, M.; Ferrero, S.; Latini, G.; Martis, A.; Pirri, F.; Scaltrito, L.; Rocca, V.; Verga, F.; et al. The Virtuous CO2 Circle or the Three Cs: Capture, Cache and Convert. J. Nanomater. 2017, 2017, 6594151. [Google Scholar] [CrossRef]
- Alcalde, J.; Flude, S.; Wilkinson, M.; Johnson, G.; Edlmann, K.; Bond, C.E.; Scott, V.; Gilfillan, S.M.V.; Ogaya, X.; Haszeldine, R.S. Estimating geological CO2 storage security to deliver on climate mitigation. Nat. Commun. 2018, 9, 2201. [Google Scholar] [CrossRef]
- Benetatos, C.; Borello, E.S.; Peter, C.; Rocca, V.; Romagnoli, R. Considerations on energy transition. GEAM 2019, 158, 26–31. [Google Scholar]
- Benetatos, C.; Bocchini, S.; Carpignano, A.; Chiodoni, A.; Cocuzza, M.; Deangeli, C.; Eid, C.; Gerboni, R.; Lamberti, A.; Marasso, S.; et al. How underground systems can contribute to meet the challenges of energy transition. GEAM 2021, 58, 65–80. [Google Scholar] [CrossRef]
- Uliasz-Misiak, B. CO2 storage capacity classification and site selection criteria. Gospod. Surowcami Miner. Resour. Manag. 2009, 25, 97–108. [Google Scholar]
- Vangkilde-Pedersen, T.; Anthonsen, K.L.; Smith, N.; Kirk, K.; Neele, F.; van der Meer, B.; le Gallo, Y.; Bossie-Codreanu, D.; Wojcicki, A.; le Nindre, Y.M.; et al. Assessing European capacity for geological storage of carbon dioxide-the EU GeoCapacity project. Energy Procedia 2009, 1, 2663–2670. [Google Scholar] [CrossRef]
- Delprat-Jannaud, F.; Korre, A.; Shi, J.Q.; McConnell, B.; Arvanitis, A.; Boavida, D.; Car, M.; Gastine, M.; Grunnaleite, I.; Bateman, K.; et al. State-of-the-art of Review CO2 Storage Site Selection and Characterisation Methods 2013, A132-A605. Available online: http://repository.cgseurope.net/eng/cgseurope/knowledge-repository/key-reports/evaluation.aspx (accessed on 9 October 2022).
- Celia, M.A.; Bachu, S.; Nordbotten, J.M.; Bandilla, K.W. Status of CO2 storage in deep saline aquifers with emphasis on modeling approaches and practical simulations. Water Resour. Res. 2015, 51, 6846–6892. [Google Scholar] [CrossRef]
- Gholami, R.; Raza, A.; Iglauer, S. Leakage Risk Assessment of a CO2 Storage Site: A Review. Earth-Sci. Rev. 2021, 223, 103849. [Google Scholar] [CrossRef]
- Carbon Transport & Storage Program. Available online: https://www.netl.doe.gov/carbon-management/carbon-storage (accessed on 30 September 2022).
- CCST @ MIT. Available online: https://sequestration.mit.edu/ (accessed on 30 September 2022).
- CO2 Stored Homepage. Available online: https://www.co2stored.co.uk/home/index (accessed on 30 September 2022).
- OpenCCS: Power Capture. Available online: https://www.globalccsinstitute.com/resources/publications-reports-research/openccs-power-capture/ (accessed on 30 September 2022).
- SCCS Projects. Available online: https://www.geos.ed.ac.uk/sccs (accessed on 30 September 2022).
- Global CCS Institute. The Global Status of CCS: 2021; Global CCS Institute: Melbourne, Australia, 2021. [Google Scholar]
- Rochelle, C.A.; Czernichowski-Lauriol, I.; Milodowski, A.E. The impact of chemical reactions on CO2 storage in geological formations: A brief review. Geol. Soc. Spec. Publ. 2004, 233, 87–106. [Google Scholar] [CrossRef]
- Working Group III of the Intergovernmental Panel on Climate Change; Metz, B.; Davidson, O.; de Coninck, H.C.; Loos, M.; Meyer, L.A. (Eds.) IPCC Special Report on Carbon Dioxide Capture and Storage; Cambridge University Press: Cambridge, UK; New York, NY, USA, 2005; p. 442. [Google Scholar]
- Jun, Y.-S.; Giammar, D.E.; Werth, C.J. Impacts of Geochemical Reactions on Geologic Carbon Sequestration. Environ. Sci. Technol. 2013, 47, 3–8. [Google Scholar] [CrossRef]
- Raza, A.; Gholami, R.; Rezaee, R.; Rasouli, V.; Rabiei, M. Significant aspects of carbon capture and storage—A review. Petroleum 2019, 5, 335–340. [Google Scholar] [CrossRef]
- Prévost, J.H.; Altevogt, R.; Fuller, A.S.; Bruant, R.; Scherer, G. Numerical modeling of carbon dioxide injection and transport in Deep Saline Aquifers. In Greenhouse Gas Control Technologies, Proceedings of the 7th International Conference on Greenhouse Gas Control Technologies, Vancouver, Canada, 5–9 September 2004; Elsevier: Amsterdam, The Netherlands, 2005; Volume 7, pp. 2189–2193. [Google Scholar]
- Ghanbari, S.; Al-Zaabi, Y.; Pickup, G.E.; Mackay, E.; Gozalpour, F.; Todd, A.C. Simulation of CO2 Storage in Saline Aquifers. Chem. Eng. Res. Des. 2006, 84, 764–775. [Google Scholar] [CrossRef]
- Bakhshian, S. Dynamics of Dissolution Trapping in Geological Carbon Storage. Int. J. Greenh. Gas Control. 2021, 112, 103520. [Google Scholar] [CrossRef]
- Punnam, P.R.; Krishnamurthy, B.; Surasani, V.K. Investigations of Structural and Residual Trapping Phenomena during CO2 Sequestration in Deccan Volcanic Province of the Saurashtra Region, Gujarat. Int. J. Chem. Eng. 2021, 2021, 7762127. [Google Scholar] [CrossRef]
- Al-Khdheeawi, E.A.; Mahdi, D.S.; Ali, M.; Fauziah, C.A.; Barifcani, A. Impact of Caprock Type on Geochemical Reactivity and Mineral Trapping Efficiency of CO2. In Proceedings of the Offshore Technology Conference Asia, Kuala Lumpur, Malaysia, 2–6 November 2020. [Google Scholar]
- Ali, M.; Aftab, A.; Arain, Z.U.; Al-Yaseri, A.; Roshan, H.; Saeedi, A.; Iglauer, S.; Sarmadivaleh, M. Influence of organic acid concentration on wettability alteration of cap-rock: Implications for CO2 trapping/storage. ACS Appl. Mater. Interfaces 2020, 12, 39850–39858. [Google Scholar] [CrossRef] [PubMed]
- Arif, M.; Al-Yaseri, A.Z.; Barifcani, A.; Lebedev, M.; Iglauer, S. Impact of pressure and temperature on CO2–brine–mica contact angles and CO2–brine interfacial tension: Implications for carbon geo-sequestration. J. Colloid Interface Sci. 2016, 462, 208–215. [Google Scholar] [CrossRef] [PubMed]
- Singh, M.; Chaudhuri, A.; Soltanian, M.R.; Stauffer, P.H. Coupled Multiphase Flow and Transport Simulation to Model CO2 Dissolution and Local Capillary Trapping in Permeability and Capillary Heterogeneous Reservoir. Int. J. Greenh. Gas Control. 2021, 108, 103329. [Google Scholar] [CrossRef]
- Pentland, C.; El-Maghraby, R.; Georgiadis, A.; Iglauer, S.; Blunt, M. Immiscible displacements and capillary trapping in CO2 storage. Energy Proc. 2011, 4, 4969–4976. [Google Scholar] [CrossRef]
- Al-Khdheeawi, E.A.; Vialle, S.; Barifcani, A.; Sarmadivaleh, M.; Iglauer, S. Influence of injection well configuration and rock wettability on CO2 plume behaviour and CO2 trapping capacity in heterogeneous reservoirs. J. Nat. Gas Sci. Eng. 2017, 43, 190–206. [Google Scholar] [CrossRef]
- Golding, S.; Uysal, I.; Boreham, C.; Kirste, D.; Baublys, K.; Esterle, J. Adsorption and mineral trapping dominate CO2 storage in coal systems. Energy Proc. 2011, 4, 3131–3138. [Google Scholar] [CrossRef]
- Iglauer, S. Dissolution Trapping of Carbon Dioxide in Reservoir Formation Brine–A Carbon Storage Mechanism. In Mass Transfer-Advanced Aspects; InTechOpen: London, UK, 2011; Volume 48, Article e2020GL090814. [Google Scholar]
- Ukaegbu, C.; Gundogan, O.; Mackay, E.; Pickup, G.; Todd, A. Simulation of CO2 storage in a heterogeneous aquifer. Proc. Inst. Mech. Eng. Part A J. Power Energy 2009, 223, 249–267. [Google Scholar] [CrossRef]
- Juanes, R.; Spiteri, E.J.; Orr, F.M., Jr.; Blunt, M.J. Impact of relative permeability hysteresis on geological CO2 storage. Water Resour. Res. 2006, 42, W12418. [Google Scholar] [CrossRef]
- Pruess, K.; Xu, T.; Apps, J.; Garcia, J. Numerical Modeling of Aquifer Disposal of CO2. SPE J. 2003, 8, 49–60. [Google Scholar] [CrossRef]
- Al-Khdheeawi, E.A.; Mahdi, D.S.M.; Ali, M.; Iglauer, S.; Barifcani, A. Reservoir Scale Porosity-Permeability Evolution in Sandstone Due to CO2 Geological Storage. In Proceedings of the 15th Greenhouse Gas Control Technologies Conference, Abu Dhabi, United Arab Emirates, 15–18 March 2021. [Google Scholar]
- Yusof, M.A.M.; Mohamed, M.A.; Akhir, N.A.M.; Ibrahim, M.A.; Saaid, I.M.; Idris, A.K.; Idress, M.; Matali, A.A.A.A. Influence of Brine–Rock Parameters on Rock Physical Changes During CO2 Sequestration in Saline Aquifer. Arab. J. Sci. Eng. 2022, 47, 11345–11359. [Google Scholar] [CrossRef]
- Jobard, E.; Sterpenich, J.; Pironon, J.; Corvisier, J.; Randi, A. Experimental Modelling of the Caprock/Cement Interface Behaviour under CO2 Storage Conditions: Effect of Water and Supercritical CO2 from a Cathodoluminescence Study. Geosciences 2018, 8, 185. [Google Scholar] [CrossRef]
- Kumar, N.; Bryant, S. Optimizing Injection Intervals in Vertical and Horizontal Wells for CO2 Sequestration. In Intergovernmental Panel on Climate Change (IPCC) Report, Proceedings of the SPE Annual Technical Conference and Exhibition, Denver, CO, USA, 21–24 September 2008; Cambridge University Press: Cambridge, UK, 2005. [Google Scholar]
- Urych, T.; Chećko, J.; Magdziarczyk, M.; Smoliński, A. Numerical Simulations of Carbon Dioxide Storage in Selected Geological Structures in North-Western Poland. Front. Energy Res. 2022, 10, 827794. [Google Scholar] [CrossRef]
- Erfani, H.; Babaei, M.; Niasar, V. Dynamics of CO2 density-driven flow in carbonate aquifers: Effects of dispersion and geochemistry. Water Resour. Res. 2021, 57, e2020WR027829. [Google Scholar] [CrossRef]
- Zhang, D.; Song, J. Mechanisms for geological carbon sequestration. In Proceedings of the 23rd International Congress of Theoretical and Applied Mechanics, Beijing, China, 19–24 August 2012. [Google Scholar]
- Nghiem, L.; Sammon, P.; Grabenstetter, J.; Ohkuma, H. (Eds.) Modeling CO2 storage in aquifers with a fully-coupled geochemical EOS compositional simulator. In Proceedings of the SPE/DOE Symposium on Improved Oil Recovery, Society of Petroleum Engineers, Tulsa, OK, USA, 17–21 April 2004. [Google Scholar]
- Yu, W.; Zhang, Y.; Varavei, A.; Sepehrnoori, K.; Zhang, T.; Wu, K.; Miao, J. Compositional simulation of CO2 huff-n-puff in Eagle Ford tight oil reservoirs with CO2 molecular diffusion, nanopore confinement and complex natural fractures. In Proceedings of the SPE Improved Oil Recovery Conference, Society of Petroleum Engineers, Tulsa, OK, USA, 14–18 April 2018. SPE Paper 190325. [Google Scholar]
- Churcher, P.L.; French, P.R.; Shaw, J.C.; Schramm, L.L. SPE 21044-Rock Properties of Berea Sandstone, Baker Dolomite, and Indiana Limestone. In Proceedings of the SPE International Symposium on Oilfield Chemistry, Anaheim, CA, USA, 20–22 February 1991. [Google Scholar]
- Donnez, P. Essentials of Reservoir Engineering; Editions TECHNIP: Paris, France, 2012; Volume 2. [Google Scholar]
- Song, J.; Zhang, D. Comprehensive Review of Caprock-Sealing Mechanisms for Geologic Carbon Sequestration. Environ. Sci. Technol. 2013, 47, 9–22. [Google Scholar] [CrossRef] [PubMed]
- Gorrell, H.A. Geological notes-Classification of formation waters based on sodium chloride content. Bull. Am. Assoc. Pet. Geol. 1958, 42, 2513. [Google Scholar]
- Thanh, H.V.; Lee, K.-K. Application of Machine Learning to Predict CO2 Trapping Performance in Deep Saline Aquifers. Energy 2022, 239, 122457. [Google Scholar] [CrossRef]
- Dullien, F.A.L. Porous Media Fluid Transport and Pore Structure; Elsevier: Amsterdam, The Nethelands, 1979. [Google Scholar]
- Gershenzon, N.I.; Ritzi, R.W., Jr.; Dominic, D.F.; Mehnert, E.; Okwen, R.T. Comparison of CO2 Trapping in Highly Heterogeneous Reservoirs with Brooks-Corey and Van Genunchten Type Capillary Pressure Curves. arXiv 2015, arXiv:1507.07770. [Google Scholar]
- Krevor, S.C.M.; Pini, R.; Zuo, L.; Benson, S.M. Relative permeability and trapping of CO2 and water in sandstone rocks at reservoir conditions: Multiphase Flow of CO2 and Water in Sandstone Rocks. Water Resour. Res. 2012, 48. [Google Scholar] [CrossRef]
- Burnside, N.M.; Naylor, M. Review and implications of relative permeability of CO2/brine systems and residual trapping of CO2. Int. J. Greenh. Gas Control. 2014, 23, 1–11. [Google Scholar] [CrossRef]
- Pini, R.; Krevor, S.C.M.; Benson, S.M. Capillary pressure and heterogeneity for the CO2/water system in sandstone rocks at reservoir conditions. Adv. Water Resour. 2012, 38, 48–59. [Google Scholar] [CrossRef]
- Wijaya, Z. CO2 injection in an Oil Reservoir with Gas Cap (Compositional Simulation Case at Heidrun Field Norway). Master’s Thesis, NTNU, Norwegian University of Science and Technology, Trondheim, Norway, 2006. [Google Scholar]
- Peng, D.Y.; Robinson, D.B. A New Two-Constant Equation of State. Ind. Eng. Chem. Fundamen. 1976, 15, 59–64. [Google Scholar] [CrossRef]
- Ren, S.; Li, D.; Zhang, L.; Huang, H. Leakage pathways and risk analysis of carbon dioxide in geological storage. Acta Petrol. Sinica 2014, 35, 591–601. [Google Scholar]
- Han, W.S.; McPherson, B.J.; Lichtner, P.C.; Wang, F.P. Evaluation of trapping mechanisms in geologic CO2 sequestration: Case study of SACROC northern platform, a 35-year CO2 injection site. Am. J. Sci. 2010, 310, 282–324. [Google Scholar] [CrossRef]
- Rackley, S. Introduction to geological storage. In Carbon Capture and Storage; Elsevier: Amsterdam, The Netherlands, 2017; pp. 285–304. [Google Scholar]
- Xu, T.; Apps, J.; Pruess, K. Analysis of Mineral Trapping for CO2 Disposal in Deep Aquifers; Lawrence Berkeley National Laboratory: Berkeley, CA, USA, 2001; Available online: https://escholarship.org/uc/item/59c8k6gb (accessed on 9 October 2022).
- Mattax, C.C.; Dalton, R.L. Reservoir Simulation; SPE Monograph Series; Society of Petroleum Engineers: Richardson, TX, USA, 1990; Volume 13, p. 187. ISBN 978-1-55563-028-7. [Google Scholar]
- Abou-Kassem, J.H.; Islam, M.R.; Farouq-Ali, S.M. Petroleum Reservoir Simulation—The Engineering Approach; Gulf Professional Publishing, Elsevier: Amsterdam, The Netherlands, 2019; p. 526. ISBN 9780128191507. [Google Scholar]


Publisher’s Note: MDPI stays neutral with regard to jurisdictional claims in published maps and institutional affiliations. |
© 2022 by the authors. Licensee MDPI, Basel, Switzerland. This article is an open access article distributed under the terms and conditions of the Creative Commons Attribution (CC BY) license (https://creativecommons.org/licenses/by/4.0/).