Article

Comparison of Pollutants Emission for Hybrid Aircraft with Traditional and Multi-Propeller Distributed Propulsion

1
Department of Aerospace Engineering, Faculty of Mechanical Engineering and Aviation, Rzeszow University of Technology, 35-959 Rzeszow, Poland
2
Department of Ship Operation, Faculty of Navigation, Gdynia Maritime University, 81-225 Gdynia, Poland
*
Author to whom correspondence should be addressed.
Sustainability 2022, 14(22), 15076; https://doi.org/10.3390/su142215076
Submission received: 9 October 2022 / Revised: 5 November 2022 / Accepted: 9 November 2022 / Published: 14 November 2022

Abstract

:
Due to the dynamic development of environmentally friendly aircraft propulsion, the paper describes the effect of distributed propulsion on the emission and fuel consumption changes of aircraft in comparison to aircraft with traditional propulsion. A distributed propulsion is a propulsion composed of a set of units located on the leading edges of the wings or on the fuselage, generating a thrust symmetrically distributed on both sides of the fuselage. The analysis was based on the technical data of AOS H2 motor glider. During the tests for the adopted geometry of distributed propulsion, the improvement of airframe aerodynamic parameters was determined by conducting a CFD flow analysis. Based on the energy method, the flight range and duration were determined for the aircraft with distributed propulsion. It occurred that they increased by 19% compared to the initial variant—traditional propulsion. For the adopted energy source—Wankel AG-407TGi engine, the emissions of CO, CO2, and NO in the exhausts were measured. After the application of distributed propulsion, the emissions and fuel consumption were reduced by 16%. The research conducted showed that the application of distributed propulsion instead of traditional propulsion can bring measurable environmental benefits. Conducting further research on multi-criteria optimization of aircraft structures may bring further benefits in terms of improving aircraft performance and environmentally friendly indicators.

1. Introduction

Lowering the quality of the atmospheric air, and global warming are the phenomena caused, among others, by almost all means of transport. The dynamic development of legal regulations on the permitted level of pollutant emissions from the combustion products of hydrocarbon fuels forces the implementation of technological and organizational solutions to meet them [1]. Recently, it can be clearly seen on the example of air transport, for which many restrictions have been introduced in the zone of near-airport flights and traffic in operational zones. There is also a search for new types of aircraft propulsion, those that will be characterized by lower fuel consumption, and lower emission of noise and combustion products. For this reason, the paper attempts to compare the emissions and fuel consumption in the case of both traditional and distributed propulsion applied for the aircraft built on the AOS H2 motor glider airframe.
Currently, aircraft design requires a more efficient, more economical and pro-environment (3Es) approach [2]. Such structures should be both more environmentally friendly and matching the expectations of their consumers and users. To determine and compare the performance of aircraft equipped with electric and hybrid propulsion during the aircraft flight, it is advantageous to use the energy method. The management of the energy stored on board by controlling the power unit, and by the appropriate selection of the range of its operation and configuration to the flight conditions, enables more effective use of the energy stored in the fuel or in the batteries on board the aircraft. This approach enables reduction of the energy consumption in relation to the flight duration, and also ties energy consumption to the reduction in the emission of pollutants to the atmosphere [3].
The distributed propulsion is based on the usage of many low-power engines cooperating with the propellers located along the leading edge of the wing. Electric motors are most often used to drive the propellers. The source of energy available on board can be batteries, but also hybrid systems—e.g., a combustion engine coupled to an alternator or a fuel cell.
Research on distributed propulsion is undertaken in many research centers. In [4,5,6,7,8,9,10], there were presented various design concepts of this type of propulsion, trends for future projects, possible applications, and there were defined possible economic and environmental effects. Among other things, such research is carried out at an advanced level by the JOBY Aviation together with NASA. Their original project, LEAPTech (Figure 1), aims to build an aircraft, based on the Cirrus SR22 aircraft, which consumes the energy available on board more efficiently.
Based on the research conducted so far, the JOBY Aviation company claims [11,12] that after the application of distributed propulsion, the lift coefficient in the cruising phase will double, while the maximum lift coefficient will be four times higher in relation to the aerodynamic parameters of the Cirrus SR22 aircraft. Preliminary studies have shown that the application of distributed propulsion can improve the performance of the aircraft with the same amount of energy stored on board. The impact of distributed propulsion on the structure and aerodynamics of the aircraft was examined in an analytical manner [13]. The LEAPtech project was an inspiration for the authors to conduct their own research on distributed propulsion, which resulted in preparing a doctoral dissertation and papers published in [2,14,15] in which the AOS H2 motor glider was the basis for the application of distributed propulsion, and various sources of energy used to propel this aircraft were analyzed.
A significant advantage of applying distributed propulsion to propel an aircraft is the possibility of reducing fuel consumption and total emissions referred to a given distance covered by the aircraft. The exact values can be computed or measured. Various methods are used to measure the emissions generated by reciprocating engines, which are mainly used to drive electric generators. One of the methods is the one using the Orsat’s apparatus—the exhaust gas flows through control liquids that absorb a given component from the exhaust gas. The increase in liquid volume corresponds to the amount of exhaust gas component absorbed. When measuring CO2, CO, and HC, the NonDispersive InfraRed (NDIR) method is commonly used [16]. This method has become popular due to its very high accuracy over a wide range. The NDIR sensor consists of an infrared source, a fluorescent lamp, a filter, and a detector. It works by pumping or diffusing gas into the fluorescent lamp. Then the absorption of the given wavelength light is measured. The amount of light absorbed is converted into electrical power. NDIR sensors monitor and detect the presence of a given gas based on the absorption of infrared light of a specific wavelength—for CO2 it is usually 4.26 µm, for CO it is 4.67 μm, for HC it is 3.3–3.5 μm [17,18]. These wavelengths are not absorbed by other common gases. In the case of NOx measurements, electrochemical sensors are most often used. The principle of operation of an electrochemical sensor is based on changes in the electrical parameters of the electrodes in contact with the electrolyte in the presence of a specific gas. The change in electrical parameters is the result of a redox chemical reaction (reduction and oxidation) of the measured gas at the electrode surface.
The paper presents the possibilities of better use of the energy stored on board an aircraft with a hybrid energy source using distributed propulsion.
In order to verify whether the use of distributed propulsion in a light aircraft can reduce fuel consumption and emissions in relation to the covered route, the research was planned and conducted in the following order. First, the AOS H2 motor glider airframe was selected for the analysis. During the tests for the adopted geometry of distributed propulsion, the improvement of airframe aerodynamic parameters was determined by conducting a CFD flow analysis.
Determination of the aircraft flight performance is based on the commonly used Power Method [8], which determines the power necessary for the flight of the aircraft. This method allows the most accurate determination of the aircraft performance corresponding to the actual behavior of the aircraft in flight. Based on this method, the flight range and duration were determined for the aircraft with distributed propulsion. Using these data on the basis of the conducted emission tests of the Wankel 407TGi engine, which is the energy source for both propulsion systems—traditional and distributed ones, the influence of the distributed propulsion on fuel consumption and the emission related to one kilometer of the covered distance was determined. It can be stated that the improved energy management will be accompanied by a decrease in fuel consumption and in pollutant emissions per kilometer of the covered route.

2. Research Aims, Description of the Research Object and Applications of Distributed Propulsion

2.1. Research Aims and Research Object Description

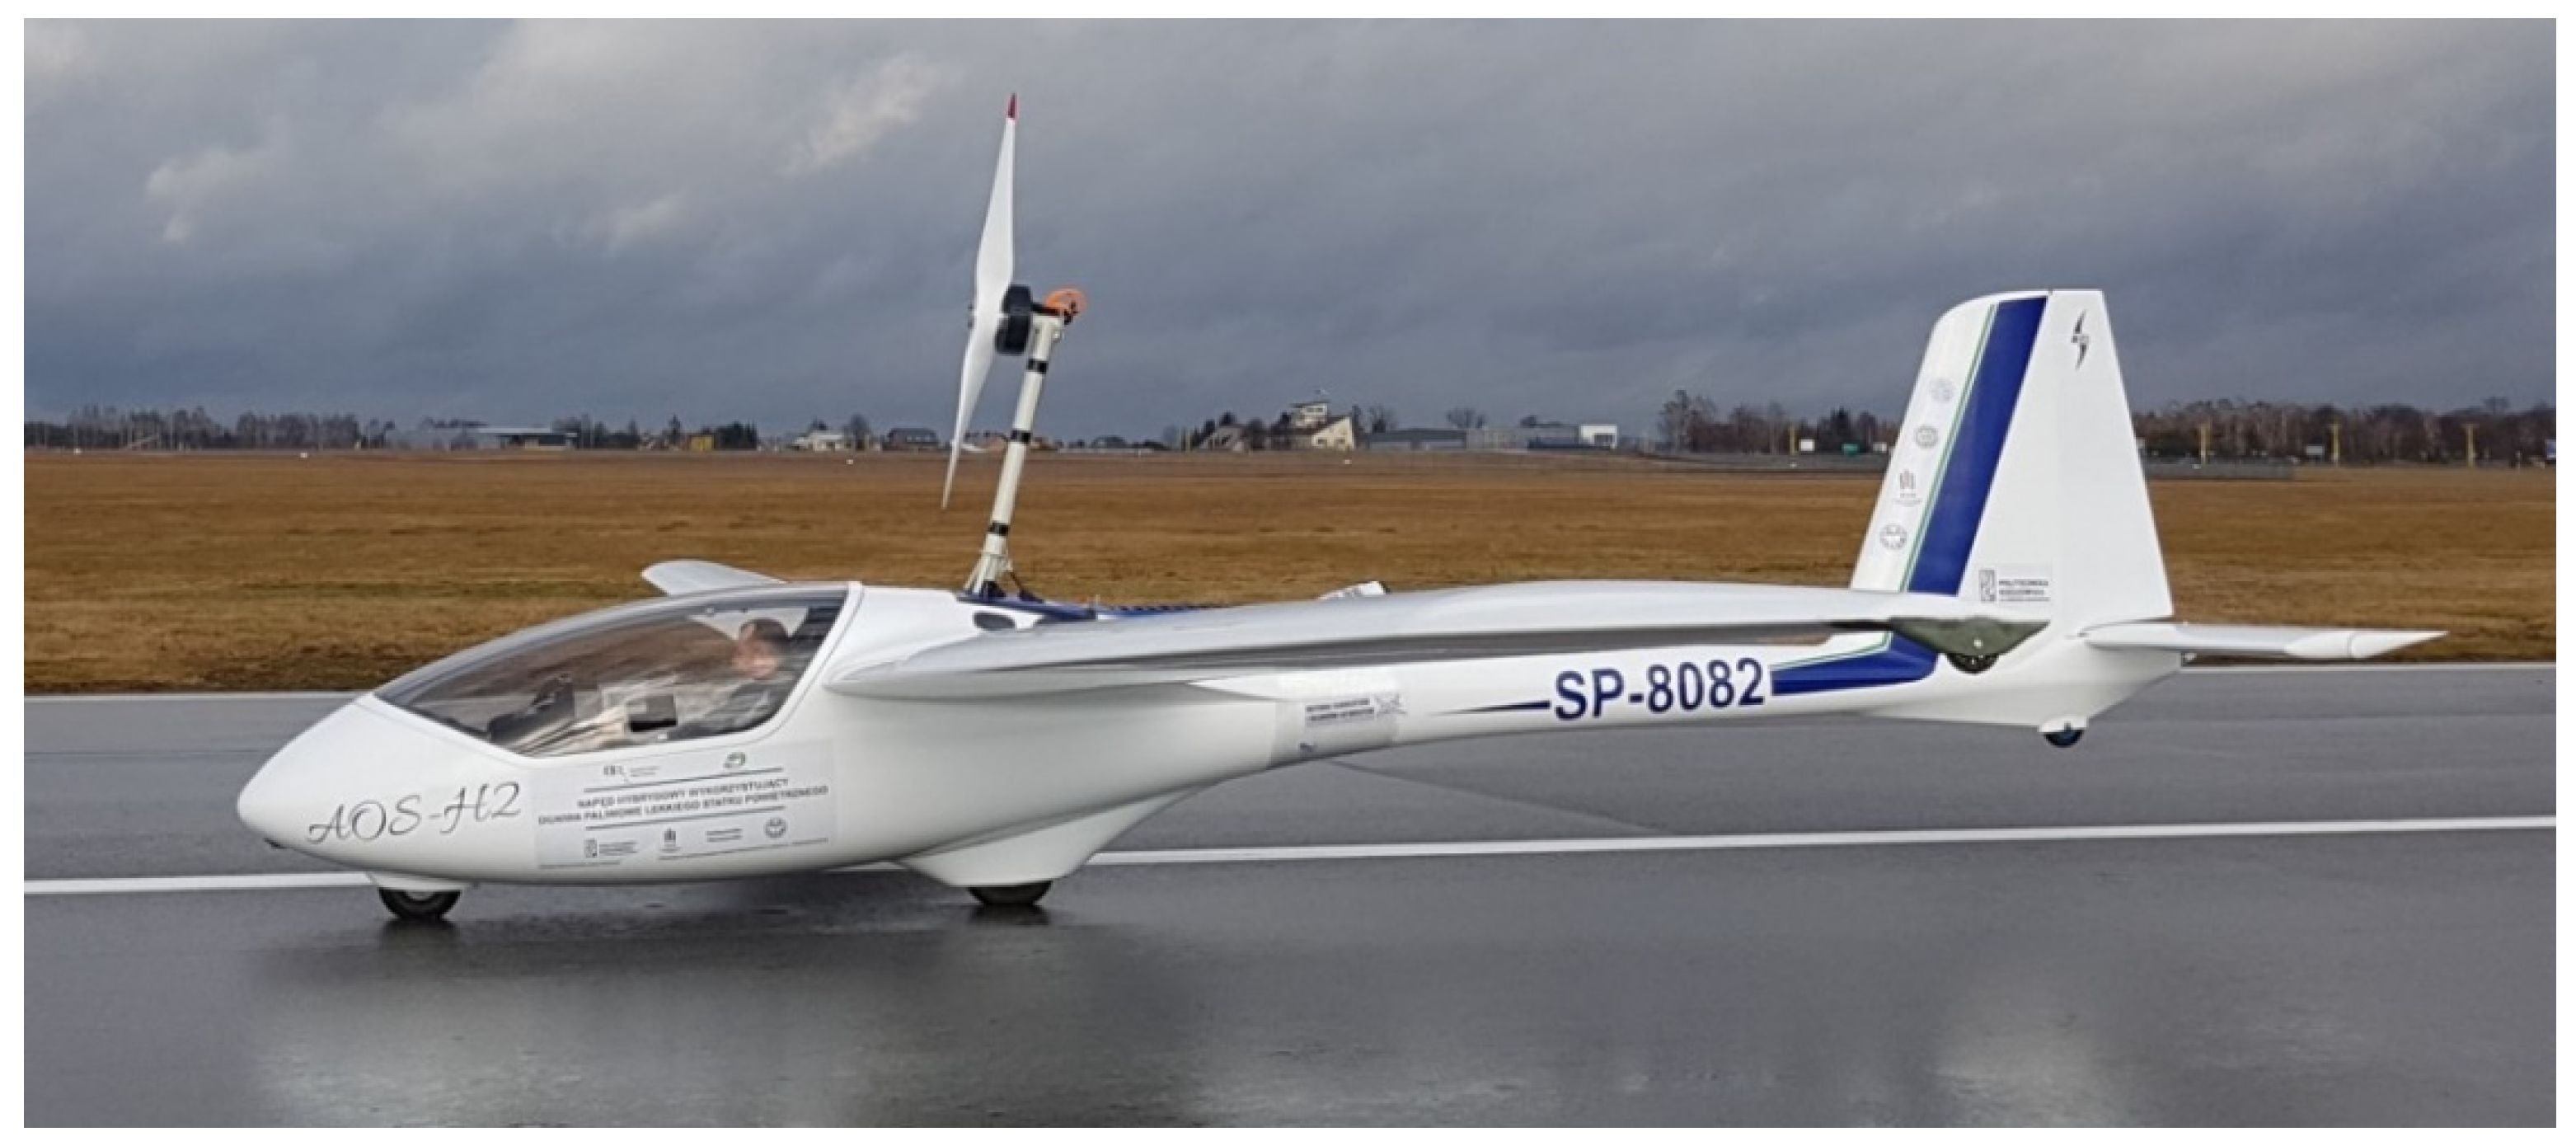
The research aims at verifying whether the application of distributed propulsion will reduce the road emissions of the aircraft in comparison to the traditional propulsion configuration. The research object used to conduct the research is the airframe of the AOS H2 motor glider, being at the disposal of the Department of Aerospace Engineering of Rzeszow University of Technology, Poland. The airspeed of 100 km/h at the altitude of 500 m was adopted as the flight parameter. A suitable energy method was developed by the authors and used to determine the performance parameters of the aircraft (flight range and duration). The motor glider has a hybrid propulsion, and the energy required for the take-off and flight comes from both the Li-Pol battery pack located in the forward part of the fuselage and from a hydrogen fuel cell or, alternatively, a piston engine driving an electric generator located behind the pilot’s cabin in the fuselage. The power unit consists of the EMRAX 268 engine located on a fixed mast at the rear of the fuselage and a two-bladed wooden propeller. Table 1 shows the basic geometric data of the airframe.
The photo in Figure 2 shows the AOS H2 motor glider during tests conducted at the airport.
Based on the technical data of the aircraft, the flight trajectory was selected for the further research; it is presented in Figure 3. As shown in the figure, for the initial stages of the flight (take-off, climb), the time of maneuvers (tST—time of take-off, tC—time of climb), and power necessary for flight NS were indicated. The figure also has the markings of horizontal lengths corresponding to the following stages: the acceleration of the aircraft during the take-off LS, the acceleration of the aircraft in the air LACC and the climb LC. For the climb stage, there is aircraft velocity V and vertical speed W. For the last stage of the flight, which is steady flight, the power necessary for flight at the cruise speed was determined. This power will be drawn from the energy source until the energy stored on board is exhausted completely. In this way, the flight duration and range of the aircraft will be determined.

2.2. Materials and Methods

The research focused on the variant equipped with a hybrid power unit where the source of energy are the batteries and a Wankel AG 407 TGi engine, coupled with an alternator and working as a range extender. A diagram of this solution is shown in Figure 4.
The technical data of the power unit are presented in Table 2.
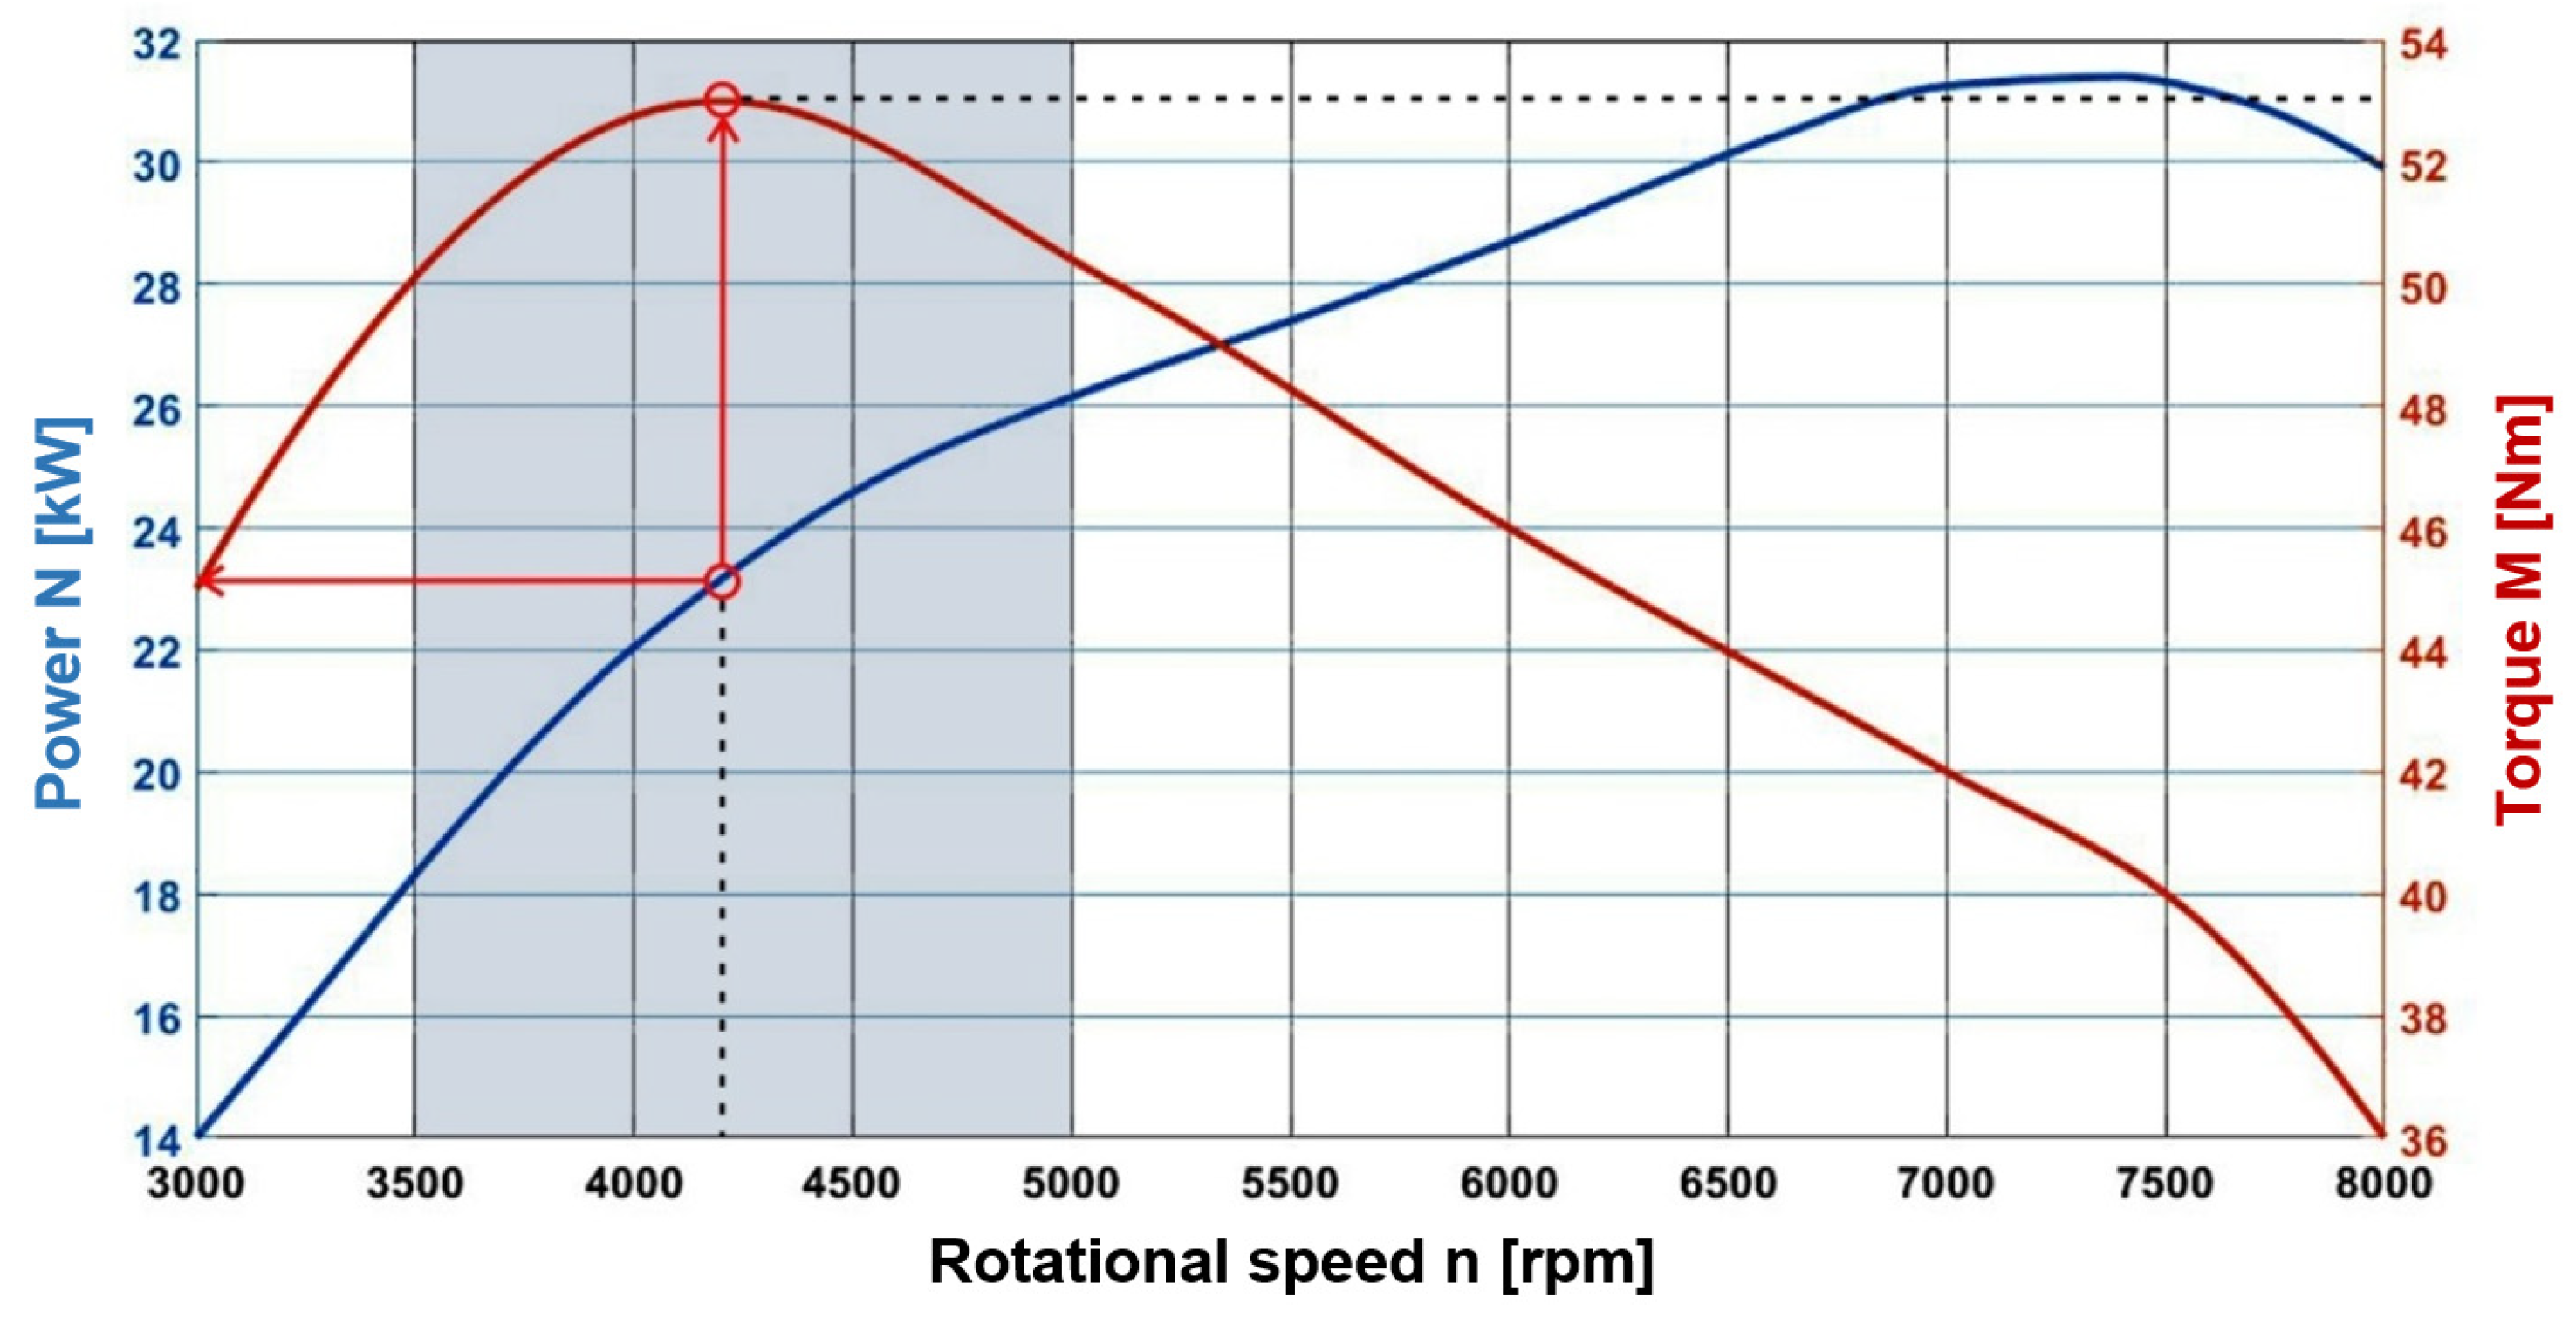
The Wankel AG 407 TGi rotational engine was selected for the generator drive due to its advantages, such as low vibration level, favorable power-to-weight ratio, and easy operation [20]. Its rotational characteristic, shown in Figure 5, were determined at the ambient temperature of about 18 °C. These characteristics were measured in cooperation with BOSMAL Automotive Research and Development Institute Ltd., Poland, using the EMX-30/12000 eddy current brake. According to the producer, the measurement error of this eddy current brake is 2%. In the graph, the red arrows indicate the highest torque developed by the engine and the corresponding engine power.
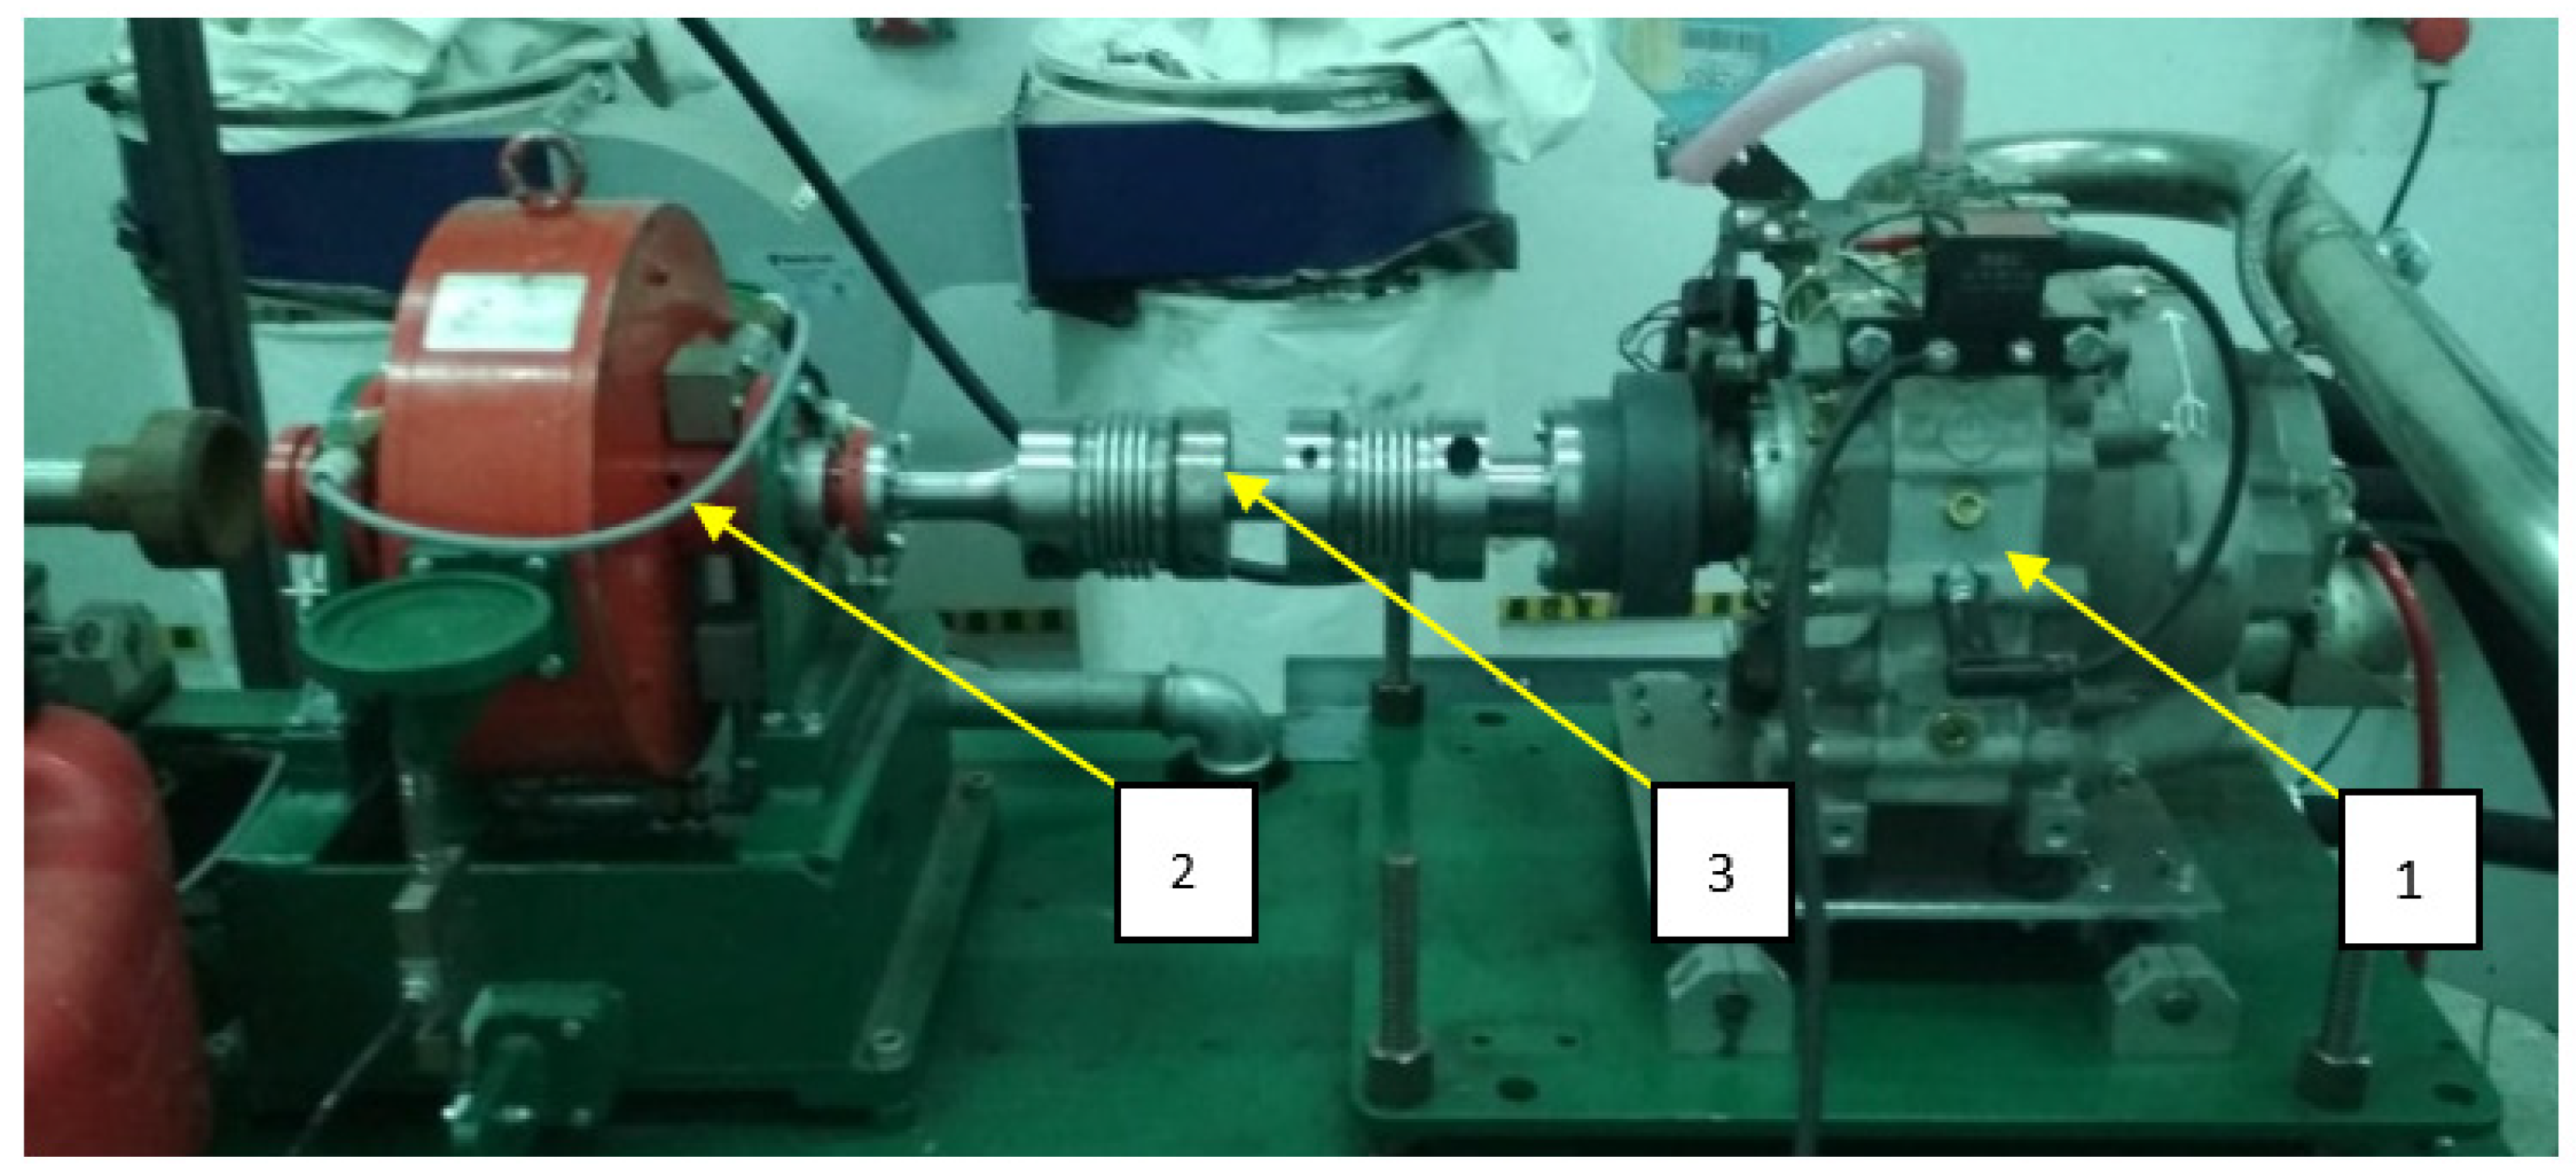
In Figure 6, the engine mounted on the test stand is shown. The test stand uses a water-cooled eddy current brake. This brake loads the reciprocating engine by generating an eddy current field. The torque is transferred to the brake housing by electromotive force. The measurement of the driving torque is performed by a strain gauge beam coupled to the housing. An optical sensor located on the brake shaft is responsible for measuring the rotational speed of the engine. The measuring system calculates the power generated by the motor taking into account the torque and rotational speed of the motor shaft. Fuel consumption is measured by weighing the fuel tank.
The characteristics presented in Figure 5 show that the range of engine operation with the highest values of torque (over 28 Nm) is within the range of the rotational speed of the engine shaft between 3500 rpm and 5000 rpm (which is indicated in the figure as grey area). In turn, the maximum torque (53 Nm) corresponds to the power of about 22.5–23 kW (which is indicated in the photo with red arrows). In these ranges, the engine achieves the best thermal efficiency, i.e., the ratio of the developed power at the highest torque parameters that the engine can achieve to the simultaneous lowest specific fuel consumption. At the same time, the engine instruction manual [20] states that the value of the minimum specific fuel consumption (0.3 kg/(W·h)) is achieved by the engine at the rotational speed of 4000 rpm. In this operating range of the engine, the power developed by the engine is 22 kW. Thus, this operating range of the combustion engine was adopted as the most favorable for its generator work.
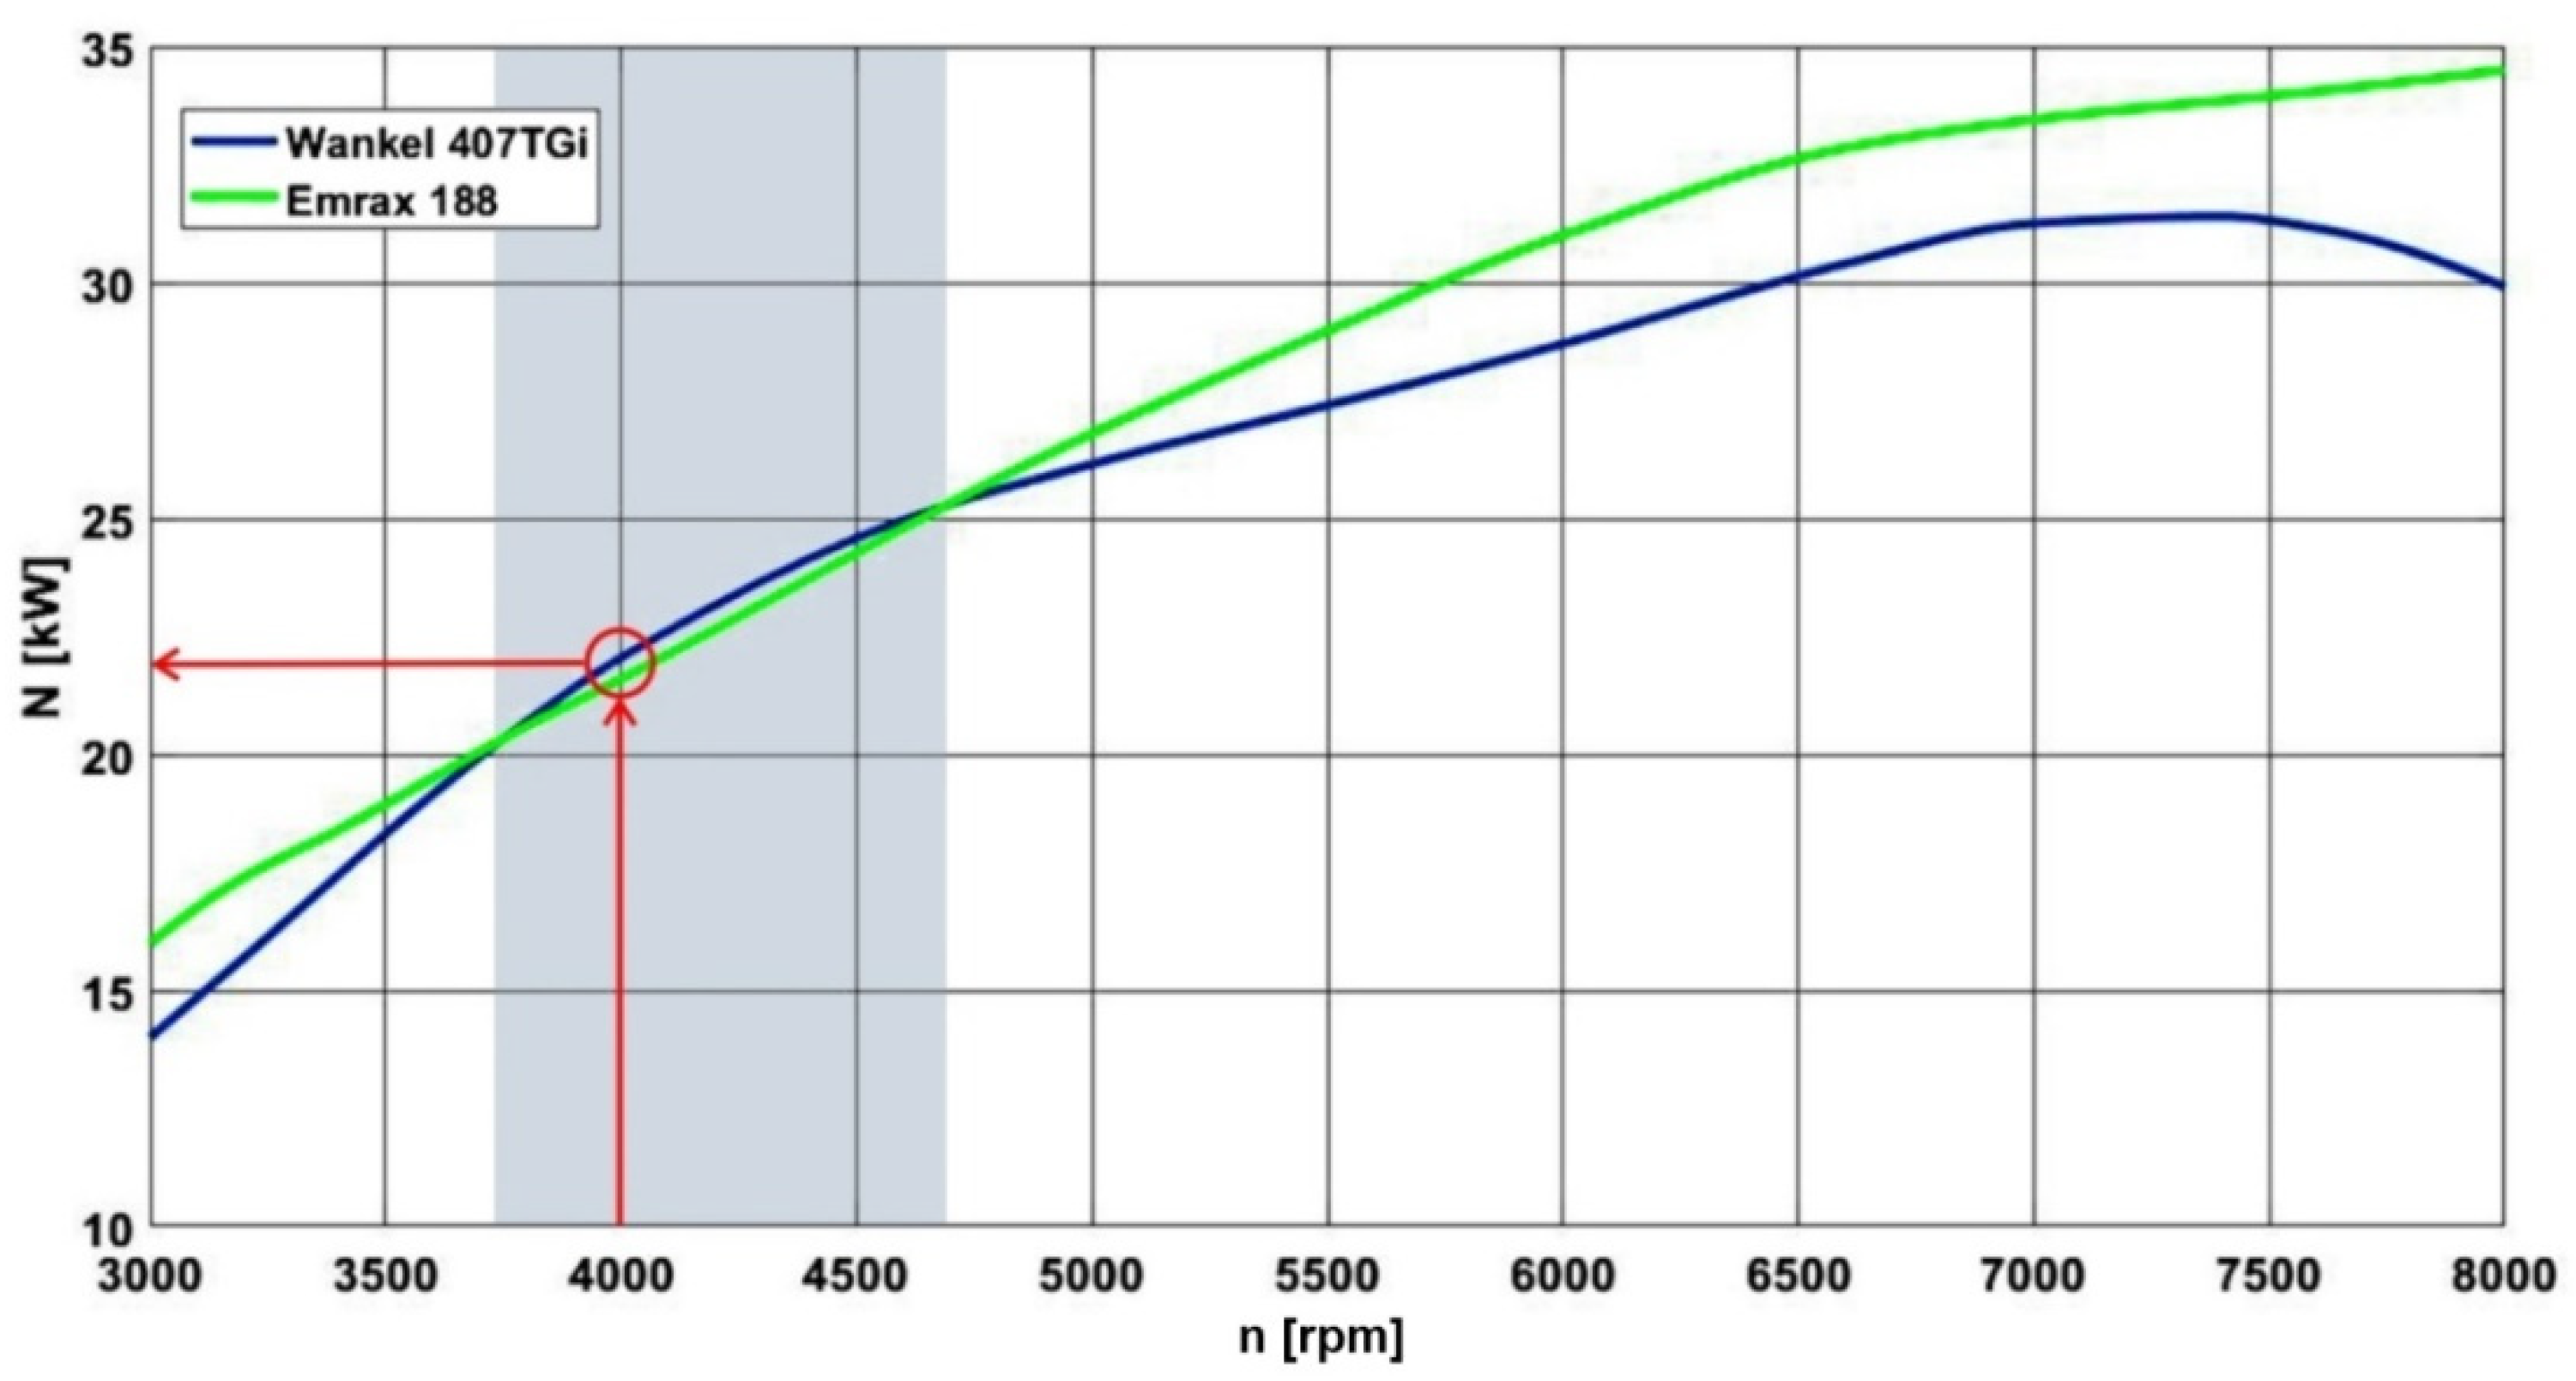
The Emrax 188 electric motor was selected for alternator work. Figure 7 presents the characteristics of the Emrax 188 and Wankel 407TGi engines. The characteristics of the Emrax motor were obtained from the manufacturer’s manual.
Based on the characteristics of the engines, it can be concluded that the most favorable operating range of the generator set is the range from 3700 rpm to 4700 rpm (power range from 20 kW to 25 kW). At these points, the characteristics of the motors intersect, and between these points—they almost coincide (the differences in obtained power amount to approx. 0.5 kW). Due to the fact that the engine with a rotating piston achieves the lowest specific fuel consumption at 4000 rpm (22 kW of generated power), this operating point was adopted for its generator work. The fuel mass assumed to run the generator is 7 kg.
After determining the appropriate range of cooperation between the combustion engine and the electric motor, it is possible to determine the total energy stored onboard the aircraft Eh [J], using the following formula [15]:
E h = C · U +   η g   ( N s · t s )
where:
E h —total energy stored onboard [J],
C—battery capacity [As]
U—voltage [V],
η s —generator efficiency corresponding to the efficiency of the electric motor [-],
N s —power generated by the combustion engine [kW],
t s   —the operating time of the combustion engine [s] resulting from the fuel consumption of the engine per unit time is expressed by:
t s = m fuel SFC · N s ,
where:
mfuel—fuel mass [kg],
SFC—specific fuel consumption [kg/(W∙s)].
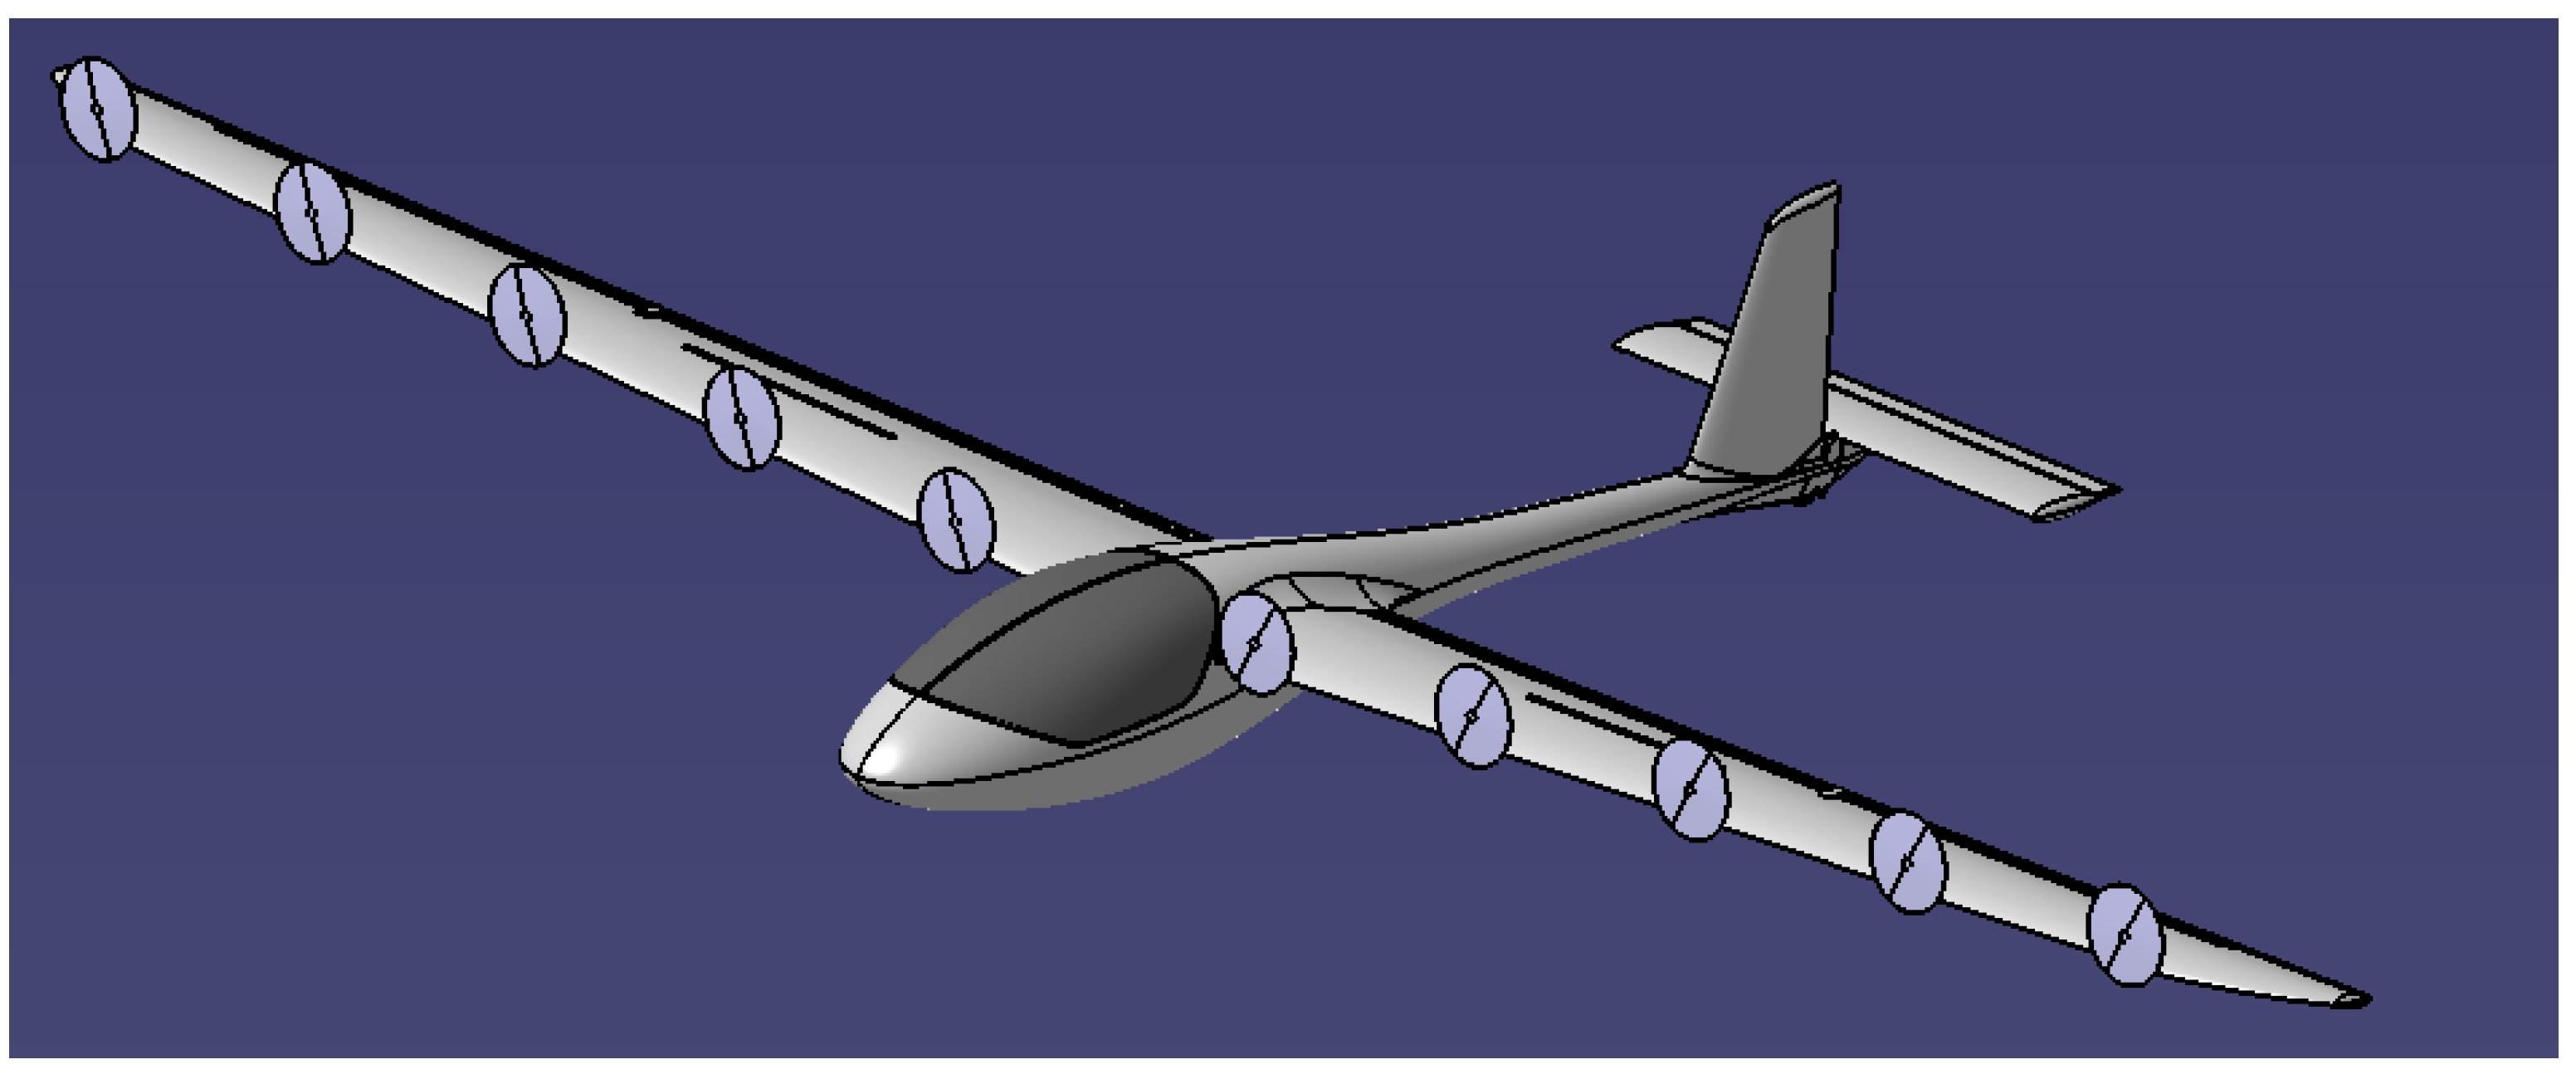
To further improve the operational parameters of the AOS H2 motor glider, based on previous works [14,15], distributed propulsion was applied to it. Based on the analyses [14,15], a set of 10 AXI 8120 electric motors with a maximum power of 4 kW each, cooperating with propellers with a diameter of 0.5 m was selected.
The propellers were spaced equidistant from each other every 1.55 m. The first propulsion cell (a propeller with an electric motor) was placed at a distance of 0.9 m from the wing tip to the engine axis [21]. Such a geometric placement resulted from the airframe structure and the desire to maintain an appropriate distance from the edge of the transition between the fuselage and the wing. Figure 8 shows a visualization of an exemplary distributed propulsion system for the AOS H2 airframe.
Assuming that the propellers are located at a distance equal to the propeller radius [8,19] from the leading edge (as shown in Figure 9), at this stage of the research, the propeller is treated as isolated. Any interference between the propeller and the wing is ignored [8].

2.3. Application of Distributed Propulsion and Its Analysis in Reference to Traditional Propulsion

For the propulsion configuration stated in the previous section, the propeller was selected based on the available propeller characteristics [14]. During the analysis, a two-blade propeller with a Clarck-Y profile with a diameter of 0.5 m was selected. Based on the performance characteristics for a propeller with this profile at the assumed rotational speed of 5400 rpm and the assumed diameter, the propeller provides 21 N of thrust. The propeller geometry was modeled in the Catia V5 software and used in further analyses.
To determine the impact of the distributed propulsion on the aerodynamic performance of the aircraft, a CFD analysis of the wing flow was performed for both distributed and traditional variants. The analysis was performed using the ANSYS FLUENT software [22].
In order to perform the aerodynamic analysis, it was first necessary to determine the velocity of the propeller stream, and additionally verify the computational parameters of the propeller operation.
The following assumptions were made for the analysis:
Air speed entering the propeller equal to the flight speed V = 100 km/h (27.78 m/s);
Propeller operation parameters according to calculation values, i.e., rotational speed n = 5400 rpm, design propeller thrust P = 21 N;
Parameters of the air surrounding the aircraft for an altitude of 500 m (pressure pH and temperature TH), air density ρ = 1.2 kg/m3;
Simplification of the propeller geometry to minimize the possibility of numerical errors;
The finite volume mesh consisted of tetrahedral elements (TED-4) [22], the size of the mesh elements was from 0.2 mm to 50 mm, the minimum size of the mesh resulted from the smallest width of the propeller edge was 0.2 mm.
For the analysis, 12 processor cores, 3.3 GHz each, were used. As a model of flow turbulence, the k-omega equation, dedicated to this type of analysis, was used. Then, a fluid domain model was made. This modeling was performed in two stages. First, an actuator disk was created around the propeller shape with a 20% larger diameter than one of the propellers [22]. The thickness of the disk was the width of the propeller (hub length) increased by 15%. This domain was built from the center of the coordinate system placed in the center of the propeller. Then the disk was placed in the control volume in which it rotated [14]. At the entrance to the stationary domain, a linear speed was set corresponding to the cruising speed—27.78 m/s (100 km/h). The purpose of this analysis was to determine the speed of the propeller stream and the power consumption of the propeller in cruising conditions.
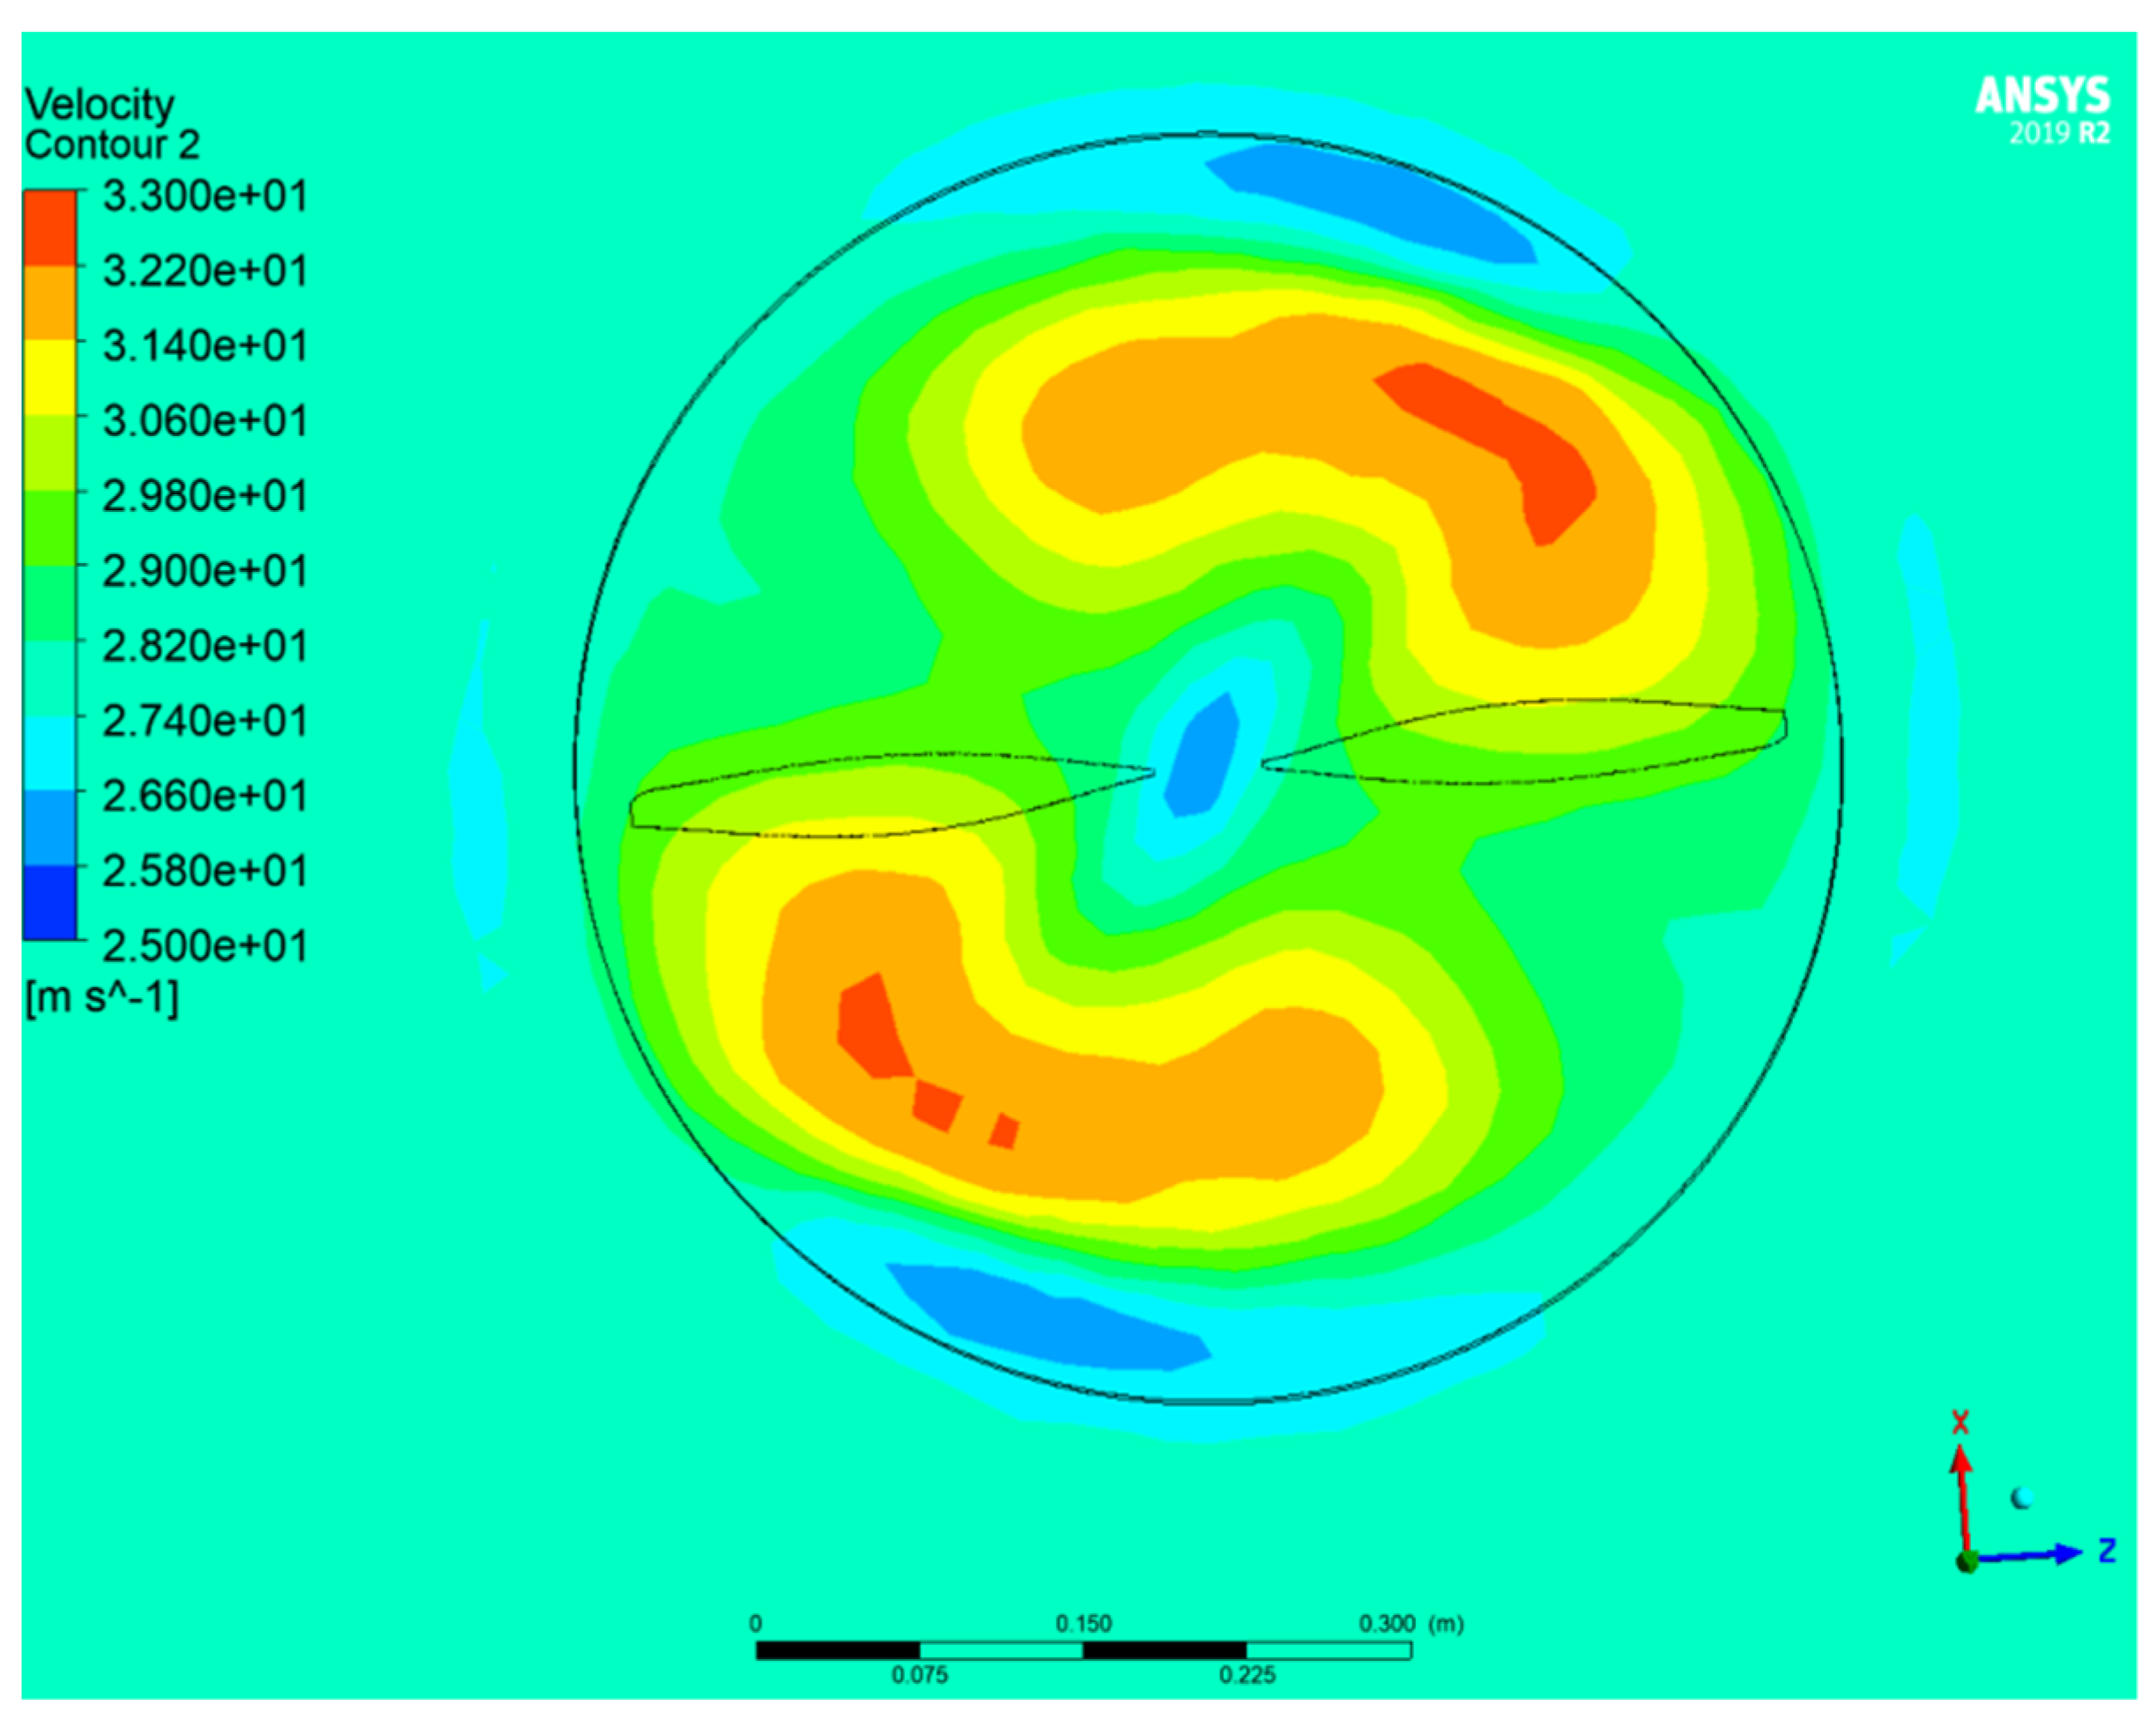
As a result of the analysis, the air stream velocity distribution and pressure changes generated by the propeller were obtained. Figure 10 and Figure 11 show the velocity distributions for cruising conditions—flight speed 27.78 [m/s], at the rotational speed of the propellers equal to 90 rev/s.
On the basis of the obtained results, it can be concluded that the velocity of the undisturbed propeller stream is 30.6 m/s. The propeller stream distribution and the velocity distribution in the front view of the propeller during its rotation assumed the appearance consistent with the theory. The propeller thrust of 20.93 N was obtained, and was read in the report generated after the analysis. This result (the value of the thrust) differs from the value that can be obtained in an analytical way only by 0.33%. This is a satisfactory value, and it can be assumed that the analysis was conducted correctly.
Then, the obtained values of the propeller streams were used to simulate the flow around the wing.
The assumptions for the analysis were:
Adopting the assumed geometrical system of the propulsion,
Adopting the same propeller stream velocity distribution, parameters of the flight, and the air surrounding the plane as for the propeller analysis.
The diagram with the boundary conditions marked is shown in Figure 12.
During the research, the tested airframe element (wing) was first surrounded with a fluid domain and divided into finite elements. The velocity of air stream of 27.78 m/s, corresponding to the cruising range, is given as the velocity value at the entrance to the fluid domain. The ambient pressure and temperature corresponded to the static conditions at the altitude of 500 m. An analysis of the wing stream without an accelerated air stream was performed, determining the lift and drag coefficients.
Another analysis was the determination of the lift and drag coefficients for the wing with the use of an accelerated stream of air by the propellers. In order to perform this analysis, the propeller velocity fields from the CFD analysis of the propeller were used at the entry to the fluid domain surrounding the wing. As a result of the conducted analyses, the change of pressure and velocity distribution on the wing as well as the wing aerodynamic force coefficients were determined. The obtained results allowed to determine the effect of the propulsion on the change of the aerodynamic coefficients of the wing.
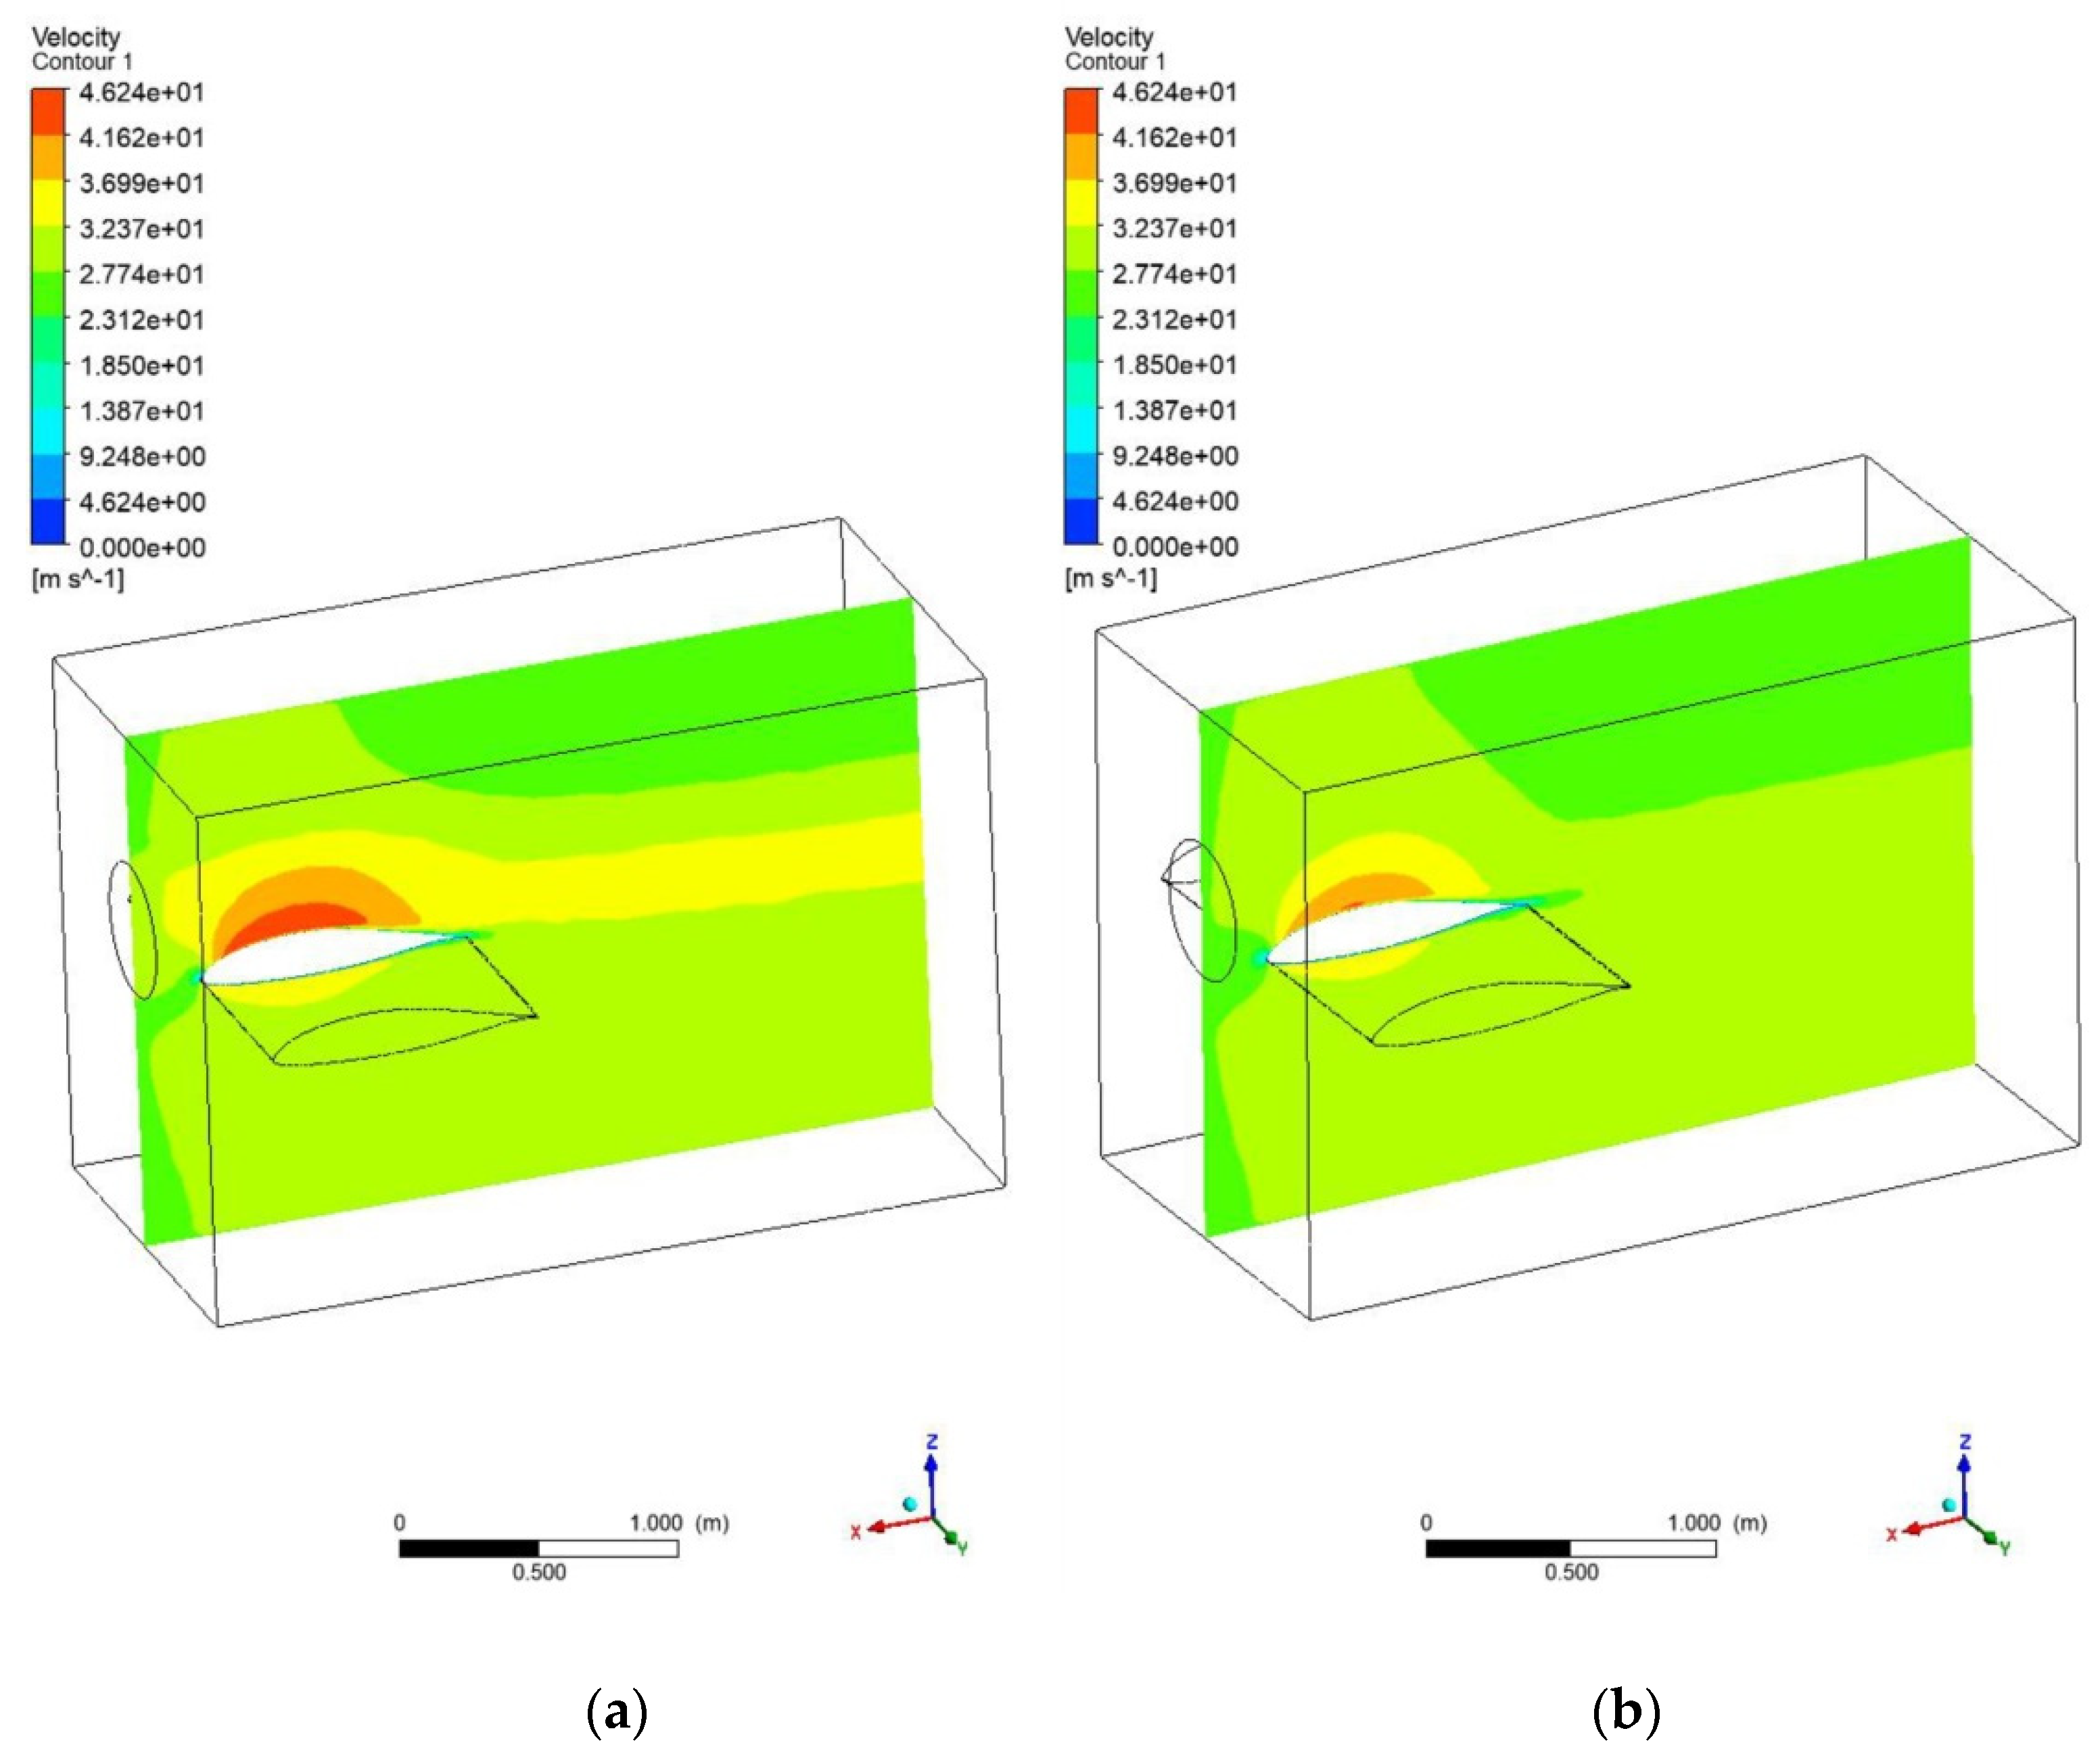
Figure 13 and Figure 14 show the effects of the propeller on the change of air pressure and air velocity on the upper surface of the wing. The flow velocity increased by over 5 m/s (to 46 m/s). The increase in the speed of the air stream on the upper surface of the wing with the unchanged velocity of the air stream flowing around the lower surface of the wing increases the pressure difference, and as a result, increases the lift force and drag force of the wing, and consequently—the coefficients of aerodynamic forces.
Table 3 summarizes the values of the wing aerodynamic force coefficients obtained from CFD simulation tests.
Due to the influence of accelerated air streams flowing around the wing, the drag coefficient CD increased by 5.3%, while the lift coefficient CL increased by 6.8%.
Next, the drag coefficient and the lift coefficient for the airframe were computed, knowing that for the cruising range, in the traditional configuration of the aircraft, the lift coefficient was CL = 0.867, and the drag coefficient CD = 0.0347 [23] for the initially assumed parameters of the flight. The contribution of the lift and drag coefficients without the influence of the propellers for a motor glider in the traditional configuration was calculated. Then, from the total value of the drag coefficient—CDtotal, the value of the drag generated by the motor glider mast in the traditional variant—CDm = 0.005 [23] was subtracted according to the dependence (3).
C D = C Dtotal C Dm
Assuming that the values of the wing aerodynamic coefficients in the flow generated by the propellers have the same contribution to the overall values of the airframe aerodynamic force coefficients as in the traditional variant, the values of these aerodynamic force coefficients for the distributed propulsion of the aircraft were calculated. As a result, for the cruising range, the lift coefficient CL = 0.926 and the drag coefficient CD = 0.031 were obtained. Relative to the initial aerodynamic system (motor glider with an engine mast), the CL increased by 6.8%, while the CD decreased by about 10%. These changes are shown in Figure 15.
It should be noted that in the case of the total drag coefficient, the decrease in this value is mainly due to the removal of the engine mast, as the value of the wing drag coefficient increased.
The obtained increase in the value of the lift coefficient will change the performance characteristics of the aircraft. The following Formulas (4)–(7) [8] were used to determine the lift force and the drag force (on the basis of which the energy required for flight of the motor glider is estimated):
drag force:
D = 1 2 · ρ · S · V 2 · C D   ,
lift force:
L = 1 2 · ρ · S · V 2 · C L  
power required for flight:
N N = P N · V = D · V  
power generated by the power unit:
N S = P S · V   ,
where:
CD—drag coefficient [-],
S—wing area [m2],
CL—lift coefficient [-],
ρ—air density [kg/m3],
V—aircraft velocity [m/s],
PN—force required for flight/thrust required for flight [N],
PS—thrust of the power unit [N].
To maintain the same value of the lift force (Formula (5)) for horizontal flight as for the initial configuration of the AOS H2 motor glider, the angle of attack of the aircraft in relation to the airstream should be changed, or its lift surface should be reduced.
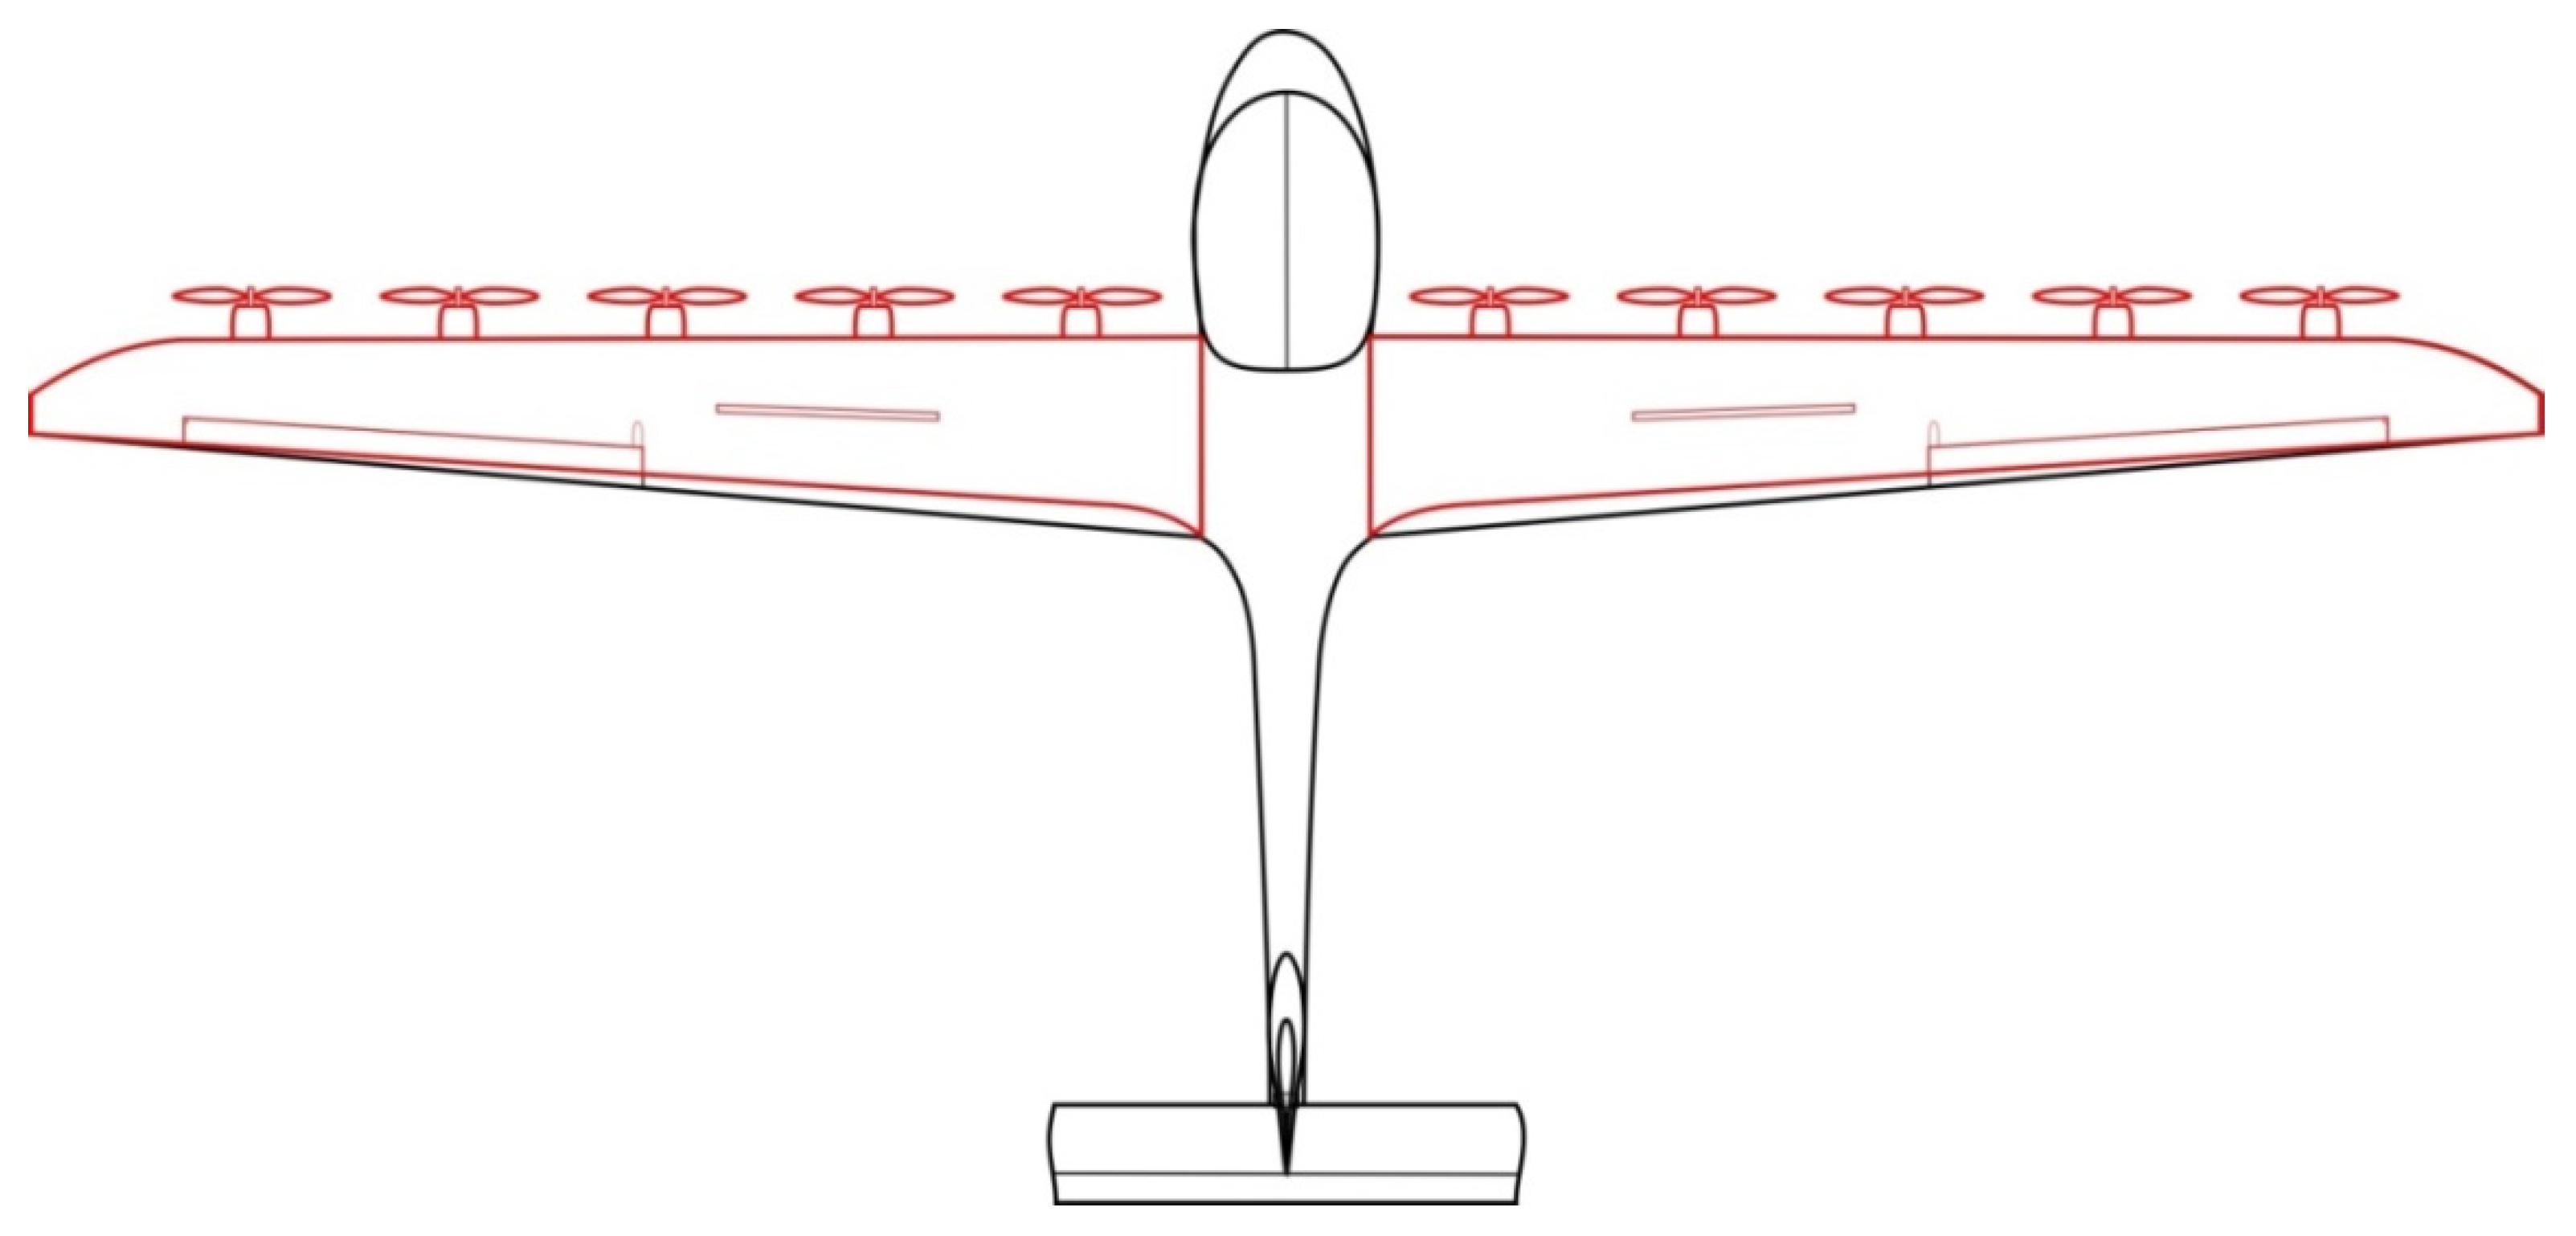
As for the entire airframe, the lift coefficient increased to a greater extent than the drag coefficient, after bringing the lift force to the initial value (i.e., the one at which the aircraft will not climb, but fly horizontally at a flight speed of 100 km/h) by reduction of the aircraft wing area by 0.97 m2 in relation to the initial value of 15.8 m2, the drag force decreased in relation to the traditional propulsion variant—which results directly from Formulas (4)–(7). The change of the airframe lifting surface is presented in Figure 16.
Using Formula (6), the thrust required for flight was determined for the distributed propulsion variant at the level of 220 N. It is the value by 40 N lower than in case of the conventional propulsion variant. However, this result was obtained for the acceleration of the air stream through the propeller with a thrust of 21 N, which gives the total thrust of the entire power unit equal to 210 N. To reduce the difference between the obtained value of thrust of the power unit and the value of thrust required for the flight of the aircraft (the difference is 10 N), the rotational speed of the propellers was increased by 100 rpm. Repeated CFD analyses showed a negligible impact of this procedure on the aerodynamic characteristics of the airframe, but the goal of increasing the thrust of the power unit was achieved. To determine the energy required for horizontal flight, Formula (8) was used:
E N = N N η S · t   ,
where:
N N power required for flight [W],
η S power unit efficiency [-],
t flight duration [s].
The final values adopted to determine the performance of the aircraft with distributed propulsion by means of the energy method are presented in Table 4.
Before determining the flight performance for the trajectory corresponding to Figure 3, the mass balance shown in Table 5 was made. It was assumed that the change of the lift surface would not affect the mass of the aircraft.
As it can be seen, the use of distributed propulsion does not affect the take-off weight of the aircraft.
To determine the range and duration of flight, the energy used for take-off should be subtracted from the energy stored on board in the batteries, and then the energy remaining on board should be divided by the power required for flight and the efficiency of the propulsion unit, which is presented by Formulas (9)–(11) [8,14,15]:
E flight = E h E start   ,
where:
E h total energy stored in the hybrid power unit/energy stored onboard [J],
E start energy required for take-off [J].
Taking into account the dependencies (8) and (9), the flight duration can be written as follows:
t = E flight N N η S
The formula for the flight range takes the following form:
r = t · V
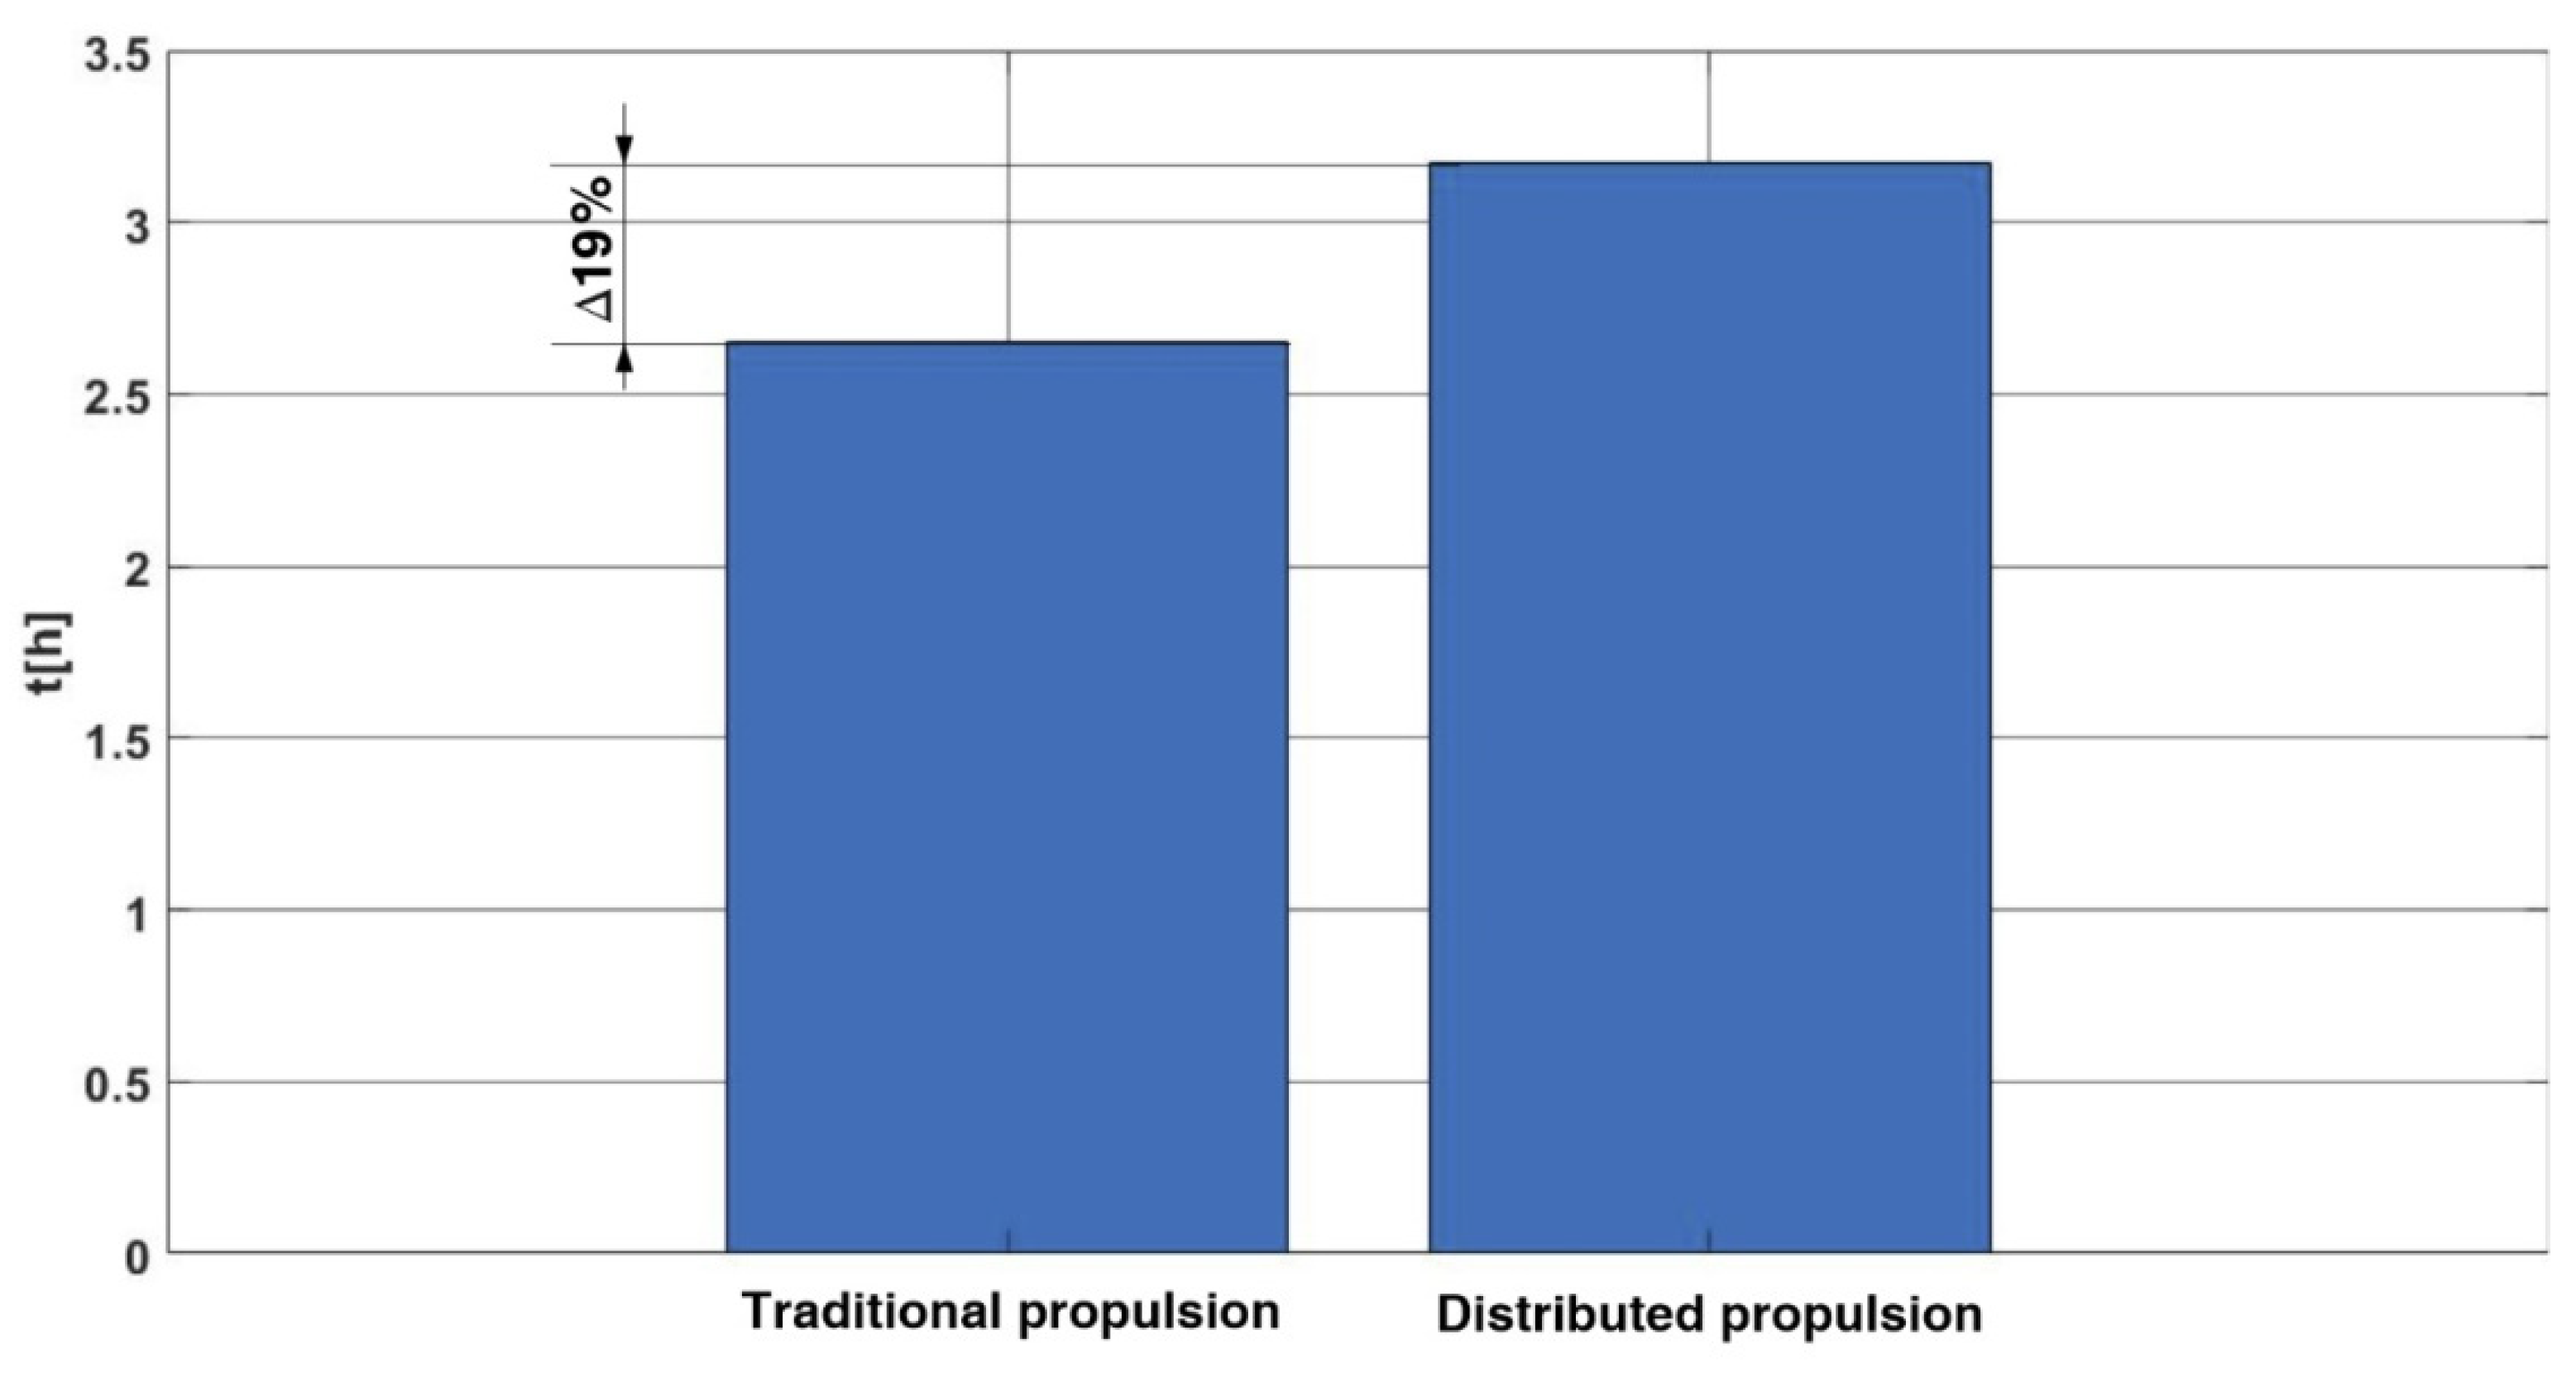
Compared to the traditional propulsion variant, after the application of the distributed propulsion, the flight range increased by about 51 km (up to 317 km) and the flight duration by about 30 min (up to 3.17 h of total flight duration), which turns into a 19% improvement in the performance of the aircraft with distributed propulsion. The results obtained are presented in Figure 17 and Figure 18.

3. Exhaust Composition Analysis

For the Wankel 407TGi engine, tests were conducted to determine the emission of selected pollutants into the atmosphere during the aircraft’s cruise phase. The Horiba MEXA584L apparatus was used, as it measures in the exhaust the concentration of the following substances: carbon monoxide, carbon dioxide, unburned hydrocarbons, and nitrogen oxide. Additionally, it determines the oxygen concentration and the lambda number.
This apparatus used for CO, HC and CO2 measurements, uses the Non-Dispersive InfraRed (NDIR) sensor. The carbon balance method is used to determine the Air-to-Fuel Ratio (AFR) and Excess Air Ration (lambda). The NO measurement is performed by the Electrochemical Cell Sensor (NX1 model, produced by City Technology).
The test was carried out in accordance with the Horiba apparatus manual and the following assumptions:
The engine should be at operating temperature, in the case of the tested engine, it is the thermostat opening temperature of 87.5 °C;
The engine operation range corresponds to the generator operation range (3500–4000 rpm);
The engine operating conditions should be as close to the real ones as possible (ambient conditions at cruising altitude).
The test stand was assembled in the laboratory, while the measurement itself was carried out on a cold day—at 283 K (10 °C) outside, due to difficulties in obtaining the appropriate ambient parameters in the laboratory. The measurement procedure was as follows:
Preparation of the fuel mixture (1:100) of Pb95 gasoline and oil for two-stroke engines according to the Wankel 407TGi engine manual;
Starting the engine and warming it up to the operating temperature of 360–363K (87–90 °C);
Calibration of the Horiba apparatus according to the manual;
Measurement in the scope of the engine’s generator work.
Four measurements were made for the assumed engine operation range and on their basis the average emission for the generator operation range was determined.
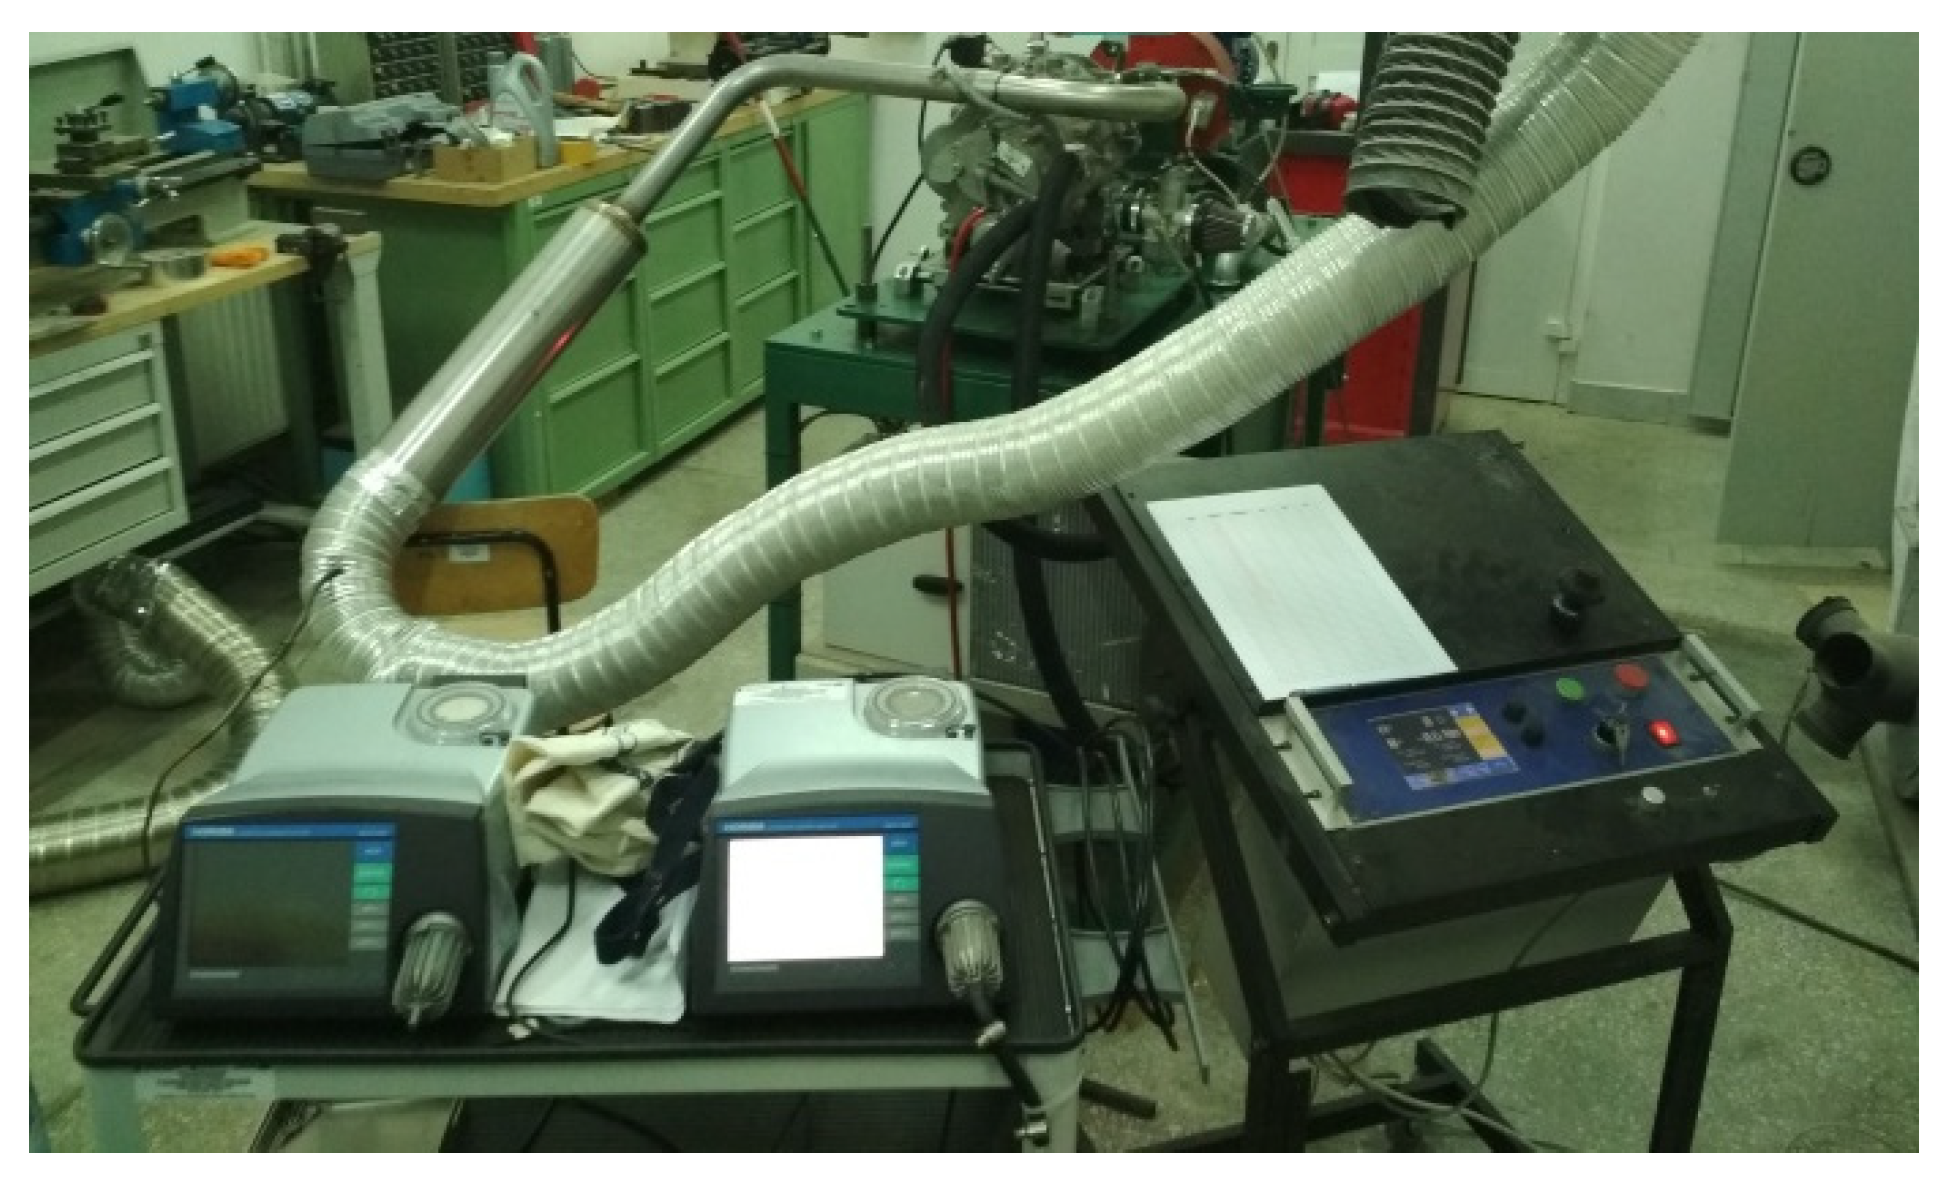
Figure 19 and Figure 20 present the test stand and sample readings during the measurements of pollutants present in the exhaust.
The performed measurements enabled to determine the emission characteristics of the exhaust components depending on the rotational speed of the reciprocating engine in the generator range (3500–4000 rpm). The measuring device showed the concentration of tested pollutants as a percentage in the exhaust gas control volume.
On the basis of the obtained results, the following calculations were made for CO, CO2, and NO:
(a)
The percentage concentrations of the emitted pollutants—Zpol [%] were converted to ppm (parts per million), where 1 ppm = 1 × 10⁻⁴%;
(b)
The emissions of the emitted pollutants—epol in [mg/m3 of exhausts] were calculated using the Formula (12), knowing the values of their molar mass and molar volume (presented in Table 6):
e pol = Z pol   ·   Mmol pol Vmol pol  
(c)
The exhaust density ρexh [kg/m3] was calculated using the equation of state (13), assuming the individual exhaust gas constant R = 289.2 J/(kg·K) [21], while the exhaust temperature T = 1220 K and exhaust pressure p = 1.15·105 Pa were based on the measurements and technical data of the engine [20];
ρ exh = p R · T  
(d)
Knowing that the mass of the fuel mfuel = 7 kg, the measured lambda number is 0.7, the theoretical amount of air needed for effective combustion of 1 kg of fuel is 14.7 kg, the exhaust mass mexh [kg] was calculated [24];
m exh = m fuel · λ · O T
(e)
dividing the exhausts mass by the exhausts density, the total exhausts volume Vexh [m3], emitted after the consumption of 7 kg of fuel was obtained using the Formula (15):
V exh = m exh ρ exh
The calculated exhaust parameters emitted on the entire route are shown in Table 7.
(f)
On the basis of the previously determined emission in [mg/m3] and the exhaust volume, the total mass of the emitted substances along the entire route was determined m_pol [mg], using the Formula (16):
m pol = e pol · V exh
(g)
in the next step, the obtained emission of the tested pollutants was converted into kilograms.
The obtained results of the calculations are summarized in Table 8.
Dividing the results from the last row of Table 7 by the range obtained for the traditional (266 km) and distributed (317 km) variants of the propulsion, the so-called road emissions (er) of a given pollutant, i.e., its mass per kilometer of covered distance was determined. The hourly fuel consumption (Ch), i.e., the mass of fuel per hour of flight, was also determined. The results are presented in Table 9.
Due to the use of distributed propulsion, both the emission and fuel consumption in the studied case were reduced by 16%.

4. Conclusions

The paper analyzes the impact of the application of distributed propulsion on ecological indicators in relation to an aircraft equipped with traditional propulsion. For distributed propulsion, after changing the propulsion configuration, the energy demand for flight was determined (the energy required for flight). On this basis, it was shown that the range and duration of the flight were extended in relation to the traditional propulsion variant—the initial one. The obtained data, combined with the laboratory tests of the Wankel 407 TGi engine, enabled that the determination the road emissions of pollutants emitted in the exhausts for the distributed propulsion variant. The obtained research results allow for the following conclusions:
(1)
Distributed propulsion enables the reduction of road emissions for the aircraft
For the AOS motor glider with distributed propulsion and with a hybrid–combustion energy source, due to the extension of the flight range and flight duration, the road emissions of CO, CO2, and NO present in the exhausts emitted during the flight were reduced. Although the total mass of the exhausts for both tested propulsions is the same, in the case of the distributed variant, it is related to the longer distance covered by the motor glider. According to Table 8, the decrease in road emissions for the selected substances was: ΔerCO = 0.004 kg/km, ΔerCO2 = 0.012 kg/km, ΔerNOx = 0.000005 kg/km, which constitutes a 16% difference in relation to the variant with traditional propulsion.
(2)
Distributed propulsion facilitates the use of modern and ecological energy sources
The distributed propulsion architecture, in which the marching motors are electric motors, facilitates the use of environmentally friendly energy sources. For aircraft equipped with this type of propulsion, the most advantageous application seems to be the purely electric propulsion with an energy source based on batteries. However, it should be noted that batteries have a low energy density (the ratio of the stored energy to the mass of the battery). Therefore, at present, when the concept of distributed propulsion in terms of design and aerodynamics is in the development phase, systems based on a series hybrid system can be successfully used as a source of energy. In such systems, the combustion engine and alternator generate the electricity used by electric marching motors that directly drive the propellers.
The use of apparatus and sensors in measuring the exhaust gas composition enables research on the influence of a given technical propulsion solution on the reduction of aircraft emissions during a flight.
The conducted research enabled the conclusion that the use of distributed propulsion can bring measurable benefits in the form of reduced negative environmental impact compared to traditional propulsion. Conducting further research on multi-criteria optimization of aircraft structure may bring further benefits in terms of improving the ecological and performance indicators of aircraft

Author Contributions

M.K.: Conceptualization, Data curation, Investigation, Formal analysis, Methodology, Writing. M.P.: Data curation, Methodology, Formal analysis, Writing. M.O.: Conceptualization, Formal analysis, Methodology Supervision, Writing. All authors have read and agreed to the published version of the manuscript.

Funding

This research and the APC was funded by Gdynia Maritime University, Grant No.WN/2022/PZ/14.

Institutional Review Board Statement

Not applicable.

Informed Consent Statement

Not applicable.

Data Availability Statement

Not applicable.

Conflicts of Interest

The authors declare no conflict of interest.

Abbreviations

B [m] wingspan
C [Ah], [As]battery capacity
Ch [kg/h]fuel consumption
CD [-]drag coefficient
CDm [-]mast drag coefficient
CDtotal [-]total drag coefficient of the entire aircraft
CL [-]lift coefficient
D [N]drag force
Eh [J] total energy stored in the hybrid power unit/energy stored onboard
EN [J]energy required for flight
Eflight [J] energy of flight
Estart [J] energy required for take-off
ed [kg/km]road emission
epol [mg/m3]emission of a pollutant
D [N]drag force
L [N]lift force
l [m]aircraft length
r [km]range
M [Nm]torque
Mconst [Nm]continuous torque
Mmolpol [g/mol]molar mass of a pollutant
mfuel [kg]fuel mass
mpol [mg], [kg] mass of a pollutant
mS [kg]engine mass
mexh [kg]exhaust mass
N [W]power
NN [W]power required for flight
NS [W] power generated by the combustion engine/power unit
Nconst [W]continuous power
Nmax [W]maximum power
OT [-]oxygen share in combustion
p [Pa]exhaust pressure
P [N]thrust
PN [N]force required for flight/thrust required for flight, on steady flight equal to drag force
PS [N]thrust of the power unit
r [m]flight range
R [J/(kg∙K)]individual gas constant
S [m2] wing area
SFC [kg/(W∙s)]specific fuel consumption
T [K]exhaust temperature
t [s]flight duration
ts [s] operating time of the combustion engine resulting from the fuel consumption by the engine per unit time
tST [s] operating time of start
tC [s] operating time of climbing
U [V]voltage
Ubat [V]battery voltage
V [m/s]aircraft velocity
Vexh [m3]exhaust volume
Vmolpol [dm3/mol]molar volume of a pollutant
Zpol [%], [ppm]concentration of a pollutant in the exhausts
ηS [-]power unit efficiency
ηg [-] generator efficiency corresponding to the efficiency of the electric motor
Λ [-]aspect ratio
λ [-]excess air coefficient
ρ [kg/m3]air density
ρexh [kg/m3]exhausts density

References

  1. Pawlak, M.; Kuźniar, M.; Majka, A.R. Determination of the flight trajectory in terms of emission and fuel consumption minimization. Proc. Inst. Mech. Eng. G J. Aerosp. Eng. 2021. [Google Scholar] [CrossRef]
  2. Orkisz, M.; Kuźniar, M. 3E—A new paradigm for the development of civil aviation. Combust. Engines 2020, 181, 3–10. [Google Scholar] [CrossRef]
  3. Doff-Sotta, M.; Cannon, M.; Bacic, M. Optimal energy management for hybrid electric aircraft. IFAC-Pap. 2020, 53, 6043–6049. [Google Scholar] [CrossRef]
  4. Burston, M.; Ranasinghea, K.; Gardia, A.; Parezanovićc, V.; Ajajc, R.; Sabatinic, R. Design principles and digital control of advanced distributed propulsion systems. Energy 2022, 241, 122788. [Google Scholar] [CrossRef]
  5. Brejle, B.; Martins, J. Electric, Hybrid, and Turboelectric Fixed-Wing Aircraft: A review of concepts, models, and design approaches. Aerosp. Sci. 2019, 104, 1–19. [Google Scholar] [CrossRef]
  6. Bojoi, R.; Boggero, H. Multiphase Drives for Hybrid-Electric Propulsion in Light Aircrafts: A Viable Solution. In Proceedings of the 2018 International Symposium on Power Electronics, Electrical Drives, Automation and Motion (SPEEDAM), Amalfi, Italy, 20–22 June 2018. [Google Scholar] [CrossRef]
  7. Donateo, T.; Spedicanto, L. Fuel Economy of Hybrid Electric Flight. Appl. Energy 2017, 206, 723–738. [Google Scholar] [CrossRef]
  8. Filippone, A. Flight Performance of Fixed and Rotary Wing Aircraft; Butterworth-Heinemann Elsevier: London, UK, 2016. [Google Scholar]
  9. Finger, D.F.; Braun, C.; Bil, C. A Review of Configuration Design for Distributed Propulsion Transitioning VTOL Aircraft. In Proceedings of the Asia-Pacific International Symposium on Aerospace Technology (APISAT2018), Chengdu, China, 16–18 October 2018. [Google Scholar]
  10. Liu, C.H.; Xiayi, S.I. Method to Explore the Design Space of a Turbo-Electric Distributed Propulsion System. J. Aerosp. Eng. 2016, 29, 04016027. [Google Scholar] [CrossRef]
  11. Stoll, A.M.; Bevirt, J.; Moore, M.D.; Fredericks, W.J.; Borer, N.K. Drag Reduction Through Distributed Electric Aviation Technology. In Proceedings of the Aviation Technology, Integration, and Operations Conference, Atlanta, GA, USA, 16–20 June 2014. [Google Scholar] [CrossRef] [Green Version]
  12. Stoll, A.; Bevirt, J.; Pei, P.; Stilson, E. Conceptual Design of the Joby S2 Electric VTOL PAV. In Proceedings of the Aviation Technology, Integration, and Operations Conference, Atlanta, GA, USA, 16–20 June 2014. [Google Scholar]
  13. Amoozgar, M.; Friswell, M.I.; Fazelzadeh, S.A.; Haddad Khodaparast, H.; Mazidi, A.; Cooper, J.E. Aeroelastic Stability Analysis of Electric Aircraft Wings with Distributed Electric Propulsors. Aerospace 2021, 8, 100. [Google Scholar] [CrossRef]
  14. Kuźniar, M.; Bednarz, A.; Orkisz, M. Numerical Analysis of the Influence of Distributed Propulsion System on the Increase of the Lift Force Coefficient. AIAA Propuls. Energy 2020, 3523. [Google Scholar] [CrossRef]
  15. Orkisz, M.; Wygonik, P.; Kuźniar, M.; Kalwara, M. Analysis of the possibility of using an engine with a rotating piston as the propulsion of an electric generator in application to a motor glider propulsion. Combust. Engines 2019, 178, 264–269. [Google Scholar] [CrossRef]
  16. Zhou, L.; He, Y.; Zhang, Q.; Zhang, L. Carbon Dioxide Sensor Module Based on NDIR Technology. Micromachines 2021, 12, 845. [Google Scholar] [CrossRef] [PubMed]
  17. SGX Sensortech (IS) Ltd Registered in England No. 08067077 A1A-Infrared_AN1 Issue 6, May 2007. Available online: https://www.sgxsensortech.com/content/uploads/2014/08/AN1-%E2%80%93-A-Background-to-Gas-Sensing-by-Non-Dispersive-Infrared-NDIR.pdf (accessed on 1 October 2022).
  18. Basic Principle of NDIR Gas Detection—Heimann Sensor. Available online: https://webcache.googleusercontent.com/search?q=cache:IfLh69xT2w8J:https://www.heimannsensor.com/NIDR-gas-detection&cd=1&hl=pl&ct=clnk&gl=pl (accessed on 1 October 2022).
  19. Frączek, W.; Tomasiewicz, J.; Marjanowski, I.J.; Czarnocki, P. AOS-H2 Motor Glider Technical Data Sheet; Technical Internal Report—Document No. AOS-H2/ADT /I/2015 (not published); Warsaw University of Technology: Warsaw, Poland, 2015. [Google Scholar]
  20. Available online: wankel-ag.de (accessed on 1 October 2022).
  21. Łucjanek, J.; Bukowski, W. Napęd Śmigłowy. Teoria i Konstrukcja (Proppeler Propulsion. Theory and Design); Wydawnictwo Ministerstwa Obrony Narodowej: Warsaw, Poland, 1986. (In Polish) [Google Scholar]
  22. ANSYS. Meshing User’s Guide; Ansys Inc.: Canonsburg, PA, USA, 2019. [Google Scholar]
  23. Tomasiewicz, J.; Frączek, W.; Czarnocki, P. Preliminary Aerodynamic Computations for Motor Glider AOS-H2; Technical Internal Report—Document No. AOS-H2/WOA/I/2015 (not published); Warsaw University of Technology: Warsaw, Poland, 2015. [Google Scholar]
  24. Wilk, J.; Szmusz, R.; Wolańczyk, F. Thermodynamics—Repertory (Termodynamika Repetytorium, in Polish); Publishing House of Rzeszow University of Technolog: Rzeszow, Poland, 2011. [Google Scholar]
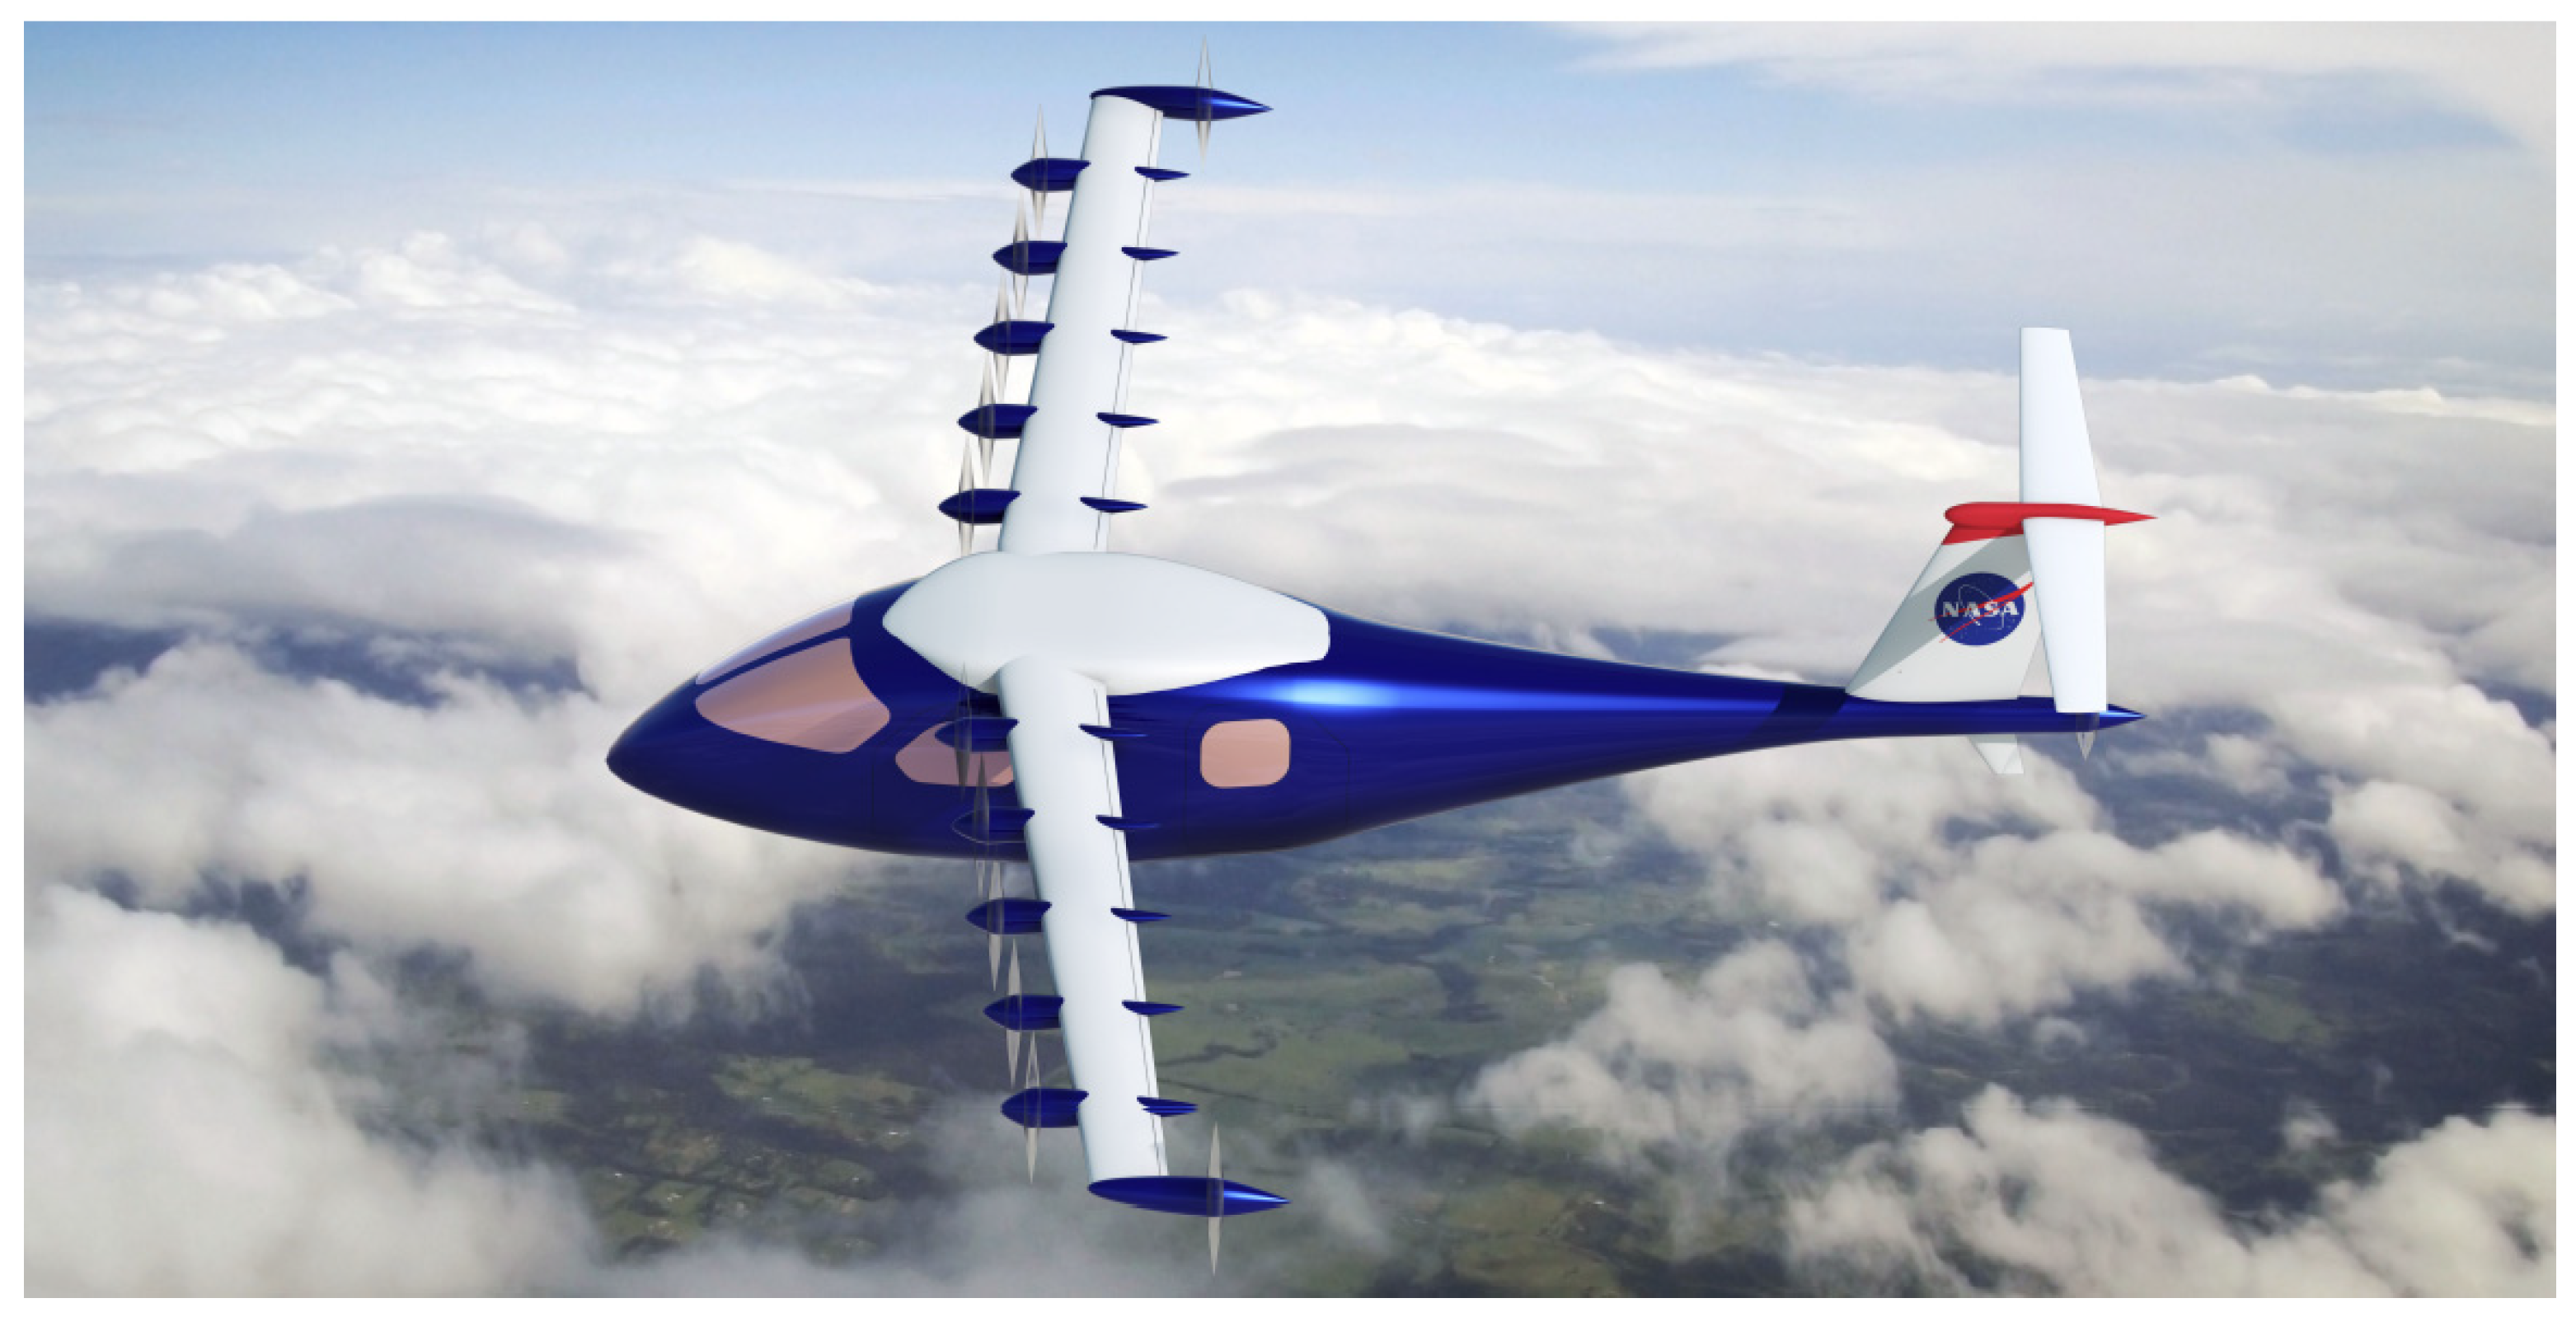
Figure 1. An early conceptualization of the LEAPTech aircraft, with ten leading edge-mounted propellers [11].
Sustainability 14 15076 g001
Figure 2. The AOS H2 motor glider.
Sustainability 14 15076 g002
Figure 3. The flight trajectory adopted for research.
Sustainability 14 15076 g003
Figure 4. Diagram of the hybrid propulsion system with a combustion engine for the AOS motor glider airframe: 1—battery, 2—fuel tank, 3—Emrax 188 motor working as an alternator, and 4—Wankel AG 407 TGi engine.
Sustainability 14 15076 g004
Figure 5. Dependence of power (N) and torque (M) of the Wankel 407 TGi engine on its rotational speed (n).
Sustainability 14 15076 g005
Figure 6. Test stand for determining the rotational characteristics: 1—Wankel 407 TGi engine, 2—eddy current brake, 3—clutch.
Sustainability 14 15076 g006
Figure 7. Characteristics of the engines Wankel 407TGi and Emrax 188 cooperation.
Sustainability 14 15076 g007
Figure 8. Visualization of AOS H2 airframe with distributed propulsion.
Sustainability 14 15076 g008
Figure 9. Initial propeller location relative to the wing leading edge.
Sustainability 14 15076 g009
Figure 10. Velocity distribution in the front view of the propeller.
Sustainability 14 15076 g010
Figure 11. Velocity distribution in the propeller stream.
Sustainability 14 15076 g011
Figure 12. Boundary conditions for the aerodynamic analysis of the wing, where V—flight velocity, VPR—propeller stream velocity.
Sustainability 14 15076 g012
Figure 13. Velocity distribution of air streams flowing around the wing: (a) with the influence of the distributed propulsion, (b) without the influence of the distributed propulsion.
Sustainability 14 15076 g013
Figure 14. Pressure distribution of air streams flowing around the wing: (a) with the influence of the distributed propulsion, (b) without the influence of the distributed propulsion.
Sustainability 14 15076 g014
Figure 15. Comparison of the change in the value of the lift coefficient (a) and the drag coefficient (b) after applying the distributed propulsion.
Sustainability 14 15076 g015
Figure 16. Modification of the airframe geometry resulting from the use of distributed propulsion.
Sustainability 14 15076 g016
Figure 17. Comparison of the flight range for the AOS aircraft for two types of propulsion (in both cases, the energy source is a hybrid power unit with a combustion generator).
Sustainability 14 15076 g017
Figure 18. Comparison of the flight duration for AOS aircraft for two types of propulsion (in both cases, the energy source is a hybrid power unit with a combustion generator).
Sustainability 14 15076 g018
Figure 19. View of the test stand for measuring the exhaust composition.
Sustainability 14 15076 g019
Figure 20. Sample data obtained during the measurement.
Sustainability 14 15076 g020
Table 1. Technical data of the AOS platform airframe [19].
Wing Area
S [m2]
Wingspan
B [m]
Aspect Ratio
Λ [-]
Aircraft Length
l [m]
15.816.4177.64
Table 2. Technical data of the AOS motor glider propulsion—hybrid combustion variant [15,20].
Combustion
Engine
Nmax
[kW]
mS
[kg]
Elecric MotorNconst
[kW]
Nmax
[kW]
Mconst
[Nm]
mS
[kg]
Battery Mass
[kg]
C
[Ah]
Ubat
[V]
Wankel AG 407 TGi3225Emrax 18830525076016355
Table 3. Comparison of the aerodynamic coefficients of the wing aerodynamic profiles for traditional and distributed propulsion.
Traditional PropulsionDistributed PropulsionΔ [%]
CD 0.0470.04955.3
CL 0.8260.8826.8
Table 4. Propeller performance parameters.
NN [W]PN [N]ηSNS [W]
Distributed propulsion variant
61102200.827451
Traditional propulsion variant
7200259.20.89000
Table 5. Comparison of mass parameters of traditional and distributed propulsion elements.
Traditional PropulsionDistributed Propulsion
SetMass [kg]SetMass [kg]
Emrax 268 motor1710 × AXI 812010 × 0.675
motor inverter710 × motor regulator10 × 0.2
electric installation7electric installation20
mast810 × motor mounts10 × 0.7
mast mounting2balancing system between the energy source and motor regulators10
propeller410 × propeller10 × 0.1
total mass45total mass45.75
Table 6. Physicochemical properties of the tested compounds.
SubstanceCOCO2NO
Molar mass Mmol pol [g/mol]28.0144.0130.01
Molar volume Vmol pol [dm3/mol]22.4022.2622.39
Table 7. Exhaust parameters.
mfuel [kg]mexh [kg]λ ρexh [kg/m3] Total Vexh [m3]
772.030.70.33218.273
Table 8. Emission results for an electric generator driven by a Wankel 407 TGi engine.
Pollutant Emitted in the ExhaustsCOCO2NO
Pollutant concentration Zpol [%]1.94.40.0028
Pollutant concentration Zpol [ppm]19,00044,00028
Pollutant emission epol [mg/m3]23,758.48286,991.91437.529
Mass of a pollutant emitted
on the entire route mpol [mg]
5,185,828.69318,987,962.268191.613
Mass of a pollutant emitted
on the entire route mpol [kg]
5.18618.9880.0082
Table 9. Road emissions and fuel consumption for both variants of the march propulsion.
erCO [kg/km]erCO2 [kg/km]erNO [kg/km]Ch [kg/h]
Traditional propulsion0.0200.0720.0000312.638
Distributed propulsion0.0160.0600.0000262.210
Δ [kg/km], [kg/h]0.0040.0120.0000050.428
Publisher’s Note: MDPI stays neutral with regard to jurisdictional claims in published maps and institutional affiliations.