Article

Comparative Life Cycle Assessment of the Manufacturing of Conventional and Innovative Aerators: A Case Study in China

1
Key Laboratory of Environment Controlled Aquaculture, Ministry of Education, Dalian Ocean University, 52 Heishijiao Street, Dalian 116023, China
2
College of Marine Technology and Environment, Dalian Ocean University, 52 Heishijiao Street, Dalian 116023, China
3
Key Laboratory of Industrial Ecology and Environmental Engineering (MOE), School of Environmental Science and Technology, Dalian University of Technology, Linggong Road 2, Dalian 116024, China
4
College of Biosystems Engineering and Food Science, Zhejiang University, 866 Yuhangtang Road, Hangzhou 310058, China
*
Author to whom correspondence should be addressed.
Sustainability 2022, 14(22), 15115; https://doi.org/10.3390/su142215115
Submission received: 20 September 2022 / Revised: 8 November 2022 / Accepted: 11 November 2022 / Published: 15 November 2022

Abstract

:
China aims to achieve a 50% rate of mechanization for aquaculture by 2025. Aerators are crucial mechanical equipment in aquaculture for increasing yield, but their manufacturing has an environmental impact. Improving the yield and controlling the environmental impacts of aerators in China is an important issue have to be considered, as is comparing the environmental impact of manufacturing innovative and conventional aerators. Herein, life cycle assessment (LCA) as a quantitative analysis method was used, and six models of three widely used aerators (impeller, paddle wheel, and wave) were selected as an example to compare the environmental impacts of conventional and innovative aerators from large-scale aerator manufacturing enterprises in Taizhou, China. The results showed that the conventional paddle wheel aerator (SC-1.5) had the largest environmental impact, while the innovative paddle wheel aerator (GSC-1.5) had the lowest environmental impact, reduced by 30%. In addition, the environmental impact of the innovative impeller aerator (SYL-1.5) and wave aerator (GYL-1.5) was less than that of the conventional impeller aerator (YL-1.5) wave aerator (SW-1.5), but only by 0.21% and 0.02%, respectively. Human toxic potential (HTP) made the largest contribution, and the manufacturing of copper wire was critical; the environmental impact was from 96.50% to 98.21% for all material inputs. The contributions of iron and stainless steel were 1.05–1.28% and 0.74–1.04%, respectively. Therefore, conductive materials with excellent environmental performance, such as carbon nanomaterials and nano copper wire, should replace copper wire in aerator manufacturing. The results expand aquaculture life cycle knowledge and could reduce the environmental impacts of aerator manufacturing in China.

1. Introduction

The two primary functions of aquaculture in China are food supply and food security and the aim to meet the demand for high-quality aquatic products. However, compared with agriculture and animal husbandry, the development of aquaculture mechanization in China started later, and manual production methods still dominate. In 2020, the mechanization rate of aquaculture in China was ~32%. Therefore, promoting mechanization is required to achieve the modernization of aquaculture in China.
In aquaculture, the concentration of dissolved oxygen (DO) is the most important factor for maintaining healthy aquatic life in ponds [1,2]. The aerators are the main pieces of mechanical equipment used in aquaculture, and they facilitate a high density and yield. The main role of aerators is to provide adequate oxygen for aquaculture products while also inhibiting the growth of anaerobic bacteria in pond water from preventing negative environmental impacts that would otherwise threaten fish survival. Therefore, the aerators are considered the lungs of aquaculture ponds with a high stocking density.
In 2019, there were 3.26 million aerators used in aquaculture in China, with a total power of 6.51 million kW [3]. The main types of aerators include the impeller, wave, and paddle wheel. Impeller aerators generate uniform DO in the upper and middle water flow areas, and they are suitable for large ponds and emergency oxygen supply treatment. Their disadvantages include a complex structure and high cost, and they are not for shallow aquaculture ponds. Wave aerators are mainly used to oxygenate water beneath winter ice in Northern China. These oxygenators are suitable for specific environments, but disadvantages include only local oxygenation, and they consume more energy than other types. The most important characteristic of paddle wheel aerators is their ability to generate directional water flow in breeding ponds while adding oxygen, stirring the water, and aerating. Advantages of paddle wheel aerators include low maintenance costs [4], and they are suitable for areas of l000–2500 m2 and shallow aquaculture ponds.
The main aquaculture mode in China is shallow ponds; therefore, the most widely used aerator type is the paddle wheel. Paddle wheel aerators are suitable for large ponds (>5000 m3), and they can maintain better water quality than other aerators [1,5]. Analysis of the effects of paddle wheel aeration on water quality in crawfish ponds showed that compared with ponds in which oxygen is not increased, the use of a paddle wheel aerator reduces the frequency of pond flushing and the occurrence of hypoxia [6]. Roy et al. [7] determined the oxygen penetration rate, oxygen efficiency, and oxygenation cost of impeller aerators at different speeds, and the results revealed reduced costs of oxygen generation and economic benefits for farmers.
Since entering the 21st century, aerator technologies have improved. Innovation in mechanical structure has increased the oxygen-increasing capacity, oxygen transfer efficiency [8], load area, and continuous oxygen supply of aerators [9], allowing them to meet the demands of increasing aquaculture density in China. In recent years, a new method in aquaculture aeration has been proposed [10], consisting of a paddle wheel aerator with a movable blade that opens upon entering the water and closes when leaving the water. The power consumption of movable blade paddle wheel aerators was compared with conventional (fixed blade) paddle wheel aerators [11]. Omofunmi et al. [12] examined the importance and functions of aeration and developed a cost-effective prototype paddle wheel aerator for small and medium-scale fish farmers in Nigeria.
Life cycle assessment (LCA) is a quantitative analysis method for evaluating the environmental impacts of products and services over their whole life cycle [13]. After years of development, the life cycle concept has been widely used in the field of industrial production to assess the environmental impact caused by industrial manufacturing processes and to support decision-making for enterprises and governments, hopefully, leading to environmental impact improvement measures. LCA has also been widely used to assess the environmental performance of aquatic product farming processes. Hou et al. [14] performed LCA on tiger puffer (Takifugu rubripes) farming in China and reported improved measures to reduce environmental impacts. Kallitsis et al. [15] performed LCA on Mediterranean sea bass (Dicentrarchus labrax) and sea bream (Sparus aurata) from a Greek producer. Hou et al. [16] performed LCA on sea cucumber (Stichopus japonicus) production to investigate the key environmental impact factors and stages. Turolla et al. [17] used LCA to prove that Manila clam (Ruditapes philippinarum) farming is a fully sustainable aquaculture practice.
Most comparative LCA studies have focused on comparing the environmental performance of different methods and different technologies for the same production. Cucinotta et al. [18] presented a cradle-to-grave comparative LCA of two sister cruise ferries with diesel and liquefied natural gas (LNG) machinery systems, and LNG performed better environmentally. Karapekmez and Dincer [19] used LCA to reveal which types of biomass can better replace fossil fuels by comparing both environmental impacts and systems performance. Chen et al. [20] analyzed and compared the life cycle environmental and economic performance of solar energy-integrated methanol production systems in China; the optimization measures and improvement strategies were obtained through scenario analysis. In research on mechanics, electricity generation by different wind turbine types was compared using LCA, revealing that environmental impacts are concentrated during the manufacturing of foundations, towers, and nacelles, and the main drivers were the use of copper and steel [21]. For manual and automatic equipment, Saidani et al. [22] aimed to quantify the environmental and economic sustainability of a robotic lawn mower in comparison with human-operated counterparts. Through LCA, environmental and economic trade-offs between autonomous and conventional mowing solutions were quantitatively explored. The approaches employed in these LCA studies could be applied to assess the environmental impact trade-offs of conventional and innovative aerator manufacturing. In 2019, to promote the mechanization development of aquaculture, China’s government issued a policy stating that the aquaculture mechanization rate should reach more than 50% by 2025. Therefore, as the main mechanical equipment in aquaculture, the yield of aerator production must be greatly increased, new technologies for aerator manufacturing are needed, and environmental impacts should not be ignored. Effectively controlling the environmental impacts and maintaining the stability of the ecological environment while increasing the yield of aerators in China is, therefore, an important issue.
Research on comparative LCA of aerator manufacturing has not been reported. Herein, based on the actual data for aerator manufacturing enterprises in China, LCA was employed to assess six models of the three most widely used aerator types (impeller, paddle wheel, and wave) in terms of the environmental impacts of conventional and innovative aerators. Differences in environmental impacts between conventional and innovative aerators were explored, including material replacement, shape design, and other factors. The results could improve the environmental performance of the aerator manufacturing processes in China and expand the life cycle of basic databases for aquaculture. Additionally, the findings provide a reference for other aquaculture equipment environmental impact analysis of other aquaculture equipment based on using LCA.

2. Materials and Methods

2.1. Goal and Scope Definition

The LCA method based on ISO 14040 and ISO 14044 [23,24] was used to evaluate the environmental impact of the aerator manufacturing process. The LCA was composed of four phases: goal and scope definition, inventory analysis, impact assessment, and interpretation. The goals of this study were to analyze the environmental impacts of the aerator manufacturing process and estimate the difference between conventional and innovative aerators. LCA results were used to identify potential avenues within these processes that could minimize the environmental impact of aerator manufacturing. Moreover, life cycle inventories were established to provide essential information to enrich aquaculture machinery life cycle inventory (LCI) databases and support aquaculture LCA research.
Zhejiang Fordy Machinery Co., Ltd., the large-scale commercial aerators manufacturing enterprise in Taizhou, China, was selected. The enterprise was founded in 1990 and has an annual output of 300,000 units of aquaculture machinery. Products of the enterprise are exported to 59 countries and regions, and the company was awarded the title of China’s national high-tech, agricultural science, and technology enterprise in Zhejiang province. In order to ensure data quality and accuracy, according to the investigation, the enterprise can produce 100 sets of different types of aerators on an average day; therefore, 100 sets of aerators were chosen as functional units in this study.

2.1.1. Description of the Aerator Manufacturing Process

The manufacturing process for aerators includes floating boat processing, electric motor processing, parts processing, and copper wire processing. In floating boat processing, the float boat, float ball, and waterproof layer covering electric motors were produced according to specifications. For electric motor processing, cutting and welding of stainless steel and production of electric motors and power lines were performed by mechanical equipment, and motor installation and copper wire winding were performed manually. Parts of the polyethylene (PE) impeller, polypropylene (PP) impeller, and stainless steel parts of the aerator were produced by mechanical equipment based on specifications in the parts processing workshop. Iron plate stainless steel, copper wire, PE, PP, and nylon (PA) were acquired from upstream suppliers. The whole manufacturing process only uses electricity to supply energy for production. Solid wastes were transported and treated by a specialized disposal agency with a transportation distance of 20 km, and gasoline was used in transport trucks that generated greenhouse gas emissions during transportation. The aerator’s manufacturing process is shown in Figure 1.

2.1.2. Comparison of Conventional and Innovative Aerators

Compared with the conventional impeller aerator (YL-1.5), under consistent aerobic capacity and power efficiency, the float boat shape of the innovative impeller aerator (SYL-1.5) was altered to reduce the amount of iron plate stainless steel and other raw materials used in the manufacturing process, as well as the electricity consumption. PP was used instead of PE to process the impeller. Compared with the conventional paddle wheel aerator (SC-1.5), the innovative paddle wheel aerator (GSC-1.5) had a greatly improved shape, and the assembly mode of the float was changed from a parallel to a cross type, reducing stainless steel iron plate and fixed PA, and other manufacturing support frame materials. PP wheels were used instead of PE wheels, increasing the number and changing the shape of the wheel to generate more oxygen in the farming process. Compared with the conventional wave aerator (SW-1.5), the innovational wave wheel aerator (GYL-1.5) improves the shape of the float and uses PP to replace the conventional PE float to reduce the weight of the aerator and increase oxygen capacity while maintaining the same power efficiency.

2.2. Inventory Analysis

Inventory analysis is needed to collect data on material inputs, energy consumption, and pollutant emission outputs for each stage in the aerator manufacturing process. Through enterprise investigation, literature review, and database research, the LCI was determined for the six models of the three types of aerator manufacturing processes (Table 1). The manufacturing data for iron copper wire, stainless steel, PE, PP, PA, electricity, and diesel were obtained from the GaBi professional database 2021. The amounts of electricity, iron copper wire, stainless steel, PE, PP, and PA in the aerator manufacturing process were obtained from enterprise annual statistical reports. PP was only used in the manufacturing process of four types of aerators (SYL-1.5, SC-1.5, GSC-1.5, and GYL-1.5). PA was only used in the manufacturing process of SC-1.5. GSC-1.5 did not use stainless steel as the frame structure material and instead used more PP. Data on haul distance and diesel consumption during transportation were collected from transport company records. The emission output results of CO2, SO2, and NOX were calculated from the Ecoinvent 3.7 database.

2.3. Impact Assessment

Impact assessment is the key step in LCA. In this step, optional evaluation methods include characterization, normalization, and weighting. Normalization is an intuitive reflection of the environmental impact potential value for each category, which can help to reveal the relative magnitude of each category and identify and quantify the environmental impact of different systems and stages. The formulae for the characterization (Equation (1)) and normalization (Equation (2)) steps of LCA were as follows:
Characterization   results = i m i × Characterization   factor  
where m i represents the quantification results of the input or output of the i th substance within the system boundary (e.g., pollutant emission, resource and energy consumption, resource and energy exploitation, land use, etc.)
Normalization   results = Characterization   results Normalization   reference   value
In order to compare the environmental impact of conventional and innovative aerator manufacturing processes, the LCA steps were normalized. The normalization results were used to collate the environmental impact results into different aerators and impact categories and analyze the main environmental issues and opportunities to prevent pollution. The normalization results for different impact categories can be summed since they are equally weighted, and environmental decision measures can be met. GaBi 10.5 academy version LCA software and the CML-IA-Aug 2016-world method were used in this study. The main research objects of this method were energy consumption, pollution output, and ecological damage. The principle was based on the characterization and normalization analysis of traditional LCI, which is suitable for the LCA of the aerator manufacturing process.
The following 11 LCA impact categories were used in the assessment: abiotic depletion potential (elements; ADPe), abiotic depletion potential (fossil; ADPf), acidification potential (AP), eutrophication potential (EP), freshwater aquatic ecotoxicity potential (FAETP), global warming potential (GWP), human toxicity potential (HTP), marine aquatic ecotoxicity potential (MAETP), ozone layer depletion potential (ODP), photochemical ozone creation potential (POCP), and terrestrial ecotoxicity potential (TETP).

3. Results

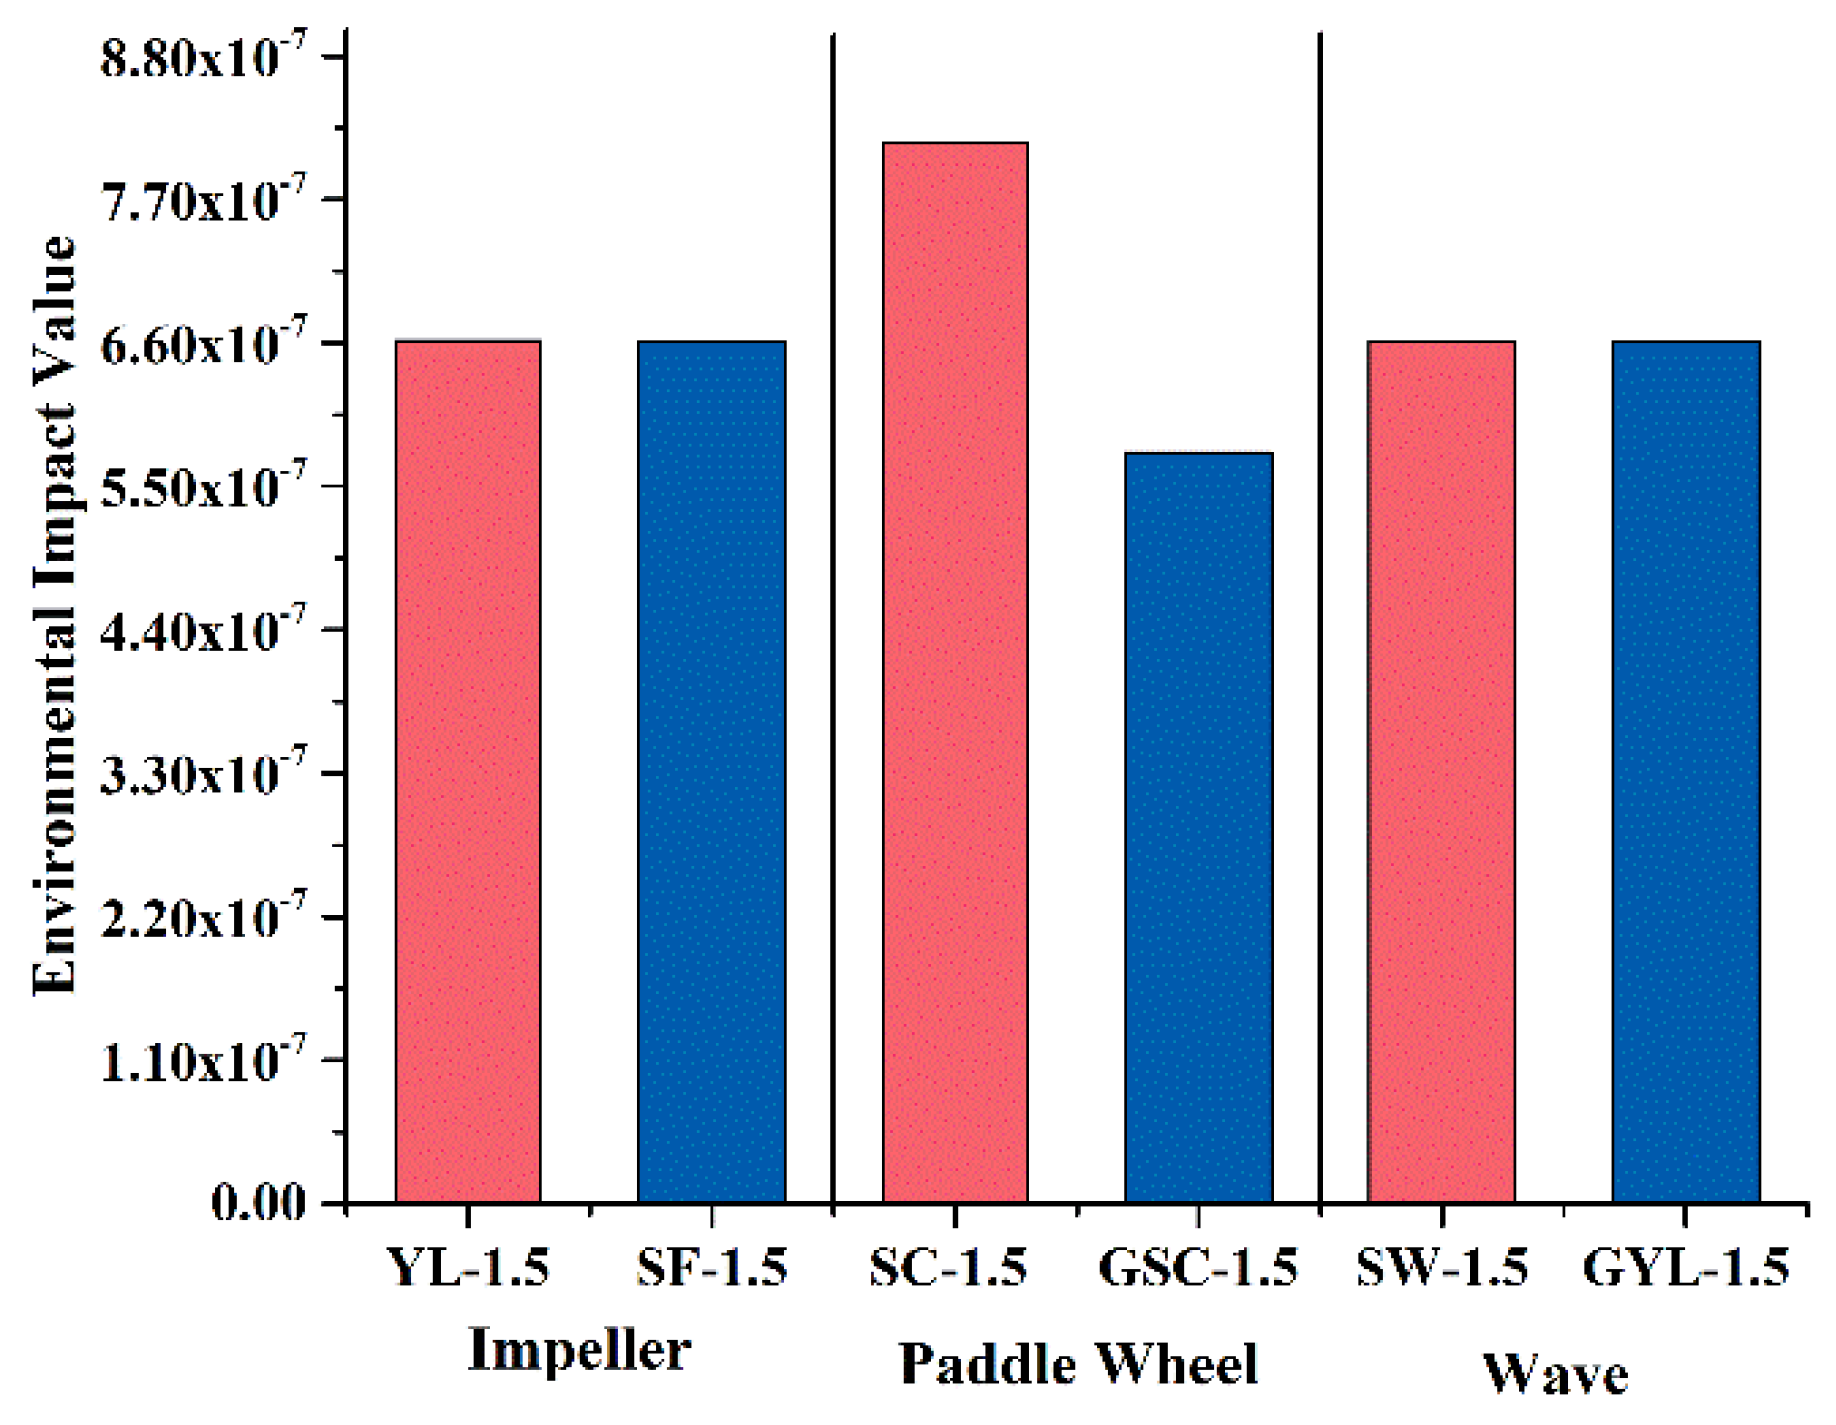
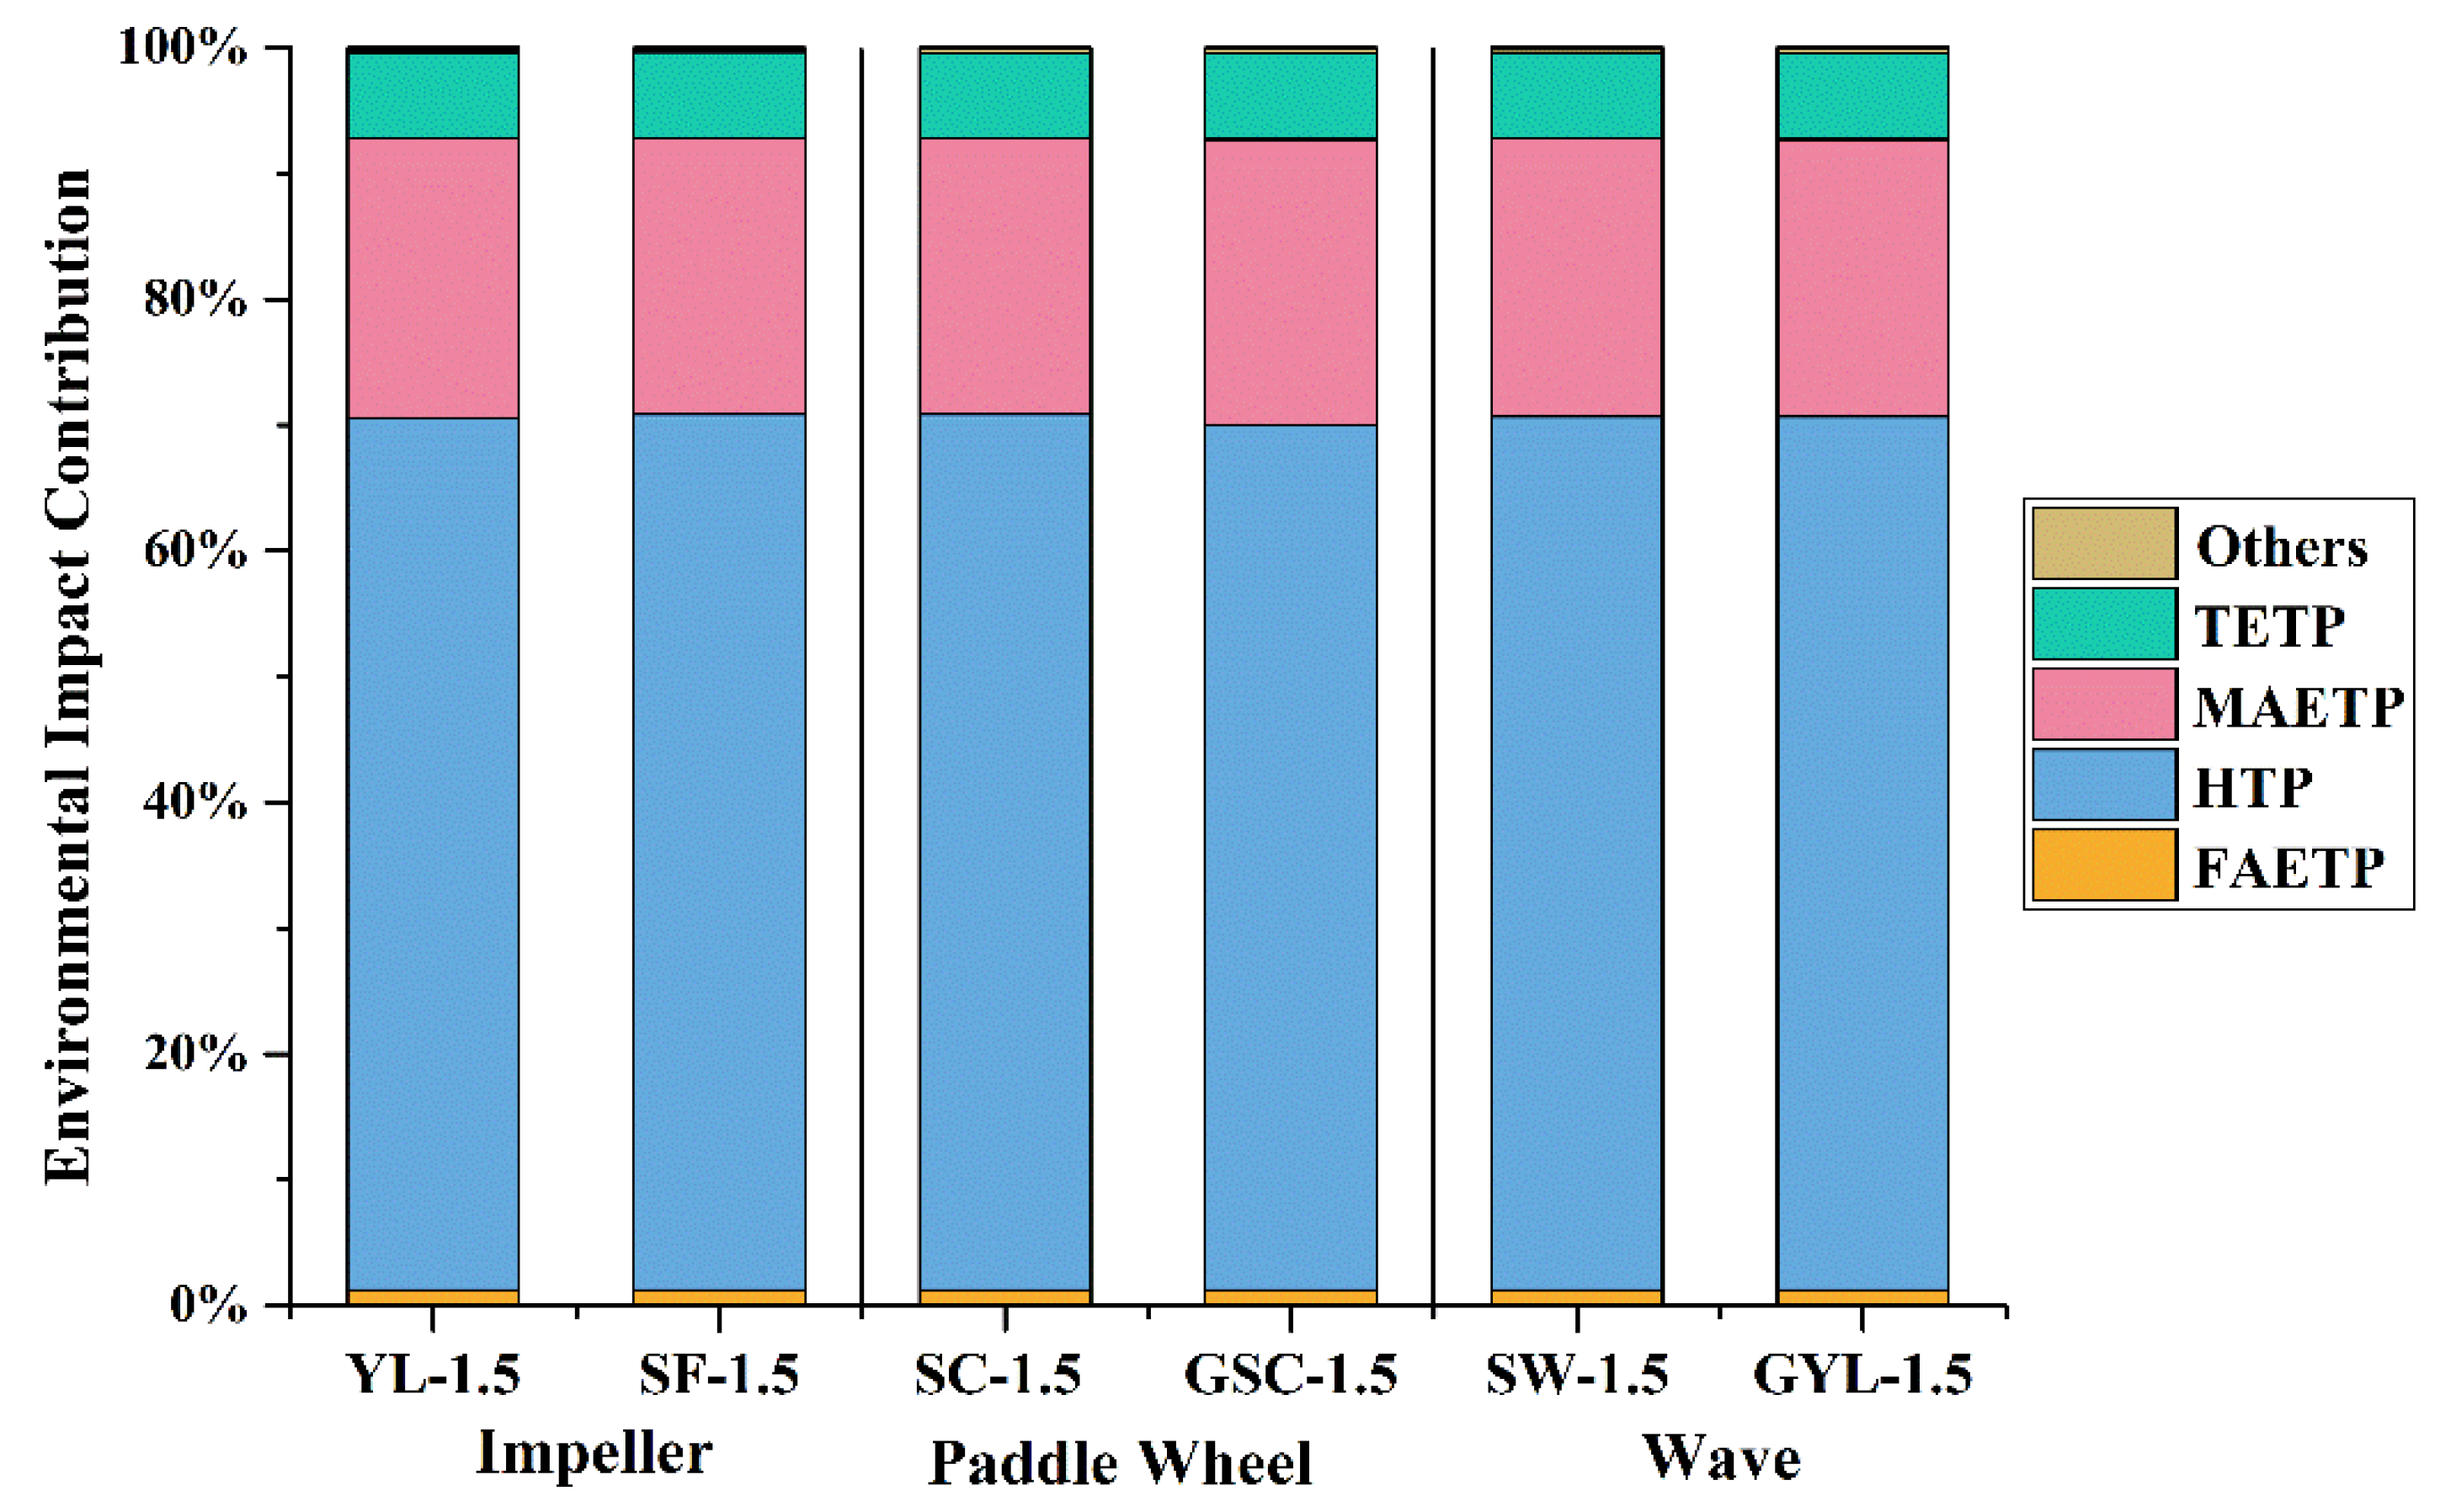
3.1. Normalization Results for the Six Models of the Three Types of Aerator Manufacturing Processes

Normalization results were calculated to analyze the environmental impacts and rank the contributions of the models of the different types of aerator manufacturing processes (Table 2).
The life cycle normalization results for the six models of the three types of aerator manufacturing processes are shown in Figure 2. Compared with SC-1.5, GSC-1.5 used less copper wire and stainless steel, and the environmentally friendly material PP was employed to make the paddle wheel instead of PE. Material technological innovations have led to significant changes in environmental impacts. According to the assessment results, the conventional paddle wheel aerator (SC-1.5) had the greatest environmental impact, while the innovative paddle wheel aerator (GSC-1.5) had the lowest environmental impact, reduced by 30%. In addition, the environmental impact of the innovative impeller aerator (SYL-1.5) was less than that of the conventional impeller aerator (YL-1.5), and that of the innovative wave aerator (GYL-1.5) was less than that of the conventional wave aerator (SW-1.5), but only by 0.21% and 0.02%, respectively. Obviously, the differences in environmental impact between these four models of aerator manufacturing processes were small because changing the shape of the float does not influence the environmental impact significantly.
However, the number of aerators in China reached 3.26 million units in 2019, and with the intervention of the aquaculture mechanization policy, this number will increase in the future, especially for paddle wheel aerators. Therefore, against the backdrop of a large yield, small differences in environmental impacts will be amplified. Technological innovation can effectively reduce the environmental impacts of the aerator manufacturing process to a certain extent, and innovative aerators have environmental performance advantages that can help aquaculture achieve mechanization sustainability goals.
In order to further investigate the environmental impacts of the six models of the three types of aerator manufacturing processes, based on the normalization results, TETP, MAETP, HTP, and FAETP impact categories were selected, all closely related to energy use, human health, and ecosystems, and another seven environmental impact categories were integrated as ‘others’. Based on life cycle normalization results, HTP and MAETP could be found to be the environmental categories with the highest impact contributions (Figure 3). The results showed that the largest environmental impact category was HTP, accounting for 68.71–69.64% of the total environmental impact of the six models of the aerators. The key factor causing the environmental impact of HTP was the copper wire manufacturing process. Sulphuric acid and alkali liquor were used, and Cu2−, total chromium, and Cr6+ were discharged with wastewater during copper wire manufacturing. MAETP accounted for 21.90–22.73% of the total environmental impacts of the six models’ aerator manufacturing process; consumption of fossil energy and electricity in the process of copper wire manufacturing, stainless steel plate manufacturing, and aerator processing are the main factors causing the large impact of MAETP.
The input of raw materials plays a decisive role in the environmental performance of the aerator manufacturing process. The environmental impact contributions of material inputs for the six models of the three types of aerator manufacturing processes were analyzed. Iron, copper wire, stainless steel, PE, PP, and PA were the main material inputs in this study, and the environmental impact contributions are shown in Table 3.
Copper wire made a decisive environmental impact contribution in the six aerator manufacturing processes, and the results were 96.50–98.21% for all material inputs. Moreover, the contributions of iron and stainless steel were from 1.05 to 1.28% and 0.74 to 1.04%, respectively. Therefore, future improvement measures to reduce the environmental impacts should mainly focus on changing raw material types in the aerator manufacturing process. In this study, the GSC-1.5 aerator used PP to completely replace stainless steel to make the aerator frame structure, and this improvement strategy and material substitution should be applied to other types and all future innovative aerator manufacturing processes.

3.2. Uncertainty Analysis

Uncertainty analysis of data quality for LCA is an important aspect for decision makers to judge differences in product or process choices [25,26]. One study [27] showed that the Monte Carlo method could quantify variability and uncertainty using a probability distribution, which can reveal the impact of uncertainty. Therefore, Monte Carlo simulation was used to evaluate the influence of uncertainty in the present study. There were 1000 such rankings, and 95% confidence intervals were calculated. The simulation results showed that variation in the uncertainty range was narrow close, and the overall ranking of each type of aerator was similar (Table 4).

4. Discussion

The LCA results of the aerator manufacturing process showed that the usage of copper wire was the most critical environmental factor making the largest contribution to HTP, while the consumption of fossil energy and electricity in the process of copper wire manufacturing, stainless steel plate manufacturing, and aerator processing influenced the environmental impact contributions to MAETP. In addition, a comparison of conventional and innovative aerators showed that changing the shape of the float did not influence the environmental impact significantly. Therefore, the measures to improve the environmental impact of aerator manufacturing should focus on the reduction and innovation of copper wire.
The manufacturing and terminal disposal processes for copper wire release toxic organic pollutants, polluting the surrounding soil, groundwater, and ecosystems [28]. Currently, most transmission lines use aluminum wire, and aluminum resources are abundant on the earth and have lower smelting costs and lower density; hence, an aluminum wire would be a more environmentally friendly material for aerators than copper wire [29]. In addition, emerging transparent conductive nanomaterials with unique properties have been discovered [30]. These materials include carbon nanotubes (CNTs), graphene, and metal nanostructures, all of which could replace the copper wire. These new materials have lower material and production costs and lower environmental impacts and may provide a source of environmentally friendly conductive materials.
Solar energy is clean and renewable and widely used to alleviate global environmental problems because it does not generate greenhouse gases or hazardous waste. Solar photovoltaic systems have a huge advantage in remote areas far from the electricity grid. Applebaum et al. [31] demonstrated the performance of a solar power paddle wheel aerator system for fish ponds in Israel, and Tanveer et al. [32] proved the feasibility of a photovoltaic solar oxygenation system for fish pond farming. The adaptability of solar photovoltaic oxygenation systems has a direct effect on the improvement of fishery production, as well as environmental performance; hence, solar photovoltaic is the best energy source for fish pond aerators. Therefore, the design of innovative aerators should focus on the improvement of energy types, and it is particularly important to manufacture aerators that utilize solar energy to replace grid electricity and diesel energy.
China is actively promoting mechanization in aquaculture, especially pond farming. The mechanical equipment applied in pond farming includes feeders, wastewater treatment systems, and aerators, all of which will benefit from new designs and innovations to meet market demand for mechanical equipment. Therefore, the environmental impacts of aquaculture mechanical equipment manufacturing processes should be studied using LCA to provide a reference for yield improvement and environmental impact trade-offs. The present study mainly focused on the environmental impacts of aerator manufacturing processes. In future research, comparative LCA should be performed on the aeration efficiency, energy consumption, and economic benefits of the six aerator manufacturing process models under aquaculture conditions.

5. Conclusions

To the best of our knowledge, this is the first LCA of the environmental impacts of aerator manufacturing processes. Six models of three types of aerators (impeller, paddle wheel, and wave) manufacturing processes were used to compare the LCI of conventional and innovative aerators from a large aerator manufacturing enterprise in Taizhou, China. The results showed that the conventional paddle wheel aerator (SC-1.5) had the largest environmental impact, while the innovative paddle wheel aerator (GSC-1.5) had the lowest environmental impact, reduced by 30%. HTP was the category that made the greatest contribution to environmental impacts, and usage of copper wire was the most critical factor affecting the environmental impact results, which ranged from 96.50% to 98.21% for all material inputs, and the contributions of iron and stainless steel were 1.05–1.28% and 0.74–1.04%, respectively. Therefore, conductive materials with excellent environmental performance should be selected to replace copper wire in aerator manufacturing processes, such as CNTs and nano copper wire. In future research, comparative LCA of aeration efficiency, energy consumption, and economic benefits for the six model aerators should be performed under aquaculture conditions. In addition, further LCA should be performed on different categories of aerators and other aquaculture mechanical equipment manufacturing processes to gain new insight, enrich aquaculture LCI databases, and provide a reference for yield improvement and environmental impact trade-offs of aquaculture mechanical equipment manufacturers in China.

Author Contributions

H.H.: Conceptualization, Investigation, Writing—Original Draft, Funding acquisition. H.W.: Writing—Original Draft. A.R.: Writing—Review and Editing Y.Z.: Writing—Review and Editing. Y.L.: Conceptualization, Supervision, Writing—Review and Editing. All authors have read and agreed to the published version of the manuscript.

Funding

This work was supported by grants from the Innovation Support Program for High-level Talents of Dalian City [grant number 2020RQ0111], Project of Youth Foundation of the Department of Education of Liaoning Province [grant number LJKQZ2021123], and the Project of Talents and Ph.D. Initiation Program in Dalian Ocean University [grant number 500221201035].

Institutional Review Board Statement

Not applicable.

Informed Consent Statement

This manuscript does not report on or involve the use of any animal or human data or tissues, and therefore ethics problems are not applicable.

Data Availability Statement

Not applicable.

Acknowledgments

We are grateful to manager Weiguo Wu and mechanical engineer Yonglin Liang (Zhejiang Fordy Co. Ltd.) for their assistance with data collection and management.

Conflicts of Interest

The authors declare no conflict of interest.

References

  1. Cancino, B.; Roth, P.; Reuß, M. Design of high efficiency surface aerators: Part 1. Development of new rotors for surface aerators. Aquacult. Eng. 2004, 31, 83–98. [Google Scholar] [CrossRef]
  2. Baylar, A.; Emiroglu, M.E.; Bagatur, T. An experimental investigation of aeration performance in stepped spillways. Water Environ. J. 2006, 20, 35–42. [Google Scholar] [CrossRef]
  3. China Association of Agricultural Machinery Manufacturers (CAAMM). China Agricultural Machinery Industry Yearbook, 1st ed.; China Agricultural Machinery Industry Yearbook Publisher: Beijing, China, 2020. [Google Scholar]
  4. Kumar, A.; Moulick, S.; Mal, B.C. Selection of aerators for intensive aquacultural pond. Aquacult. Eng. 2013, 56, 71–78. [Google Scholar] [CrossRef]
  5. Pfeiffer, T.J.; Lawson, T.B.; Church, G.E. Engineering considerations for water circulation in crawfish ponds with paddlewheel aerators. Aquacult. Eng. 2007, 36, 239–249. [Google Scholar] [CrossRef]
  6. Romaire, R.P.; Merry, G.E. Effects of paddle wheel aeration on water quality in crawfish ponds. J. Appl. Aquac. 2007, 19, 61–75. [Google Scholar] [CrossRef]
  7. Roy, S.M.; Moulick, S.; Mukherjee, C.K.; Mal, B.C. Effect of rotational speeds of paddle wheel aerator on aeration cost. Am. Res. Thoughts 2015, 2, 3069–3087. [Google Scholar] [CrossRef]
  8. Moulick, S.; Mal, B.C.; Bandyopadhyay, S. Prediction of aeration performance of paddle wheel aerators. Aquac. Eng. 2002, 25, 217–237. [Google Scholar] [CrossRef]
  9. Moulick, S.; Bandyopadhyay, S.; Mal, B.C. Design characteristics of single hub paddle wheel aerator. J. Environ. Eng. 2005, 131, 1147–1154. [Google Scholar] [CrossRef]
  10. Bahri, S.; Setiawan, R.P.A.; Hermawan, W.; Junior, M.Z. Design and Simulation of Paddle Wheel Aerator with Movable Blades. Int. J. Eng. Sci. 2015, 6, 812–816. [Google Scholar]
  11. Bahri, S.; Setiawan, R.P.A.; Hermawan, W.; Junior, M.Z. The Power Consumption of Paddlewheel Aerator with Moveable Blades. In Proceedings of the ICESReD, Banda Aceh, Indonesia, 25–26 October 2016; pp. 161–166. [Google Scholar]
  12. Omofunmi, O.E.; Adewumi, J.K.; Adisa, A.F.; Alegbeleye, S.O. Development of a paddle wheel aerator for small and medium fish farmers in Nigeria. AMA AGR Mech. Asia AF. 2017, 48, 22–26. [Google Scholar]
  13. Hellweg, S.; Canals, L.M. Emerging approaches, challenges and opportunities in life cycle assessment. Science 2014, 344, 1109–1113. [Google Scholar] [CrossRef] [PubMed]
  14. Hou, H.H.; Zhang, Y.; Ma, Z.; Wang, X.L.; Su, P.; Wang, H.H.; Liu, Y. Life cycle assessment of tiger puffer (Takifugu rubripes) farming: A case study in Dalian, China. Sci. Total Environ. 2022, 823, 153522. [Google Scholar] [CrossRef] [PubMed]
  15. Kallitsis, E.; Korre, A.; Mousamas, D.; Avramidis, P. Environmental Life Cycle Assessment of Mediterranean Sea Bass and Sea Bream. Sustainability 2020, 12, 9617. [Google Scholar] [CrossRef]
  16. Hou, H.C.; Shao, S.; Zhang, Y.; Kang, H.; Qin, C.L.; Sun, X.Y.; Zhang, S.S. Life cycle assessment of sea cucumber production: A case study, China. J. Clean. Prod. 2019, 213, 158–164. [Google Scholar] [CrossRef]
  17. Turolla, E.; Castaldelli, G.; Fano, E.A.; Tamburini, E. Life Cycle Assessment (LCA) Proves that Manila Clam Farming (Ruditapes philippinarum) is a Fully Sustainable Aquaculture Practice and a Carbon Sink. Sustainability 2020, 12, 5252. [Google Scholar] [CrossRef]
  18. Cucinotta, F.; Raffaele, M.; Salmeri, F.; Sfravara, F. A comparative Life Cycle Assessment of two sister cruise ferries with Diesel and Liquefied Natural Gas machinery systems. Appl. Ocean Res. 2021, 122, 102705. [Google Scholar] [CrossRef]
  19. Karapekmez, A.; Dincer, I. Comparative efficiency and environmental impact assessments of a solar assisted combined cycle with various fuels. Appl. Therm. Eng. 2020, 164, 114409. [Google Scholar] [CrossRef]
  20. Chen, Q.Q.; Gu, Y.; Tang, Z.Y.; Sun, Y.H. Comparative environmental and economic performance of solar energy integrated methanol production systems in China. Energy Convers. Manag. 2019, 187, 63–75. [Google Scholar] [CrossRef]
  21. Schreiber, A.; Marx, J.; Zapp, P. Comparative life cycle assessment of electricity generation by different wind turbine types. J. Clean. Prod. 2019, 233, 561–572. [Google Scholar] [CrossRef]
  22. Saidani, M.; Pan, Z.H.; Kim, H.; Wattonville, J.; Greenlee, A.; Shannon, T.; Yannou, B.; Leroy, Y.; Cluzel, F. Comparative life cycle assessment and costing of an autonomous lawn mowing system with human-operated alternatives: Implication for sustainable design improvements. Int. J. Sustain. Eng. 2021, 14, 704–724. [Google Scholar] [CrossRef]
  23. ISO 14040:2006; ISO, Environmental management—Life cycle assessment—Principles and framework. International Organization for Standardization (ISO): Geneva, Switzerland, 2006.
  24. ISO 14044:2006; ISO, Environmental management—Life cycle assessment—Requirements and guidelines. International Organization for Standardization (ISO): Geneva, Switzerland, 2006.
  25. Maurice, B.; Frischknecht, R.; Coelho-Schwirtz, V.; Hungerbuhler, K. Uncertainty analysis in life cycle inventory. Application to the production of electricity with French coal power plants. J. Clean. Prod. 2000, 8, 95–108. [Google Scholar] [CrossRef]
  26. Salemdeeb, R.; Saint, R.; Clark, W.; Lenaghan, M.; Pratt, K. A pragmatic and industry-oriented framework for data quality assessment of environmental footprint tools. Resour. Environ. Sustain. 2021, 3, 100019. [Google Scholar] [CrossRef]
  27. Hung, M.L.; Ma, H.W. Quantifying system uncertainty of life cycle assessment based on Monte Carlo simulation. Int. J. Life Cycle Assess 2009, 14, 19–27. [Google Scholar] [CrossRef]
  28. Shrivastava, A.K. A Review on Copper Pollution and its Removal from Water Bodies by Pollution Control Technologies. Indian J. Environ. Prot. 2009, 29, 552–560. [Google Scholar]
  29. Nie, Z.Q.; Zheng, M.H.; Liu, G.R.; Liu, W.B.; Lv, P.; Zhang, B.; Su, G.J.; Gao, L.R.; Xiao, K. A preliminary investigation of unintentional POP emissions from thermal wire reclamation at industrial scrap metal recycling parks in China. J. Hazard. Mater. 2012, 215–216, 259–265. [Google Scholar] [CrossRef]
  30. Hecht, D.S.; Hu, L.B.; Irvin, G. Emerging Transparent Electrodes Based on Thin Films of Carbon Nanotubes, Graphene, and Metallic Nanostructures. Adv. Mater. 2011, 23, 1482–1513. [Google Scholar] [CrossRef]
  31. Applebaum, J.; Mozes, D.; Steiner, A.; Segal, I.; Barak, M.; Reuss, M.; Roth, P. Aeration of fishponds by photovoltaic power. Prog. Photovolt. Res. Appl. 2001, 9, 295–301. [Google Scholar] [CrossRef]
  32. Tanveer, M.; Roy, S.M.; Vikneswaran, M.; Renganathan, P.; Balasubramanian, S. Surface aeration systems for application in aquaculture: A review. Int. J. Fisher. Aqua. Stud. 2018, 6, 342–347. Available online: https://www.researchgate.net/publication/333263246 (accessed on 12 September 2022).
Figure 1. Schematic diagram of the aerator’s manufacturing process.
Sustainability 14 15115 g001
Figure 2. Life cycle normalization results for the six models of the three types of aerator manufacturing processes.
Sustainability 14 15115 g002
Figure 3. Environmental impact contributions of the three types six models of the three types of aerators manufacturing processes.
Sustainability 14 15115 g003
Table 1. Life cycle inventory for six models of three types of aerator manufacturing processes (100 sets).
Object/CategoriesUnitsImpeller AeratorsPaddle Wheel AeratorsWave Aerators
YL-1.5SYL-1.5SC-1.5GSC-1.5SW-1.5GYL-1.5
Ironkg364028003600300028502850
Copper wire kg230023002800200023002300
Stainless steel kg132090364/122122
Polyethylene kg12502502400140025001750
Polypropylene kg/10010007200/800
Nylon kg//1600///
Electricity KWh200014003500500020001500
Diesel kg0.540.420.540.450.430.43
Transportationkm202020202020
CO2 kg1.240.971.241.040.990.99
NOX kg0.0040.0030.0040.0030.0030.003
SO2 kg0.0050.0040.0050.0040.0040.004
Table 2. Normalization results for the six models of the three types of aerator manufacturing processes (100 sets).
Categories/TypesImpellerPaddle WheelWave
YL-1.5SF-1.5SC-1.5GSC-1.5SW-1.5GYL-1.5
ADPe1.31 × 10−91.32 × 10−91.67 × 10−91.11 × 10−91.31 × 10−91.32 × 10⁻⁹
ADPf6.11 × 10−104.63 × 10−101.27 × 10−98.16 × 10−106.96 × 10−107.74 × 10⁻¹⁰
AP1.38 × 10−101.18 × 10−102.72 × 10−101.88 × 10−101.41 × 10−101.40 × 10⁻¹⁰
EP2.20 × 10−111.81 × 10−113.98 × 10−112.77 × 10−112.19 × 10−112.24 × 10⁻¹¹
FAETP8.29 × 10−98.26 × 10−91.02 × 10−87.23 × 10−98.30 × 10−98.32 × 10⁻⁹
GWP3.54 × 10−102.80 × 10−106.33 × 10−104.35 × 10−103.57 × 10−103.75 × 10⁻¹⁰
HTP4.59 × 10−74.60 × 10−75.67 × 10−73.96 × 10−74.59 × 10−74.59 × 10⁻⁷
MAETP1.47 × 10−71.45 × 10−71.83 × 10−71.31 × 10−71.46 × 10−71.46 × 10⁻⁷
ODP2.16 × 10−162.16 × 10−162.63 × 10−161.88 × 10−162.16 × 10−162.16 × 10⁻¹⁶
POCP8.42 × 10−116.74 × 10−111.85 × 10−101.27 × 10−109.32 × 10−119.64 × 10⁻¹¹
TETP4.53 × 10−84.52 × 10−85.51 × 10−83.94 × 10−84.53 × 10−84.53 × 10⁻⁸
TOTAL6.62 × 10−76.61 × 10−78.19 × 10−75.76 × 10−76.61 × 10−76.61 × 10⁻⁷
Table 3. Material input environmental impact contributions of the six models of the three types of aerator manufacturing processes (100 sets).
Materials/InputsImpellerPaddle WheelWave
YL-1.5SF-1.5SC-1.5GSC-1.5SW-1.5GYL-1.5
polyethylene0.30%0.17%0.47%0.39%0.42%0.53%
Iron1.34%1.09%1.08%1.28%1.05%1.05%
Copper wire97.56%97.68%96.50%98.21%97.77%97.68%
Stainless steel0.80%1.04%1.80%/0.74%0.74%
polypropylene/0.03%0.12%0.13%0.01%/
Nylon//0.03%///
Table 4. Monte Carlo simulation results for the six models of the three types of aerator manufacturing processes (100 sets).
TypesModelsNormalization
Results (yr)
Monte Carlo Simulation Results
Confidence Interval 95% (yr)Mean (yr)SD (yr)
ImpellerYL-1.56.62 × 10−76.52 × 10⁻⁷–6.70 × 10−76.62 × 10−76.56 × 10⁻⁹
SF-1.56.60 × 10−76.50 × 10⁻⁷–6.69 × 10−76.60 × 10−76.70 × 10⁻⁹
Paddle WheelSC-1.58.13 × 10−78.02 × 10⁻⁷–8.24 × 10−78.13 × 10−78.39 × 10⁻⁹
GSC-1.55.76 × 10−75.67 × 10⁻⁷–5.84 × 10−75.76 × 10−75.88 × 10⁻⁹
WaveSW-1.56.61 × 10−76.52 × 10⁻⁷–6.70 × 10−76.61 × 10−76.58 × 10⁻⁹
GYL-1.56.61 × 10−76.52 × 10⁻⁷–6.70 × 10−76.61 × 10−76.69 × 10⁻⁹
Publisher’s Note: MDPI stays neutral with regard to jurisdictional claims in published maps and institutional affiliations.

