Article

Multi-Objective Optimal Design and Operation of Heat Exchanger Networks with Controllability Consideration

1
School of Photoelectric Engineering, Changzhou Institute of Technology; Changzhou 213032, China
2
Frontiers Science Center for Smart Materials Oriented Chemical Engineering, Institute of Chemical Process Systems Engineering, School of Chemical Engineering, Dalian University of Technology, Dalian 116024, China
3
Lanshan District Government Service Center, Rizhao 276807, China
4
Wanhua Chemical Group Co., Ltd., Yantai 264013, China
*
Author to whom correspondence should be addressed.
Sustainability 2022, 14(22), 15128; https://doi.org/10.3390/su142215128
Submission received: 11 October 2022 / Revised: 1 November 2022 / Accepted: 11 November 2022 / Published: 15 November 2022
(This article belongs to the Section Sustainable Chemical Engineering and Technology)

Abstract

:
Controllability reflects the ease that a process can be controlled in practical operating environment. However, an unclear influence between the HEN synthesis and the control structure selection has been not investigated for the work of controllability of heat exchanger network (HEN). To address this challenge, this paper proposes a multi-objective optimization method by considering both the quantitative measures of economic and controllability, i.e., minimizing the total annual cost (TAC) and the relative gain array number (RGAn). This method is developed using a HEN synthesis procedure where a model-based superstructure is employed to involve the set of the network configuration alternatives and all the potential control structures. The effects of minimum approach temperature (ΔTmin) on the multi-objective optimization problem are investigated to distinguish the consistent and opposite variations of TAC and RGAn. The consistent change enables us to solve the single objective optimization problem for economical HEN design as well as for taking controllability into account. The opposite change prompts the Pareto front of the two objectives in order to develop a trade-off strategy. Results indicate that this method helps in the determination of the relationship-based nature between network configuration and control structure to yield a HEN design with economic and controllability considerations.

1. Introduction

Energy-intensive production has received significant attention due to the high costs of vast energy consumption [1]. As a crucial part of chemical processes, energy integration through heat exchanger networks (HENs) is still an important activity [2]. Moreover, HEN must be controllable in order to easily control the target temperatures at desired values or within a permissible range. However, the majority of the HEN synthesis methods yield network configurations for the purpose of decreasing the energy cost, while the controllability problem also arises concurrently. Poor controllability could be generated by the complex interaction between heat exchange units, especially for the interaction between control pairings [3]. Therefore, these characteristics should be identified and eliminated or avoided in the HEN synthesis stage to guide the control structure selection in making the system easily controllable. It is necessary to consider controllability in HEN synthesis, since disturbances certainly exist in chemical processes [4].
The main industrial requirement is to maximize the economic benefit while performing control restrictions. However, finding a clear relationship between economic benefits and how controllers are developed remains a challenge. The first question to respond to is: What control structure should be used for this purpose? A control loop, also called control pairing, is developed between a manipulated variable (MV) and a controlled variable (CV) and then several control loops are used to construct a control structure [5]. The controllability which reflects the ease that a process can be controlled in practical operating environment [5] is strongly dependent on the control structure used, while the controller design of HENs under disturbances for minimizing the performance loss is closely influenced by this control structure [6]. Since the HEN is a typical multi-input-multi-output system, there may be influences of one MV on multiple CVs and influences of multiple MVs on one CV [7]; the study of incorporating the control structure selection into HEN synthesis is an important challenge.
Controllability metrics are generally used to determine whether the expected control performance or the desired performance can be accomplished [8]. These quantitative measures are developed most commonly by linear transfer function models [8]. Therefore, control structure selection methods based on controllability metrics have received increasing attention. In recent literature, an impressive amount of studies have proposed methods based on mathematical programming [9,10,11,12] and heuristic rules [13,14], respectively. Among these approaches, controllability metrics remain the main source of selecting control structures. Additionally, the relative gain array number (RGAn) remains the most popular metric, which is employed to decouple all the control loops in order to easily evaluate the complex combinatorial nature of HENs [15]. In terms of mathematical programming, Kookos and Perkins [16] developed a set of models to represent RGAn for the purpose of selecting an optimal control structure. A new mixed-integer nonlinear programming (MINLP) model was proposed to improve the control loop interaction and the disturbance sensitivity. Escobar et al. [5] considered that the value of RGAn reflected the sensitivity of HEN toward the control requirement, which depended on the relationship between MVs and CVs. Moreover, the work of Kookos and Perkins [16] was further extended by providing an effective flexibility index, performing the synthesis of flexible and controllable HENs. To search for more computationally efficient techniques, some authors have focused on the heat integration between artificial neural networks and swarm algorithms [17,18,19]. Furthermore, the operability requirement in an early design stage has been widely adopted and motivated the integration of process design and control [20,21,22].
From the above discussions, it can be noted that the controllability of the given network configurations has been investigated. However, the adverse influence of the controllability on network configuration optimization within the early design stage has not been considered. Control structure selection and HEN synthesis are still performed by the respective methods in sequential steps. The challenge is that the relationship between network configuration and control structure is unclear; this multi-objective optimization problem will significantly increase computational demands as the HEN scale increases. Additionally, strategies are needed to realize the economic and controllability purposes.
To overcome these challenges, an optimization framework for the controllable synthesis of HENs is proposed. The key idea is to investigate the influence of minimum approach temperature (ΔTmin) on the multi-objective optimization problem of HENs by developing a model with the objective of minimum total annual cost (TAC) and minimum RGAn. Moreover, this problem is reduced to a single objective optimization problem by the ΔTmin interval partition. In the opposite change region, the ε-constraint method is employed to obtain the Pareto front, and a relatively satisfied solution is obtained by the entropy-weighted double base points method considering the subjective weight. In the consistent change region, the optimal points received by the single objective optimization method correspond to the minimum TAC and minimum RGAn. The remainder of this paper is organized as follows. Section 2 provides the problem statement to be handled in this study. The mathematical formulation involved in the proposed framework and the outline of the strategy for the synthesis of HENs considering economic and controllability are presented in Section 3. In Section 4, the optimal solutions in different ΔTmin intervals are compared and discussed, and a case with preferred HEN results is employed to illustrate the effectiveness and application prospects of the proposed optimization framework. Finally, conclusions and final remarks are drawn in Section 5.

2. Problem Statement

The problem handled in this work is to incorporate the controllability consideration into the economic optimization of HEN. The problem can be stated as follows:
“Given the superstructure, hot and cold streams (with their heat capacity flow rate Fcp, input temperature TIN and output temperature TOUT), the film heat transfer coefficient h of available utilities, the cost coefficients (for hot and cold utilities, and heat exchangers), determine the optimal HEN with the minimum TAC, the optimal control structure (including the best set of control pairings) which minimize the RGAn (sum of the absolute values of the elements in the difference between RGA and identity matrix)”.
For the sequential HEN synthesis and control structure selection mentioned in our previous work [6], the optimal network configuration was first determined as driven by economic benefits. Then, a set of additional control pairings was obtained with the lowest RGAn. Therefore, the situation of whether the RGAn decreased with the higher TAC was still unclear.
In this context, following our recently introduced controllable synthesis framework [23], the relationship between network configuration and control structure is investigated to incorporate controllability into HEN synthesis in this study, toward the possible control challenges in the real industrial world. Therein, the economic and controllability of HEN are also assessed by TAC and RGAn; the mathematical models are referred to in our previous works [23,24]. However, the connotation of every step is different, as well as the overall framework. The key idea is to investigate the influence of ΔTmin on the multi-objective optimization problem of HENs by establishing a model with the objective of minimum TAC and minimum RGAn. It can be noted that the main focus here is only to improve the economic-oriented network configuration with its internal operability property, which is controllability. Therefore, the control issue including the controller design and the dynamic responses analysis are not considered in this paper.
The mathematical model in this work is formulated under the following general assumptions: (i) Constant specific heat capacities; (ii) fluid dynamics issues and pressure drop are not considered; (iii) counter-current heat exchanger; (iv) only bypass fractions are used as MVs; (v) only stream output temperatures are considered as CVs.

3. Model Formulations

3.1. Methodology Framework

ΔTmin is the crucial parameter in HEN synthesis, which handles constraints on the heat recovery, restricts hot/cold stream matches, and limits the hot and cold utility consumption and costs [25]. Therefore, it has a great influence on the network configuration and control structure. The main task of this paper is to investigate the influence of ΔTmin on the relationship between economic and controllability. This multi-objective optimization problem may reduce to a single objective optimization problem as ΔTmin varies. The varied ΔTmin is employed to distinguish the intervals for single objective optimization and multi-objective optimization problems. The strategy for solutions to synthesize the controllable HEN is introduced, as shown in Figure 1 and the corresponding steps are listed as follows:
(1) Prior to data extraction, all the process streams are found. These technical data include heat capacity flow rate, heat transfer coefficient, inlet and output temperatures. The controllable HEN synthesis in this work is performed based on data extraction.
(2) The entire range of ΔTmin is partitioned by analyzing the actual operation of HEN.
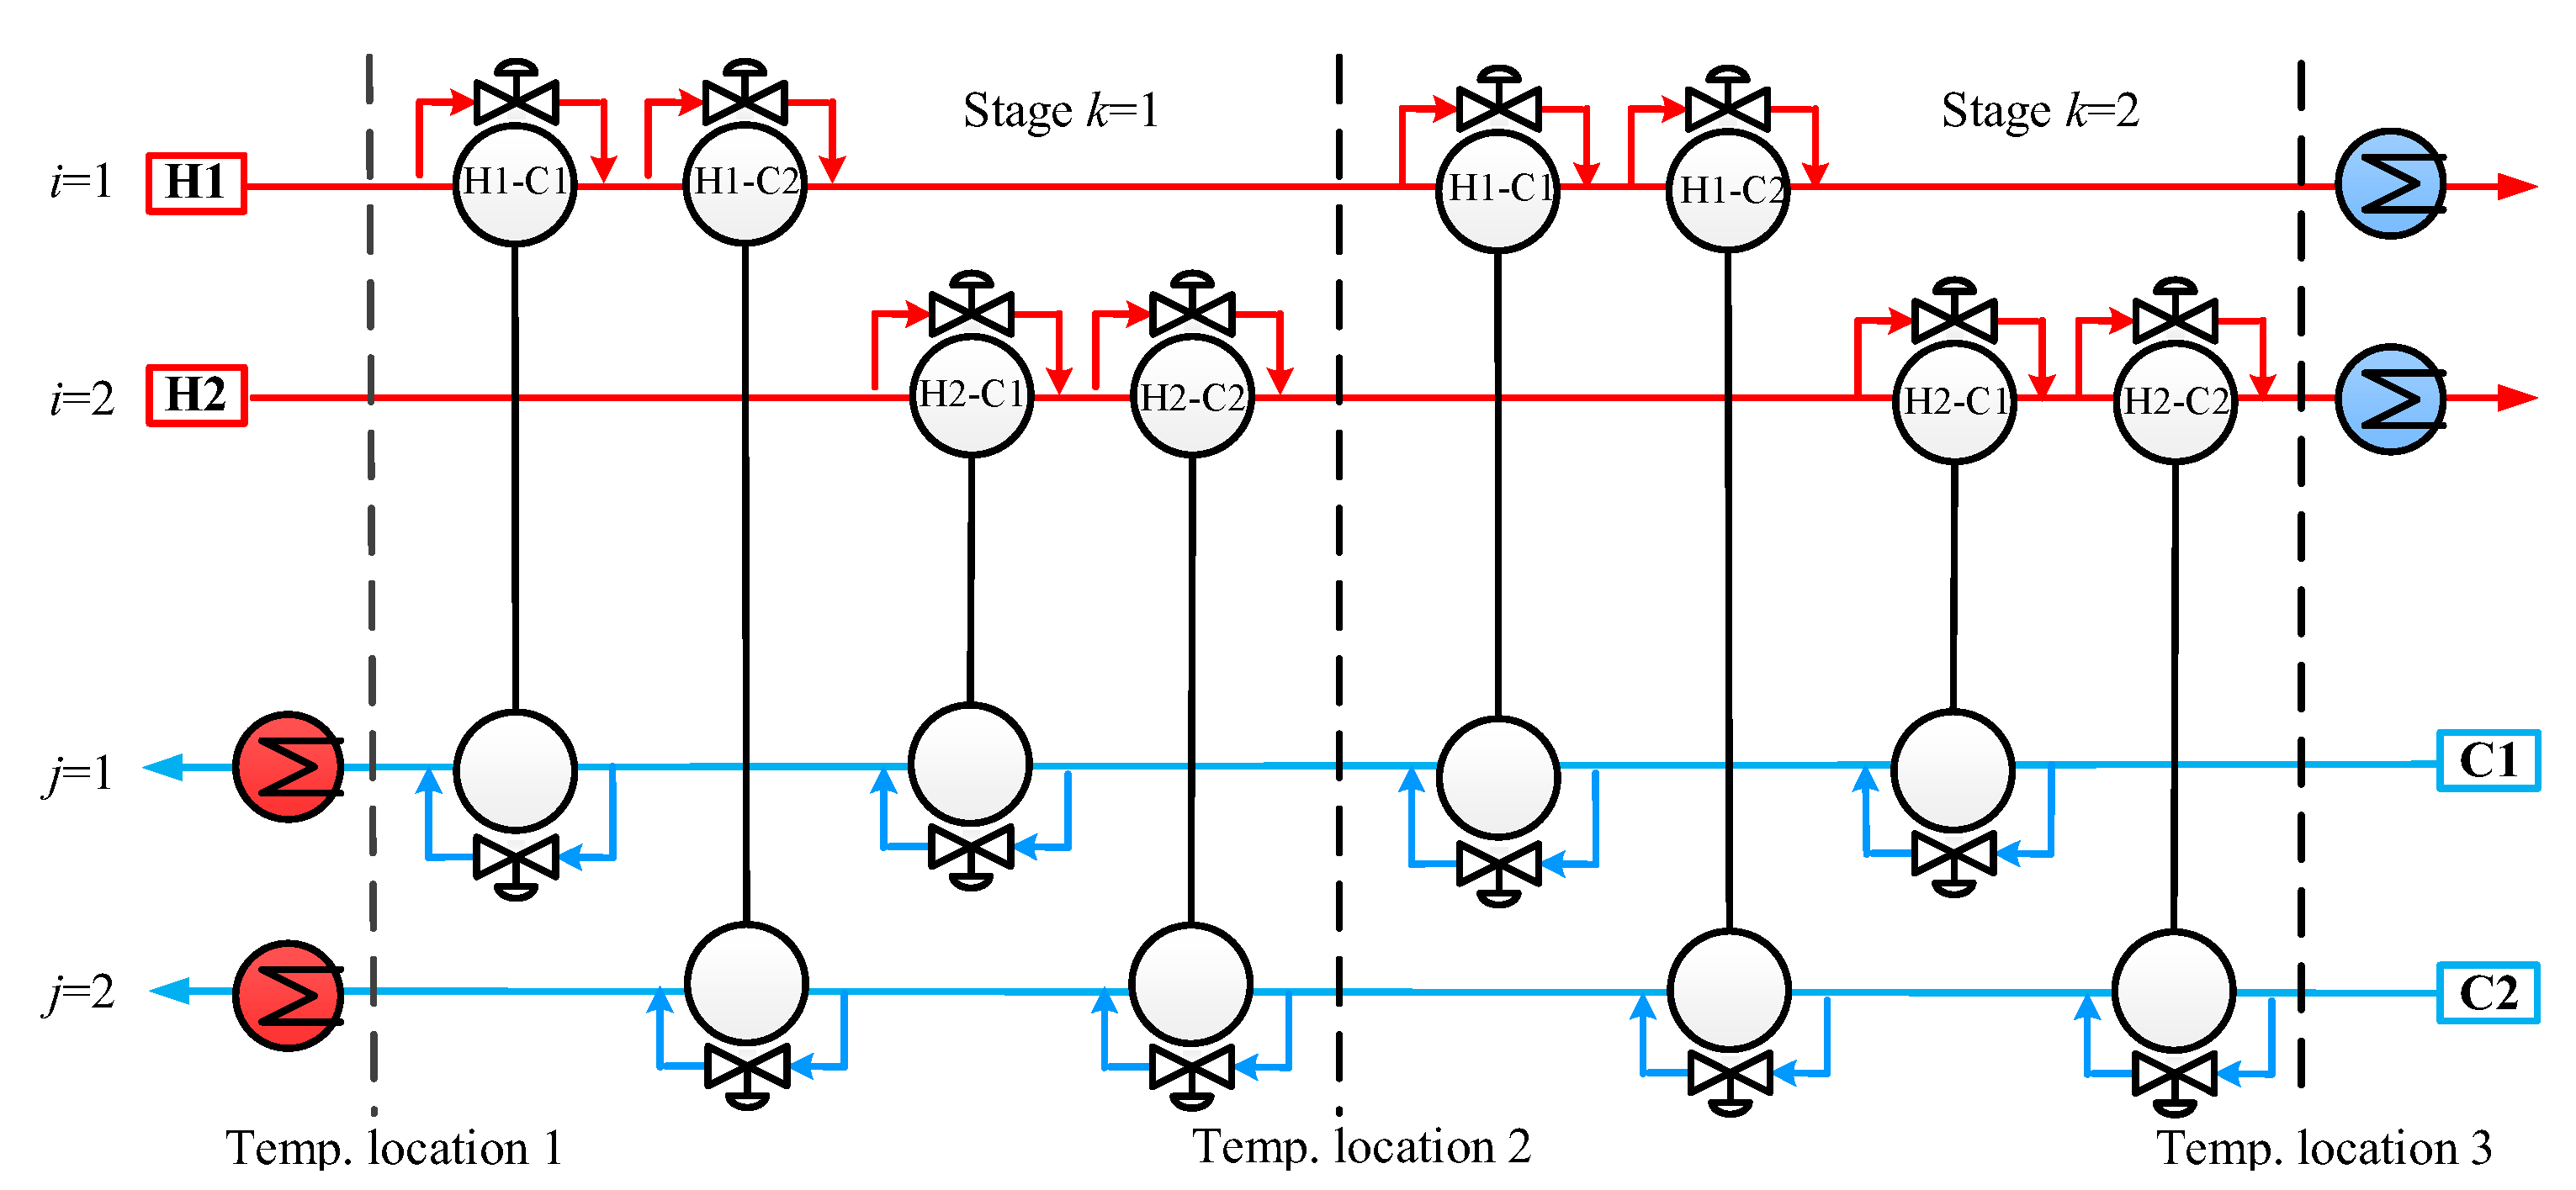
(3) The non-split step-wise superstructure involving all the potential bypasses is adopted in this step. Taking two hot streams and two cold streams as an example, the superstructure is shown in Figure 2; more details are provided in our previous work [24]. Clearly, the above-mentioned superstructure is established based on the popular stage-wise superstructure proposed by Yee and Grossmann [26]. From the above discussions, the previous goal for HEN synthesis is always to maintain the highest energy integration with financial assessments while losing its internal controllability property. In this work, the mathematical models for developing an economic-oriented HEN and for selecting an optimal control structure are referred to in our previous works [23,24]. However, this paper investigates the effects of ΔTmin on the multi-objective optimization problem to distinguish the consistent and opposite variations of TAC and RGAn in order to yield an economic and controllable HEN, for full details see step (4)–step (7).
Therefore, this step is performed to first determine the optimal network configuration by solving the mathematical model with the objectives of minimum TAC. The synthesis is developed on the basis of the superstructure presented in Figure 2, in which the purpose of introducing bypasses is to connect the network configuration and control structure [23]. Then, bypasses are selected from all the possible candidates to pair them with controlled variables following the purpose of highest controllability. This paper adopts RGAn to indicate the specific interactions between control loops. Therefore, each control structure alternative is assessed toward RGAn in order to achieve the minimum value, representing the network configuration with the highest controllability [23]. These two optimizations according to different ΔTmin with each 1 K interval are shown in Section 3.2 and Section 3.3, respectively.
It is noted that this controllability metric is employed to incorporate a control structure in HEN. Therefore, compared to the relative normalized gain array (RNGA) [12] and the methods of HEN control [20,21,22], more assumptions are made to this study. A comprehensive investigation for different extensions by the proposed methodology is out of the scope of the present contribution, and will be extended in future studies.
(4) ΔTmin intervals are partitioned by the TAC and RGAn in order to simplify the synthesis of controllable HEN.
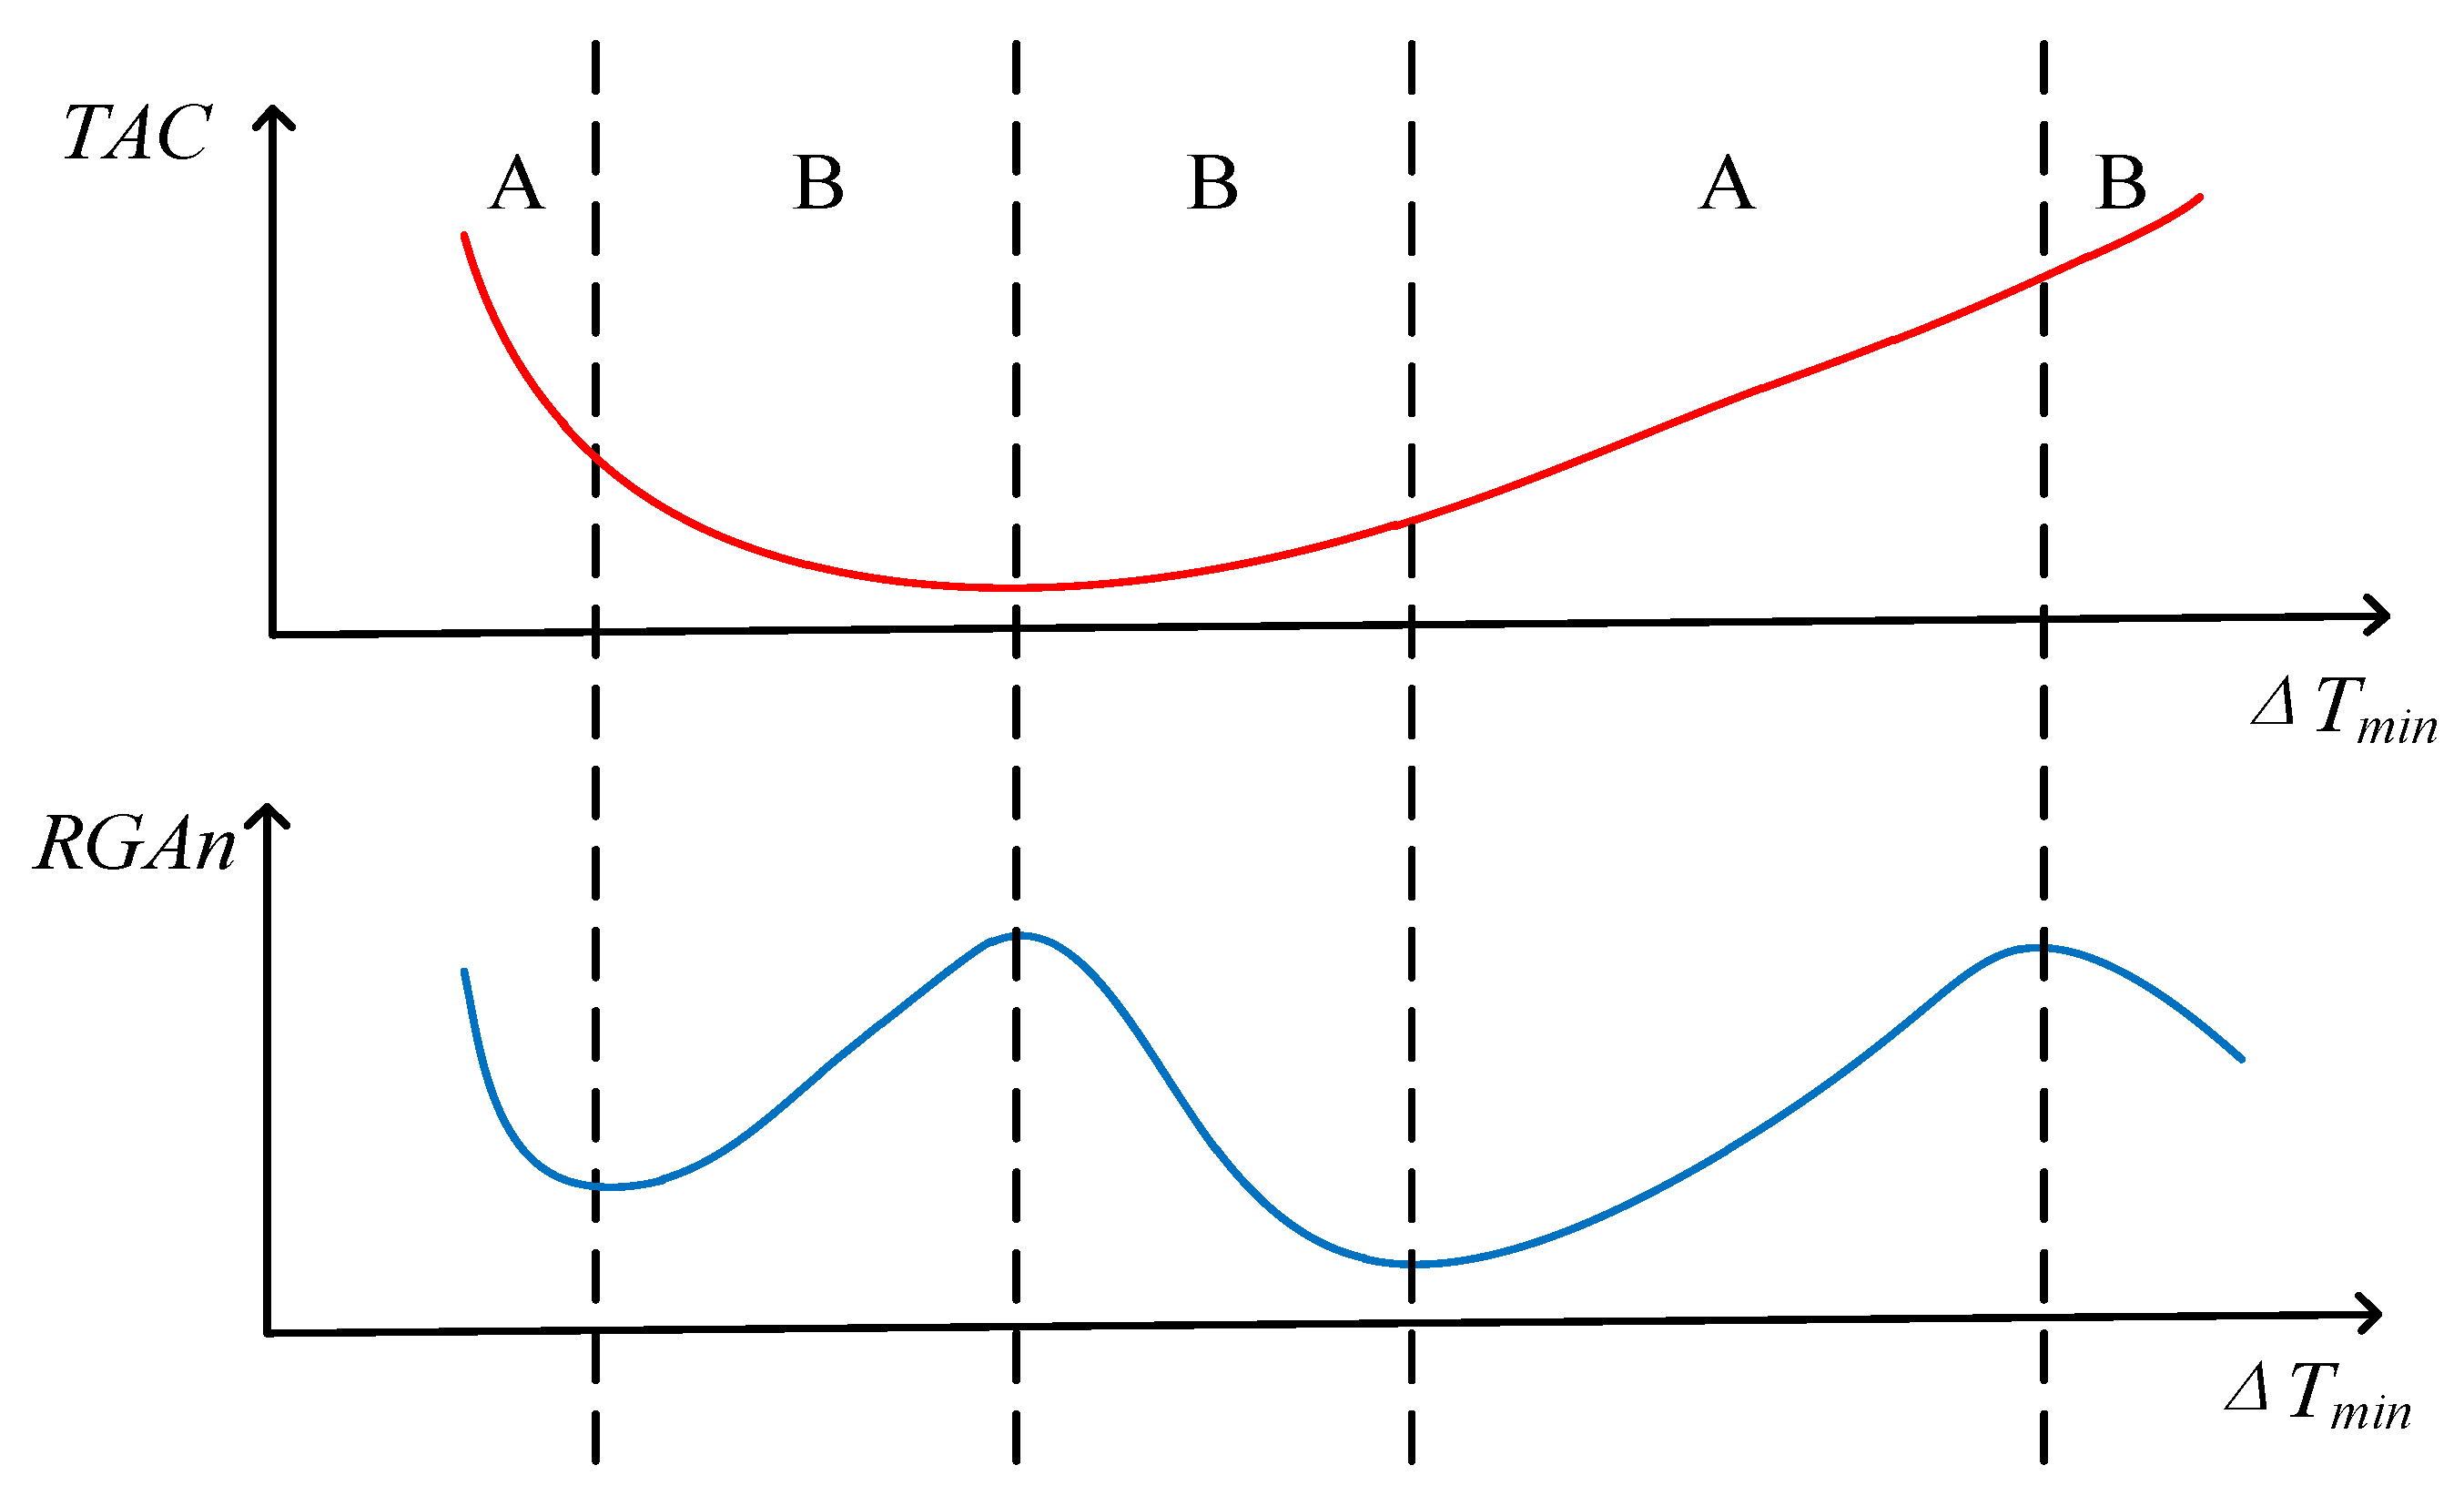
(5) As shown in region A in Figure 3, the synthesis of controllable HEN will be converted into a single objective optimization problem, when TAC presents a profile with the same monotonical change in RGAn. As can be seen, TAC and RGAn reach the minimum simultaneously.
(6) As shown in region B in Figure 3, a multi-objective optimization problem is investigated for synthesizing a controllable HEN, when the trend of TAC does not agree with RGAn. As can be seen, the optimum structure of controllable HEN should be solved through multi-objective optimization methods to balance economic and controllability.
(7) The solutions obtained by multi-objective optimization and single objective optimization methods in each ΔTmin interval are compared and discussed.
In this work, the most crucial steps and the involved mathematical models are demonstrated in steps (5) and (6). Step (5) refers to a single objective optimization problem. Step (6) performs a multi-objective optimization problem. These important steps are explained in detail in Section 3.4.

3.2. Heat Exchanger Network Synthesis

In this section, the optimal network configuration is also determined through the previous synthesis method. Similar steps for synthesizing an economic-oriented HEN are found in our previous works [23,24]. The mathematical formulation for the synthesis is developed with the purpose of TAC minimization. The objective function consists of two parts: The operating cost for the used hot and cold utilities consumption, the investment cost for heat exchange units including the exchangers, external heaters, and coolers. The operating cost is calculated by the unit cost of utilities, and the capital cost for every unit is obtained according to the general formula α fixed + α area · ( A ) β . It is noted that all related units in the superstructure are located by a set of hot streams i, a set of cold streams j, and a set of stage k [23,24]. Considering the heat exchanger with ijk as an example, it can be described as the stream match between hot stream i and cold stream j in stage k. Accordingly, the existence of heat exchangers, coolers, and heaters is indicated by binary variables z i j k , z i CU , and z j HU , respectively.
min T A C = min ( i j k α fixed · z i j k + i α fixed · z i CU + j α fixed · z j HU + i j k α area · A i j k β + i α area · ( A i CU ) β + j α area · ( A j HU ) β + i c CU · Q i CU + j c HU · Q j HU )   s . t .   ( a )   Heat   balance   for   every   heat   exchanger : Q i j k HE F c p h i HE ( T h i j k IN , HE T h i j k OUT , HE ) = 0 Q i j k HE F c p c j HE ( T c i j k OUT , HE T c i j k IN , HE ) = 0 ( b )   Overall   heat   balance   for   every   stream : F c p h i ( T h i IN T h i OUT ) = j k Q i j k HE + Q i CU F c p c j ( T c j OUT T c j IN ) = i k Q i j k HE + Q j HU ( c )   Heat   balance   at   every   stage   in   superstructure : F c p h i ( T h i , k st T h i , k + 1 st ) = j Q i j k HE F c p c j ( T c j , k st T c j , k + 1 st ) = i Q i j k HE ( d )   Non - isothermal   streams   mixing : T h i j k mix = K i j k H   T h i j k IN , HE + ( 1 K i j k H ) T h i j k OUT , HE T c i j k mix = K i j k C   T c i j k IN , HE + ( 1 K i j k C ) T c i j k OUT , HE ( e )   Flowrate   balance   for   every   heat   exchanger : F c p h i HE = ( 1 K i j k H ) F c p h i F c p c j HE = ( 1 K i j k C ) F c p c j ( f )   For   logical   constraints : Q i j k HE Λ i j z i j k 0 Q i CU Λ i z i CU 0 Q j HU Λ j z j HU 0 ( g )   For   approach   temperatures : d t i j k T h i , k st T c j , k st + Γ i j ( 1 z i j k ) d t i j , k + 1 T h i , k + 1 st T c j , k + 1 st + Γ i j ( 1 z i j k ) d t i CU T h i , N T + 1 st T c u i OUT + Γ i j ( 1 z i j k ) d t j HU T h u j OUT T c j , 1 st + Γ i j ( 1 z i j k ) d t i j k , d t i CU , d t j HU Δ T min ( h )   Assignment   of   inlet   temperature   in   superstructure : T h i , 0 st = T h i IN T c j , N T + 1 st = T c j IN ( i )   Feasibility   constraints   for   temperatures : T h i , k st T h i , k + 1 st T h i OUT T c j , k st T c j , k + 1 st T c j IN i I , j J , k S T }
In addition to the above-mentioned objective function in Equation (1), the process models are applied as the constraints to promote the synthesis results. All the process models are referred to in our previous works [23,24] and developed in the non-split two-stage superstructure of HENs involving all the potential bypasses. For instance, the energy balance model is employed to describe the hot and cold utilities consumption, and the constraints of feasible temperature are added to determine the temperature decreases (hot streams) or increases (cold streams) along the stages. The heat balance model of every stream is added to ensure sufficient heating or cooling in order to achieve the required set points of all the stream output temperatures at the end of the superstructure. Additional details can be found in our previous works [23,24], using the notation given in Nomenclature.

3.3. Control Structure Selection

The HEN controllability can be greatly increased by decoupling the control loop interactions, due to the complex combinatorial nature of HEN. RGAn is generally employed to quantitatively assess the control loop interaction, which reflects the sensitivity of system toward the control requirement. In this work, the lower RGAn demonstrates that the HEN is easier to be controlled, which indicates higher controllability. Therefore, RGAn is selected as the objective function to choose the control pairing among MVs and CVs, forming an optimal control structure.
In addition, Yan et al. [27] proposed the disturbance propagation and control (DP&C) model to assess the disturbance propagation and evaluate the maximum output deviation under disturbances. A set of linear models is employed to present the above work, which is highly applicable for a complex network configuration [23]. Based on the pioneering work of Liu et al. [23], the authors extended the DP&C model in superstructure representation to make it applicable to all possible network configuration alternatives. The following works are developed on the extended DP&C model.

3.3.1. Minimization of Control Loop Interaction

The relative gain array RGA is defined by the stationary gain matrix G, as shown in Equation (2) [16], where G+ is the pseudo-inverse matrix of matrix G [16], and symbol ⊗ denotes an element-by-element multiplication (the Hadamard or Schur product) [16].
R G A = G ( G + ) T
G = [ g 1 , 1 g 1 , n g m , 1 g m , n ]
The following m × n matrix which relates the potential MVs with the CVs is defined in Equation (3). The numbers of rows and columns denote CVs and MVs, respectively. The elements of this matrix are defined to measure the stationary gain relationship between the input and output variables. A control pairing should exist between these two variables since the diagonal elements of RGA can be as close to one as possible. Therefore, the promising sets of control pairings are developed through minimizing the RGAn, which was proposed to select the control structure that minimizes the overall interaction [5]. For a small interaction among the control loops, RGAn must have a small sum norm (sum of the absolute values of the elements of the matrix) defined as follows [5]:
R G A n = R G A   n u m b e r =   R G A I   s u m  
where I is the identity matrix. Considering the auxiliary variables, Escobar et al. [5] employed model (5) to select the control structure which minimizes the overall interaction. In Equation (5), G+ denotes m × m matrix, which consists of m columns of the G matrix; g ˜ m , n is the element of the transpose of the inverse of this matrix; and δ m , n is the Kronecker delta. The elements of matrix U are the binary variables associated with the following logical statements: When CV m pairs with MV n, um,n = 1, otherwise, um,n = 0.
min R G A n = m = 1 N s t r e a m n = 1 N b y p a s s μ m , n   s . t .   m = 1 N s t r e a m u m , n 1 0 ,   n n = 1 N b y p a s s u m , n 1 = 0 ,   m j = 1 N b y p a s s g m , n g ˜ m , n δ m , n = 0 ,   m , n Ω ( m = 1 N s t r e s m u m , n ) g ˜ m , n Ω ( m = 1 N s t r e a m u m , n ) ,   m , n λ m , n g m , n g ˜ m , n = 0 ,   m , n η m , n λ m , n + u m , n = 0 ,   m , n μ m , n η m , n μ m , n ,   m , n x m , n = { 0 , 1 } ,   m , n , μ m , n 0 ,   m , n }

3.3.2. Extended DP&C Model Based on Superstructure Representation

As shown in Equation (3), g m , n indicates the variations of CVs over MVs, which are employed to clear the nature of the given network configuration [23]. In the work of Yan et al. [27], the DP&C model was employed to assess the disturbance propagation and evaluate the maximum output deviation under disturbances, which can be defined as the following general model [23]:
δ T OUT = B δ K + D δ T IN + D m δ F c p
where vectors δTIN and δTOUT denote maximum temperature deviations of inlet and outlet streams, respectively. Additionally, similar definitions are given for bypass fraction K and heat capacity flow rate Fcp. Matrices B, D, and Dm are used to describe the characteristics of HEN, which are obtained according to the information of HEN structure, as shown in Equations (A1)–(A13) in Appendix A. Structural matrices V1, V2, V3, and V4 are developed on the network configuration, which are specified by the user.
Based on these models, Liu et al. [23] proposed an extended DP&C model by considering all the control loops between potential MVs and CVs rather than depending on a given HEN. The model is formulated as abbreviated in Equation (7) [19], for full details see Equations (A14)–(A19) in Appendix A.
δ T O U T δ K = f ( δ T i j k I N , H E , δ T i j k O U T , H E , δ F c p )
Therefore, the variations of CVs over MVs can be predicted as long as the stream outlet temperatures and heat capacity flow rate are known; g1,1 is considered as an example, as shown in Appendix A. It is noted that the extended DP&C model made the same assumptions as the original DP&C model, in which further dynamic considerations are neglected [23].

3.4. Strategy for Solutions to Multi-Objective Optimization of HEN Based on Partition of ΔTmin Intervals

ΔTmin has a great influence on both side temperatures of all heat exchangers, fractions of the selected bypasses, and stream flowrates. Therefore, the economic and controllability of HENs are affected simultaneously by the variations of ΔTmin. Different TAC and RGAn will be achieved when synthesizing HEN and selecting the control structure in different ΔTmin. Specifically, for some given ΔTmin intervals, balancing these two parts is not necessarily solved by multi-objective optimization methods. To minimize the TAC and RGAn, the critical ΔTmin at which the multi-objective optimization problem reduces to a single objective optimization problem is determined. The ΔTmin intervals are partitioned according to the trends of the variations of TAC and RGAn.

3.4.1. Methods for Single Objective Optimization of HEN

The economic goal of the HEN is consistent with controllability, when the trend of the variations of TAC agrees with RGAn. The optimum solution for synthesizing a controllable HEN could be obtained by single objective optimization methods. Therefore, HEN with the minimum TAC has the minimum RGAn, which is one of the optimal solutions.

3.4.2. Methods for Multi-Objective Optimization of HEN

The multi-objective optimization methods are employed to explore trade-offs between the conflicting objectives, when the opposite change occurs in the trends between TAC and RGAn. In this section, the ε-constraint method is employed to yield a Pareto front of these two objectives in order to introduce a whole set of the optimal solutions. Then, the entropy-weighted double base points method considering the subjective weight is employed to determine a relatively better solution among all optimal solutions.
(a) The ε-constraint method
The main idea of ε-constraint method is to select an objective as the primary one, while the upper or lower bounds are set for the remaining objectives. Therefore, it creates an opportunity to convert the multi-objective optimization problem into a single objective optimization problem. In this work, the economic objective is selected as the primary objective, whereas the controllability is considered as a constraint, as shown in Equation (8), where the detailed models for TAC and RGAn are shown in Equations (1) and (5), respectively.
min T A C ( x x , y y , z z ) s . t . R G A n ( x x , y y , z z ) ε l ( x x , y y , z z ) = 0 s ( x x , y y , z z ) 0 }
where ε is the auxiliary parameter. The Pareto front is obtained by solving a set of single objective optimization models with different ε.
(b) Entropy-weighted double base points method considering subjective weight
A Pareto front for multi-objective optimization can be given by the abovementioned discussion, while the final result needs to be further ensured by the users. Entropy is a measure of uncertain information. As can be seen, the greater the amount of information provided by the index, the smaller the amount of information entropy of an index [28]. Moreover, the greater the role the index plays in the comprehensive evaluation, the higher the weight.
The entropy-weighted double base points method is an evaluation method considering the objective and comprehensive functions, which can be employed for multiple objects and indicators [28]. However, the subjective experience empowerment of engineers is generally very important in an actual plant operation. In this paper, the entropy-weighted double base points method is employed [29] and modified by considering the subjective weight, according to the following procedure.
Step 1 Create an evaluation matrix. The number of rows of the matrix is equal to the number of objective functions, and the number of columns is equal to the number of Pareto solutions. Element r i i , j j is the ii th value of the objective function within the jj th Pareto solution.
Step 2 Data normalization.
The popular range method is adopted here, in which the initial data are normalized according to Equation (9) in terms of the negative index, since the dimension and order of magnitude of the objective functions are different [29].
r i i , j j = max j j ( r i i , j j ) r i i , j j max j j ( r i i , j j ) min j j ( r i i , j j )
where r i i , j j is the value of objective function after normalizing r i i , j j ; max j j ( r i i , j j ) and min j j ( r i i , j j ) are the maximum value and minimum value in row ii of evaluation matrix, respectively.
Step 3 Calculate the entropy αα of each objective function, as follows:
α α i i = 1 e i i i i = 1 2 ( 1 e i i ) ,   i i = 1 , 2
where the information entropy e is given by:
e i i = j j = 1 M [ r i i , j j j j = 1 M r i i , j j ln ( r i i , j j j j = 1 M r i i , j j ) ] ln M
Step 4 Modify the weight ω to determine the subjective weight.
The function value that minimizes the value of Φ is calculated when the weight factor λ1 increases from 0 to 1, as shown in Equation (12), where λ1 + λ2 = 1. The influence of λ1 on the function value is analyzed and λ1 is determined by the subjective weight, as follows:
min Φ = ( λ 1 ( r 1 , j j ) 2 + λ 2 ( r 2 , j j ) 2 ) 1 / 2
Objective entropy weight αα is modified as follows:
ω i i = α α i i λ i i i i = 1 2 α α i i λ i i
Step 5 Determine double base points. The positive ideal point and negative ideal point are given by:
F + = ( f 1 + , f 2 + )   and   f i i + = max ( ω i i r i i , j j )
F = ( f 1 , f 2 )   and   f i i = min ( ω i i r i i , j j )
Step 6 Calculate the relative closeness; D j j + and D j j are the Euclidean distance from the jj th solution to the positive ideal point and negative ideal point, respectively. Therefore, the solution with greater relative closeness is selected as the optimal one.
T J j j = D j j D j j + + D j j

4. Results and Discussion

The stream data with two hot streams and two cold streams are provided from literature [30], as shown in Table 1. Additionally, 8000 + 1000 A0.8 $·y−1 is employed to represent the capital cost of heat exchanger, while 80 and 20 $·kW−1·y−1 are provided for unit costs of hot and cold utilities consumption, respectively. The range of ΔTmin is set as 5–40 K, considering the HEN actual operation. The model is formulated in GAMS/BARON [23] and solved on an Intel Core 3.6 GHz machine with 4 GB memory.

4.1. Partition of ΔTmin Intervals for Synthesizing the Controllable HEN

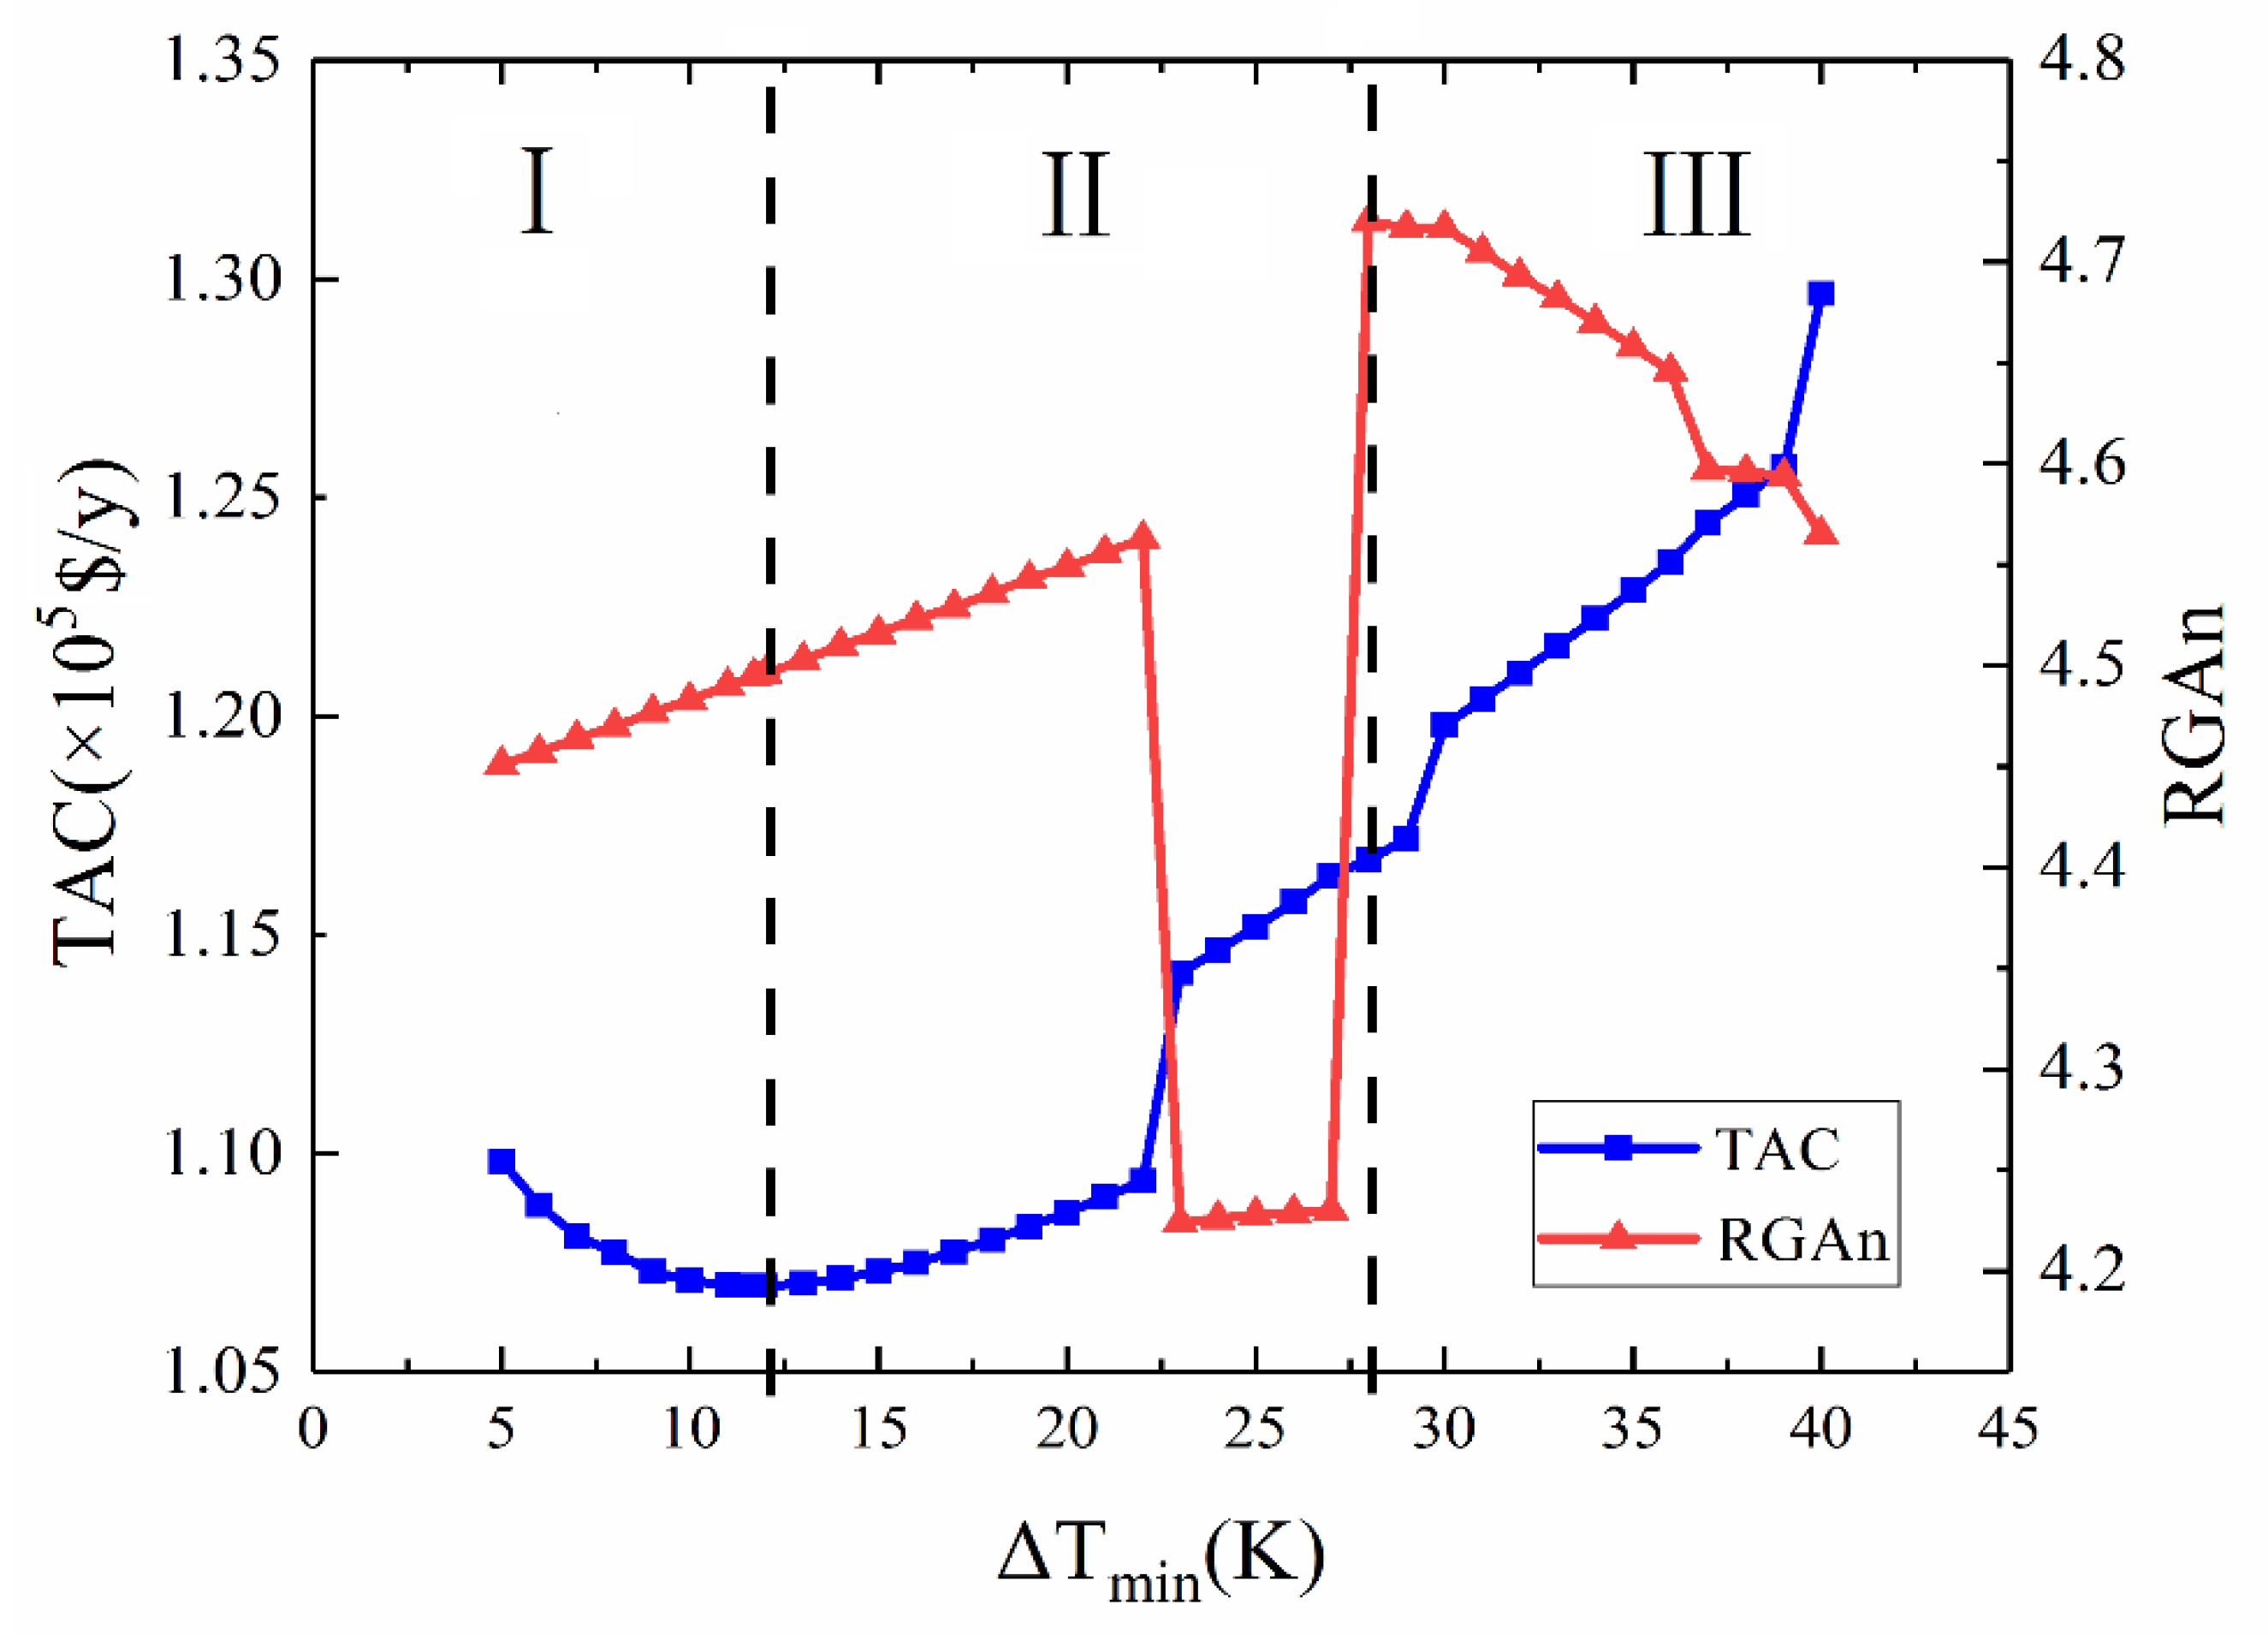
The fixed interval for ΔTmin is selected as 1 K. Then, the HEN synthesis and control structure selection are sequentially performed under ΔTmin = 5 K, 6 K, 7 K……40 K. The relationship between TAC and RGAn under different ΔTmin is depicted in Figure 4. The horizontal and vertical coordinates denote ΔTmin, RGAn, and TAC, respectively.
Herein, it is shown that RGAn presents a parabolic profile while TAC almost remains a monotonous increase. The overall range of ΔTmin is partitioned into an opposite change region and a consistent change region on the basis of the profiles of TAC and RGAn. Different trends appear in TAC and RGAn with the variations of ΔTmin. The economic and controllability targets present a characteristic of pinch issues with an increase in ΔTmin, rather than being completely contradictory. Therefore, according to these trends, the controllable HEN synthesis problem is partitioned into several subproblems in different intervals, and as can be seen, the proposed framework yields an economic and controllable HEN in order that the more complex synthesis problem is solved more efficiently.
Three regions are provided as shown in Figure 4. In region I, the multi-objective optimization problem is performed with ΔTmin ∈ [5 and 12 K]. In region II, the single objective optimization problem is introduced with ΔTmin ∈ (12 and 28 K]. In region III, the multi-objective optimization problem is introduced with ΔTmin ∈ (28 and 40 K]. The overall RGAn increases in region II, but with a decrease under ΔTmin ∈ [22 and 23 K]. Several subregions are subdivided to further balance TAC and RGAn, which are calculated under ΔTmin = 22, 22.05, 22.1, 22.2, 22.4, 22.6, 22.8, and 23 K, as shown in Figure 5. RGAn reaches a maximum at ΔTmin = 22 K and there is a shift in its overall trend with the increase in ΔTmin. The reasons behind the change are thoroughly explained by the altered HEN structure under ΔTmin = 22 K. A great change that occurred on RGAn is given by different HEN structures on both sides of the shift trend. Similarly, a great change is also introduced on TAC due to the altered HEN structure. The closer ΔTmin is to 22 K, the more gently the RGAn decreases, and this shift trend moves to the left. As can be seen, the trend of RGAn would be a profile with a shift in 22 K, when ΔTmin is infinitely subdivided, as shown in the black dotted line. Therefore, a drastic decrease is generated in RGAn as the altered HEN structure in region II, rather than a consistent decrease. The overall trend increases monotonically, and thus the single objective optimization method is employed to synthesize the controllable HEN in region II.

4.2. Single Objective Optimization of HEN Considering Control Structure Selection

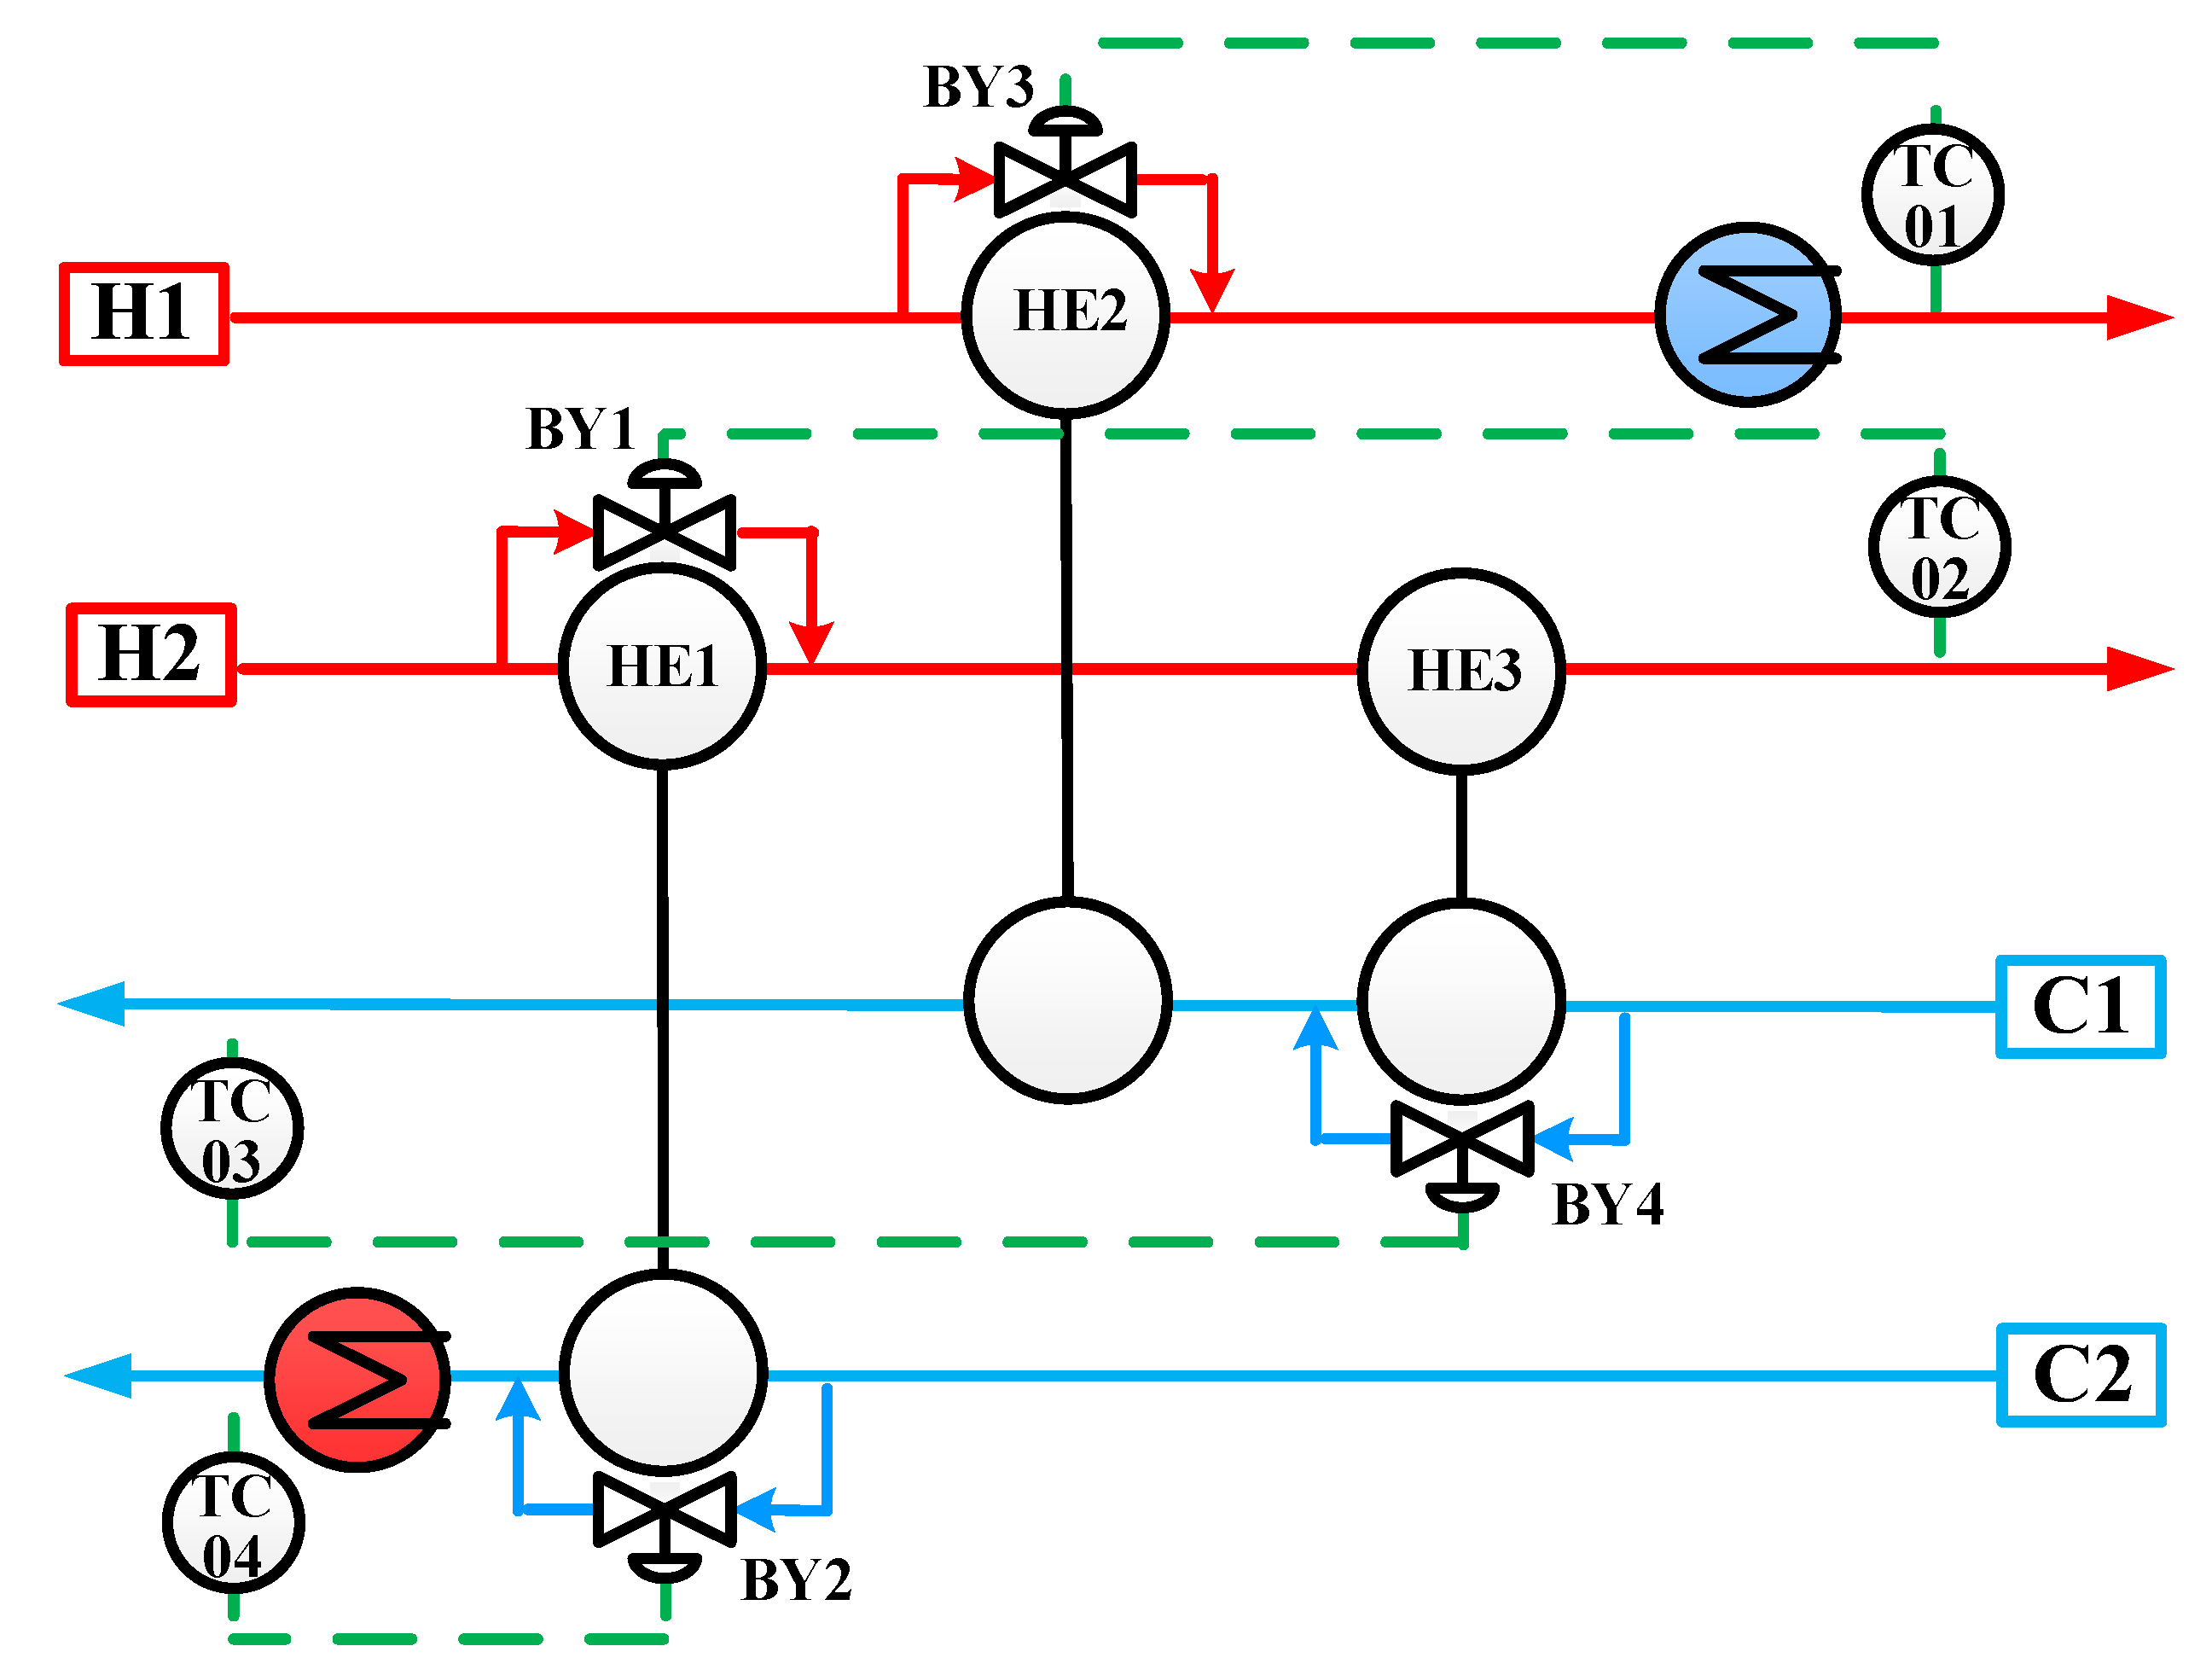
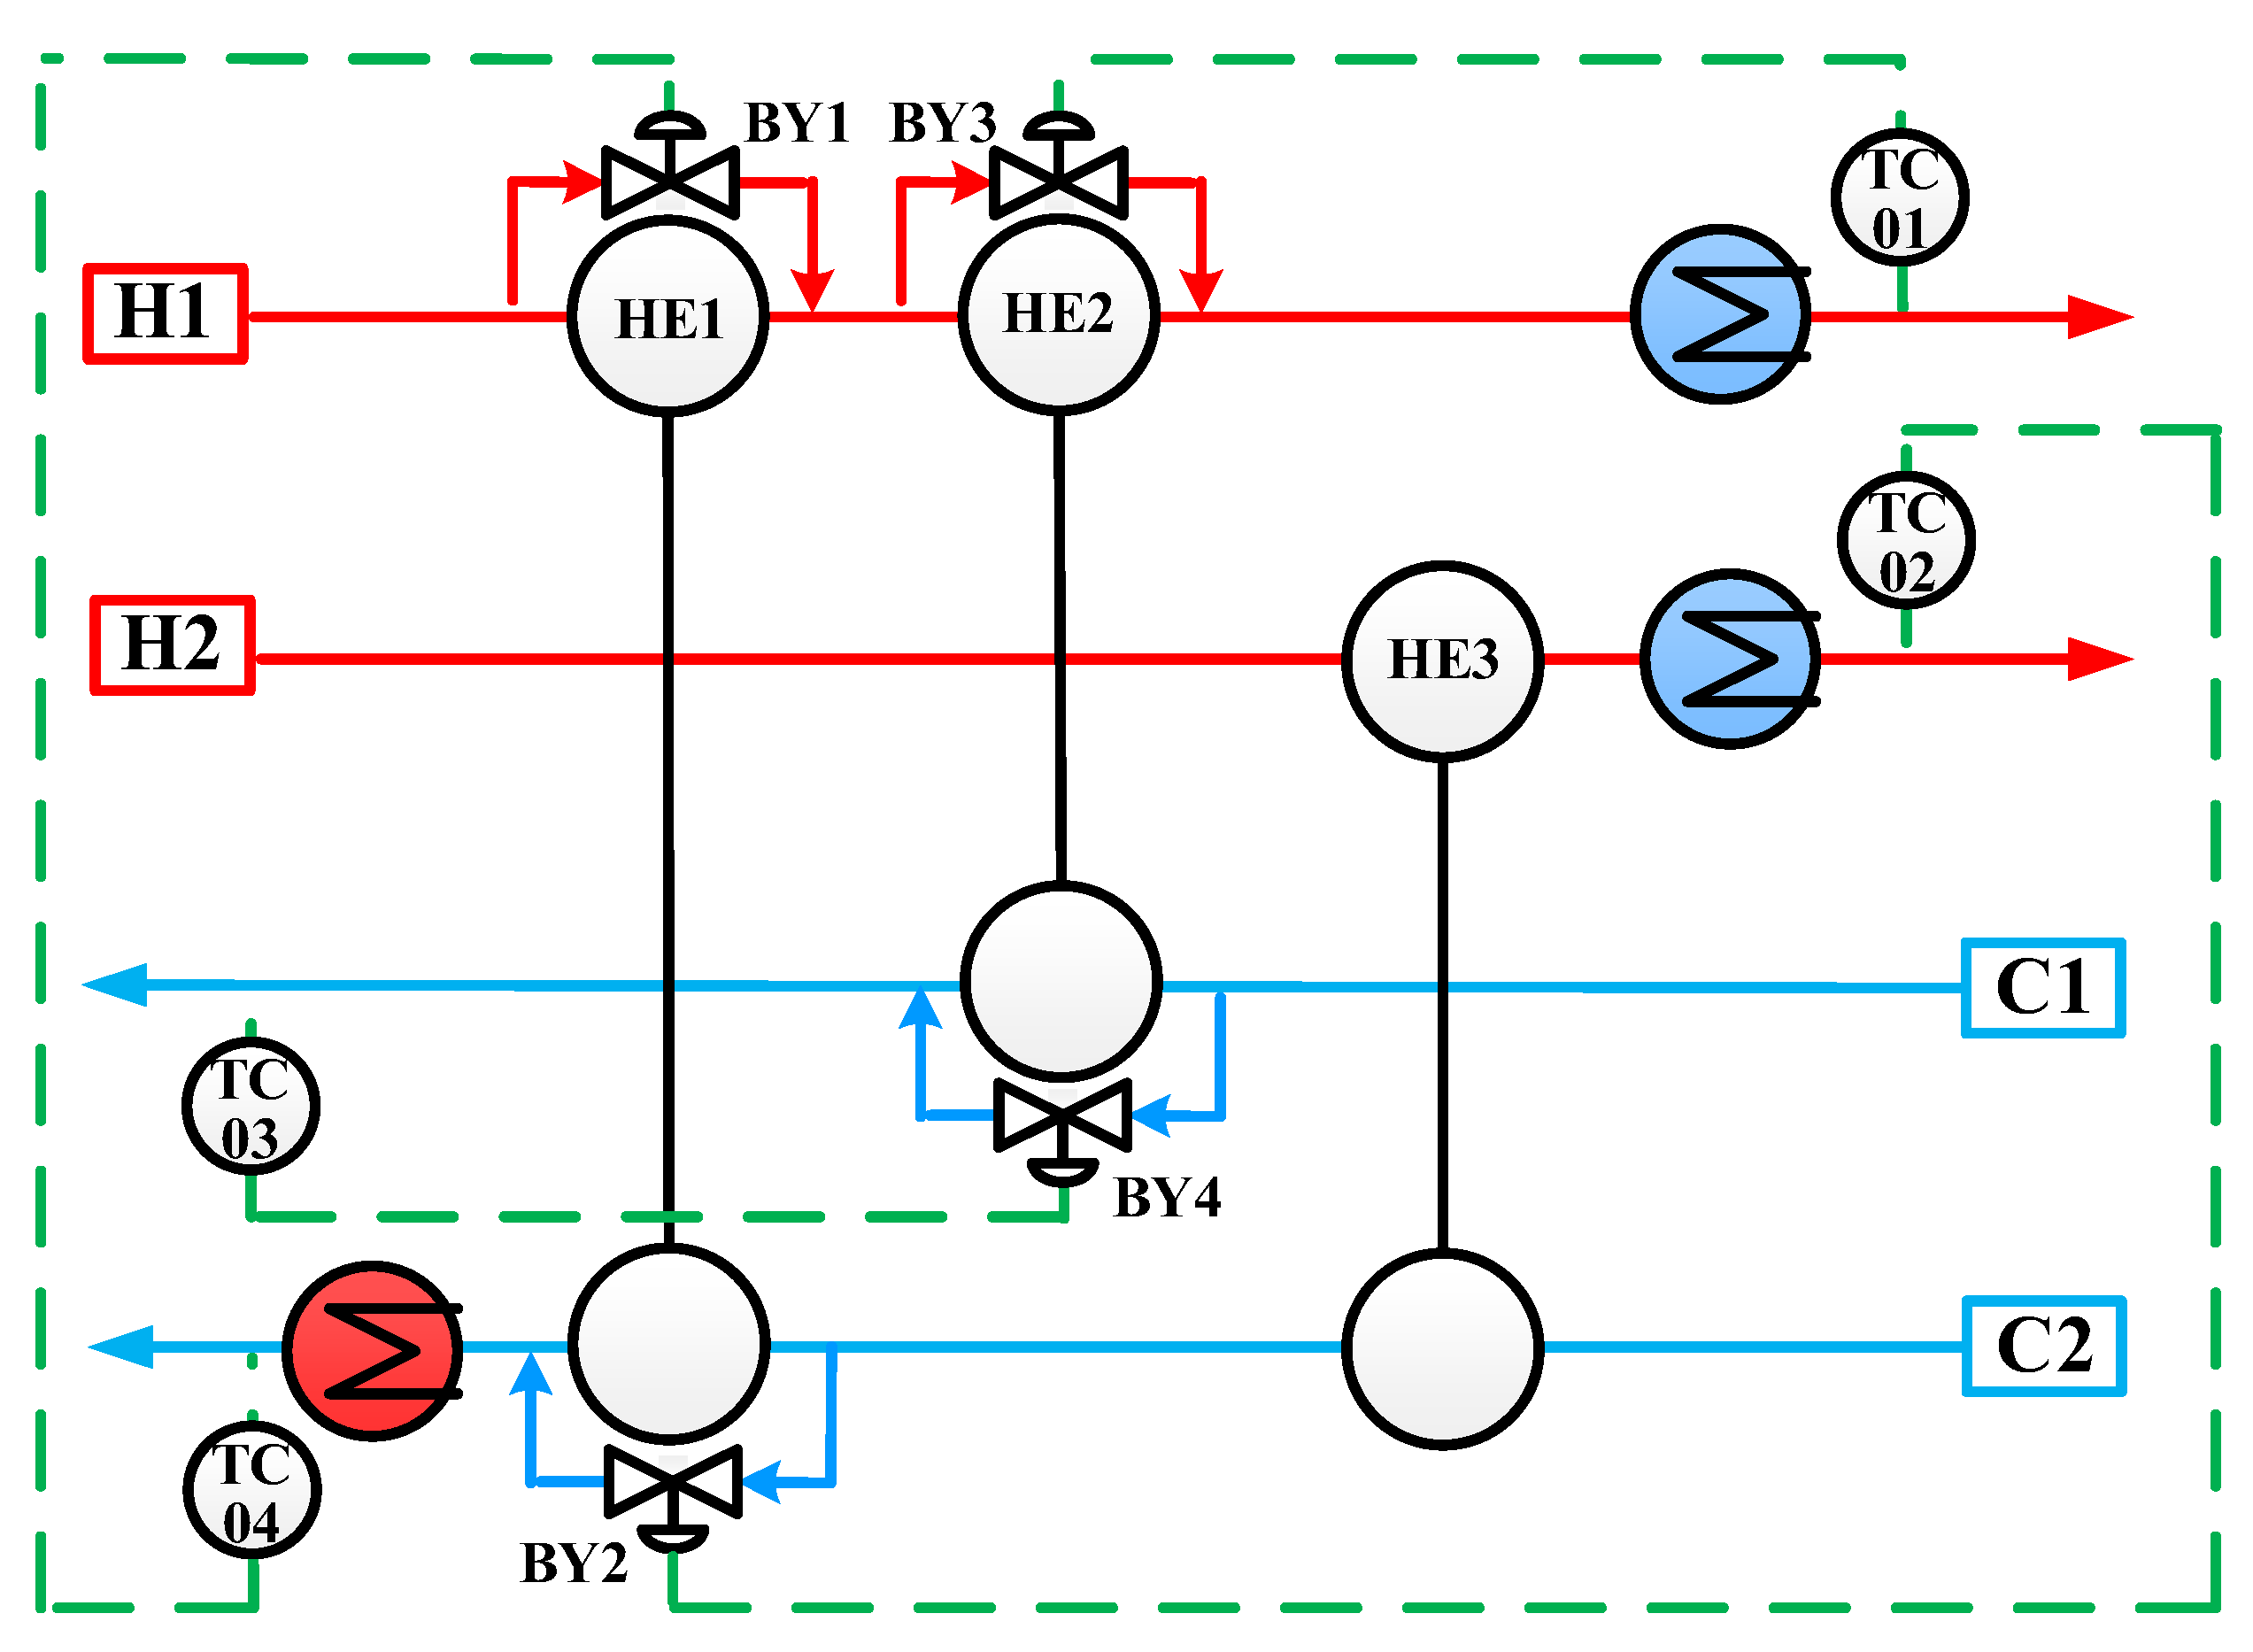
In region II, TAC presents the same profile while RGAn changes monotonically. Therefore, the original multi-objective optimization problem is reduced to a single objective optimization problem. The variations of RGAn are more aggressive than TAC with the comparison of HENs under ΔTmin = 23 and 12 K. A small difference between RGAn in different HEN structures reflects a large difference between the control performances [31]. In an actual plant operation, some economic sacrifices are made to ensure process safety. Therefore, the HEN under ΔTmin = 23 K is selected for region II, as shown in Figure 6. HE and BY denote the resulting heat exchangers and the locations of the selected bypasses, respectively. The general results for this HEN are shown in Table A1 in Appendix A.

4.3. Multi-Objective Optimization of HEN Considering Control Structure Selection

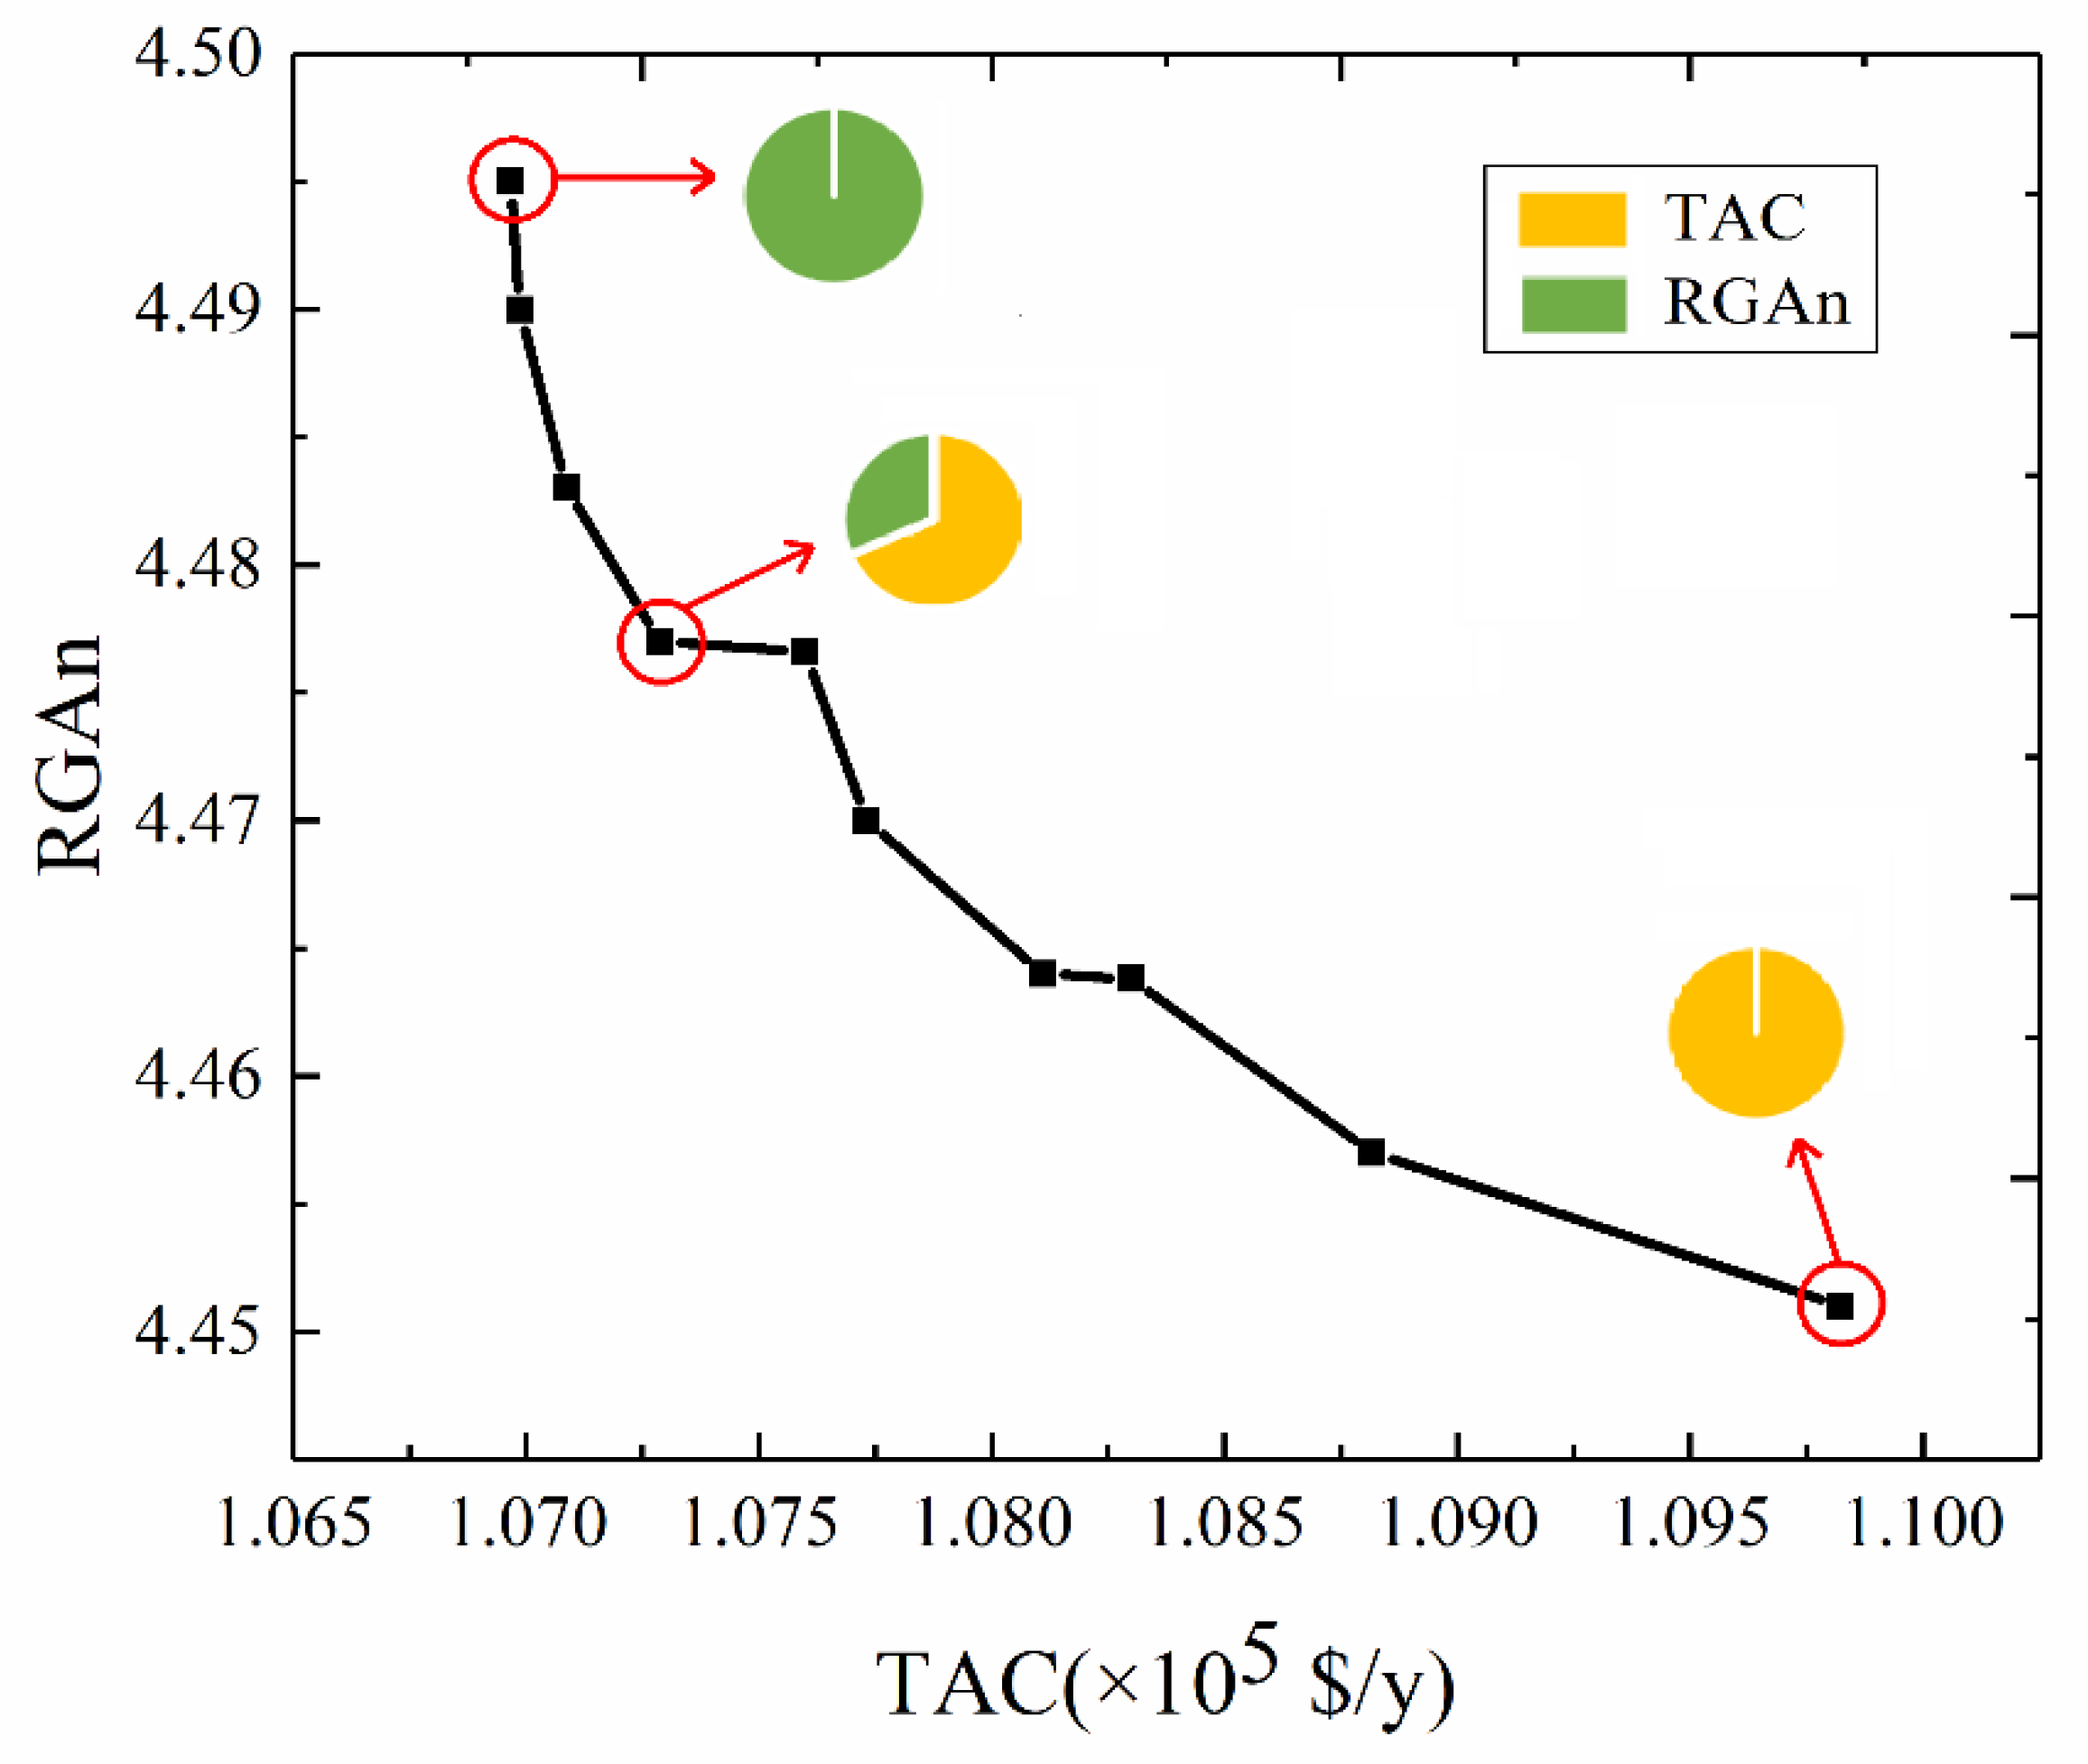
In regions II and III, the trend of TAC disagrees with RGAn, in order that the multi-objective optimization method is employed. Considering region I as an example, the variations of TAC are 0.3 times more aggressive than RGAn. In this way, TAC is selected as the primary objective to explore the Pareto front, as shown in Figure 7.
The left and right Pareto optimal sets are given as the auxiliary points, which correspond to the minimum TAC and minimum RGAn, respectively. The subjective weight factor for economic goals is selected as 0.7 since the variations of TAC are more aggressive than RGAn in this region. Utilizing the entropy-weighted double base points method, the Pareto-optimal solution in region I is selected as the network configuration under ΔTmin = 7 K, as shown in Figure 8. Similarly, the Pareto-optimal solution in region III is selected as the network configuration under ΔTmin =37 K, as shown in Figure 9. The general results for HENs are shown in Table A1 in Appendix A.

4.4. Further Analysis and Comparison of Results

A comparison of the selected solutions received by the single objective optimization method and the trade-off solutions received by the multi-objective optimization method is indicated in Table 2. The controllable HEN synthesis in region I with ΔTmin ∈ [5 and 12 K] and in region III with ΔTmin ∈ [28 and 40 K] are multi-objective optimization problems. The controllable HEN synthesis in region II with ΔTmin ∈ [12 and 28 K] is the single objective optimization problem. The proposed method helps in clearing the nature of different optimization problems and alleviating the computation loads of the controllable synthesis problem. The HENs with the minimum TAC and minimum RGAn are symbolized as HEN1 and HEN2, respectively. The rest is symbolized as HEN3. The economic optimality is maintained in HEN1 rather than HEN2, featuring a TAC reduction up to 5.17%. HEN2 features a decrease in RGAn up to 5.33% compared to HEN1, and as can be seen, the solutions are not only synthesized toward costs, but also exhibit good controllability properties.
The influences of ΔTmin on TAC and RGAn are further investigated, where TAC presents a parabolic profile with the increasing ΔTmin. This is mainly due to the fact that the maximum heat recovery and the minimum consumption of external utilities are obtained by the smallest ΔTmin, while heat-transfer areas corresponding to these points are significantly distant from the optimal one. Conversely, small heat recovery, large consumption of external utilities, and small heat-transfer areas are achieved when ΔTmin is large. Therefore, the profile of TAC is partitioned into an opposite change and a consistent change with the increasing ΔTmin. However, no special regularity is found in the profile of RGAn with the increasing ΔTmin, and there is only a trend with partitioned change. A large difference occurs between the objective values of different regions with a small difference in the values inside one region, and appears to be a consistent change. This is mainly due to the fact that different stream matches in different regions exist behind each RGAn. The same stream match appears in one region, but with different heat-transfer areas, featuring a small difference in the objective values. It can be seen that the crucial factor affecting the HEN controllability is the stream match, followed by internal structural variables.
On the other hand, the disturbance intensity in every bypass fraction is adopted to identify the nature of the network configuration under disturbances. The strategy for identifying this disturbance intensity is through the work of Gu et al. [6]. For a given network configuration, the disturbances propagate through the heat exchangers to each bypass fraction, while the numbers of the heat exchangers in these propagations demonstrate the disturbance intensity in every bypass fraction [6]. Considering HEN1 as an example, the influence on the fraction of bypass BY3 under disturbances is shown in Figure 10. The black dashed lines denote the possible pathway propagating from all the heat exchangers to the fraction of bypass BY3. Normalizing the disturbance intensity in every bypass fraction facilitates the analysis, as shown in Table 3. The bypass fractions with intense disturbances are all paired with the end temperature where these bypasses are located. Therefore, the influence of disturbances on these bypass fractions would not be transferred to the other streams. Particularly, in HEN2, both hot and cold sides of the heat exchanger where BY1 is located are near the end temperature, featuring no interactions with the other units. Conversely, the bypass fractions with a small disturbance intensity can be paired with the end temperature in the other streams, such as BY1 in HEN1.

5. Conclusions

In this work, the HEN synthesis with controllability consideration is addressed. Herein, an optimization-based framework is proposed to incorporate the network configuration synthesis and control structure selection as a whole on the basis of the partition of ΔTmin intervals, rather than remaining the unclear relationship between two parts. The influences of ΔTmin on multi-objective optimization problems with the objective of minimizing the RGAn and TAC of HEN are investigated. Additionally, this problem is reduced to a single objective optimization problem by the variations of ΔTmin. In the opposite change region, a Pareto front of objectives is given by the ε-constraint method in order to demonstrate a whole set of the optimal solutions. Moreover, the entropy-weighted double base points method considering the subjective weight is employed to select a relatively optimal solution among all the promising solutions. In the consistent change region, the optimal points obtained by the single objective optimization method correspond to the minimum TAC and minimum RGAn. Finally, the case study is illustrated to demonstrate the effectiveness of the overall optimization framework. For example, TAC of HEN2 (the HEN with the minimum TAC) has improved by 5.17% as compared to HEN1 (the HEN with the minimum RGAn), with only an addition of 5.33% on RGAn.
The main limitation of this work is that the proposed framework must be implemented by a stepwise procedure, in order that the bypass fractions may be restricted to be paired with the nearest end temperature, rather than taking the overall relationship between network configuration and control structure into account. Therefore, our future research directions are drawn for improving the optimization-based method to perform a one-step design.

Author Contributions

Conceptualization, S.G. and C.L.; methodology, C.L.; validation, C.L. and S.G.; formal analysis, C.L. and S.G.; writing—original draft preparation, S.G. and C.L.; writing—review and editing, X.Z., J.W. and S.Z.; supervision, Y.Z.; project administration, S.G. and Y.Z.; funding acquisition, S.G. and Y.Z. All authors have read and agreed to the published version of the manuscript.

Funding

This research was funded by the National Natural Science Foundational of China, grant numbers 22178045, 21878034, and 21776035.

Institutional Review Board Statement

Not applicable.

Informed Consent Statement

Not applicable.

Data Availability Statement

Data and materials are available from the authors upon request.

Conflicts of Interest

The authors declare no conflict of interest.

Nomenclature

Symbols
Aarea of heat exchanger, m2
Bauxiliary coefficient matrix of DP&C model
ccost coefficient, $·kW−1·y−1
Dauxiliary coefficient matrix of DP&C model
Dmauxiliary coefficient matrix of DP&C model
D+/DEuclidean distance
einformation entropy
Fauxiliary variable
Fcph/Fcpcheat capacity flow rate, kW·K−1
gauxiliary variable
hheat transfer film coefficient, kW·m−2·K−1
Hauxiliary variable
Kbypass fraction, %
Mauxiliary parameter
Nauxiliary variable
Nstreamnumber of streams
Nbypassnumber of bypasses
Oauxiliary variable
Pauxiliary variable
Qheat load, kW
rauxiliary parameter
Th/Tcstream temperature for hot and cold sides, K
Vstructure matrix in DP&C model
Xcontrol pairing matrix
zbinary variable indicating the existence of heat exchangers
αcost coefficient related to units, $·kW−1·y−1
ααentropy
βcost coefficient related to heat exchanger area, $·kW−1·y−1
λweighting coefficient, 0 ≤ λ ≤ 1
ε auxiliary parameter
Φ evaluation function
ω weighting coefficient
Superscripts
CUcold utility
HUhot utility
HEheat exchanger
INstream inlet
OUTstream outlet
Subscripts
ihot process stream
jcold process stream
kstage in step-wise superstructure
mrow of stationary gain matrix
ncolumn of stationary gain matrix

Appendix A

B = B 1 + D t 12 ( I D t 22 ) 1 B 2
D t = D t 11 + D t 12 ( I D t 22 ) 1 D t 21
D m = D m 1 + D t 12 ( I D t 22 ) 1 D m 2
( D t 11 D t 12 D t 21 D t 22 ) = V 1 ( d i a g { D t E 1 , D t E 2 , , D t E N } ) V 2
( D m 1 D m 2 ) = V 1 ( d i a g { D m E 1 , D m E 2 , , D m E N } ) V 3
( B 1 B 2 ) = V 1 ( d i a g { B E 1 , B E 2 , , B E N } ) V 4
B = ( ( T h i j k IN , HE T h i j k OUT , HE ) 2 2 ( 1 F c p h i HE ) 2 ( T h i j k IN , HE T c i j k IN , HE ) ( T h i j k IN , HE T h i j k OUT , HE ) ( T c i j k OUT , HE T c i j k IN , HE ) 2 ( 1 F c p c j HE ) 2 ( T h i j k IN , HE T c i j k IN , HE ) ( T h i j k IN , HE T h i j k OUT , HE ) ( T c i j k OUT , HE T c i j k IN , HE ) 2 ( 1 F c p h i HE ) 2 ( T h i j k IN , HE T c i j k IN , HE ) ( T c i j k OUT , HE T c i j k IN , HE ) 2 2 ( 1 F c p c j HE ) 2 ( T h i j k IN , HE T c i j k IN , HE ) )
D t = ( 1 T h i j k IN , HE T h i j k OUT , HE T h i j k IN , HE T c i j k IN , HE T h i j k IN , HE T h i j k OUT , HE T h i j k IN , HE T c i j k IN , HE T c i j k OUT , HE T c i j k IN , HE T h i j k IN , HE T c i j k IN , HE 1 T c i j k OUT , HE T c i j k IN , HE T h i j k IN , HE T c i j k IN , HE )
D m = ( d m 11 d m 12 d m 21 d m 22 )
d m 11 = T h i j k IN , HE T h i j k OUT , HE 2 F c p h i HE ( 2 T h i j k IN , HE T h i j k OUT , HE ( 1 F c p h i HE ) ( T h i j k IN , HE T c i j k IN , HE ) )
d m 12 = ( T h i j k IN , HE T h i j k OUT , HE ) ( T c i j k OUT , HE T c i j k IN , HE ) 2 F c p c j HE ( 1 F c p c j HE ) ( T h i j k IN , HE T c i j k IN , HE )
d m 21 = ( T c i j k OUT , HE T c i j k IN , HE ) ( T h i j k IN , HE T h i j k OUT , HE ) 2 F c p h i HE ( 1 F c p h i HE ) ( T h i j k IN , HE T c i j k IN , HE )
d m 22 = T c i j k OUT , HE T c i j k IN , HE 2 F c p c j HE ( 2 T c i j k OUT , HE T c i j k IN , HE ( 1 F c p c j HE ) ( T h i j k IN , HE T c i j k IN , HE ) )
δ T 1 OUT δ K 1 = ( F 1 , 1 , 1 H 1 , 1 , 2 H 1 , 2 , 1 H 1 , 2 , 2 + F 1 , 1 , 1 H 1 , 1 , 2 H 1 , 2 , 1 H 1 , 2 , 2 H 2 , 2 , 1 P 2 , 1 , 1 N 2 , 1 , 2 O 1 , 1 , 2 F 1 , 1 , 1 H 1 , 2 , 1 H 1 , 2 , 2 H 2 , 2 , 1 P 1 , 1 , 2 P 2 , 1 , 1 N 1 , 1 , 2 N 2 , 1 , 2 + F 1 , 1 , 1 H 1 , 1 , 2 H 1 , 2 , 1 H 1 , 2 , 2 H 2 , 1 , 2 P 2 , 2 , 1 N 2 , 2 , 2 O 1 , 2 , 2 F 1 , 1 , 1 H 1 , 1 , 2 H 1 , 2 , 1 H 2 , 1 , 2 P 1 , 2 , 2 P 2 , 2 , 1 N 1 , 2 , 2 N 2 , 2 , 2 F 1 , 1 , 1 H 1 , 2 , 1 H 2 , 1 , 2 H 2 , 2 , 1 P 1 , 2 , 2 P 2 , 1 , 1 N 1 , 1 , 2 N 2 , 2 , 2 ) ( H 1 , 2 , 1 P 1 , 1 , 1 N 1 , 1 , 2 O 2 , 1 , 1 + H 1 , 1 , 2 P 1 , 2 , 1 N 1 , 2 , 2 O 2 , 2 , 1 + P 1 , 2 , 1 P 2 , 1 , 1 N 1 , 1 , 2 N 2 , 2 , 1 + P 1 , 1 , 2 P 2 , 2 , 1 N 1 , 2 , 2 N 2 , 1 , 2 + H 2 , 2 , 1 P 2 , 1 , 1 N 2 , 1 , 2 O 1 , 1 , 2 + H 2 , 1 , 2 P 2 , 2 , 1 N 2 , 2 , 2 O 1 , 2 , 2 + H 1 , 1 , 2 H 1 , 2 , 1 P 1 , 1 , 1 P 2 , 2 , 1 N 1 , 2 , 2 N 2 , 1 , 2 O 1 , 1 , 2 O 2 , 1 , 1 H 1 , 2 , 1 P 1 , 1 , 1 P 1 , 1 , 2 P 2 , 2 , 1 N 1 , 1 , 2 N 1 , 2 , 2 N 2 , 1 , 2 O 2 , 1 , 1 H 1 , 1 , 2 H 2 , 2 , 1 P 1 , 2 , 1 P 2 , 1 , 1 N 1 , 2 , 2 N 2 , 1 , 2 O 1 , 1 , 2 O 2 , 2 , 1 + H 1 , 1 , 2 P 1 , 2 , 1 P 2 , 1 , 1 P 2 , 2 , 1 N 1 , 2 , 2 N 2 , 1 , 2 N 2 , 2 , 1 O 1 , 1 , 2 H 1 , 2 , 1 H 2 , 1 , 2 P 1 , 1 , 1 P 2 , 2 , 1 N 1 , 1 , 2 N 2 , 2 , 2 O 1 , 2 , 2 O 2 , 1 , 1 + H 2 , 2 , 1 P 1 , 1 , 2 P 1 , 2 , 1 P 2 , 1 , 1 N 1 , 1 , 2 N 1 , 2 , 2 N 2 , 1 , 2 O 2 , 2 , 1 P 1 , 1 , 2 P 1 , 2 , 1 P 2 , 1 , 1 P 2 , 2 , 1 N 1 , 1 , 2 N 1 , 2 , 2 N 2 , 1 , 2 N 2 , 2 , 1 + H 2 , 1 , 2 H 2 , 2 , 1 P 1 , 2 , 1 P 2 , 1 , 1 N 1 , 1 , 2 N 2 , 2 , 2 O 1 , 2 , 2 O 2 , 2 , 1 H 2 , 1 , 2 P 1 , 2 , 1 P 2 , 2 , 1 P 2 , 2 , 1 N 1 , 1 , 2 N 2 , 2 , 1 N 2 , 2 , 2 O 1 , 2 , 2 1 )
where Fijk, Hijk, Nijk, Oijk, and Pijk are auxiliary variables, which are defined as follows [23]:
F i j k = ( T h i j k IN , HE T h i j k OUT , HE ) 2 2 ( 1 K i j k H ) 2 ( T h i j k I N , H E T c i j k I N , H E )
H i j k = 1 T h i j k I N , H E T h i j k O U T , H E T h i j k I N , H E T c i j k I N , H E
N i j k = T c i j k IN , HE T c i j k OUT , HE T c i j k IN , HE T h i j k IN , HE
O i j k = 1 T c i j k IN , HE T c i j k OUT , HE T c i j k IN , HE T h i j k IN , HE
P i j k = T h i j k I N , H E T h i j k O U T , H E T h i j k I N , H E T c i j k I N , H E
Table A1. General results for the HEN with optimal solutions.
IntervalHeat Exchanger Area/(m2)Heater or Cooler Area/(m2)TAC/($·y−1)
HE1HE2HE3
I (5~12 K)25.2039.515.330.80, 3.21108,227
II (12~28 K)26.805.3811.171.27, 4.16114,126
III (28~40 K)2.844.4722.061.14, 3.90124,415

References

  1. Chen, G.Q.; Wu, X.F. Energy overview for globalized world economy: Source, supply chain and sink. Renew. Sustain. Energy Rev. 2017, 69, 735–749. [Google Scholar] [CrossRef]
  2. Wang, B.H.; Arsenyeva, O.; Zeng, M.; Klemeš, J.J.; Varbanov, P.S. An advanced Grid Diagram for heat exchanger network retrofit with detailed plate heat exchanger design. Energy 2022, 248, 123485. [Google Scholar] [CrossRef]
  3. Leitold, D.; Vathy-Fogarassy, A.; Abonyi, J. Design-oriented structural controllability and observability analysis of heat exchanger networks. Chem. Eng. Trans. 2018, 70, 595–600. [Google Scholar] [CrossRef]
  4. Trainor, M.; Giannakeas, V.; Kiss, C.; Ricardez-Sandoval, L.A. Optimal process and control design under uncertainty: A methodology with robust feasibility and stability analyses. Chem. Eng. Sci. 2013, 104, 1065–1080. [Google Scholar] [CrossRef]
  5. Escobar, M.; Trierweiler, J.O.; Grossmann, I.E. Simultaneous synthesis of heat exchanger networks with operability considerations: Flexibility and controllability. Comput. Chem. Eng. 2013, 55, 158–180. [Google Scholar] [CrossRef] [Green Version]
  6. Gu, S.W.; Zhang, L.; Zhuang, Y.; Li, W.D.; Du, J. Two-tier control structure design methodology applied to heat exchanger networks. Chin. J. Chem. Eng. 2022, 47, 231–244. [Google Scholar] [CrossRef]
  7. Feng, Z.Y.; Guo, H.R.; She, J.H.; Xu, L. Weighted sensitivity design of multivariable PID controllers via a new iterative LMI approach. J. Process Control 2022, 110, 24–34. [Google Scholar] [CrossRef]
  8. Feng, Z.M.; Wang, W.H.; Xu, D.; Rangaiah, G.P.; Dong, L.C. Dynamic controllability of temperature difference control for the operation of double liquid-only side-stream distillation. Comput. Chem. Eng. 2022, 164, 107870. [Google Scholar] [CrossRef]
  9. Luppi, P.A.; Braccia, L.; Zumoffen, D. Optimal measurement selection and principal component analysis-based combination as controlled variables. Ind. Eng. Chem. Res. 2021, 60, 457–472. [Google Scholar] [CrossRef]
  10. Bottari, A.; Marchetti, P.A.; Marchetti, A.G. Self-optimizing steady-state back-off approach for control structure selection. Ind. Eng. Chem. Res. 2019, 58, 13699–13717. [Google Scholar] [CrossRef]
  11. Luppi, P.A.; Braccia, L.; Patrone, M.; Zumoffen, D. Control allocation based fault-tolerant strategy for a bio-ethanol processor system integrated to a PEM fuel cell. J. Process Control 2019, 81, 40–53. [Google Scholar] [CrossRef]
  12. He, M.J.; Cai, W.J.; Ni, W.; Xie, L.H. RNGA based control system configuration for multivariable processes. J. Process Control 2009, 19, 1036–1042. [Google Scholar] [CrossRef]
  13. Luyben, W.L. Simplified plantwide control structure for the diethyl oxalate process. Comput. Chem. Eng. 2019, 126, 451–464. [Google Scholar] [CrossRef]
  14. Patilas, C.S.; Kookos, I.K. A quadratic approximation of the back-off methodology for the control structure selection problem. Comput. Chem. Eng. 2020, 143, 107114. [Google Scholar] [CrossRef]
  15. Yin, X.Y.; Liu, J.F. Input-output pairing accounting for both structure and strength in coupling. AIChE J. 2017, 63, 1226–1235. [Google Scholar] [CrossRef]
  16. Kookos, I.K.; Perkins, J.D. Heuristic-Based Mathematical Programming Framework for Control Structure Selection. Ind. Eng. Chem. Res. 2001, 40, 2079–2088. [Google Scholar] [CrossRef]
  17. Elsheikh, A.H.; Panchal, H.N.; Sengottain, S.; Alsaleh, N.A.; Ahmadein, M. Applications of Heat Exchanger in Solar Desalination: Current Issues and Future Challenges. Water 2022, 14, 852. [Google Scholar] [CrossRef]
  18. Elsheikh, A.H.; Panchal, H.; Ahmadein, M.; Mosleh, A.O.; Sadasivuni, K.K.; Alsaleh, N.A. Productivity forecasting of solar distiller integrated with evacuated tubes and external condenser using artificial intelligence model and moth-flame optimizer. Case Stud. Therm. Eng. 2021, 28, 101671. [Google Scholar] [CrossRef]
  19. Faes, W.; Bael, J.V.; Lecompte, S.; Verbeken, K.; Paepe, M.D. Optimization of heat exchanger design taking corrosion into account. Therm. Sci. Eng. Prog. 2022, 30, 101277. [Google Scholar] [CrossRef]
  20. Bachler, S.; Wurm, J.; Woittennek, F. Open-loop temperature control for a distributed parameter model of a pipe. IFAC-Pap. 2020, 53, 7765–7770. [Google Scholar] [CrossRef]
  21. Pekař, L.; Prokop, R. Algebraic robust control of a closed circuit heating-cooling system with a heat exchanger and internal loop delays. Appl. Therm. Eng. 2017, 113, 1464–1474. [Google Scholar] [CrossRef]
  22. Bakošová, M.; Oravec, J. Robust model predictive control for heat exchanger network. Appl. Therm. Eng. 2014, 73, 924–930. [Google Scholar] [CrossRef]
  23. Liu, L.L.; Li, C.Y.; Gu, S.W.; Zhang, L.; Du, J. Optimization-based framework for the synthesis of heat exchanger networks incorporating controllability. Energy 2020, 208, 118292. [Google Scholar] [CrossRef]
  24. Gu, S.W.; Zhang, L.; Zhuang, Y.; Du, J.; Shao, C. Integrated synthesis and control of heat exchanger networks with dynamic flexibility consideration. Appl. Therm. Eng. 2023, 218, 119304. [Google Scholar] [CrossRef]
  25. Kang, L.X.; Liu, Y.Z.; Liang, X.Q. Multi-objective optimization of heat exchanger networks based on analysis of minimum temperature difference and accumulated CO2 emissions. Appl. Therm. Eng. 2015, 87, 736–748. [Google Scholar] [CrossRef]
  26. Yee, T.F.; Grossmann, I.E. Simultaneous optimization models for heat integrations-II. Heat exchanger network synthesis. Comput. Chem. Eng. 1990, 14, 1165. [Google Scholar] [CrossRef]
  27. Yan, Q.Z.; Yang, Y.H.; Huang, Y.L. Cost-effective bypass design of highly controllable heat-exchanger networks. AIChE J. 2001, 47, 2253–2276. [Google Scholar] [CrossRef]
  28. Zhu, Q.; Ren, Z.F. A double four-point probe method for reliable measurement of energy conversion efficiency of thermoelectric materials. Energy 2020, 191, 116599. [Google Scholar] [CrossRef]
  29. Ehrgott, M. Multicriteria Optimization, 2nd ed.; Springer: Berlin/Heidelberg, Germany, 2010; pp. 121–155. [Google Scholar]
  30. Zhang, Q.; Grossmann, I.E.; Lima, R.M. On the relation between flexibility analysis and robust optimization for linear systems. AIChE J. 2016, 62, 3109–3123. [Google Scholar] [CrossRef]
  31. Kariwala, V.; Cao, Y. Multiobjective Control Structure Design: A Branch and Bound Approach. Ind. Eng. Chem. Res. 2012, 51, 6064–6070. [Google Scholar] [CrossRef]
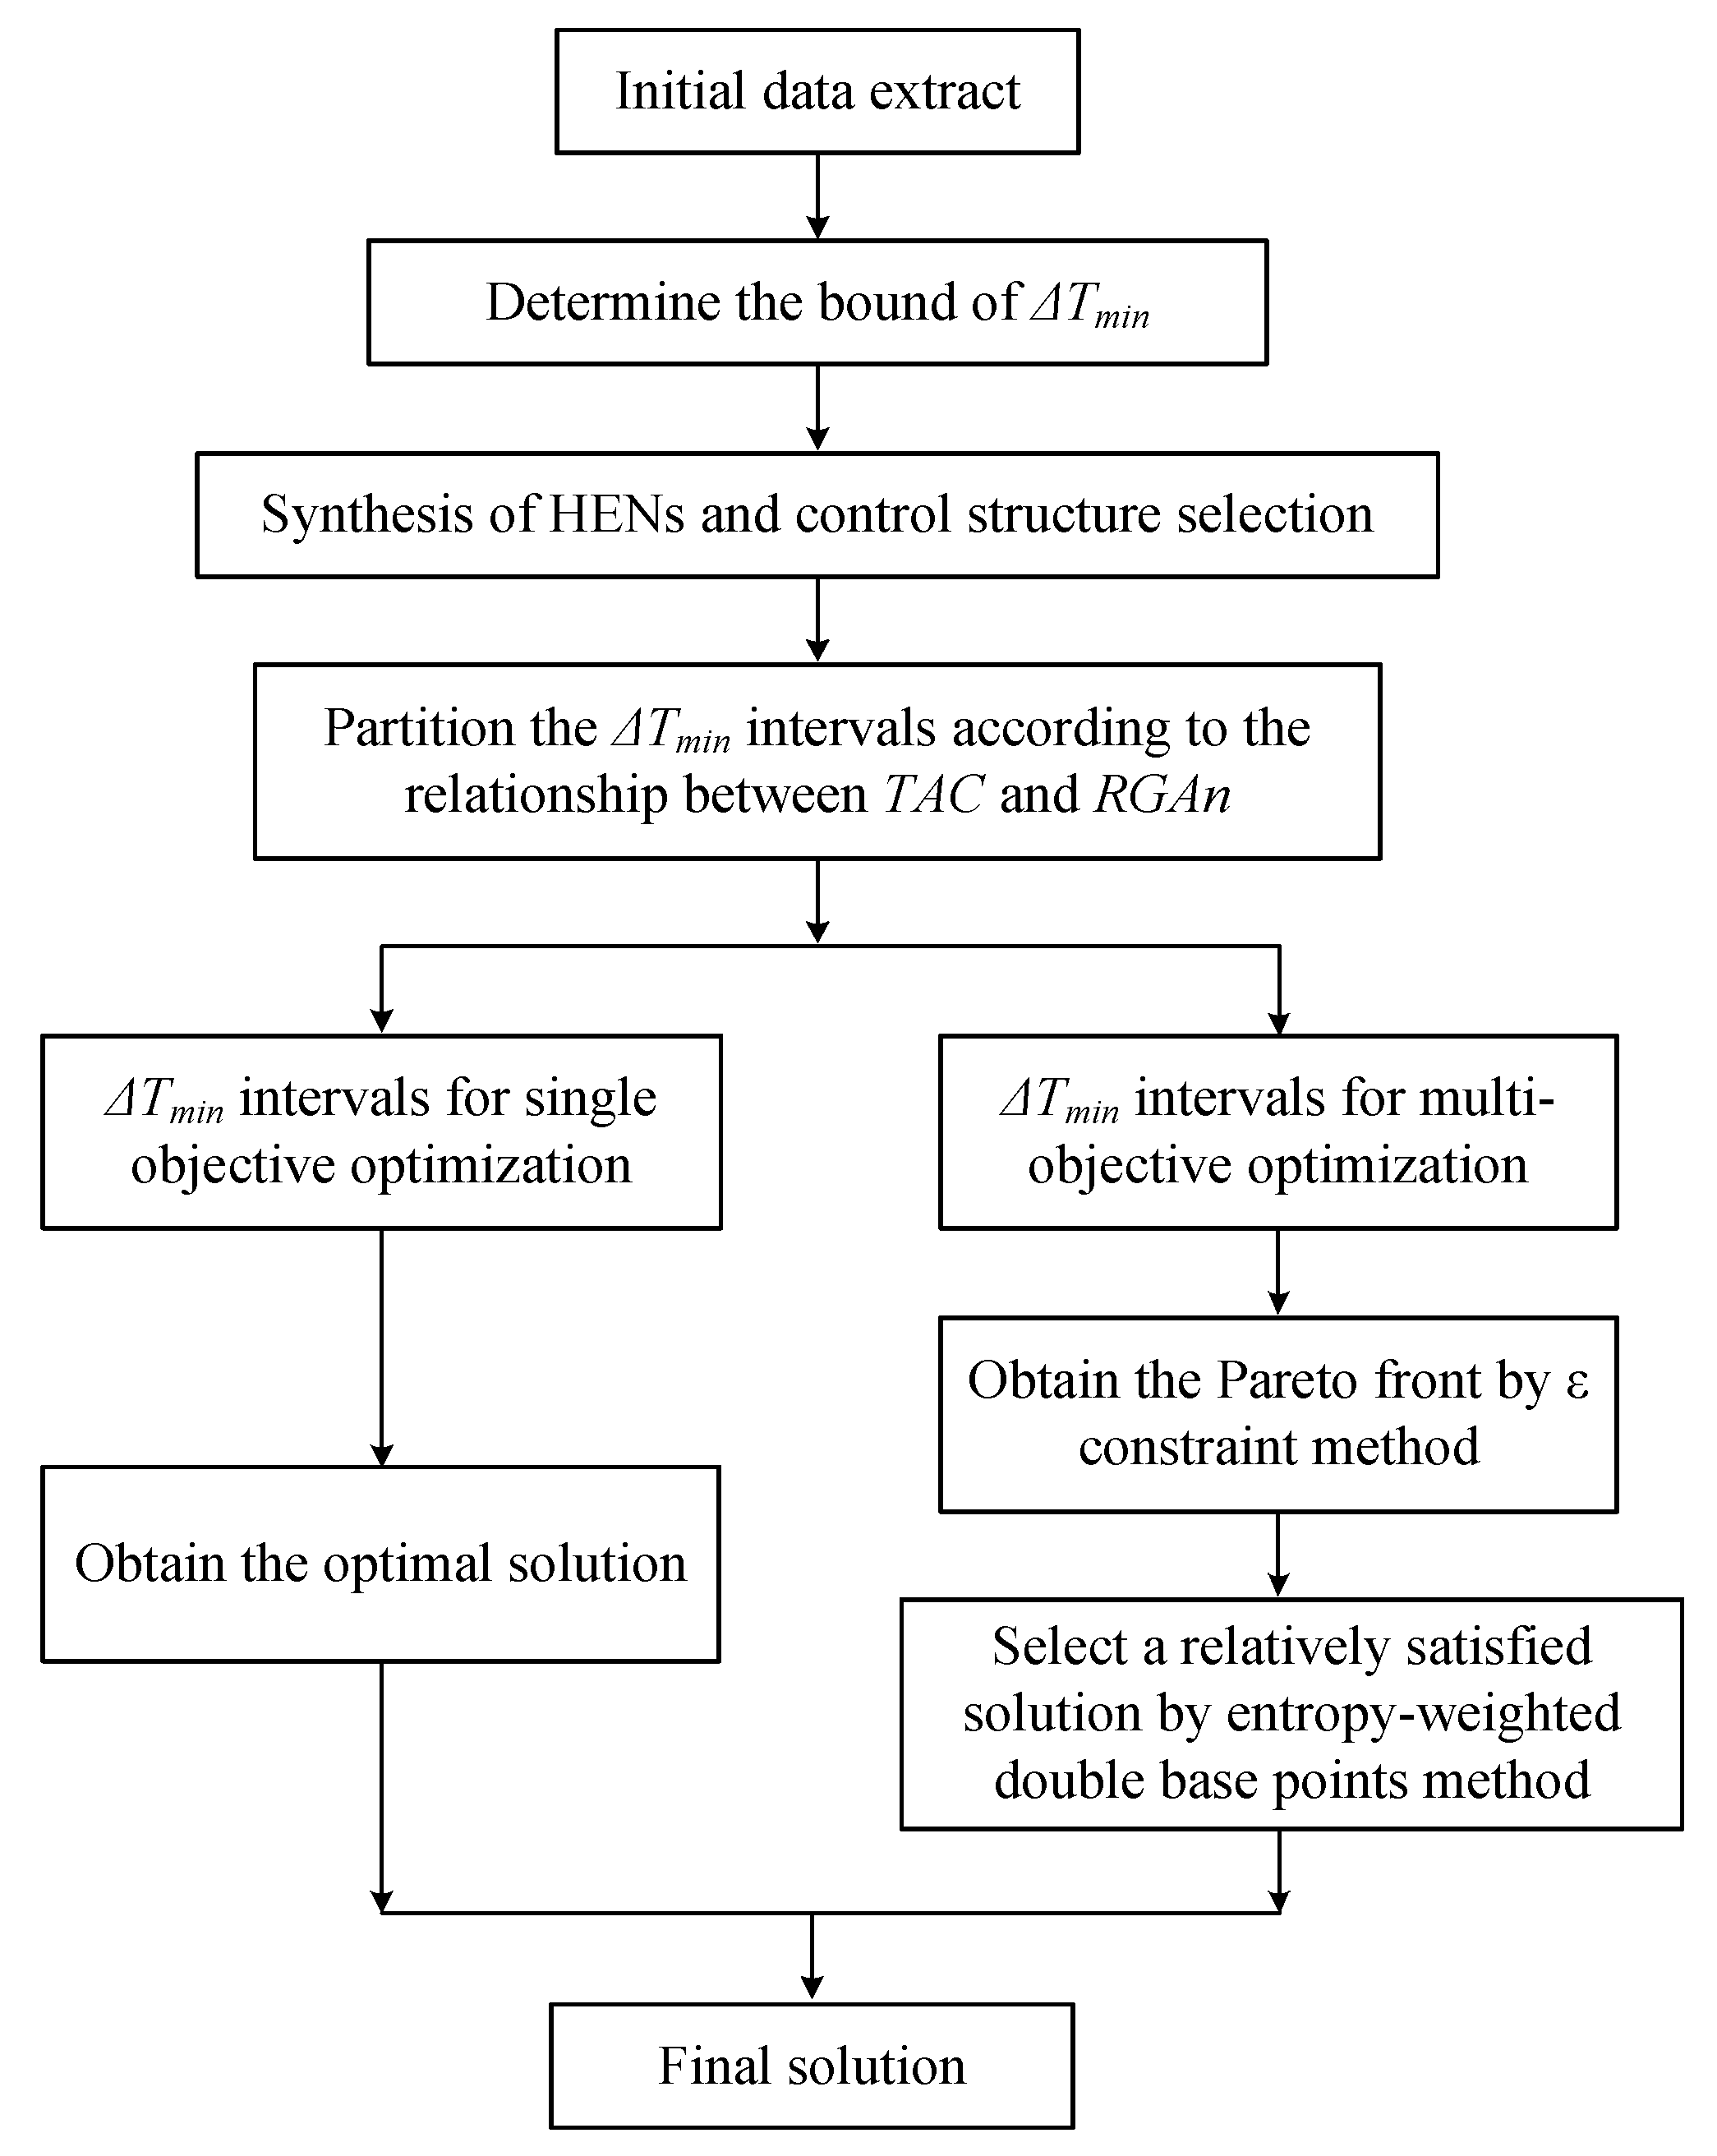
Figure 1. Strategy for synthesis of HENs considering economic and controllability.
Sustainability 14 15128 g001
Figure 2. Non-split two-stage superstructure involving all the potential bypasses.
Sustainability 14 15128 g002
Figure 3. Schematic diagram of the interval division of the optimization problem.
Sustainability 14 15128 g003
Figure 4. Variations of TAC and RGAn with ΔTmin.
Sustainability 14 15128 g004
Figure 5. Variations of TAC and RGAn with ΔTmin (22–23 K).
Sustainability 14 15128 g005
Figure 6. Heat exchanger network with optimal solution in region II.
Sustainability 14 15128 g006
Figure 7. Pareto front of TAC and RGAn of the heat exchanger network in region I.
Sustainability 14 15128 g007
Figure 8. Heat exchanger network with a compromised solution in region I.
Sustainability 14 15128 g008
Figure 9. Heat exchanger network with a compromised solution in region III.
Sustainability 14 15128 g009
Figure 10. Possible disturbances propagating to bypass BY3 in HEN1.
Sustainability 14 15128 g010
Table 1. Data of process streams at nominal condition.
StreamTIN (K)TOUT (K)Fcp (kW·K−1)h (kW·m−2·K−1)
H15123937.0321.530
H25124218.4401.250
C13794236.0961.470
C239952310.0001.500
Hot Utility850850-----2.800
Cold Utility293313-----3.000
Table 2. Variations of TAC and RGAn of heat exchanger network with ΔTmin.
IntervalOptimization Problem TypeΔTmin of Optimal Solution/(K)TAC/($·y−1)RGAn
I (5~12 K)Multi-objective optimization7108,2274.464
II (12~28 K)Single objective optimization23114,1284.226
III (28~40 K)Multi-objective optimization37124,4104.597
Table 3. Disturbance intensity in all the bypass fractions.
K1K2K3K4
HEN12405
HEN28141
HEN31341
Publisher’s Note: MDPI stays neutral with regard to jurisdictional claims in published maps and institutional affiliations.