Land Use Carbon Emission Measurement and Risk Zoning under the Background of the Carbon Peak: A Case Study of Shandong Province, China
Abstract
:1. Introduction
2. Materials and Methods
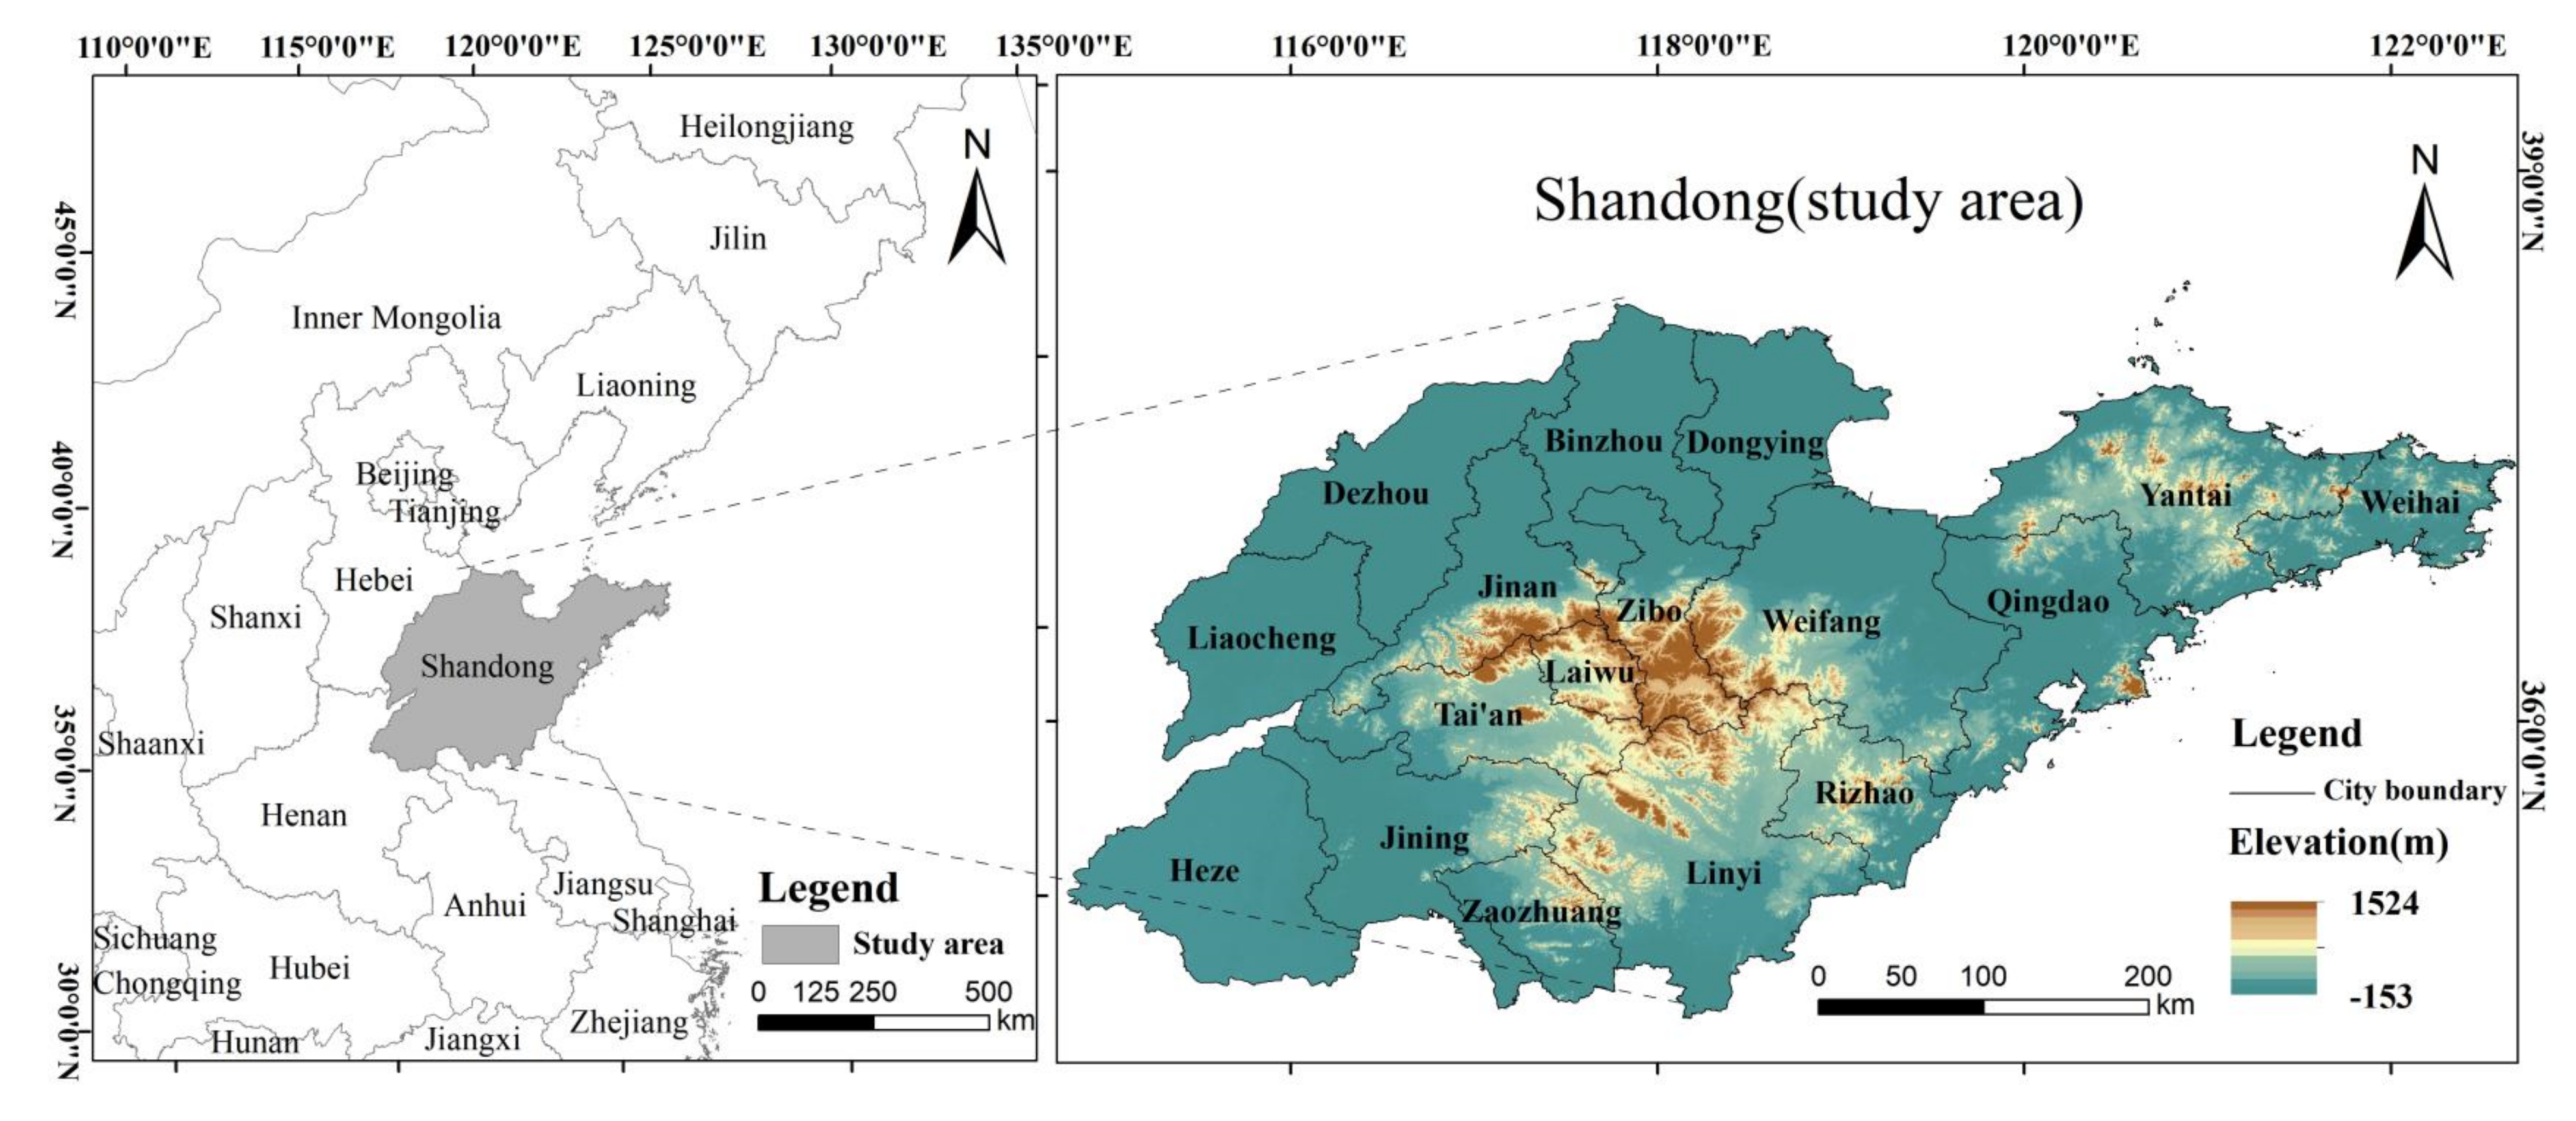
2.1. Study Area
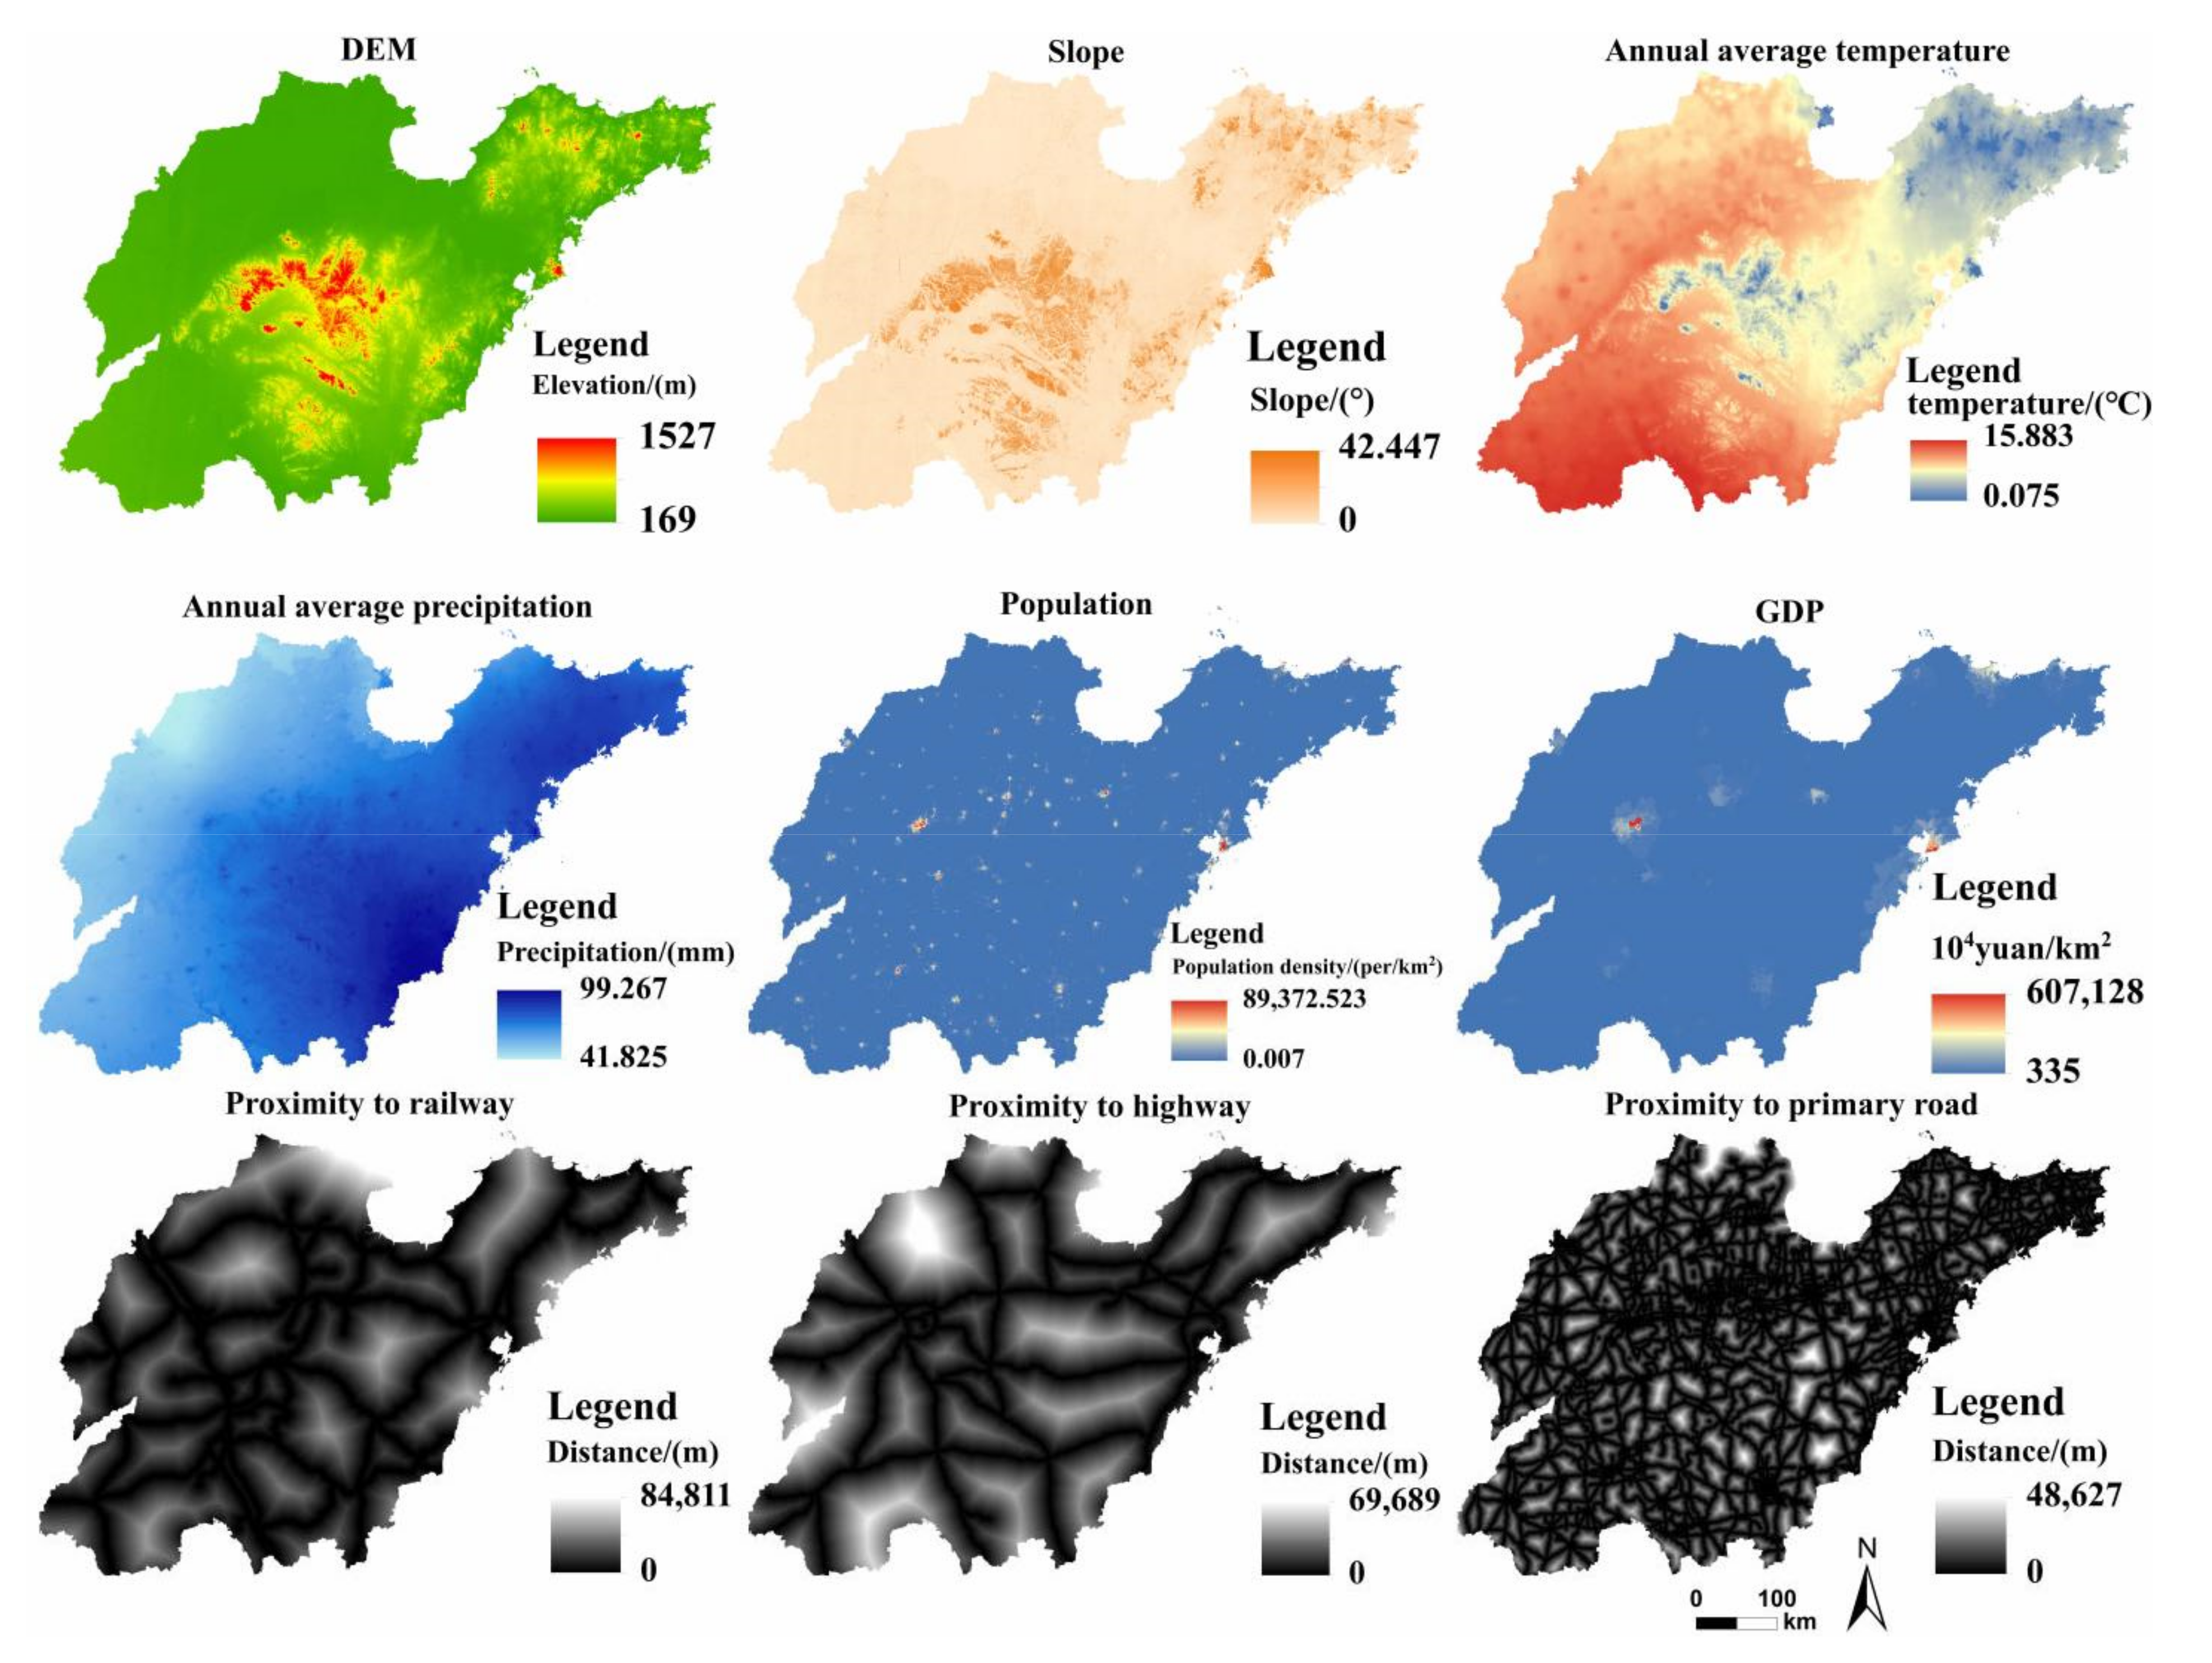
2.2. Data Sources
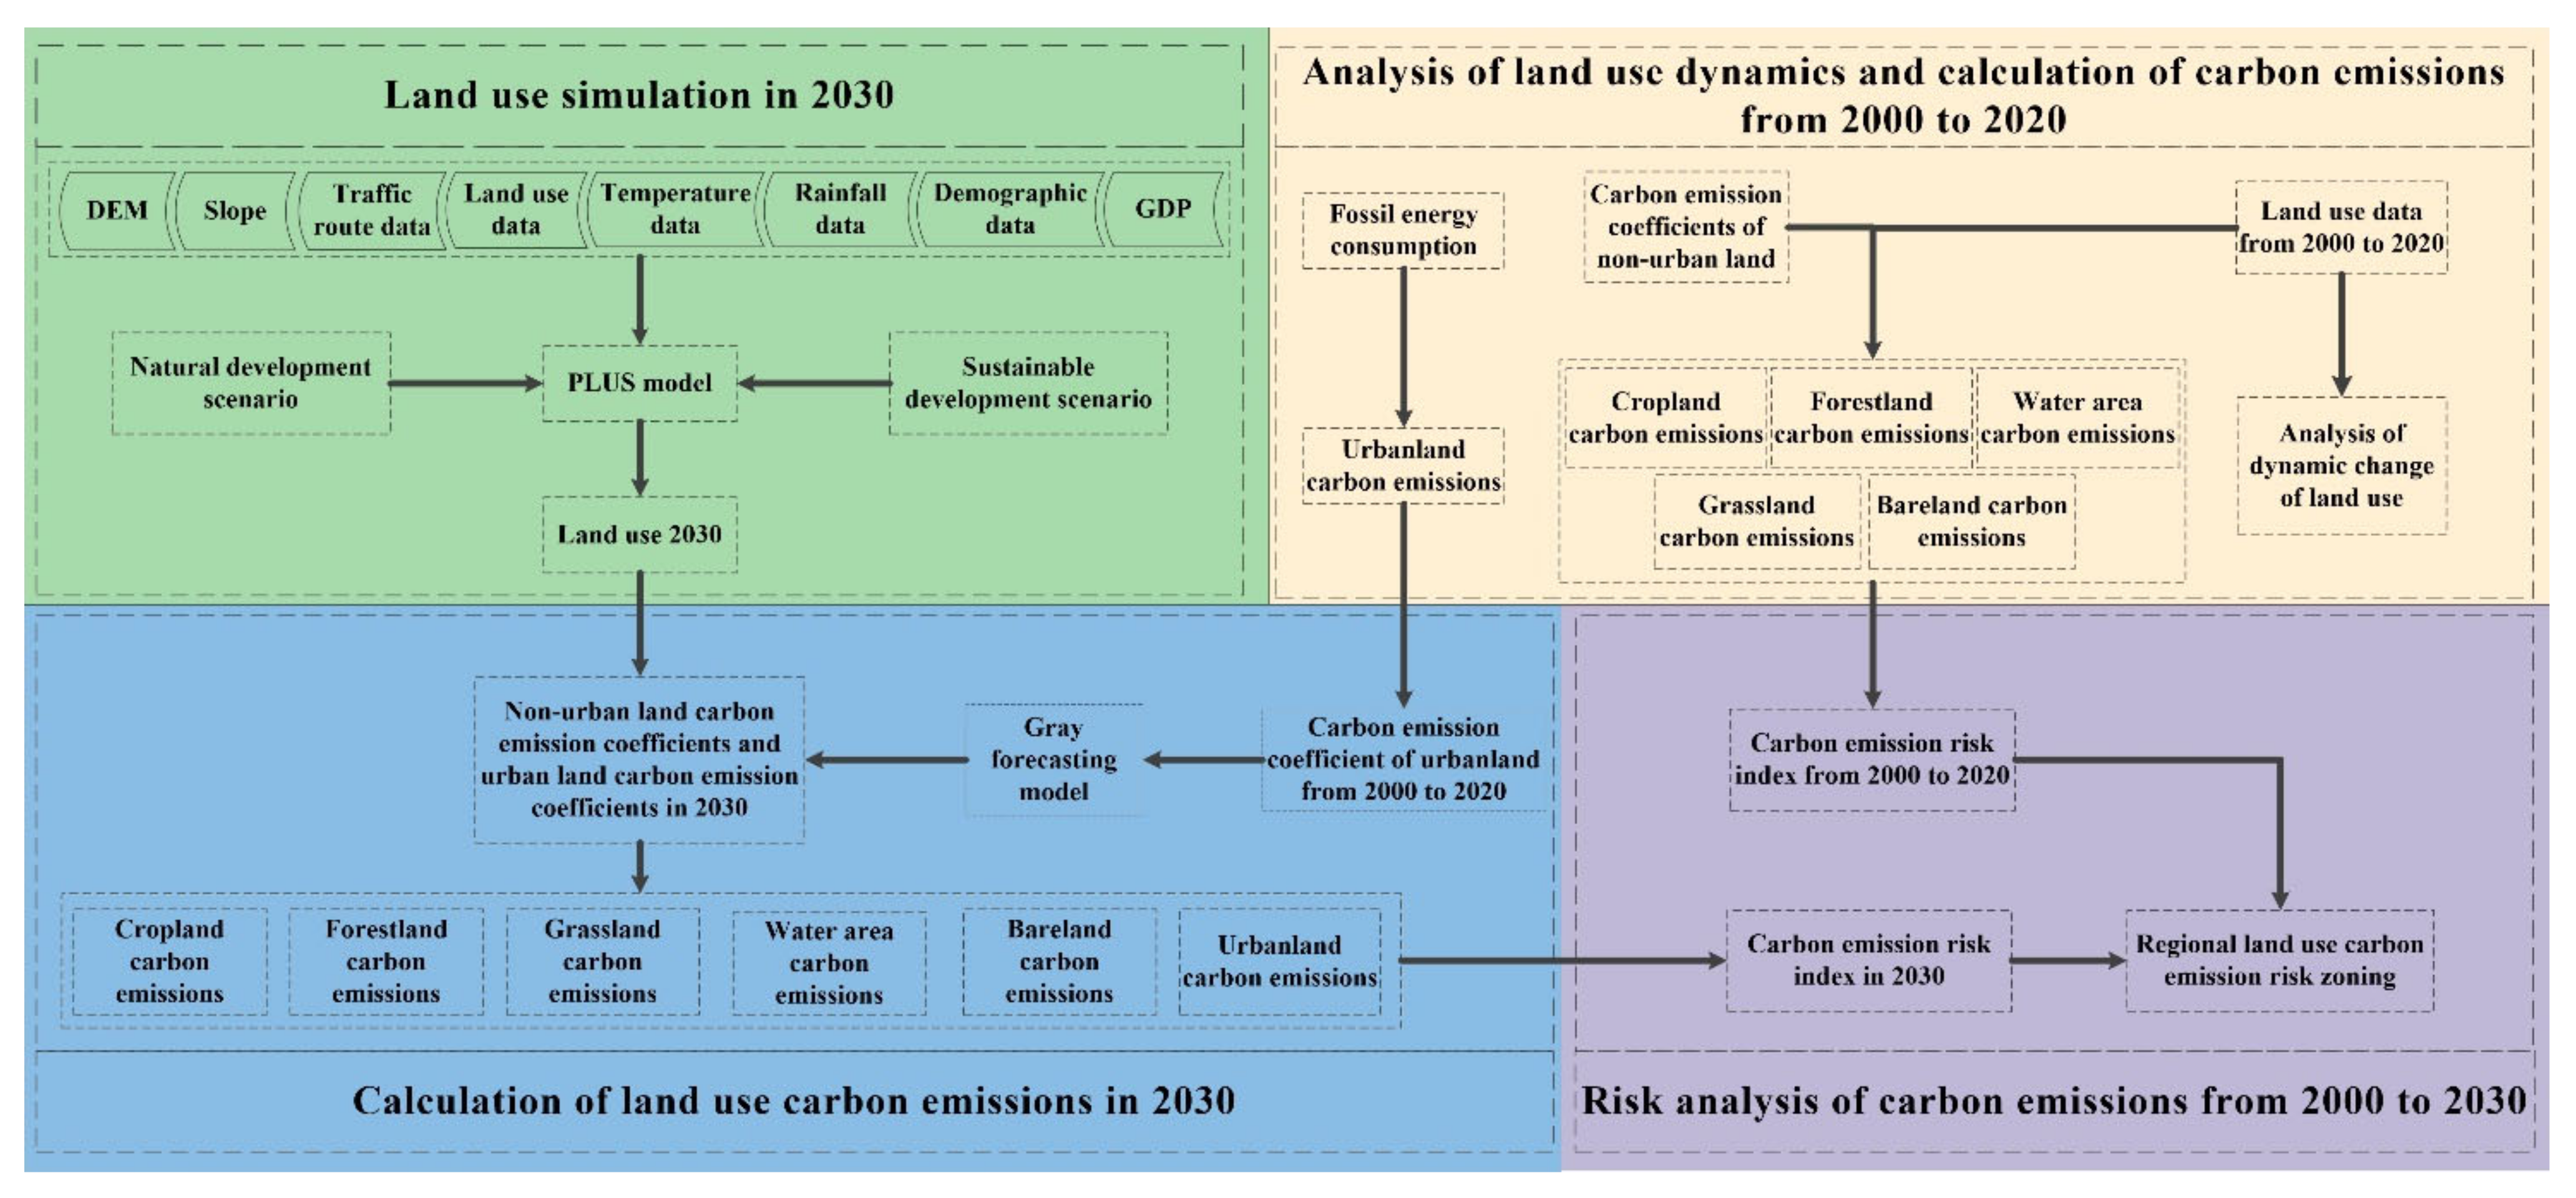
2.3. Methodological Framework
2.3.1. Analysis of Land Use Quantity Change
2.3.2. Analysis of Land Use Structure Change
2.3.3. LUCE Calculation
2.3.4. Gray Forecasting Model
2.3.5. PLUS Model
2.3.6. LUCE Risk Indexes Calculation
3. Results
3.1. Temporal and Spatial Dynamic Changes of Land Use
3.1.1. Land Quantity Change
3.1.2. Land Structure Change
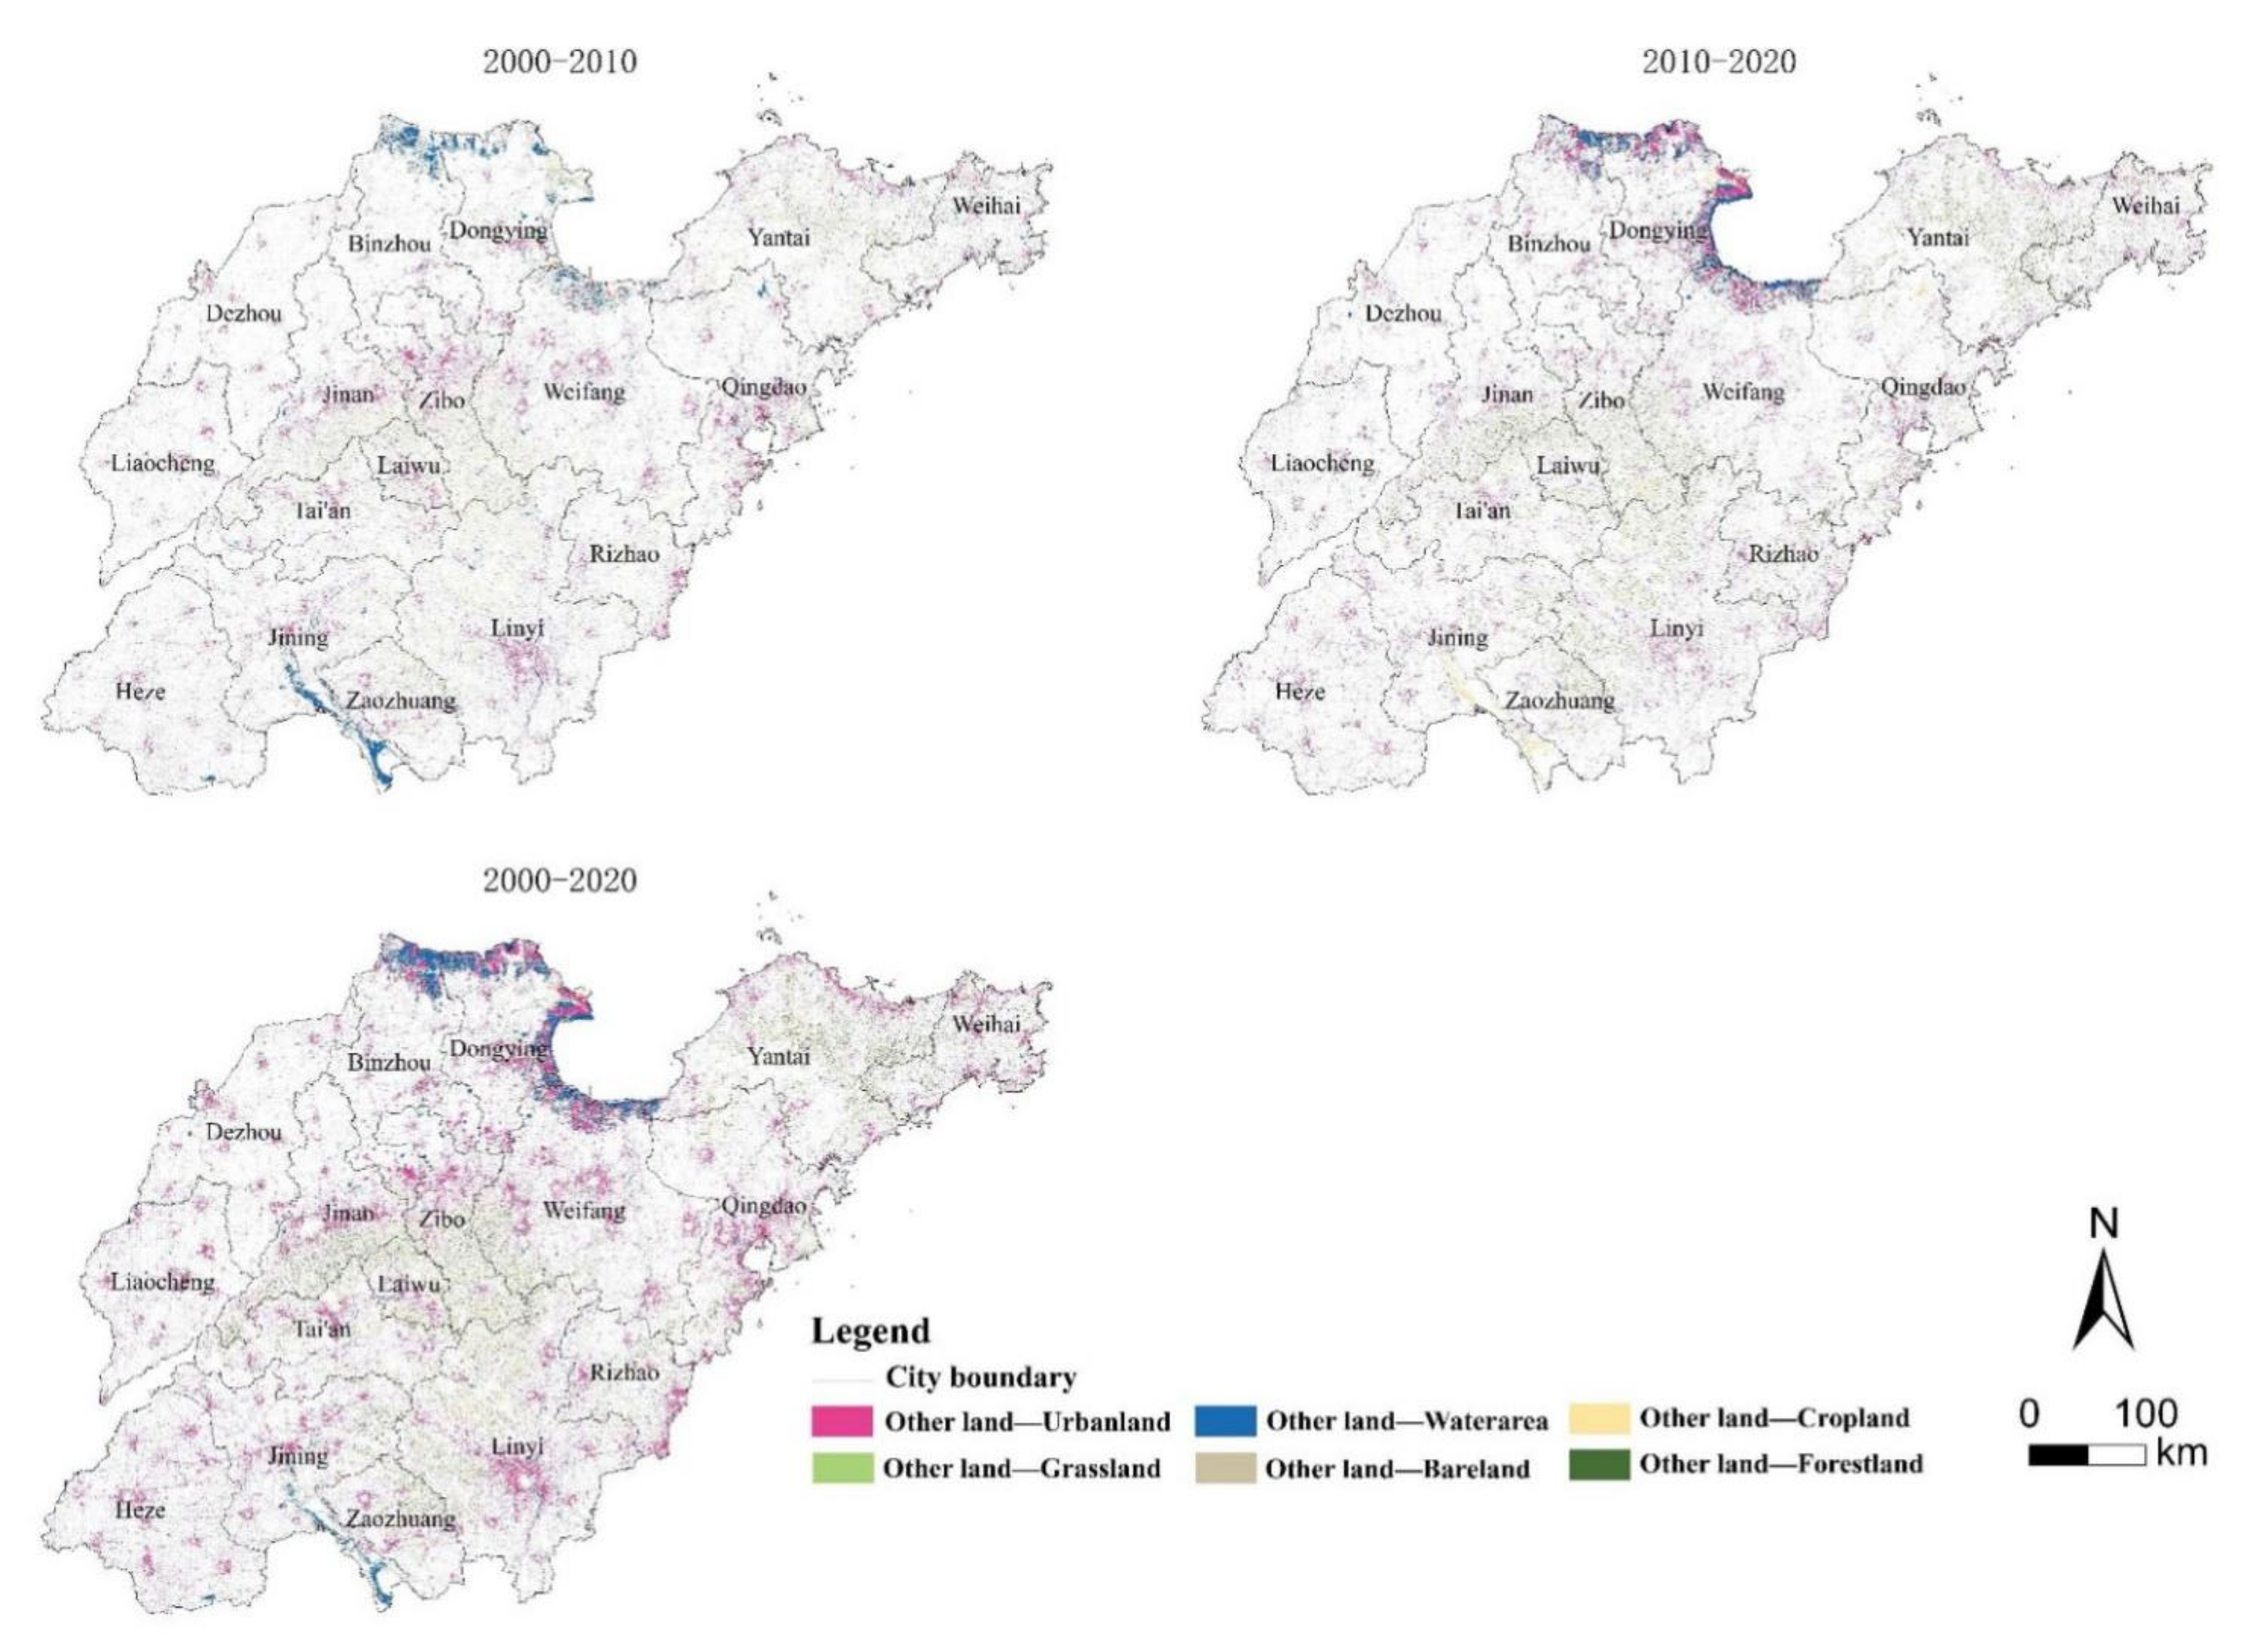
3.1.3. Land Spatial Change
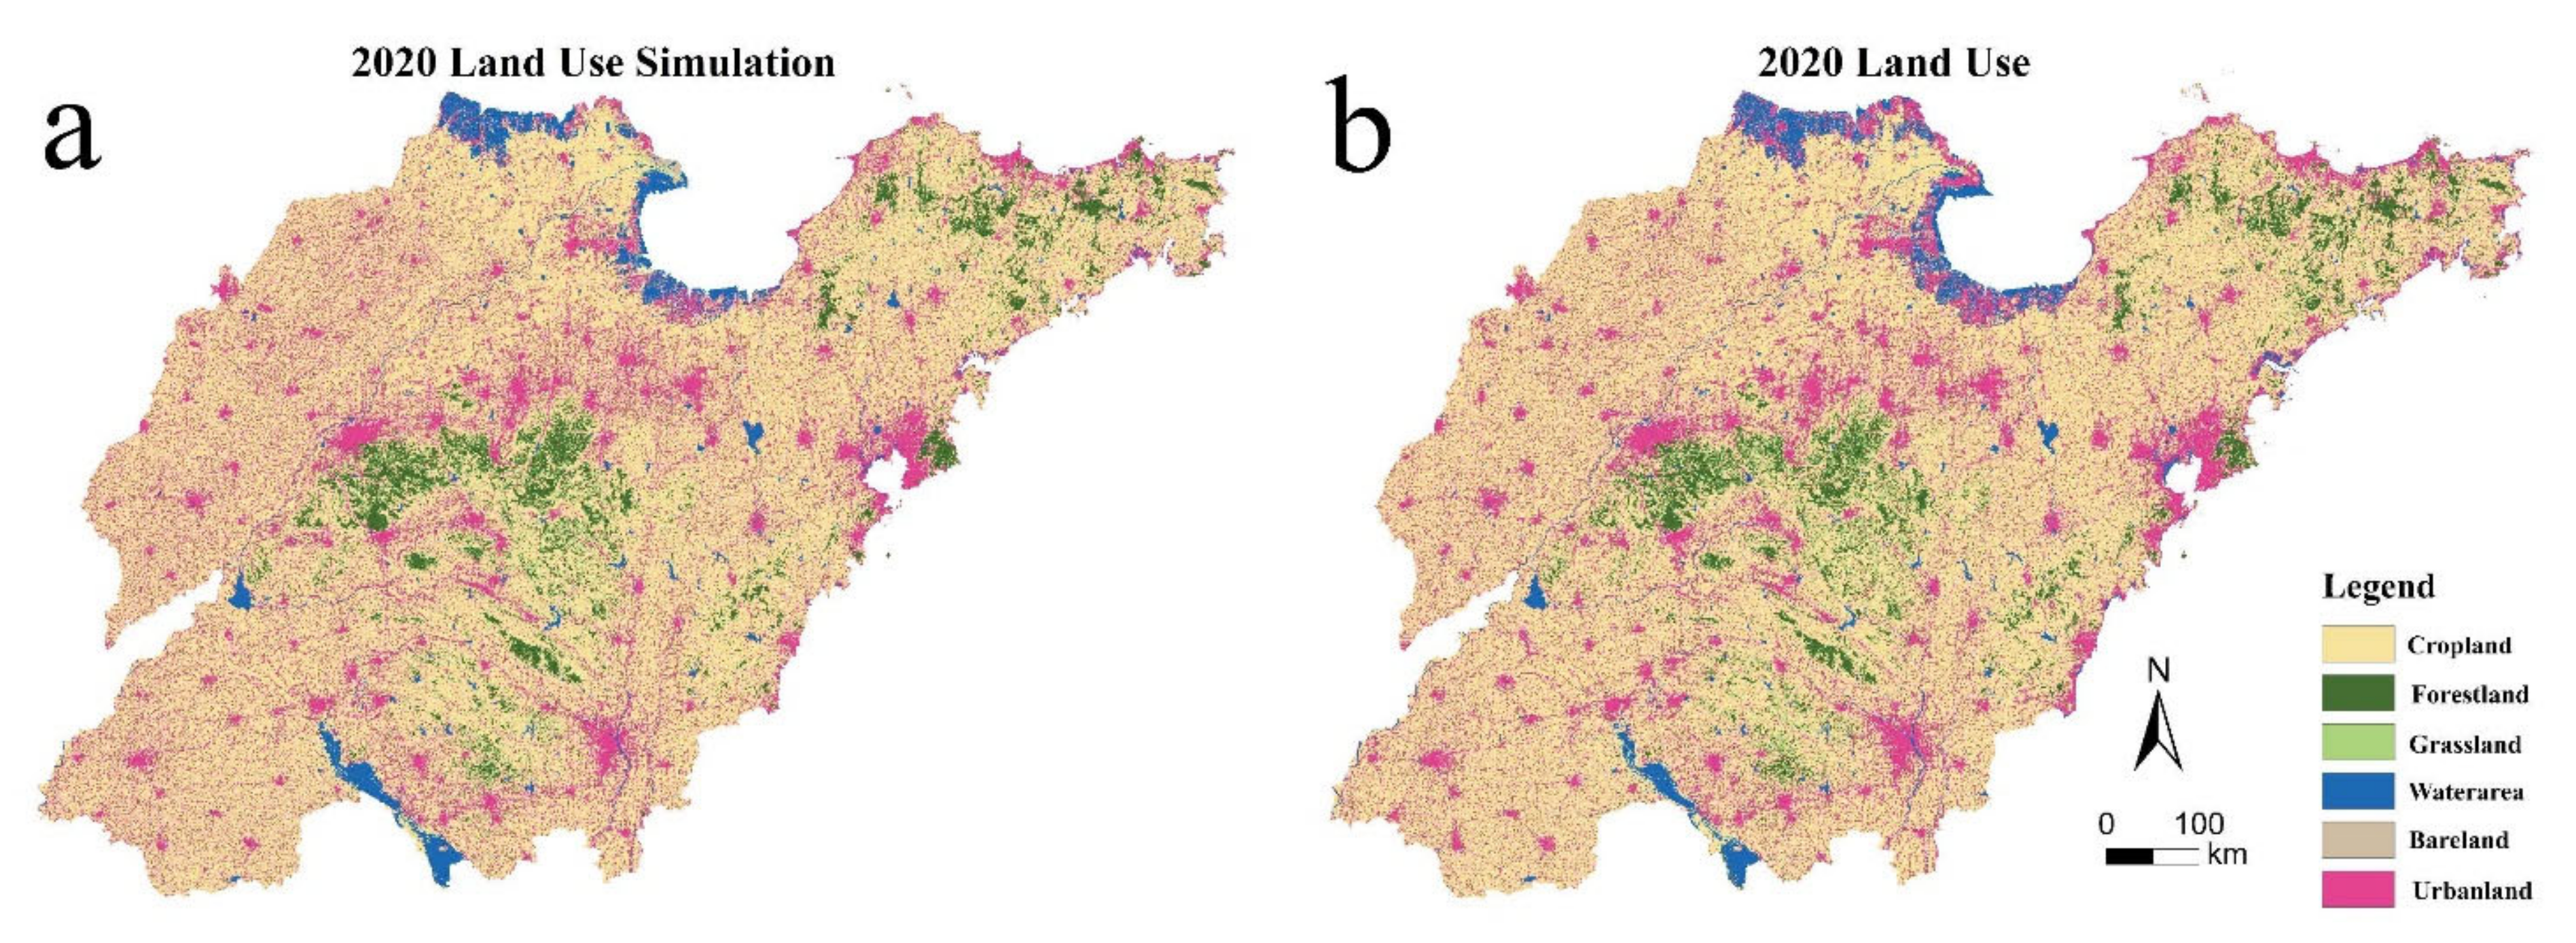
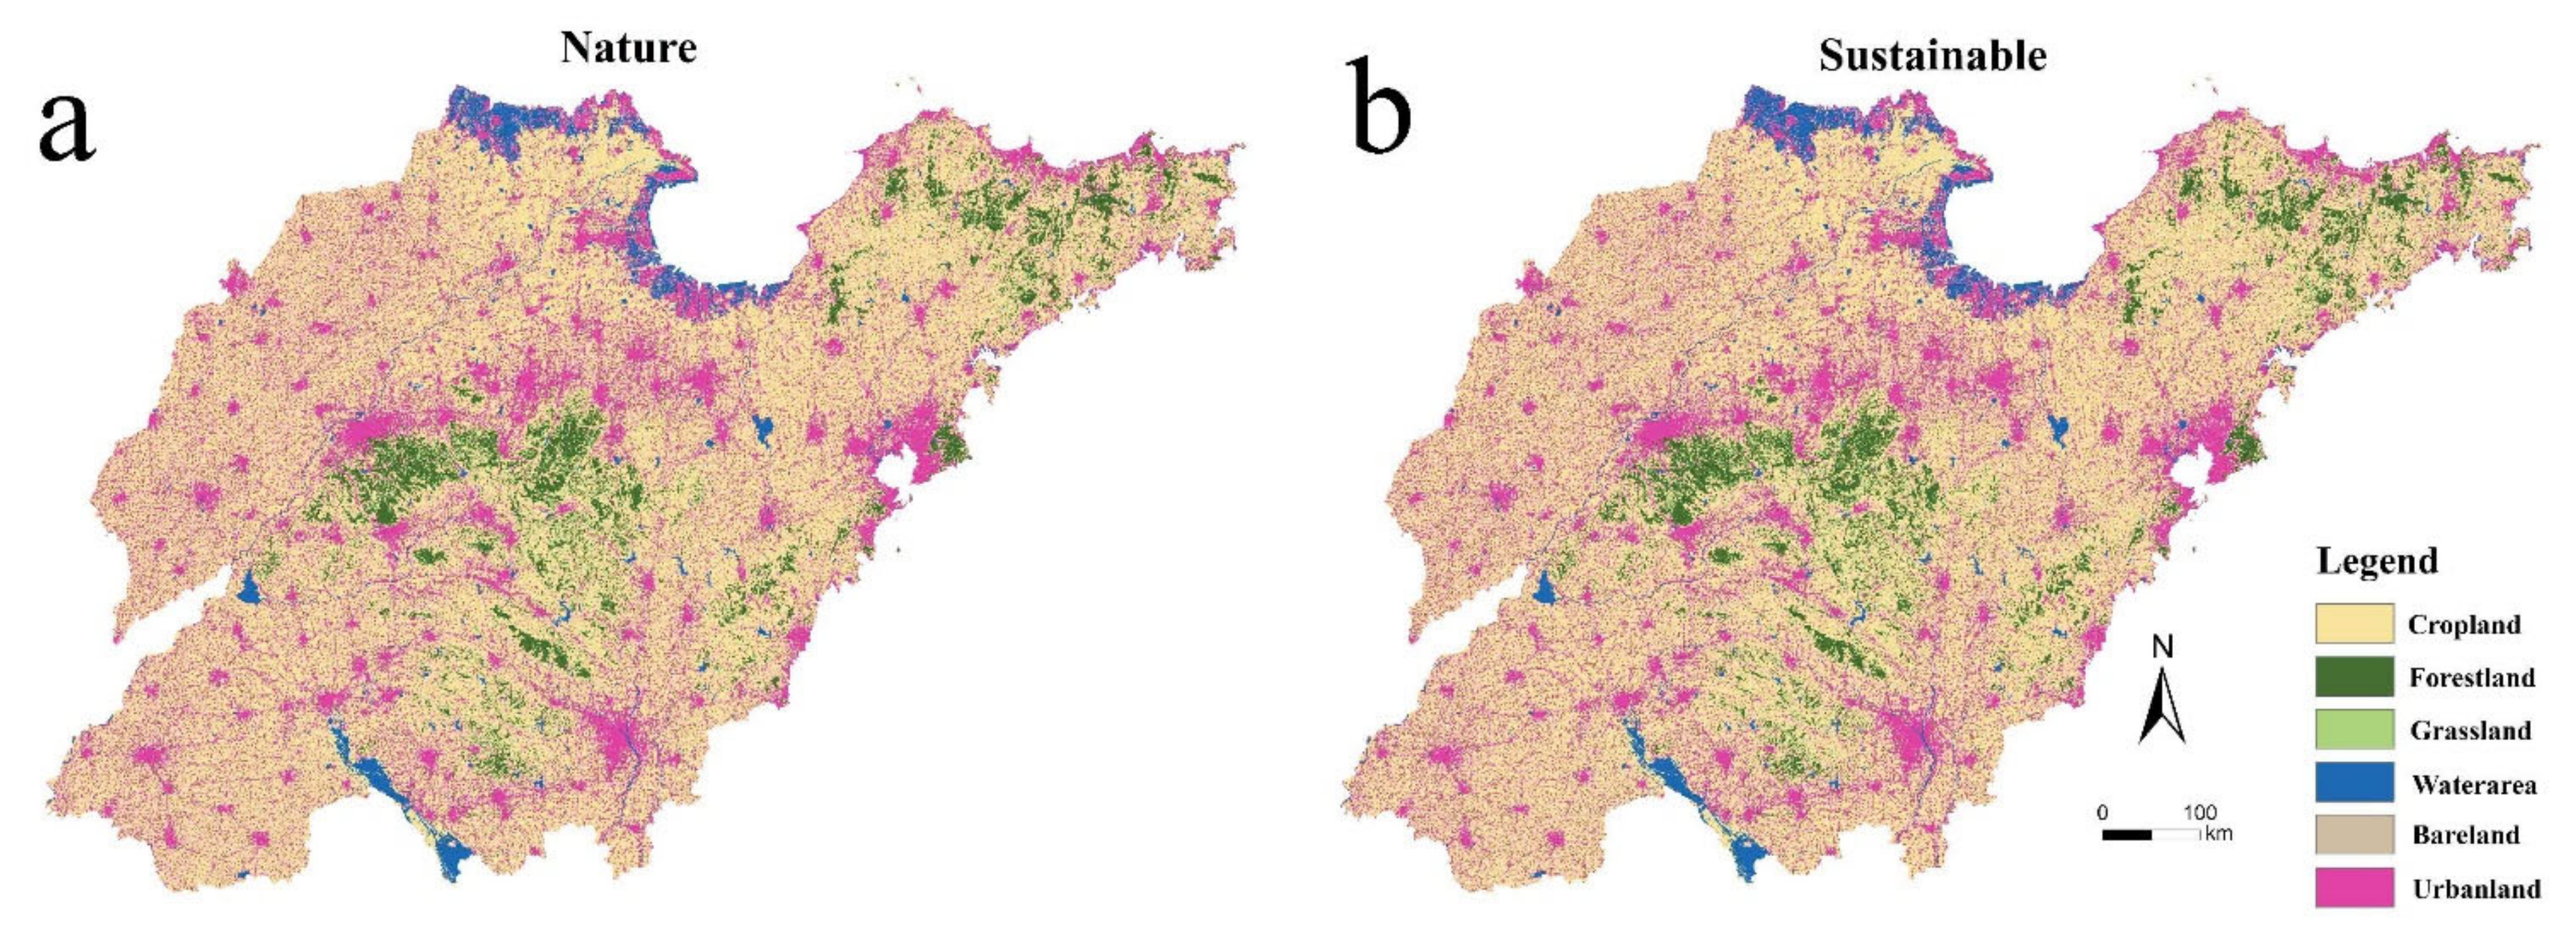
3.2. Land Use Scenario Simulation
3.3. Land Use Carbon Emissions
3.4. Classification of LUCE Risk Areas
4. Discussion
5. Conclusions
- (1)
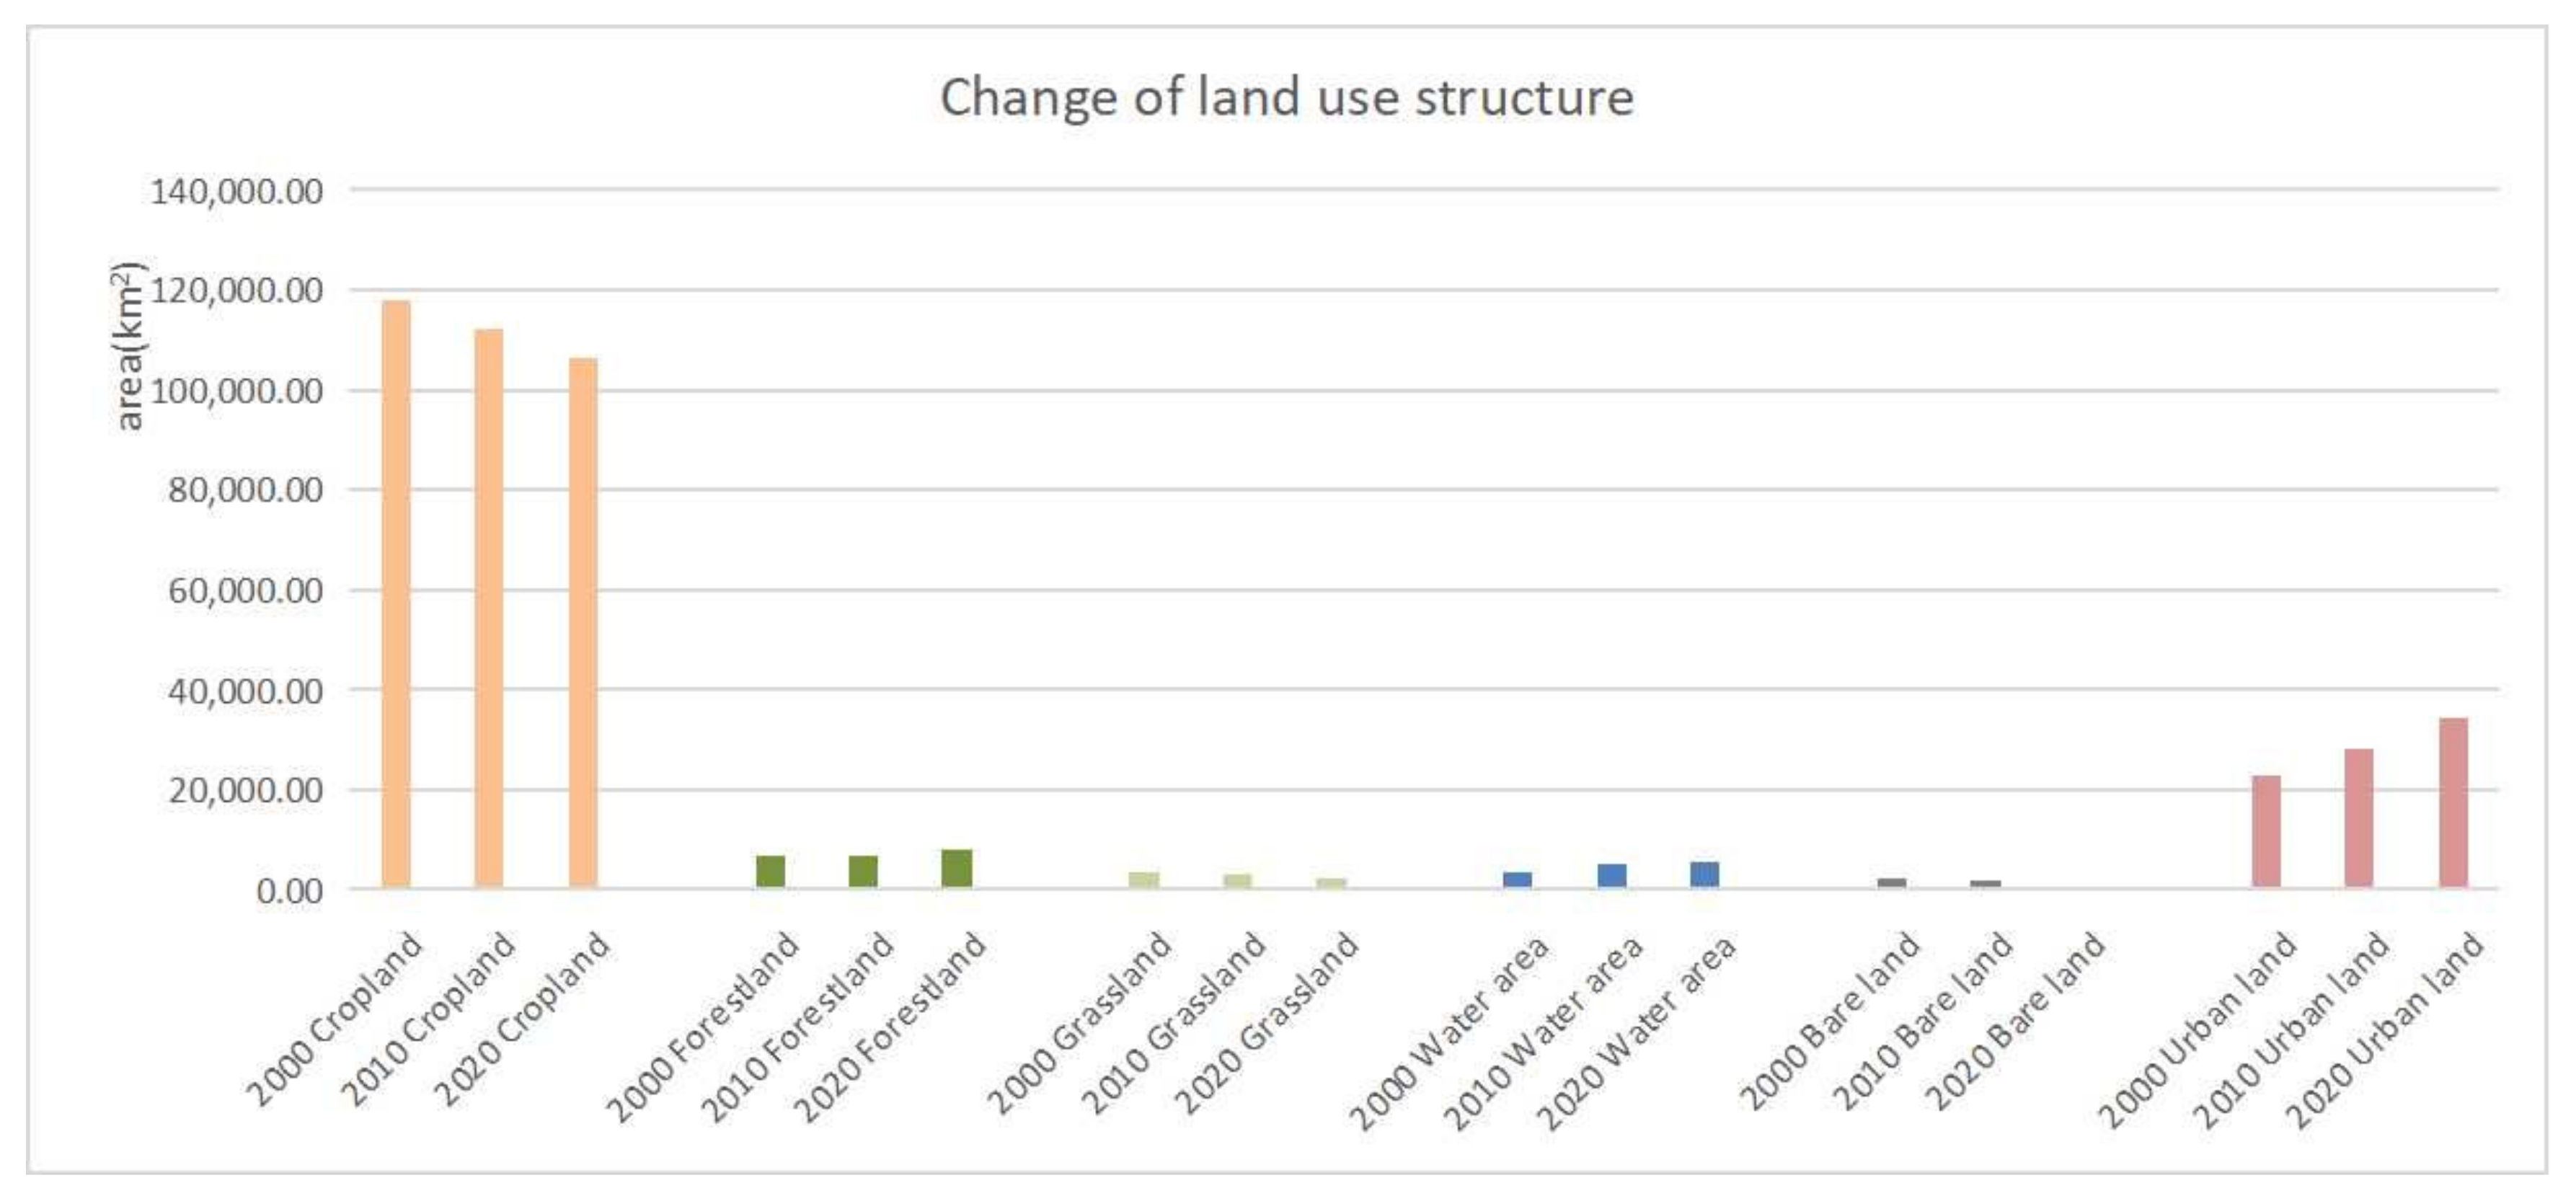
- From 2000 to 2020, the area of cropland decreased and the area of urban land increased. Among them, the area of urban land increased by 11,616.39 km2, an increase of 50.75% compared to the area in 2000, mainly due to a large amount of cropland converted into urban land. The net carbon emissions intensity decreased, meaning that each additional unit of GDP produced fewer carbon emissions;
- (2)
- LUCE is proportional to urban land area: the larger the urban area, the more carbon emissions are generated. The LUCE generated under SDS was less than that under NDS, and rational interventions in land use patterns can reduce carbon emissions;
- (3)
- The SDS had fewer moderate-risk areas and fewer high-risk areas than the NDS. From 2000 to 2020, the LUCE risk areas in Shandong Province were mainly no-risk and mild-risk areas, but there was a tendency for the LUCE risk level to increase over time. The high-risk areas and severe-risk areas were mainly located in economically developed central urban areas.
Author Contributions
Funding
Institutional Review Board Statement
Informed Consent Statement
Data Availability Statement
Conflicts of Interest
References
- Mallapaty, S. How China could be carbon neutral by mid-century. Nature 2020, 586, 482–483. [Google Scholar] [CrossRef] [PubMed]
- Raybould, B.; Cheung, W.M.; Connor, C.; Butcher, R. An investigation into UK government policy and legislation to renewable energy and greenhouse gas reduction commitments. Clean Technol. Environ. Policy 2020, 22, 371–387. [Google Scholar] [CrossRef] [Green Version]
- Su, L. Research on the Strategy of Integrating Carbon Peak and Carbon Neutrality into the Overall Layout of Ecological Civilization Construction. Environ. Prot. 2021, 49, 6–9. [Google Scholar]
- Hong, C.; Burney, J.A.; Pongratz, J.; Nabel, J.E.M.S.; Davis, S.J. Global and regional drivers of land-use emissions in 1961–2017. Nature 2021, 589, 554–561. [Google Scholar] [CrossRef] [PubMed]
- Cui, Y.; Li, L.; Chen, L.; Zhang, Y.; Cheng, L.; Zhou, X.; Yang, X. Land-Use Carbon Emissions Estimation for the Yangtze River Delta Urban Agglomeration Using 1994–2016 Landsat Image Data. Remote Sens. 2018, 10, 1334. [Google Scholar] [CrossRef] [Green Version]
- Scott, N.A.; Tate, K.R.; Ford-Robertson, J.; Giltrap, D.J.; Smith, C.T. Soil carbon storage in plantation forests and pastures: Land-use change implications. Tellus B Chem. Phys. Meteorol. 1999, 52, 326–335. [Google Scholar] [CrossRef]
- Cong, D.; Dong, X.; Jiang, Q.; Liu, G. Scenarios Prediction of the Carbon Dioxide Emissions in China under the Background of the Paris Agreement Based on BP Neural Network. Ecol. Econ. 2018, 34, 6. [Google Scholar]
- Hu, G.; Guoping, L.; Hao, Z.; Chang, L.; Yuhui, Z. Effects of Different Land Use Patterns on Carbon Emission in Heilongjiang Province. Res. Soil Water Conserv. 2015, 22, 6. [Google Scholar]
- Xu, L.; Dong, J.; Zhang, A. Simulation and structural Optimization of land use carbon reduction and efficiency Enhancement system in Hubei Province. Resour. Environ. Yangtze Basin 2016, 25, 9. [Google Scholar]
- Li, K.; Chen, Y.; Chen, J. An Evaluation Model for the Low-carbon and Intensive Urban Land Use Using Analytic Network Process. Econ. Geogr. 2013, 33, 156–161. [Google Scholar]
- Ren, F.; Long, D. Measurement of Carbon Emissions, Analysis of Influencing Factors and Selection of Forecasting Models in Guangdong Province. Ecol. Econ. 2022, 38, 8. [Google Scholar]
- Zhu, Y.E.; Li, L.F.; He, S.S.; Li, H.; Wang, Y. Peak year prediction of Shanxi Province’s carbon emissions based on IPAT modeling and scenario analysis. Resour. Sci. 2016, 38, 10. [Google Scholar] [CrossRef]
- Zhang, M.; Yang, Z.; Liu, L.; Zhou, D. Impact of renewable energy investment on carbon emissions in China—An empirical study using a nonparametric additive regression model. Sci. Total Environ. 2021, 785, 147109. [Google Scholar] [CrossRef] [PubMed]
- Long, Z.; Zhang, Z.; Liang, S.; Chen, X.; Yang, T. Spatially explicit carbon emissions at the county scale. Resour. Conserv. Recycl. 2021, 173, 105706. [Google Scholar] [CrossRef]
- Zhu, X.; Zhang, T.; Gao, W.; Mei, D. Analysis on Spatial Pattern and Driving Factors of Carbon Emission in Urban–Rural Fringe Mixed-Use Communities: Cases Study in East Asia. Sustainability 2020, 12, 3101. [Google Scholar] [CrossRef]
- Wei, Y.; Jian, X. Research Evolution of Carbon Emissions from Land Use in Guizhou Province Based on Carbon Peak and Carbon Neutrality and the According Predictions. Ecol. Econ. 2022, 38, 7. [Google Scholar]
- Liu, X.; Liang, X.; Li, X.; Xu, X.; Ou, J.; Chen, Y.; Li, S.; Wang, S.; Pei, F. A future land use simulation model (FLUS) for simulating multiple land use scenarios by coupling human and natural effects. Landsc. Urban Plan. 2017, 168, 94–116. [Google Scholar] [CrossRef]
- Jiang, W.; Chen, Z.; Lei, X.; Jia, K.; Wu, Y. Simulating urban land use change by incorporating an autologistic regression model into a CLUE-S model. J. Geogr. Sci. 2015, 25, 836–850. [Google Scholar] [CrossRef] [Green Version]
- Liang, X.; Guan, Q.; Clarke, K.C.; Liu, S.; Wang, B.; Yao, Y. Understanding the drivers of sustainable land expansion using a patch-generating land use simulation (PLUS) model: A case study in Wuhan, China. Comput. Environ. Urban Syst. 2020, 85, 101569. [Google Scholar] [CrossRef]
- Lou, Y.; Yang, D.; Zhang, P.; Zhang, Y.; Song, M.; Huang, Y.; Jing, W. Multi-Scenario Simulation of Land Use Changes with Ecosystem Service Value in the Yellow River Basin. Land 2022, 11, 992. [Google Scholar] [CrossRef]
- Gao, L.; Tao, F.; Liu, R.; Wang, Z.; Leng, H.; Zhou, T. Multi-scenario simulation and ecological risk analysis of land use based on the PLUS model: A case study of Nanjing. Sustain. Cities Soc. 2022, 86, 104055. [Google Scholar] [CrossRef]
- Wang, J.; Zhang, J.; Xiong, N.; Liang, B.; Wang, Z.; Cressey, E.L. Spatial and Temporal Variation, Simulation and Prediction of Land Use in Ecological Conservation Area of Western Beijing. Remote Sens. 2022, 14, 1452. [Google Scholar] [CrossRef]
- Rong, R.; Fan, W. Research on Status and Influencing Factors of Carbon Emissions in Shandong Province—Basedon Grey Correlation Analysis. Sino-Glob. Energy 2021, 26, 92–97. [Google Scholar]
- Liu, J.; Peng, K.; Zuo, C.; Li, Q. Spatiotemporal variation of land-use carbon emissions and its implications for low carbon and ecological civilization strategies: Evidence from Xiamen-Zhangzhou-Quanzhou metropolitan circle, China. Sustain. Cities Soc. 2022, 86, 104083. [Google Scholar] [CrossRef]
- Li, G.D.; Yamaguchi, D.; Nagai, M. A GM(1,1)–Markov chain combined model with an application to predict the number of Chinese international airlines. Technol. Forecast. Soc. Change 2007, 74, 1465–1481. [Google Scholar] [CrossRef]
- Huang, B.; Huang, J.; Pontius, R.G., Jr.; Tu, Z. Comparison of Intensity Analysis and the land use dynamic degrees to measure land changes outside versus inside the coastal zone of Longhai, China. Ecol. Indic. 2018, 89, 336–347. [Google Scholar] [CrossRef]
- Pontius, R.G.; Huang, J.; Jiang, W.; Khallaghi, S.; Lin, Y.; Liu, J.; Quan, B.; Ye, S. Rules to write mathematics to clarify metrics such as the land use dynamic degrees. Landsc. Ecol. 2017, 32, 2249–2260. [Google Scholar] [CrossRef]
- Eggleston, S.; Buendia, L.; Miwa, K.; Ngara, T.; Tanabe, K.; Wagner, F. 2006 IPCC Guidelines for National Greenhouse Gas Inventories: Volume 2 Energy. 2006. Available online: http://www.ipcc-nggip.iges.or.jp/public/2006gl/vol2.html (accessed on 28 September 2022).
- Wu, X. A study on the Optimization of Land Use Structure in Shandong Peninsula Urban Agglomeration from the Perspective of Carbon Emission. Master’s Thesis, Ludong University, Yantai, China, 2021. [Google Scholar]
- Li, W.; Yu, X.; Hu, N.; Huang, F.; Wang, J.; Peng, Q. Study on the relationship between fossil energy consumption and carbon emission in Sichuan Province. Energy Rep. 2022, 8, 53–62. [Google Scholar] [CrossRef]
- Liu, L.S. An approach to increase prediction precision of GM(1,1) model based on optimization of the initial condition. Expert Syst. Appl. 2010, 37, 5640–5644. [Google Scholar]
- Yang, F.; Chou, J.; Dong, W.; Sun, M.; Zhao, W. Adaption to climate change risk in eastern China: Carbon emission characteristics and analysis of reduction path. Phys. Chem. Earth Parts A/B/C 2020, 115, 102829. [Google Scholar] [CrossRef]
- Han, N.; Luo, X. Carbon emission peak prediction and reduction potential in Beijing-Tianjin-Hebei region from the perspective of multiple scenarios. J. Nat. Resour. 2022, 37, 1277–1288. [Google Scholar] [CrossRef]
- Zhang, F.; Xu, N.; Wu, F. Research on China’s CO2 emissions projections from 2020 to 2100 under the shared socioeconomic pathways. Acta Ecol. Sin. 2021, 41, 9691–9704. [Google Scholar]
- Wang, Z.; Huang, C.; Li, L.; Lin, Q. Ecological zoning planing and dynamic evaluation coupled with Invest-HFI-Plus model: A case study in Bortala Mongolian Autonomous Prefecture. Acta Ecol. Sin. 2022, 42, 5789–5798. [Google Scholar]
- Wu, D.; Zhu, K.; Zhang, S.; Huang, C.; Li, J. Evolution Analysis of Carbon Storage in Chengdu-Chongqing Economic Zone Based on PLUS Model and InVEST Model. Ecol. Environ. Monit. Three Gorges 2022, 7, 12. [Google Scholar]

| Data | Year (s) | Spatial Resolution | Sources |
|---|---|---|---|
| Land use data | 2000–2020 | 30 m | http://doi.org/10.5281/zenodo.4417809 (accessed on 5 April 2022) |
| DEM | 2020 | 30 m | https://lpdaac.usgs.gov/ (accessed on 20 March 2022) |
| GDP | 2019 | 1000 m | https://www.resdc.cn/ (accessed on 25 March 2022) |
| Population | 2020 | 1000 m | http://www.geodata.cn/ (accessed on 18 April 2022) |
| Annual average temperature | |||
| Annual average precipitation | |||
| Proximity to highway | 2020 | http://www.bigemap.com/ (accessed on 6 April 2022) | |
| Proximity to railway | |||
| Proximity to primary road | |||
| China Energy Statistical Yearbook | 2000–2020 | http://www.stats.gov.cn/ (accessed on 29 April 2022) | |
| Shandong Statistical Yearbook | 2000–2020 | http://tjj.shandong.gov.cn/ (accessed on 28 April 2022) |
| Land Use Type | 2000–2010 | 2010–2020 | 2000–2020 | |||
|---|---|---|---|---|---|---|
| Area Change | LUDD | Area Change | LUDD | Area Change | LUDD | |
| Cropland | −5804.08 | −0.49 | −5655.24 | −0.50 | −11,459.32 | −0.97 |
| Forestland | −106.34 | −0.16 | 1181.95 | 1.78 | 1075.61 | 1.59 |
| Grassland | −630.81 | −1.72 | −895.01 | −2.95 | −1525.82 | −4.16 |
| Water area | 1662.14 | 5.02 | 431.93 | 0.87 | 2094.08 | 6.32 |
| Bare land | −413.10 | −1.87 | −1387.85 | −7.71 | −1800.95 | −8.14 |
| Urban land | 5292.18 | 2.31 | 6324.21 | 2.24 | 11,616.39 | 5.08 |
| Land Type | Grassland | Cropland | Urban Land | Forestland | Bare Land | Water Area | Total |
|---|---|---|---|---|---|---|---|
| Grassland | 2468.45 | 849.76 | 119.12 | 166.68 | 52.90 | 11.79 | 3668.69 |
| Cropland | 521.15 | 110,331.77 | 5377.34 | 451.49 | 23.04 | 1146.31 | 117,851.09 |
| Urban land | 0.41 | 23.42 | 22,380.26 | 0.05 | 6.37 | 476.80 | 22,887.29 |
| Forestland | 36.29 | 652.10 | 35.53 | 6020.64 | 0.00 | 0.79 | 6745.34 |
| Bare land | 8.06 | 62.78 | 87.39 | 0.00 | 1607.85 | 446.87 | 2212.94 |
| Water area | 3.53 | 127.19 | 179.84 | 0.16 | 109.69 | 2891.25 | 3311.66 |
| Total | 3037.88 | 112,047.01 | 28,179.47 | 6639.01 | 1799.84 | 4973.81 | 156,677.02 |
| Land Type | Grassland | Cropland | Urban Land | Forestland | Bare Land | Water Area | Total |
|---|---|---|---|---|---|---|---|
| Grassland | 1621.24 | 897.53 | 76.19 | 418.41 | 7.85 | 16.67 | 3037.88 |
| Cropland | 513.88 | 104,269.77 | 5449.88 | 1245.29 | 4.91 | 563.29 | 112,047.01 |
| Urban land | 0.00 | 15.53 | 27,925.76 | 0.00 | 2.72 | 235.46 | 28,179.47 |
| Forestland | 5.00 | 456.59 | 21.53 | 6155.57 | 0.00 | 0.31 | 6639.01 |
| Bare land | 2.25 | 72.41 | 614.59 | 0.00 | 331.34 | 779.27 | 1799.84 |
| Water area | 0.5 | 679.95 | 415.73 | 1.69 | 65.18 | 3810.74 | 4973.81 |
| Total | 2142.88 | 106,391.77 | 34,503.68 | 7820.96 | 412.00 | 5405.74 | 156,677.02 |
| Land Type | Grassland | Cropland | Urban Land | Forestland | Bare Land | Water Area | Total |
|---|---|---|---|---|---|---|---|
| Grassland | 1541.36 | 1255.37 | 213.71 | 611.57 | 14.18 | 32.51 | 3668.69 |
| Cropland | 552.98 | 103,915.15 | 10,848.83 | 1244.66 | 31.59 | 1257.89 | 117,851.09 |
| Urban land | 0.13 | 133.16 | 22,244.36 | 0.45 | 10.17 | 499.03 | 22,887.29 |
| Forestland | 46.71 | 670.68 | 64.08 | 5962.95 | 0.11 | 0.81 | 6745.34 |
| Bare land | 1.46 | 105.64 | 717.77 | 0.00 | 329.49 | 1058.58 | 2212.94 |
| Water area | 0.23 | 311.78 | 414.95 | 1.33 | 26.46 | 2556.92 | 3311.66 |
| Total | 2142.88 | 106,391.77 | 34,503.68 | 7820.96 | 412.00 | 5405.74 | 156,677.02 |
| Year | Carbon Emissions | Carbon Sink | Net Carbon Emissions | Net Carbon Emissions Intensity | ||||
|---|---|---|---|---|---|---|---|---|
| Cropland | Urban Land | Forestland | Grassland | Water Area | Bare Land | |||
| 2000 | 438.41 | 9007.57 | −32.85 | −7.01 | −8.38 | −0.11 | 9055.91 | 1.09 |
| 2010 | 416.81 | 36,541.97 | −32.33 | −5.08 | −12.58 | −0.09 | 36,592.05 | 1.08 |
| 2020 | 395.78 | 49,013.90 | −38.09 | −4.09 | −13.68 | −0.02 | 49,353.80 | 0.70 |
| 2030 nature | 372.35 | 61,121.33 | −41.32 | −3.12 | −11.54 | −0.02 | 61,437.67 | 0.38 |
| 2030 sustainable | 372.35 | 60,398.89 | −42.36 | −3.12 | −12.30 | −0.02 | 60,713.44 | 0.37 |
Publisher’s Note: MDPI stays neutral with regard to jurisdictional claims in published maps and institutional affiliations. |
© 2022 by the authors. Licensee MDPI, Basel, Switzerland. This article is an open access article distributed under the terms and conditions of the Creative Commons Attribution (CC BY) license (https://creativecommons.org/licenses/by/4.0/).
Share and Cite
Zhong, J.-L.; Qi, W.; Dong, M.; Xu, M.-H.; Zhang, J.-Y.; Xu, Y.-X.; Zhou, Z.-J. Land Use Carbon Emission Measurement and Risk Zoning under the Background of the Carbon Peak: A Case Study of Shandong Province, China. Sustainability 2022, 14, 15130. https://doi.org/10.3390/su142215130
Zhong J-L, Qi W, Dong M, Xu M-H, Zhang J-Y, Xu Y-X, Zhou Z-J. Land Use Carbon Emission Measurement and Risk Zoning under the Background of the Carbon Peak: A Case Study of Shandong Province, China. Sustainability. 2022; 14(22):15130. https://doi.org/10.3390/su142215130
Chicago/Turabian StyleZhong, Jia-Li, Wei Qi, Min Dong, Meng-Han Xu, Jia-Yu Zhang, Yi-Xiao Xu, and Zi-Jie Zhou. 2022. "Land Use Carbon Emission Measurement and Risk Zoning under the Background of the Carbon Peak: A Case Study of Shandong Province, China" Sustainability 14, no. 22: 15130. https://doi.org/10.3390/su142215130
APA StyleZhong, J.-L., Qi, W., Dong, M., Xu, M.-H., Zhang, J.-Y., Xu, Y.-X., & Zhou, Z.-J. (2022). Land Use Carbon Emission Measurement and Risk Zoning under the Background of the Carbon Peak: A Case Study of Shandong Province, China. Sustainability, 14(22), 15130. https://doi.org/10.3390/su142215130


