Article

Suitable Tillage Depth Promotes Maize Yields by Changing Soil Physical and Chemical Properties in A 3-Year Experiment in the North China Plain

1
School of Water Conservancy and Hydroelectirc Power, Hebei University of Engineering, Handan 056038, China
2
Hebei Engineering Technology Research Center for Effective Utilization of Water Resource, Hebei University of Engineering, Handan 056038, China
*
Author to whom correspondence should be addressed.
Sustainability 2022, 14(22), 15134; https://doi.org/10.3390/su142215134
Submission received: 6 October 2022 / Revised: 8 November 2022 / Accepted: 11 November 2022 / Published: 15 November 2022

Abstract

:
Rotary tillage is a common farming method because of its ease of operation and low cost in the North China Plain. However, the rotary tillage depth is generally no more than 20 cm, and successive years of rotary tillage harden the root soil layers, which reduces maize’s ability to take root into the deep layer and decreases maize yields. The impact of the different rotary tillage depths and different plow pan thicknesses on maize yields was unclear and needs further study. In this study, a 3-year experiment was conducted, and three rotary tillage depths were designed: 20 cm tillage depth (D20), 25 cm tillage depth (D25), and 30 cm tillage depth (D30). The effects of different rotary tillage depths on soil’s physical and chemical properties, water use efficiency, photosynthetic rate, and maize yields were investigated. The results showed that soil bulk density significantly decreased and field capacity significantly increased in 10–30 cm soil layers by increasing the rotary tillage depths; soil water consumption, photosynthetic rate, and maize yields of D25 significantly increased in comparison to those of D20 and D30; soil bulk density, plow pan thickness, total nitrogen, total phosphorus, and total potassium had an obvious negative correlation with tillage depth and field capacity; the Denitrification–Decomposition (DNDC) model predicted maize yields well; structural equation models (SEM) revealed that rotary tillage depths and soil water consumption played an important role on maize yields; and D25 could increase maize yields by improving maize water use efficiency and photosynthetic rate. The tillage depth of 25 cm is a suitable rotary tillage depth for the increase in maize yields in the North China Plain.

1. Introduction

The planting of summer maize plays an important role in the North China Plain due to the suitable temperature and light resources [1]. However, long-term traditional farming and fertilization resulted in soil compaction, degradation, and water shortages, which threaten the agricultural production of maize [2]. In particular, soil compaction can depress crop yields, and soil with high bulk density can impede root growth, which limits water and nutrient absorption by maize. Tillage has been one of the most vital agricultural management practices for improving maize yield [3,4]. There are many benefits of tillage, such as preparing a suitable soil environment for seeds and seedlings and inhibiting the diseases of weeds, insects, and plants in the soil [5]. Tillage measures in agriculture include plowing tillage, rotary tillage, and subsoiling, and tillage depths can affect crop yields [6,7,8]. Conventional tillage and deep tillage practices can both alter soil bulk density, plow pan (the compacted layer of soil), aggregate stability, and total porosity, and decrease surface runoff and erosion. They affect soil physical and chemical parameters, resulting in changes in soil water transmission properties, soil water storage, and crop yields [9,10].
Conventional tillage methods on the North China Plain generally include maize straw that is crushed and returned to the field and rotary tillage, and the common tillage depth after harvest is no more than 20 cm. Rotary tillage is convenient and reduces cost compared to plowing tillage and subsoiling [11]. However, the working depth is shallow, and the successive years of rotary tillage result in a shallow plow layer and thick plow pan in the topsoil [12]. Deep tillage is more than 25 cm deep, and the main advantage of deep tillage is that it reduces subsoil compaction. The benefits of deep tillage may include breaking up the plow pan in the 20–40 cm soil layer, which improved the soil structure, facilitated the root growth of maize, and increased water infiltration and movement [13,14]. The deep tillage with straw retention treatment increased the maize yields in comparison to that of the shallow tillage treatment [8]. Schneider et al. [11] found that deep tillage increased maize yields. The depth of subsoiling ranged from 25 to 35 cm, which can break the plow pan without inverting the infertile subsoil, eliminate soil compaction, increase soil moisture and root growth, and then increase maize yields compared to conventional tillage [15,16,17,18]. Subsoiling increased soil infiltration capacity, maintained the soil moisture within the least limiting water range for a longer time, and then increased maize yields compared to rotary tillage [19]. Compared with rotary tillage, the net photosynthesis, water uptake of maize, root length and density, and soil water content increased through subsoiling tillage, which resulted in an increase in maize yields [16].
The bulk density of the soil will change with different climates, topography, parent materials, and agricultural practices [20]. The soils had a high bulk density, which decreased microbial activity, including aerobic bacteria and fungi [21], which affected the maize yields. Tillage operations loosened the soil in the 0–20 cm soil layer and reduced the bulk density of the tilled layer, which contributed to the root for extending and penetrating to the 0–20 cm soil layers [22]. Deep tillage had an important influence on soil bulk density and infiltration rate compared to shallow tillage systems and increased maize yields [23]. Soil bulk density increased in the topsoil layer (10–20 cm) and reduced air-filled pore space [10], which caused the reduction in soil water content in the topsoil. Lamptey et al. [24] reported that an improvement in soil water moisture improved photosynthetic activity, resulting in increased maize yields. The net photosynthesis of maize increased by 40% under subsoiling compared to rotary tillage [16]. Tillage caused roots and nutrients (nitrogen, phosphorus, and kalium) to move from the topsoil layer downward to the lower soil layers. The root growth was improved, and nutrients accumulation in the topsoil significantly increased, causing an increase of 12.8% in maize yields compared to conventional soil management [25].
In the North China Plain, shallow rotary tillage with maize straw is the major tillage management method because of its ease of operation and low cost. However, the common tillage depth for rotary tillage is 0–20 cm. The successive shallow rotary tillage forms a hard plow pan layer in the 20–30 cm soil layers, resulting in a decrease in maize yields. The impacting mechanism of the plow pan depth on maize yields is unknown and needs to be investigated. By studying different rotary tillage depths, we expect to contribute to the sustainable development of maize cultivation. In this study, a 3-year field experiment in Xintai city was conducted in which the same fertilization amount and different rotary tillage depths were applied in maize growing seasons. The main objectives of this study were to: (1) assess the effects of different rotary tillage depths on soil bulk density and field capacity; (2) investigate whether plow pan depth affects photosynthetic rate and nutrients in the soil; and (3) clarify the impacting mechanism of plow pan depth on maize yields.
The paper is structured as follows: In Section 2, information on experimental sites, the methodology of the study, and how the data were analyzed are presented. In Section 3, the results of this study are analyzed. Discussions of the findings are presented in Section 4, and a summary of the scientific results is presented in Section 5.

2. Materials and Methods

2.1. Experimental Site Description

This study was conducted at Ningjing experimental sites, Xintai District, Hebei Province of China in the 2017–2019 growing seasons of maize. This site is located at 114°53′ E, 37°37′ N, and elevated at 25–35 m a.s.l., and is a typical plain area in the North China Plain [26]. An agricultural test station has been built here. Its environmental conditions represent an annual mean precipitation of 501 mm (mainly in June and August), and an annual mean temperature of 13.0 °C.
The soils in this study were light loam in the 0–21 cm soil layer, heavy loam in the 21–45 cm soil layer, light clay in the 45–90 cm soil layer, and sandy loam in the 90–100 cm soil layer. The daily air temperature and precipitation data during 2017–2019 was shown in Figure 1. The precipitation was mainly concentrated during the maize growing seasons, and the temperature was high in the maize growing seasons. The average temperature and total precipitation in maize growing seasons in 2017, 2018, and 2019 were 25.55 °C, 26.14 °C, and 24.10 °C, and 216.60 mm, 217.20 mm, and 140.70 mm, respectively.

2.2. Experimental Design and Field Management

Three tillage practices were used as experimental treatments: 20 cm tillage depth treatment (D20), 25 cm tillage depth treatment (D25), and 30 cm tillage depth treatment (D30). All treatments were conducted in triplicate for a total of 9 plots, and each plot area was 90 m2 (9.0 m × 10.0 m). Fertilizer included slow-release fertilizer, water-retaining agent, and calcium ammonium sulfate as shown in Table 1. Maize cultivar ‘Weike 966’ was used in this study, and the seeds were sown in mid-June and harvested in late September every year.

2.3. Sampling and Measurement

In the 0–60 cm soil layer, soil samples were collected by using a soil drill at the maize growing phases of Pre-sowing, Jointing, Bell, and Silking. Total nitrogen (N), total phosphorus (P), and total potassium (K) were determined by J200 laser spectral element analyzer. Soil bulk density and soil water contents were conducted by the oven-drying method [27]. Soil storage water consumption is calculated using the Equation as follows [28]:
Δ W = 10 i n γ i H i θ i 1 θ i 2
Water consumption is calculated using the Equation as follows [28]:
ET 1 2 = Δ W + M + P
where Δ W is soil storage water consumption in specific growing stage (mm); ET 1 2 is water consumption in specific growing stage (mm); i is the numeration of soil layer; n is the total number of soil layer; γ i is dry bulk density in i soil layer (g·cm−3); H i is the soil depth in i soil layer (cm); θ i 1 and θ i 2 are the initial and final water content in i soil layer in a specific growing stage, respectively (%); M is the irrigation amount in a specific growing stage (mm); and P is the effective precipitation (mm).
The photosynthetic rate was determined by a portable photosynthetic determination system. Maize yields after harvest were determined by all the productive corn in each plot. After maize harvest, 15 typical spikes of maize with uniform growth were selected in each plot, and then spike length, spike diameter, spike weight, 100-kernel weight, spike rows, and kernel weight per spike were determined.

2.4. Statistical Analysis

Figures in the work were graphed through Origin 8.1 (Graphing and data analysis software, Northampton, MA, USA). Statistical analyses were conducted using SPSS 22.0 (SPSS, IBM, Chicago, IL, USA). Analysis of variance (ANOVA) was conducted by least significant difference (LSD) method (p < 0.05). The Denitrification–Decomposition (DNDC) model was performed using DNDC95 (Newhampshire, USA). Nonmetric multidimensional scaling (NMDS) was conducted using Canoco 5.0 (Plant Research International, Prague, Czech Republic). Structural equation models (SEM) were performed using SPSS Amos 22.0 (SPSS, IBM, Chicago, IL, USA) to assess the relationship among tillage, total nitrogen, water consumption, photosynthesis, and maize yields [29,30].

3. Results

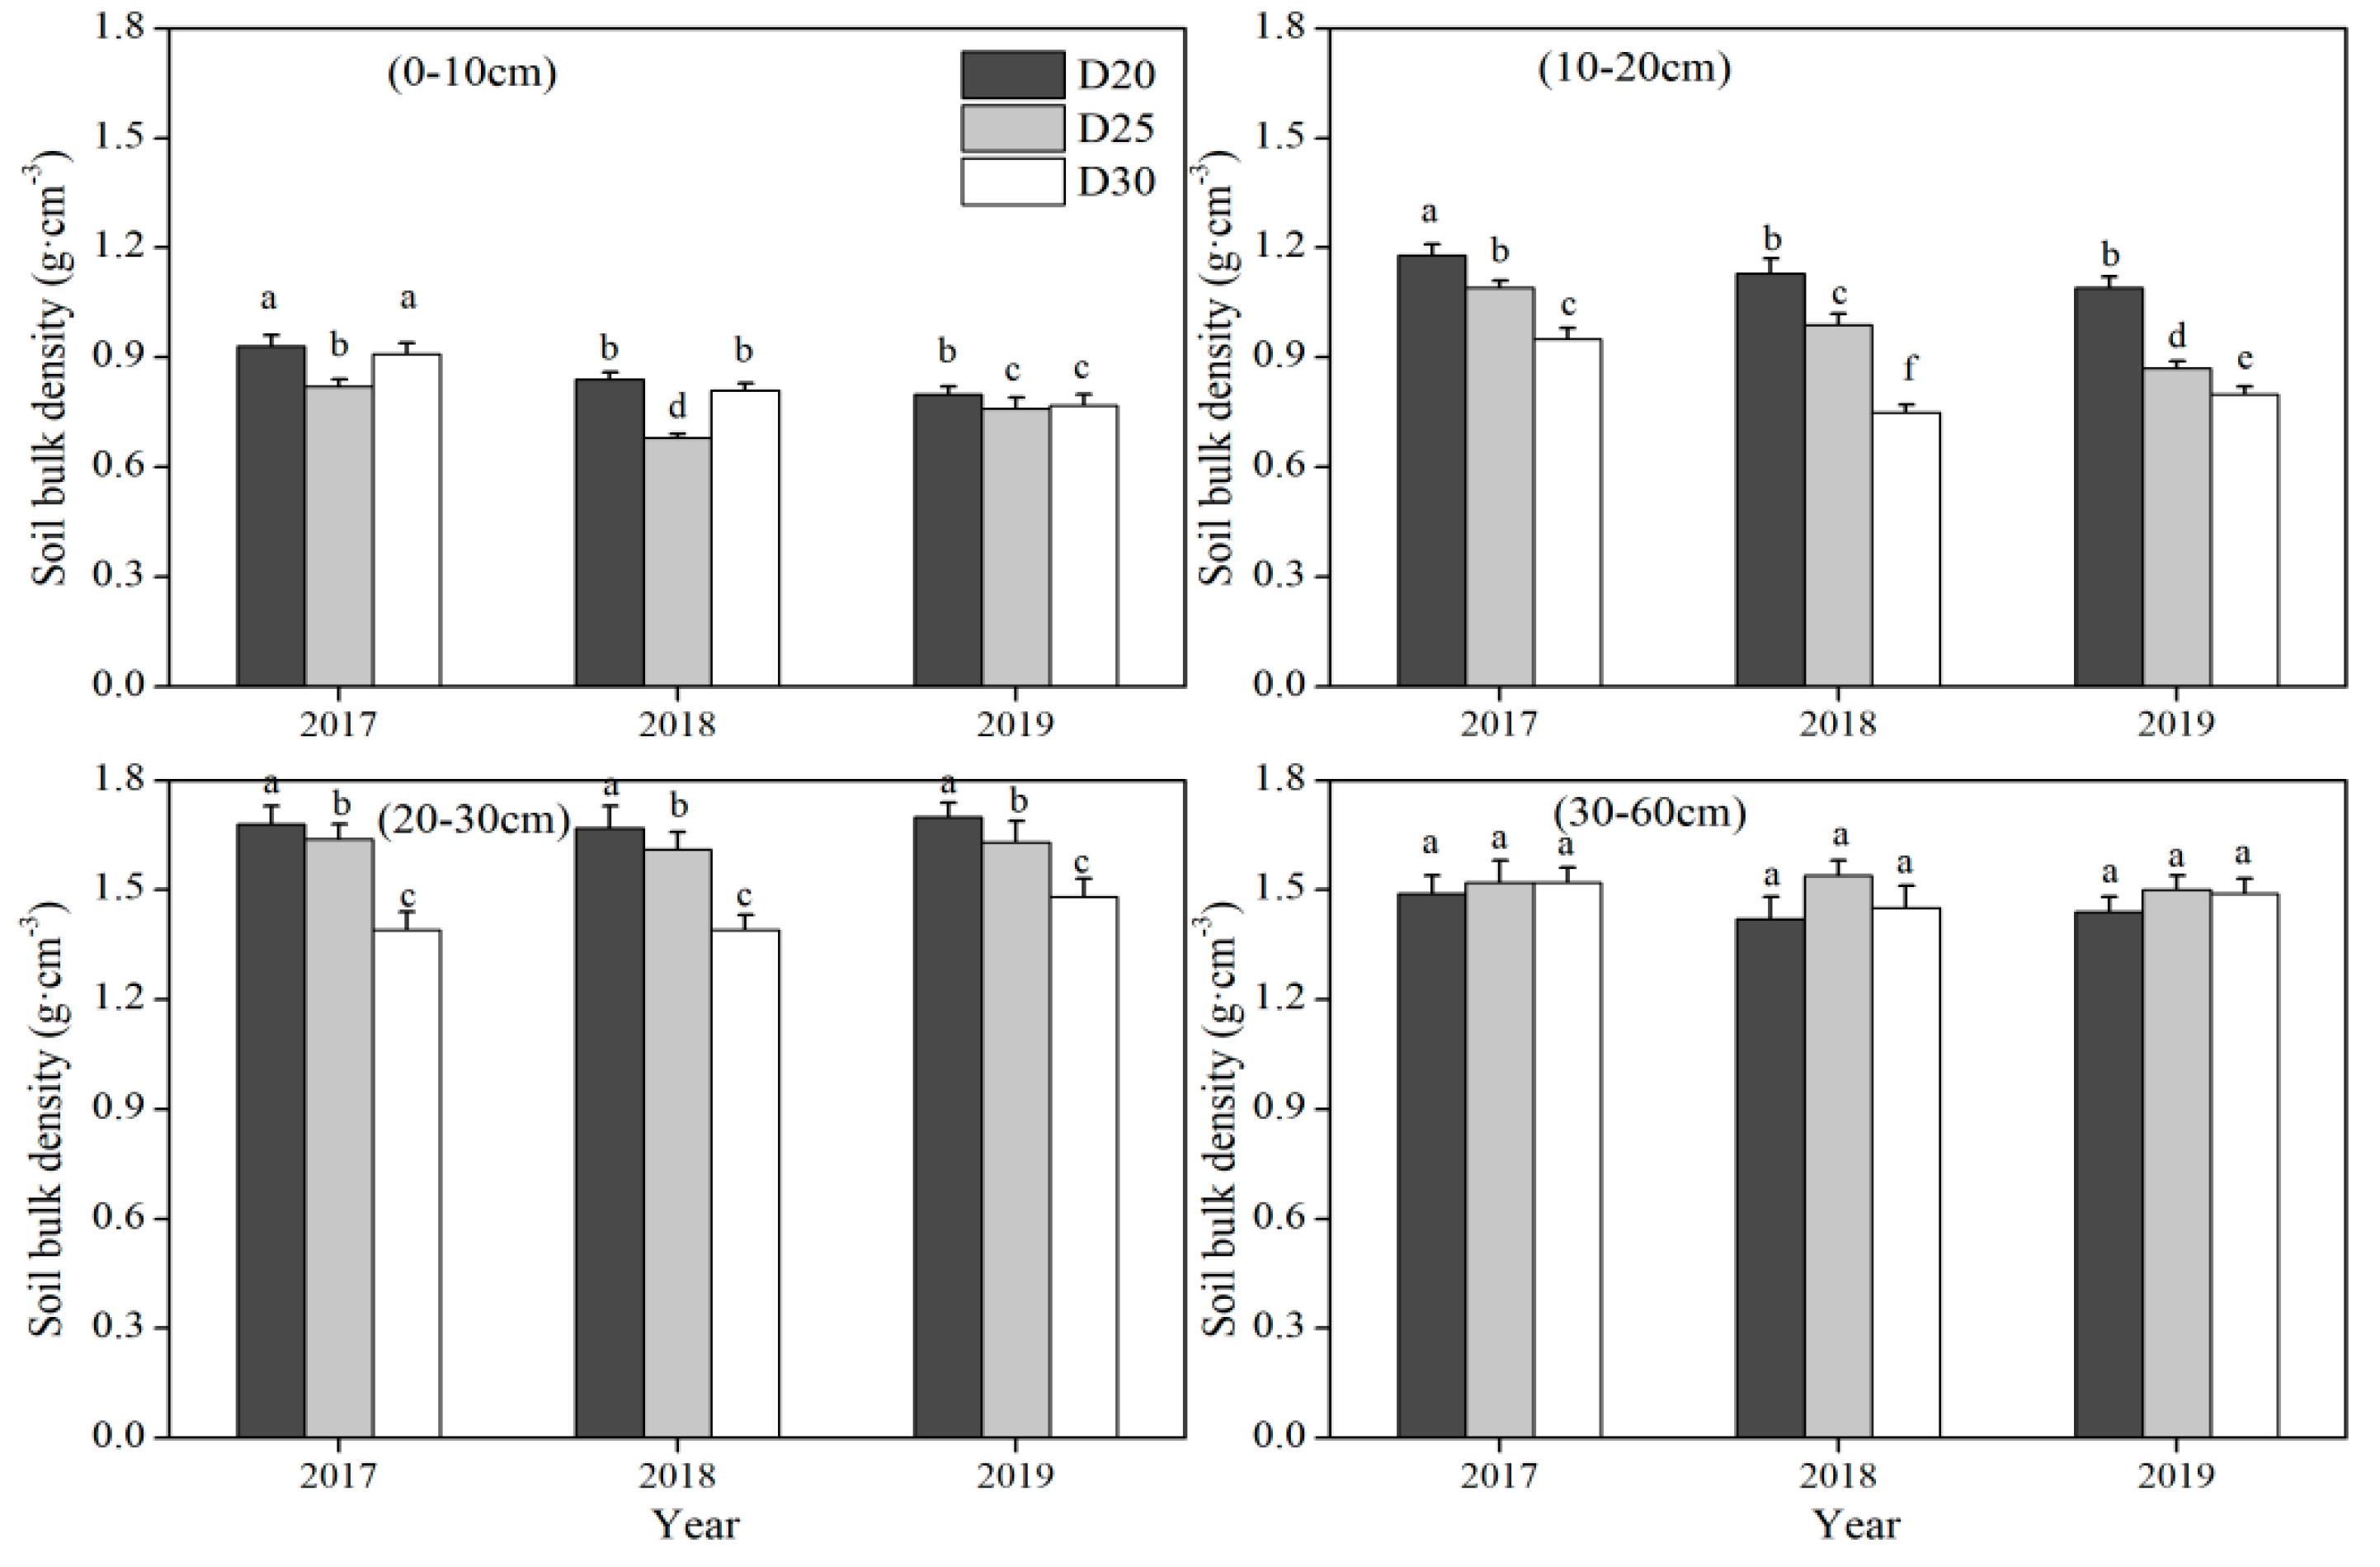
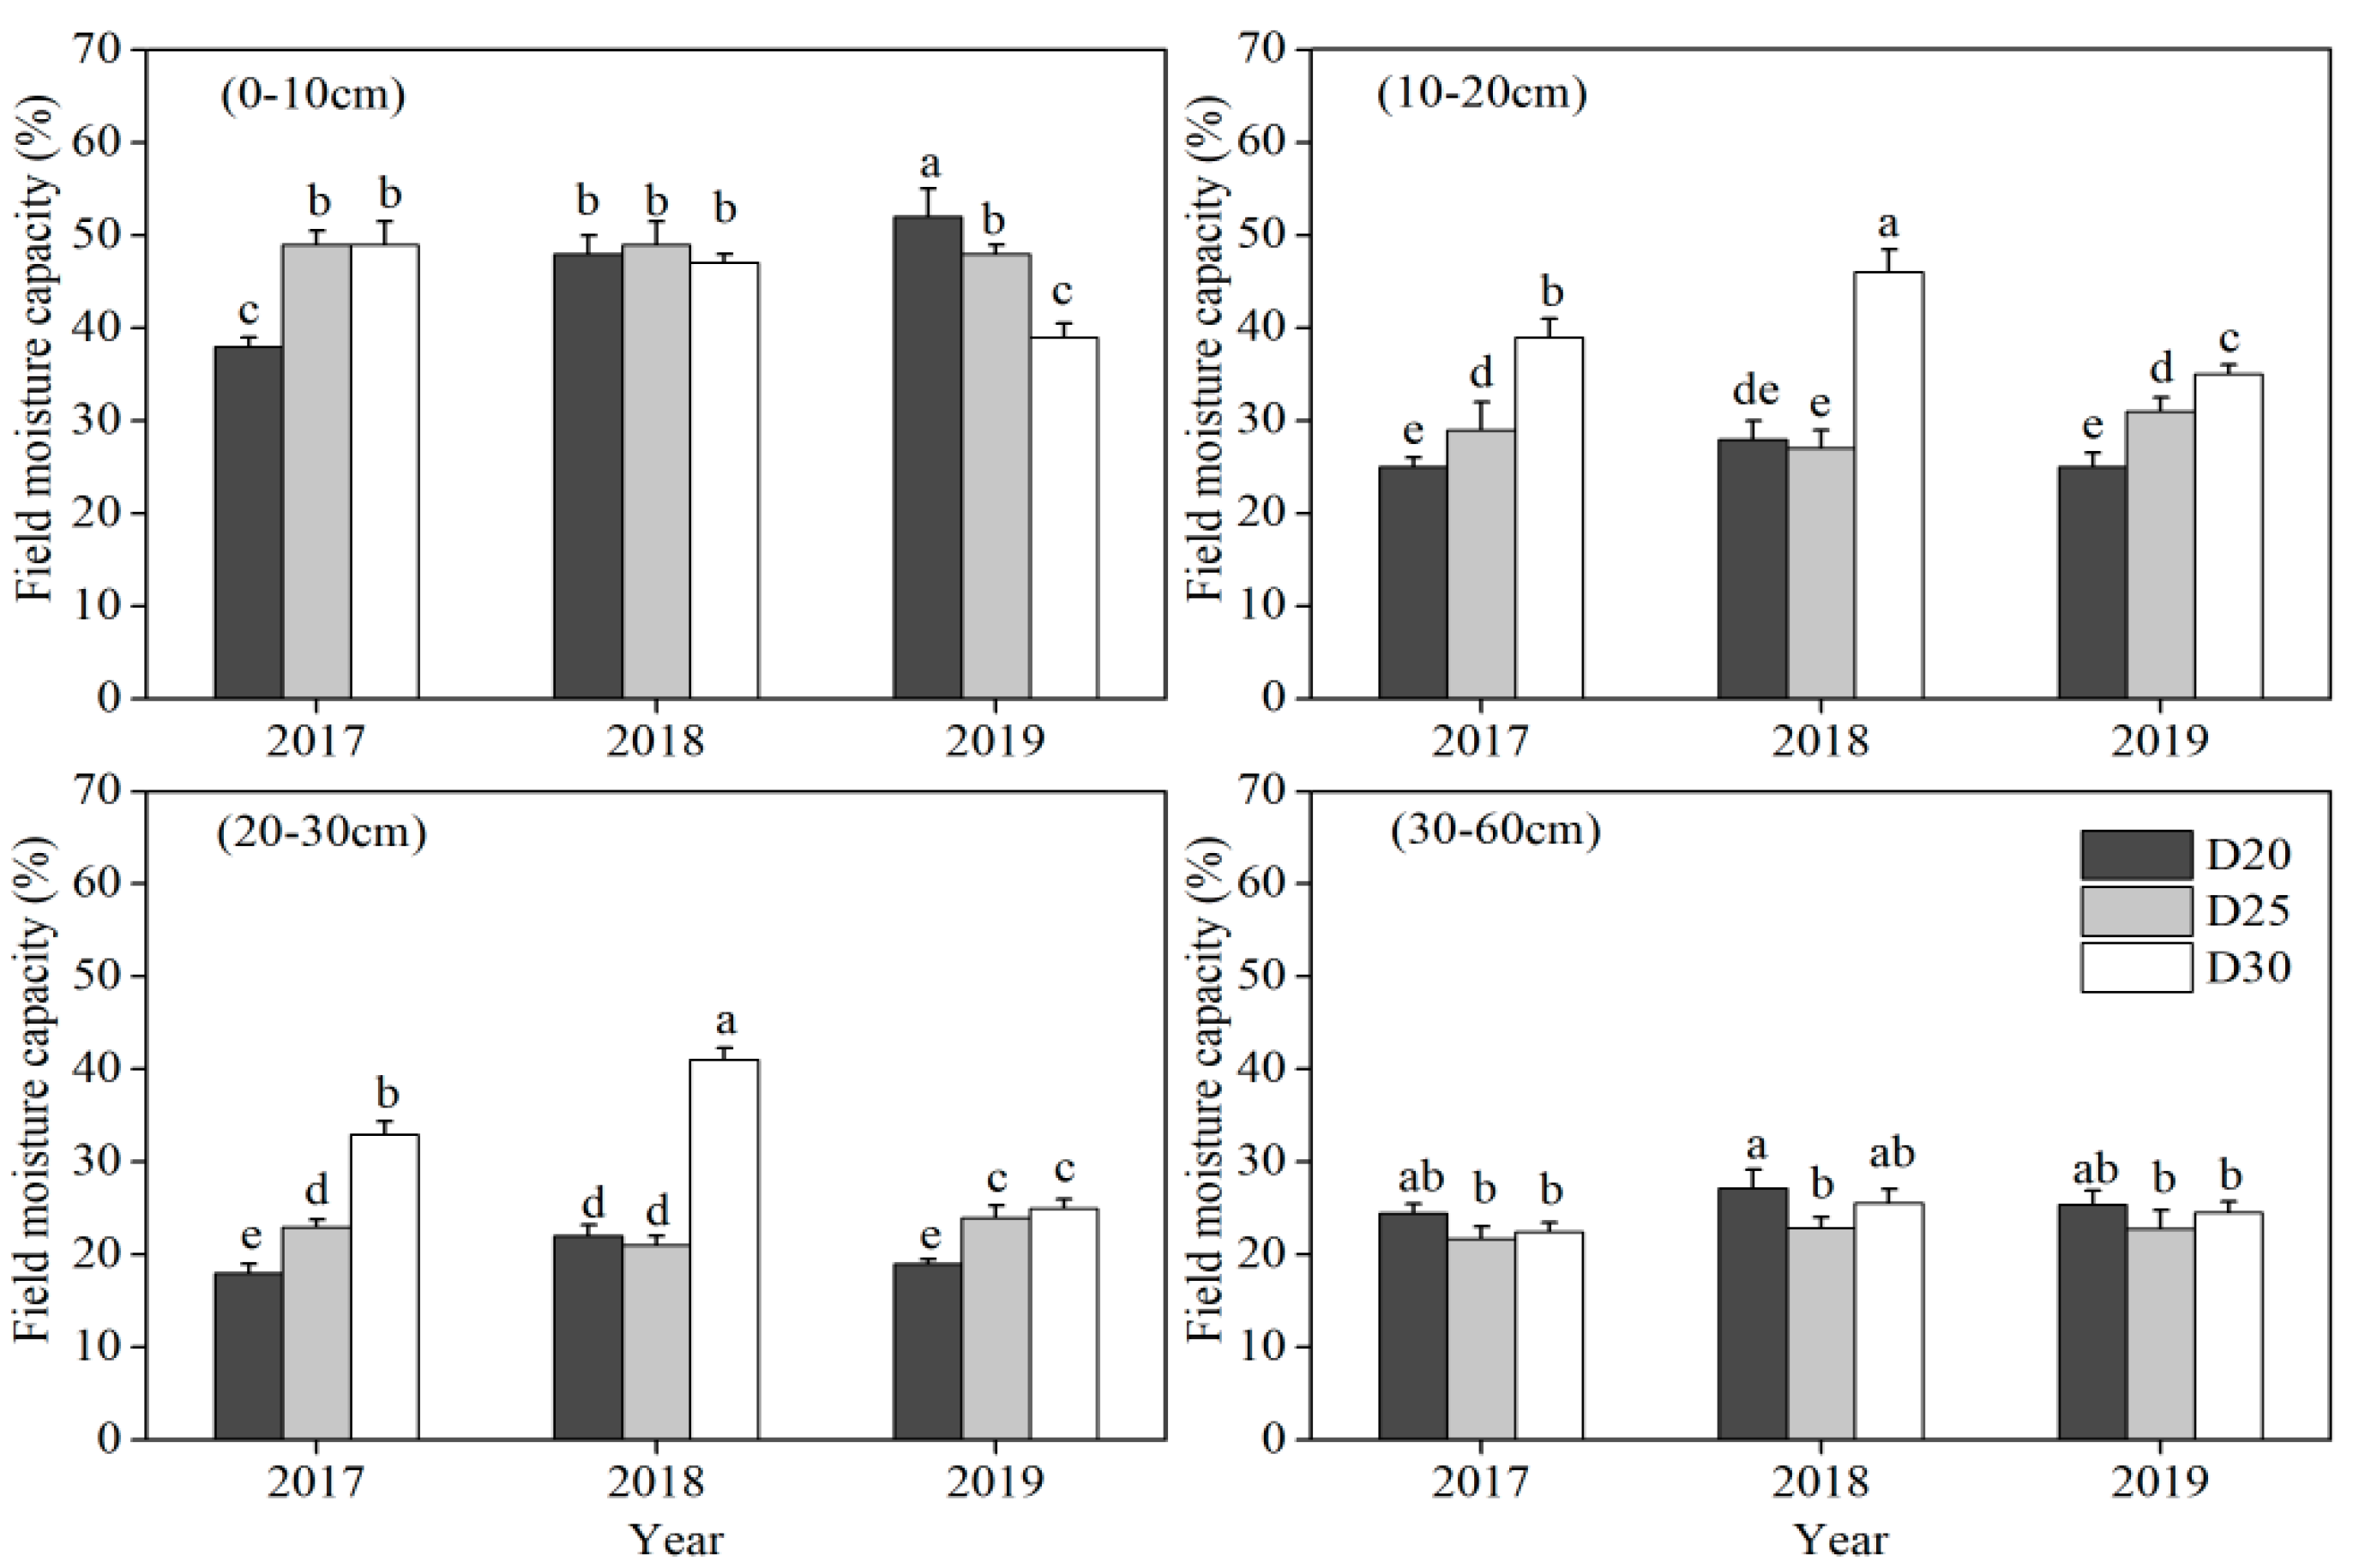
3.1. Soil Bulk Density and Field Capacity

In the 0–10 cm soil layers, soil bulk density was significantly lower for D25 than that for D20 and D30 in 2017 and 2018, while there was no significant difference between D20 and D30 (Figure 2). In 2019, soil bulk density was significantly higher for D20 than that for D25 and D30. In the 10–30 cm soil layers, soil bulk density was significantly different among D20, D25, and D30, and gradually decreased with the increase in the topsoil layers in 2017, 2018, and 2019. However, no significant difference occurred among D20, D25, and D30 in the 30–60 cm soil layers. With the increase in the soil depth, soil bulk density increased for D30, while increased except for the 20–30 cm soil layers for D20 and D25 (Figure 2). In the 0–10 cm soil layers, soil bulk density was about 0.9 g·cm−3, while 0.7–1.2 g·cm−3 in the 10–20 cm soil layers, 1.4–1.7 g·cm−3 in the 20–30 cm soil layers, and about 1.5 g·cm−3 in the 30–60 cm soil layers. Soil bulk density was highest in the 20–30 cm soil layers, which was because these soil layers were the plow pan. Breaking the plow pan decreased soil bulk density in the 20–30 cm soil layers.
Field capacity was significantly lower for D20 than that for D25 and D30 in the 0–10 cm soil layers in 2017; there was no significant difference among D20, D25, and D30 in 2018; and it decreased with the increase in the topsoil depth in 2019 (Figure 3). In the 10–20 cm soil layers, field capacity increased with the increase in the topsoil depth in 2017 and 2019, while it was significantly higher for D30 than that for D20 and D25 in 2018, and it was highest for D30 among the three treatments in the three years. In the 20–30 cm soil layers, the trend of field capacity was similar to that in the 10–20 cm soil layers. In the 30–60 cm soil layers, field capacity was mainly no significant difference for the three treatments in the three years. Field capacity mainly decreased with the increase in the soil layers (Figure 3). In the 0–10 cm soil layers, field capacity was above 0.38, while 0.25–0.45 in the 10–20 cm soil layers, 0.18–0.40 in the 20–30 cm soil layers, and about 0.22 in the 30–60 cm soil layers. For D20 and D25, field capacity was lowest in the 20–30 cm soil layers among the four soil layers, while for D30, it increased compared to that for D20 and D25. Breaking the plow pan increased field capacity in the 20–30 cm soil layers.

3.2. Photosynthetic Rate and Yields

At the jointing stage, the photosynthetic rate was lowest for D30 in 2017, but it was highest in 2018 and 2019, and it was in the middle for D25 in the three treatments (Figure 4). The photosynthetic rate was between 33.2 and 42.4 umol·m−2·s−1 in the three years at the jointing stage except for D30 in 2017. At the bell stage, it was highest for D25 in the three years and lowest for D30. The photosynthetic rate was higher in 2019 than that in the other two years for each treatment. At the silking stage, it was a similar trend to that at the bell stage; however, the photosynthetic rate was lowest in 2018 in the three years. On the whole, in the three growing stages, it was lowest for the silking stage, and there was no obvious difference for the other growing stages.
Maize yields were significantly higher for D25 than that for D20 and D30, and no significant difference for D20 with D30 in the three years (Table 2). D25 treatment increased maize yields by 20.92% than that of D20, and 21.56% than that of D30, respectively. While maize yields for the same treatment were no significant difference in the three years. The Denitrification-Decomposition (DNDC) model is a crop-soil nitrogen conversion model by meteorological data, soil physical and chemical properties, other nitrogen conversion data, and so on. It can predict maize yields, and the presented yields obtained from the DNDC95 model were all close to the corresponding measured yields, and the differences were lower than 5.3% for nine treatments, implying that the DNDC95 model could well simulate maize yields (Table 2).
Spike length, spike diameter, spike weight, 100-kernel weight, spike rows, and kernel weight per spike were higher for D25 than that for D20 and D30 in the three years (Table 3). Spike length was 13.50% and 10.12% higher, spike diameter was 15.56% and 13.04% higher, spike weight was 12.85% and 16.78% higher, and spike rows were 15.13% and 16.35% higher for D25 than that for D20 and D30 in 2017, respectively. The 100-kernel weight was 12.75% and 10.16% higher for D25 than that for D20 and D30 in 2017, respectively. Kernel weight per spike was 15.13% and 16.35% higher for D25 than that for D20 and D30 in 2017, respectively. Factors consisting of maize yields were significantly higher for D25 than that for D20 and D30 in 2018 and 2019.

3.3. Water Consumption and Water Use Efficiency

Water consumption for D25 was higher than 300 mm and significantly higher than that for D20 and D30 (Figure 5A). Water consumption for D25 in the three years increased by 10.12% and 6.61% compared to that for D20 and D30, respectively. The difference between D20 and D30 was not significant. In a 3-year experiment, there was no significant difference in water consumption for the same treatment.
Water use efficiency was significantly affected by tillage depths, and it significantly increased for D25 compared to that for D20 and D30 (Figure 5B). The average water use efficiency for D20 significantly increased by 5.78% and 5.88% compared to that for D20 and D30 in the three years. The water use efficiency was the specific value of water consumption divided by yields. The trend of water use efficiency was influenced by maize yields and water consumption and was similar to the trend of maize yields and water consumption.

3.4. Total Nitrogen, Total Phosphorus, and Total Kalium in Pre-Sowing

Total nitrogen (TN), total phosphorus (TP), and total kalium (TK) are the three main nutrients in the soil. Total nitrogen in the 0–20 cm soil layers was significantly affected by tillage depth in the three years (Figure 6A). TN for D20 was highest in the three treatments and decreased with an increase in tillage depth. TP in the 0–20 cm soil layers was significantly affected by tillage depth in 2018; however, there was no significant difference in 2017 and 2019 (Figure 6B). TK in the 0–20 cm soil layers was significantly influenced by tillage depth in 2018 and 2019, whereas there was no significant difference in 2017 (Figure 6C). The results indicated that TN was more susceptible to the effects of tillage than TP and TK.

3.5. Nonmetric Multidimensional Scaling (NMDS) and Structural Equation Models (SEM)

NMDS analysis was based on Bray–Curtis distance, the stress was 0.002, and the total explained variation was 92.69% (82.59% + 10.10%) (Figure 7). The results revealed that the three treatments could be divided into three groups based on tillage depth, which was obviously different from each other, and tillage depth distinctly affected field capacity, soil bulk density, plow pan thicknesses, TN, TK, and TP. Tillage depth had an obvious positive correlation with field capacity. Yields, water use efficiency, photosynthetic rate, and water consumption had an obvious positive correlation with each other which clustered together. Soil bulk density, plow pan thicknesses, TN, TK, and TP had an obvious negative correlation with tillage depth and field capacity. In addition, yields, water use efficiency, photosynthetic rate, and water consumption were higher for D25 than that for D20 and D30; soil bulk density, TN, and TK were higher for D20 than that for D25 and D30.
SEM analysis was used to analyze the major influence factors on yields and explain the contributions of different factors (p = 0.298, GFI = 0.999, and RMSEA = 0.056) (GFI, goodness-of-fit index; RMSEA, Root Mean Square Error of Approximation) (Figure 8). Results showed that tillage significantly directly contributed to the reduction in total nitrogen, photosynthesis, and yields (λ = −0.843 ***, −1.443 ***, and −0.591 *). In addition, tillage had positive influences on water consumption (λ = 0.286). Total nitrogen significantly directly negatively impacted photosynthesis (λ = −1.514 ***), while water consumption significantly directly positively impacted photosynthesis (λ = 0.252 *). Increasing water consumption positively contributed to an increase in maize yields (λ = 0.864 ***), while photosynthesis had no positive influence on maize yields. The standardized total effects of rotary tillage depths, total nitrogen, photosynthetic rate, and water consumption on maize yields were −0.628, 0.019, 0.121, and 0.895 ***, respectively.
Table 4 shows hypothesis verification, the results showed that some observed variables had a significant relationship, and the hypotheses were supported (p < 0.05): tillage directly influenced total nitrogen, photosynthesis, and maize yields; total nitrogen directly influenced photosynthesis; water consumption directly influenced photosynthesis and maize yields. Some observed variables did not reach a significant relationship, and the hypotheses were not supported (p > 0.05): tillage directly influenced water consumption; photosynthesis and total nitrogen directly influenced maize yields.
Table 5 shows the goodness of fit statistics, and the results showed that the absolute fit index and value-added fit index were in a good state, and the index value reach the ideal state value. However, parsimonious goodness of fit index values including Reduced Benchmark Goodness of Fit Index and Simple Fit Index were less than 0.50 (the lower limit index reference value), which indicated that the parsimonious goodness of fit index was generally fit. Generally speaking, when the Normative Fit Index, Comparative Fitting Index, Goodness of Fit Index, and Mean Square Root of Approximation Error in the SEM were in a good state, the goodness of fit was in the acceptable range. Therefore, the goodness of fit in this study was acceptable.

4. Discussion

4.1. Responses of Bulk Density and Field Capacity to Tillage Depths

In the three-year experiment, the influence of tillage depths and different plow pan thicknesses on soil bulk density and field capacity was conducted. Soil tillage management can affect chemical and physical soil properties, including soil bulk density and soil water balance [31,32]. Tillage practices can temporarily loosen soil forming macro-pores, promote aeration, and alleviate soil compaction, which resulted in a decrease in soil bulk density [22,31]. Soil bulk density in the 0–10 cm soil layers was lower than that in the other soil layers because of the tillage; it declined with the depths of tillage in the 10–30 cm soil layers, which was due to tillage practices breaking up the plow pan in the 15–30 cm soil layers in this work (Figure 2). Reducing soil bulk density could make roots easily extend and penetrate deeper soil depths for absorbing water and nutrients [22]. In the 30–60 cm soil layers, there was no obvious difference in soil bulk density among different tillage depths, because of no–tillage in these soil layers.
Field capacity was negatively related to soil bulk density in the same layers. It was highest in the 0–10 cm soil layers among the 0–60 soil layers in this study. The field capacity of 0.4–0.6 m3·m−3 in the 0–10 cm soil layer was much higher than that (0.27 m3·m−3) in the study of Tesfahunegn [33]. Soil pore was small or sparse, resulting in high soil bulk density or compact soil; less soil pore space resulted in less water hold up by the soil, and soil water retention capacity decreased. Breaking up the plow pan was an effective measure for loosening the soil and increasing soil water retention capacity [34]. Precipitation is mostly concentrated in maize growing seasons in the North China Plain and some of the rainfall was short but very intense (Figure 1), so partial loss of soil occurs frequently by runoff. The improvement of field capacity can increase soil water retention capacity and preserve runoff from heavy rainfall. Loosening soil and increasing field capacity were important measures for the retention of soil moisture. Some reports showed that tillage improved soil physical properties and played an important role in the crop growth and yields [35,36]. Rotary tillage (depths of 15–20 cm) increased the evaporation of soil water from the soil surface [37]; however, other researchers reported that the evaporation of subsoiling was significantly higher than that of rotary tillage [38]. These may be attributed to the plow pan impeding soil water infiltration, and the reduction in soil bulk density increasing soil pore, which resulted in an increase in evaporation. Therefore, plow pan and soil bulk density may be needed to maintain an appropriate degree for soil water retention and reducing evaporation.

4.2. Responses of Photosynthetic Rate, Water Use, and Yields to Tillage Depths

Photosynthetic rate is an important factor in increasing maize yields [24] and taking effective measures to promote maize growth after silking was important in an increase in maize yields [1]. In this study, the photosynthetic rate in the bell and silking stages was higher for D25 than that for D20 and D30, resulting in higher maize yields (Figure 4). The greater photosynthetic rate for D25 could be attributed to an increase in soil water consumption that enhanced maize water use efficiency. This result was consistent with previous reports that the improvement of soil water availability increased the photosynthetic rate [39]. A great soil water status is fundamental to achieving sustainably high crop yields [40], and increasing soil water consumption could improve crop yields [41], which was similar to this study. Water use efficiency is related to soil water consumption and maize yields. The greater photosynthetic rate could improve soil water consumption to accumulate more photosynthetic products, resulting in greater maize yields and water use efficiency. Soil tillage was an important factor for maize yields [42], and a tillage depth of 25 cm improved maize yields in this study. Some reports showed 60–70% of crop roots existed in the 0–30 cm soil layers [22,43], and loosening the depth of the 0–30 cm soil layers could improve roots to absorb more water and nutrients, resulting in more water consumption for D25 than that for D20. However, a tillage depth of 30 cm may increase soil water and nutrients in the 0–30 cm soil layers to permeate into the deeper soil layers, which decreased the water consumption and nutrient uptake of roots. These results may be because a tillage depth of 25 cm loosened the topsoil and broke up part of the plow pan, which reduced evaporation and increased soil water consumption, the photosynthetic rate, and nutrient uptake, resulting in maize yields. The results were consistent with the results of SEM (Figure 8), the total effect of water consumption on maize yields was highest for the four factors (λ = 0.885), and the total effect of tillage on maize yields was 0.019. Therefore, deeper tillage depths did not increase maize yields, and reasonable tillage depth needed to be maintained.

4.3. Responses of Soil Nitrogen, Phosphorus and Kalium to Tillage Depths

Soil nutrients (including nitrogen, phosphorus, and kalium) were one of the most important factors impacting soil health and crop production [44]. Improving available phosphorus and nitrogen in the 0–20 cm soil layers was beneficial for improving soil quality, crop yields, and water use efficiency [41]. Nitrogen fertilizer is important in agronomic practices, and supplying nitrogen fertilizer could obtain high maize yields under low nitrogen conditions [45,46]. The same nitrogen fertilizer mass was conducted in the three treatments in this study; however, the TN content decreased with an increase in rotary tillage depths in the 0–20 cm soil layers. This was because loosening the 20–30 cm soil layers improved the nitrogen permeate into the deeper soil layers from the 0–20 cm soil layers. Phosphorus has poor mobility resulting in no difference for the three treatments, while the kalium trend was similar to that of nitrogen (Figure 6). Subsoiling broke up the plow pan and promoted root penetration to absorb more nutrients in the deeper soil layers [24]. However, reducing nitrogen leaching into deeper soil layers was important for increasing crop yields [47]. The maize yields for D25 were higher than that for D30, which might attribute to the more nitrogen leaching of D30. Subsoiling could increase maize yields, which was different from this study [19,24]. Because 60–70% of crop roots existed in the 0–30 cm soil layers, breaking up the plow pan in the 20–30 cm soil layers resulted in more water and nutrients leaching into deeper soil layers (higher than 30 cm). Moreover, on the one hand, the plow pan of 5 cm and the tillage depth of 25 cm could reduce soil water and nutrients leaching through the plow pan compared to D30. On the other hand, it could improve root uptake for water and nutrients in the 0–20 cm soil layers compared to D20. That was the reason that D25 had higher soil water consumption, photosynthetic rate, maize yields, and water use efficiency than D20 and D30.

5. Conclusions

Tillage has a huge impact on the soil’s physical and chemical properties and maize yields. Rotary tillage is a common tillage practice in the North China Plain. A long-term common rotary tillage resulted in a hard plow pan, which induced a decrease in maize yields. However, the impact of changing rotary tillage depths and maintaining different thicknesses of plow pan on maize yields was unclear. This study’s main contribution is to recognize the importance of rotary tillage depths and thicknesses of plow pan and was expected to guide future agricultural cultivation. The results demonstrated that the tillage depth of 25 cm can improve photosynthetic rate, water consumption, and maize yields. Soil bulk density decreased in the 0–30 cm soil layers, field capacity increased in the 10–30 cm soil layers, and total nitrogen in the 0–20 cm soil layers decreased with an increase in tillage depths. Maize yields increased with an increase in photosynthetic rate and soil water consumption, and the DNDC model predicted maize yields well. NMDS revealed that soil bulk density, plow pan thicknesses, total nitrogen, total phosphorus, and total potassium had an obvious negative correlation with tillage depths and field capacity; maize yields had an obvious positive correlation with water use efficiency, photosynthetic rate, and water consumption. Tillage indirectly impacted maize yields by photosynthetic rate and soil water consumption in the SEM model. The plow pan thickness of 5 cm and the tillage depth of 25 cm for D25 could increase soil water consumption and reduce nutrients leaching through the plow pan to some degree. Therefore, D25 improved nutrient uptake and photosynthetic rate resulting in an increase in maize yields. The depths of tillage impacted maize yields, and the 5 cm plow pan could keep nutrients and water in the soil, thereby maize yields increased. The results showed the plow pan had positive effects. A rotary tillage depth of 25 cm and plow pan thickness of 5 cm are suitable rotary tillage depths for improving maize yields in the North China Plain. As a result, these findings contribute to understanding how rotary tillage can increase maize yields by changing soil properties, plow pan, water consumption, and so on. However, a long-term rotary tillage experiment is needed to further reveal the effects of tillage depths and plow pan on soil properties and maize yields. In addition, types of fertilizers, straw retention, and weather impacts are also future research directions.

Author Contributions

Conceptualization, L.W. (Lishu Wang), H.G., L.W. (Lixuan Wang), and D.C.; methodology, L.W. (Lishu Wang); software, H.G.; validation, L.W. (Lishu Wang) and D.C.; formal analysis, L.W. (Lishu Wang); investigation, L.W. (Lixuan Wang); resources, D.C.; data curation, L.W. (Lishu Wang) and H.G.; writing—original draft preparation, L.W. (Lishu Wang); writing—review and editing, H.G. and L.W. (Lixuang Wang); visualization, H.G.; supervision, D.C.; project administration, D.C.; funding acquisition, D.C. All authors have read and agreed to the published version of the manuscript.

Funding

This study was financially supported by the National Key Research and Development Plan (No. 2017YFD0300905) and the Natural Science Foundation of Hebei Province (No. E2019402468).

Institutional Review Board Statement

Not applicable.

Informed Consent Statement

Informed consent was obtained from all subjects involved in this study.

Data Availability Statement

The data presented in this study are available on request from the corresponding author.

Conflicts of Interest

The authors declare no conflict of interest.

References

  1. Gao, Z.; Liang, X.G.; Lin, S.; Zhao, X.; Zhou, S.L. Supplemental irrigation at tasseling optimizes water and nitrogen distribution for high-yield production in spring maize. Field Crops Res. 2017, 209, 120–128. [Google Scholar] [CrossRef]
  2. Sun, H.Y.; Zhang, X.Y.; Wang, E.L.; Chen, S.Y.; Shao, L.W. Quantifying the impact of irrigation on groundwater reserve and crop production—A case study in the North China Plain. Eur. J. Agron. 2015, 70, 48–56. [Google Scholar] [CrossRef]
  3. Zhai, L.C.; Xu, P.; Zhang, Z.B.; Li, S.K.; Xie, R.Z.; Zhai, L.F.; Wei, B.H. Effects of deep vertical rotary tillage on dry matter accumulation and grain yield of summer maize in the Huang-Huai-Hai Plain of China. Soil Res. 2017, 170, 167–174. [Google Scholar] [CrossRef]
  4. Zhai, L.; Wang, Z.; Song, S.; Zhang, L.; Zhang, Z.; Jia, X. Tillage practices affects the grain filling of inferior kernel of summer maize by regulating soil water content and photosynthetic capacity. Agric. Water Manag. 2021, 245, 106600. [Google Scholar] [CrossRef]
  5. Zhang, Z.; Peng, X. Bio-tillage: A new perspective for sustainable agriculture. Soil Tillage Res. 2021, 206, 104844. [Google Scholar] [CrossRef]
  6. Beyaert, R.P.; Schott, J.W.; White, P.H. Tillage effects on corn production in a coarse-textured soil in Southern Ontario. Agron. J. 2002, 94, 767–774. [Google Scholar] [CrossRef]
  7. Botta, G.F.; Jorajuria, D.; Balbuena, R.; Ressia, M.; Ferrero, C.; Rosatto, H.; Tourn, M. Deep tillage and traffic effects on subsoil compaction and sunflower (Helianthus annus L.) yields. Soil Tillage Res. 2006, 91, 164–172. [Google Scholar] [CrossRef]
  8. Li, Y.M.; Duan, Y.; Wang, G.L.; Wang, A.Q.; Zhang, D.M. Straw alters the soil organic carbon composition and microbial community under different tillage practices in a meadow soil in northeast China. Soil Tillage Res. 2021, 208, 104879. [Google Scholar] [CrossRef]
  9. Berhe, F.T.; Fanta, A.; Alamirew, T.; Melesse, A.M. The effect of tillage practices on grain yield and water use efficiency. Catena 2013, 100, 128–138. [Google Scholar] [CrossRef]
  10. Václav, S.; Radek, V.; Jana, C.; Helena, K.; Pavel, R. Winter wheat yield and quality related to tillage practice: Input level and environmental conditions. Soil Tillage Res. 2013, 132, 77–85. [Google Scholar]
  11. Schneider, F.; Don, A.; Hennings, I.; Schmittmann, O.; Seidel, S.J. The effect of deep tillage on crop yield-what do we really know? Soil Tillage Res. 2017, 174, 193–204. [Google Scholar] [CrossRef]
  12. Li, D.C.; Zhang, G.L.; Gong, Z.T. On taxonomy of shajiang black soils in China. Soils 2011, 43, 623–629, (In Chinese with English abstract). [Google Scholar]
  13. Leskiw, L.A.; Welsh, C.M.; Zeleke, T.B. Effect of subsoiling and injection of pelletized organic matter on soil quality and productivity. Can. J. Soil Sci. 2012, 92, 269–276. [Google Scholar] [CrossRef]
  14. Wang, Q.J.; Lu, C.Y.; Li, H.W.; He, J.; Sarker, K.K.; Rasaily, R.G.; Liang, Z.H.; Qiao, X.D.; Li, H.; Mchugh, A.D.J. The effects of no-tillage with subsoiling on soil properties and maize yield: 12-year experiment on alkaline soils of Northeast China. Soil Tillage Res. 2014, 137, 43–49. [Google Scholar] [CrossRef]
  15. Singh, K.; Choudhary, O.P.; Singh, H. Effects of sub-soiling on sugarcane productivity and soil properties. J. Suarcane Res. 2013, 2, 32–36. [Google Scholar]
  16. Tao, Z.Q.; Sui, P.; Chen, Y.Q.; Chao, L.I.; Nie, Z.J.; Yuan, S.F.; Shi, J.T.; Gao, W.S. Subsoiling and ridge tillage alleviate the high temperature stress in spring maize in the north China plain. J. Integr. Agric. 2013, 12, 2179–2188. [Google Scholar] [CrossRef]
  17. Ma, S.; Yu, Z.; Shi, Y.; Gao, Z.; Luo, L.; Chu, P.; Guo, Z. Soil water use, grain yield and water use efficiency of winter wheat in a long-term study of tillage practices and supplemental irrigation on the North China Plain. Agric. Water Manag. 2015, 150, 9–17. [Google Scholar] [CrossRef]
  18. Shi, Y.; Yu, Z.; Man, J. Tillage practices affect dry matter accumulation and grain yield in winter wheat in the north China plain. Soil Tillage Res. 2016, 160, 73–81. [Google Scholar] [CrossRef]
  19. Li, S.; Wu, X.; Liang, G.; Gao, L.; Wang, B.; Lu, J.; Abdelrhman, A.A.; Song, X.; Zhang, M.; Zheng, F.; et al. Is least limiting water range a useful indicator of the impact of tillage management on maize yield? Soil Tillage Res. 2020, 199, 104602. [Google Scholar] [CrossRef]
  20. Celik, I.; Gunal, H.; Acir, N.; Barut, Z.B.; Budak, M. Soil quality assessment to compare tillage systems in cukurova plain, turkey. Soil Tillage Res. 2021, 208, 104892. [Google Scholar] [CrossRef]
  21. Alskaf, K.; Mooney, S.J.; Sparkes, D.L.; Wilson, P.; Sjgersten, S. Short-term impacts of different tillage practices and plant residue retention on soil physical properties and greenhouse gas emissions. Soil Tillage Res. 2021, 206, 104803. [Google Scholar] [CrossRef]
  22. Huang, G.B.; Chai, Q.; Feng, F.X.; Yu, A.Z. Effects of different tillage systems on soil properties, root growth, grain yield, water use efficiency of Winter wheat (Triticumaestivum L.) in arid northwest China. J. Integr. Agric. 2012, 11, 1286–1296. [Google Scholar] [CrossRef]
  23. Denis, T.O.P.A.; Gales, D.; Chiriac, G.; Lucian, R.Ä.; Gerard, J.I.T.Ä. Impact of plowing on some soil physical properties under hybrid seed corn production. Proenviron. Promediu 2013, 6, 183–186. [Google Scholar]
  24. Lamptey, S.; Li, L.; Xie, J.; Coulter, J.A. Tillage system affects soil water and photosynthesis of plastic-mulched maize on the semiarid loess plateau of China. Soil Tillage Res. 2020, 196, 104479. [Google Scholar] [CrossRef]
  25. Cai, H.; Ma, W.; Zhang, X.; Ping, J.; Yan, X. Effect of subsoil tillage depth on nutrient accumulation, root distribution, and grain yield in spring maize. Crop J. 2014, 2, 297–307. [Google Scholar] [CrossRef] [Green Version]
  26. Bhandari, M.; Ma, Y.; Men, M.; Wu, M.; Xue, C.; Wang, Y.; Li, Y.; Peng, Z. Response of winter wheat yield and soil N2O emission to nitrogen fertilizer reduction and nitrapyrin application in North China Plain. Commun. Soil Sci. Plan. 2020, 51, 554–565. [Google Scholar] [CrossRef]
  27. Gardner, W.H. Water content. In Methods of Soil Analysis, Part 1-Physical and Mineralogical Methods; Klute, A., Ed.; Soil Science Society of America, lnc.: Madison, WI, USA, 1986; pp. 493–544. [Google Scholar]
  28. Li, Z.; Li, B.; Li, Y.; Cui, Y. Research on the water use efficiency and optimal irrigation schedule of the winter wheat. Trans. Chin. Soc. Agric. Eng. 2004, 20, 58–63. [Google Scholar]
  29. Guo, H.G.; Li, Q.; Wang, L.L.; Cheng, Q.L.; Hu, H.W.; Cheng, D.J.; He, J.Z. Semi-solid state promotes the methane production during anaerobic co-digestion of chicken manure with corn straw comparison to wet and high-solid state. J. Environ. Manag. 2022, 316, 115264. [Google Scholar] [CrossRef]
  30. Zheng, L.; Li, R.Y.M. Tourist satisfaction, willingness to revisit and recommend, and mountain kangyang tourism spots sustainability: A structural equation modelling approach. Sustainability 2021, 13, 10620. [Google Scholar] [CrossRef]
  31. Matosic, S.; Birka’s, S.; Vukadinovic, S.; Kisic, I.; Bogunovic, I. Tillage, manure and gypsum use in reclamation of saline-sodic soils. Agric. Conspectus Sci. 2018, 83, 13–138. [Google Scholar]
  32. Buesa, I.; Miras-Avalos, J.M.; De Paz, J.M.; Visconti, F.; Intrigliolo, D.S. Soil management in semi-arid vineyards: Combined effects of organic mulching and no-tillage under different water regimes. Eur. J. Agron. 2021, 123, 126198. [Google Scholar] [CrossRef]
  33. Tesfahunegn, G.B. Short-term effects of tillage practices on soil properties under tef [eragrostis tef (zucc. trotter)] crop in northern ethiopia. Agric. Water Manag. 2015, 148, 241–249. [Google Scholar] [CrossRef]
  34. Alvarez, R.; Steinbach, H.S. A review of the effects of tillage systems on some soilphysical properties, water content, nitrate availability and crops yield in the Argentine Pampas. Soil Tillage Res. 2009, 104, 1–15. [Google Scholar] [CrossRef]
  35. Ding, Z.; Kheir, A.M.S.; Ali, O.A.M.; Hafez, E.M.; ElShamey, E.A.; Zhou, Z.; Wang, B.; Lin, X.; Ge, Y.; Fahmy, A.; et al. A vermicompost and deep tillage system to improve saline-sodic soil quality and wheat productivity. J. Environ. Manag. 2021, 277, 111388. [Google Scholar] [CrossRef]
  36. Jabro, J.D.; Sainju, U.M.; Lenssen, A.W.; Evans, R.G. Tillage effects on dryland soil physical properties in northeastern Montana. Commun. Soil Sci. Plant Anal. 2011, 42, 2179–2187. [Google Scholar] [CrossRef]
  37. Biazin, B.; Sterk, G. Drought vulnerability drives land-use and land cover changesin the rift valley dry lands of Ethiopia. Agric. Ecosyst. Environ. 2013, 164, 100–113. [Google Scholar] [CrossRef]
  38. Kuang, N.; Tan, D.; Li, H.; Gou, Q.; Li, Q.; Han, H. Effects of subsoiling before winter wheat on water consumption characteristics and yield of summer maize on the north China plain. Agric. Water Manag. 2020, 227, 105786. [Google Scholar] [CrossRef]
  39. Baronti, S.; Vaccari, F.P.; Miglietta, F.; Calzolari, C.; Lugato, E.; Orlandini, S.; Pini, R.; Zulian, C.; Genesio, L. Impact of biochar application on plant water relations in Vitis vinifera. Eur. J. Agron. 2014, 53, 38–44. [Google Scholar] [CrossRef]
  40. Zhang, Y.; Wang, R.; Wang, H.; Wang, S.; Li, J. Soil water use and crop yield increase under different long-term fertilization practices incorporated with two-year tillage rotations. Agric. Water Manag. 2019, 221, 362–370. [Google Scholar] [CrossRef]
  41. Xue, L.; Khan, S.; Sun, M.; Anwar, S.; Ren, A.; Gao, Z.; Lin, W.; Xue, J.; Yang, Z.; Deng, Y. Effects of tillage practices on water consumption and grain yield of dry land winter wheat under different precipitation distribution in the loess plateau of China. Soil Tillage Res. 2019, 191, 66–74. [Google Scholar] [CrossRef]
  42. Grassini, P.; Thorburn, J.; Burr, C.; Cassman, K.G. High-yield irrigated maize in the Western U.S. Corn Belt: I. On-farm yield, yield potential, and impact of agronomic practices. Field Crops Res. 2011, 120, 142–150. [Google Scholar] [CrossRef] [Green Version]
  43. Yin, W.; Chai, Q.; Guo, Y.; Feng, F.; Zhao, C.; Yu, A.; Hu, F. Analysis of leaf area index dynamic and grain yield components of inter cropped wheat and maize under straw mulch combined with reduced tillage in arid environments. J. Agric. Sci. 2016, 8, 26–42. [Google Scholar]
  44. Nael, M.; Khademi, H.; Hajabbasi, M. Response of soil quality indicators and their spatial variability to land degradation in central Iran. Appl. Soil Ecol. 2004, 27, 221–232. [Google Scholar] [CrossRef]
  45. Shen, L.X.; Huang, Y.K.; Ting, L.I. Top-grain filling characteristics at an early stage of maize (Zea mays L.) with different nitrogen use efficiencies. J. Integr. Agric. 2017, 16, 626–639. [Google Scholar] [CrossRef] [Green Version]
  46. Shi, J.H.; Zhao, Y.J.; Yu, Z. Strip rotary tillage with subsoiling increases winter wheat yield by alleviating leaf senescence and increasing grain filling. Crop J. 2020, 8, 327–340. [Google Scholar]
  47. Rasmussen, I.S.; Thorup-Kristensen, K. Does earlier sowing of winter wheat improve root growth and N uptake? Field Crops Res. 2016, 196, 10–21. [Google Scholar] [CrossRef]
Figure 1. Daily air temperature and precipitation data in 2017–2019 at experimental site.
Sustainability 14 15134 g001
Figure 2. Soil bulk density for 20 cm tillage depth treatment (D20), 25 cm tillage depth treatment (D25), and 30 cm tillage depth treatment (D30) at 0–60 cm soil depth in 2017, 2018, and 2019. Note: the letters (a–f) represent the significant difference (p < 0.05) among different treatments.
Sustainability 14 15134 g002
Figure 3. Field capacity for 20 cm tillage depth treatment (D20), 25 cm tillage depth treatment (D25), and 30 cm tillage depth treatment (D30) at 0–60 cm soil depth in 2017, 2018, and 2019. Note: the letters (a–e) represent the significant difference (p < 0.05) among different treatments.
Sustainability 14 15134 g003
Figure 4. The photosynthetic rate for 20 cm topsoil depth (D20), 25 cm topsoil depth (D25), and 30 cm topsoil depth (D30) at jointing, bell, and silking periods of maize in 2017, 2018, and 2019. Note: the letters (a–c) represent the significant difference (p < 0.05) among different treatments.
Sustainability 14 15134 g004
Figure 5. Water consumption (A) and water use efficiency (B) in the maize growing seasons for 20 cm tillage depth treatment (D20), 25 cm tillage depth treatment (D25), and 30 cm tillage depth treatment (D30) in 2017, 2018, and 2019. Note: the letters (a, b) represent the significant difference (p < 0.05) among different treatments.
Sustainability 14 15134 g005
Figure 6. Total nitrogen (A), total phosphorus (B), and total kalium (C) in the 0–20 cm soil layers before the sowing of maize for 20 cm tillage depth treatment (D20), 25 cm tillage depth treatment (D25), and 30 cm tillage depth treatment (D30) in 2017, 2018, and 2019. Note: the letters (a–c) represent the significant difference (p < 0.05) among different treatments.
Sustainability 14 15134 g006
Figure 7. Nonmetric multidimensional scaling (NMDS) among the eleven factors for the three treatments in 2017, 2018, and 2019.
Sustainability 14 15134 g007
Figure 8. Structural equation models (SEM) showing the effects of tillage depths, total nitrogen, water consumption, and photosynthetic rate on maize yields. Continuous arrows show positive relationships and dashed arrows show negative relationships, and numbers adjacent to the arrows represent path coefficients λ. Significance levels represented * p < 0.05, *** p < 0.001.
Sustainability 14 15134 g008
Table 1. Experimental design of maize farmland.
TreatmentsTillage Depth
/(cm)
Plow Pan Thickness
/(cm)
Fertilizer (kg·hm−2)
Slow-Release Fertilizer + Water-Retaining Agent + Calcium Ammonium Sulfate
D202010150 + 60 + 150
D25255150 + 60 + 150
D30300150 + 60 + 150
Table 2. Maize yields and predicted maize yields in DNDC95 for 20 cm tillage depth treatment (D20), 25 cm tillage depth treatment (D25), and 30 cm tillage depth treatment (D30) in 2017, 2018, and 2019. Note: the letters (a, b) represent the significant difference (p < 0.05) among different treatments.
YearTreatmentsYield/kg·hm−2Predicted Yield
/kg·hm−2
Difference (%)
2017D209373.9 b9037.53.6
D2511,795.9 a11,515.62.4
D309768.9 b10,965.25.3
2018D209540.5 b9212.73.4
D2511,286.8 a10,837.84.0
D309930.6 b10,282.33.5
2019D209959.2 b10,217.72.6
D2512,014.8 a11,447.54.7
D309326.3 b9585.42.8
Table 3. Factors consisting of maize yields for 20 cm tillage depth treatment (D20), 25 cm tillage depth treatment (D25), and 30 cm tillage depth treatment (D30) in 2017, 2018, and 2019. Note: the letters (a, b) represent the significant difference (p < 0.05) among different treatments.
YearTreatmentsSpike Length
/cm
Spike Diameter
/mm
Spike Weight
/g
100-Kernel Weight
/g
Spike RowsKernel Weight per Spike/g
2017D2016.3 b13.5 b205.4 b29.8 b13.8 b161.3 b
D2518.5 a15.6 a231.8 a33.6 a15.9 a185.7 a
D3016.8 b13.8 b198.5 b30.5 b13.2 b159.6 b
2018D2017.6 b14.1 b216.8 b32.5 b14.4 b163.8 b
D2518.8 a15.8 a238.6 a34.7 a15.8 a195.2 a
D3017.4 b13.9 b208.5 b30.8 b13.6 b176.3 b
2019D2017.1 b13.4 b198.6 b31.3 b13.2 b156.6 b
D2518.3 a15.4 a219.9 a34.1 a14.5 a182.8 a
D3016.8 b13.8 b201.3 b30.4 b13.0 b161.8 b
Table 4. Model measurement results. Note: Significance levels represented *** p < 0.001.
HypothesisEstimateS.E.C.R.pTest Result
Total nitrogen<---Tillage−0.8431.236−7.997***support
Water consumption<---Tillage0.2860.6301.5220.128not support
Photosynthesis<---Total nitrogen−1.5140.018−7.812***support
Photosynthesis<---Water consumption0.2520.0362.3140.021support
Photosynthesis<---Tillage−1.4430.223−7.205***support
Maize yields<---Water consumption0.8646.8849.856***support
Maize yields<---Photosynthesis0.12134.0460.8430.399not support
Maize yields<---Total nitrogen−0.4445.848−1.7060.088not support
Maize yields<---Tillage−0.59167.055−2.3200.020support
Table 5. Goodness of fit statistics.
Fitting IndexIndex ValueFit
Absolute fit
Chi-square value (CMIN)1.083--
Degree of freedom (DF)1--
CMIN/DF1.083<3good
Goodness of Fit Index (GFI)0.924>0.90good
Mean Residual Square Root (RMR)0<0.05good
Mean Square Root of Approximation Error (RMSEA)0.056<0.08good
Parsimonious goodness of fit
Reduced Benchmark Goodness of Fit Index (PNFI)0.099>0.50general
Simple Fit Index (PGFI)0.1>0.50general
Value-added fit
Normative Fit Index (NFI)0.991>0.90good
Irregular Fitting Index (TLI)0.992>0.90good
Comparative Fitting Index (CFI)0.999>0.90good
Publisher’s Note: MDPI stays neutral with regard to jurisdictional claims in published maps and institutional affiliations.

