

Seismicity and Stress State in the Ryukyu Islands Subduction Zone
Abstract
:1. Introduction
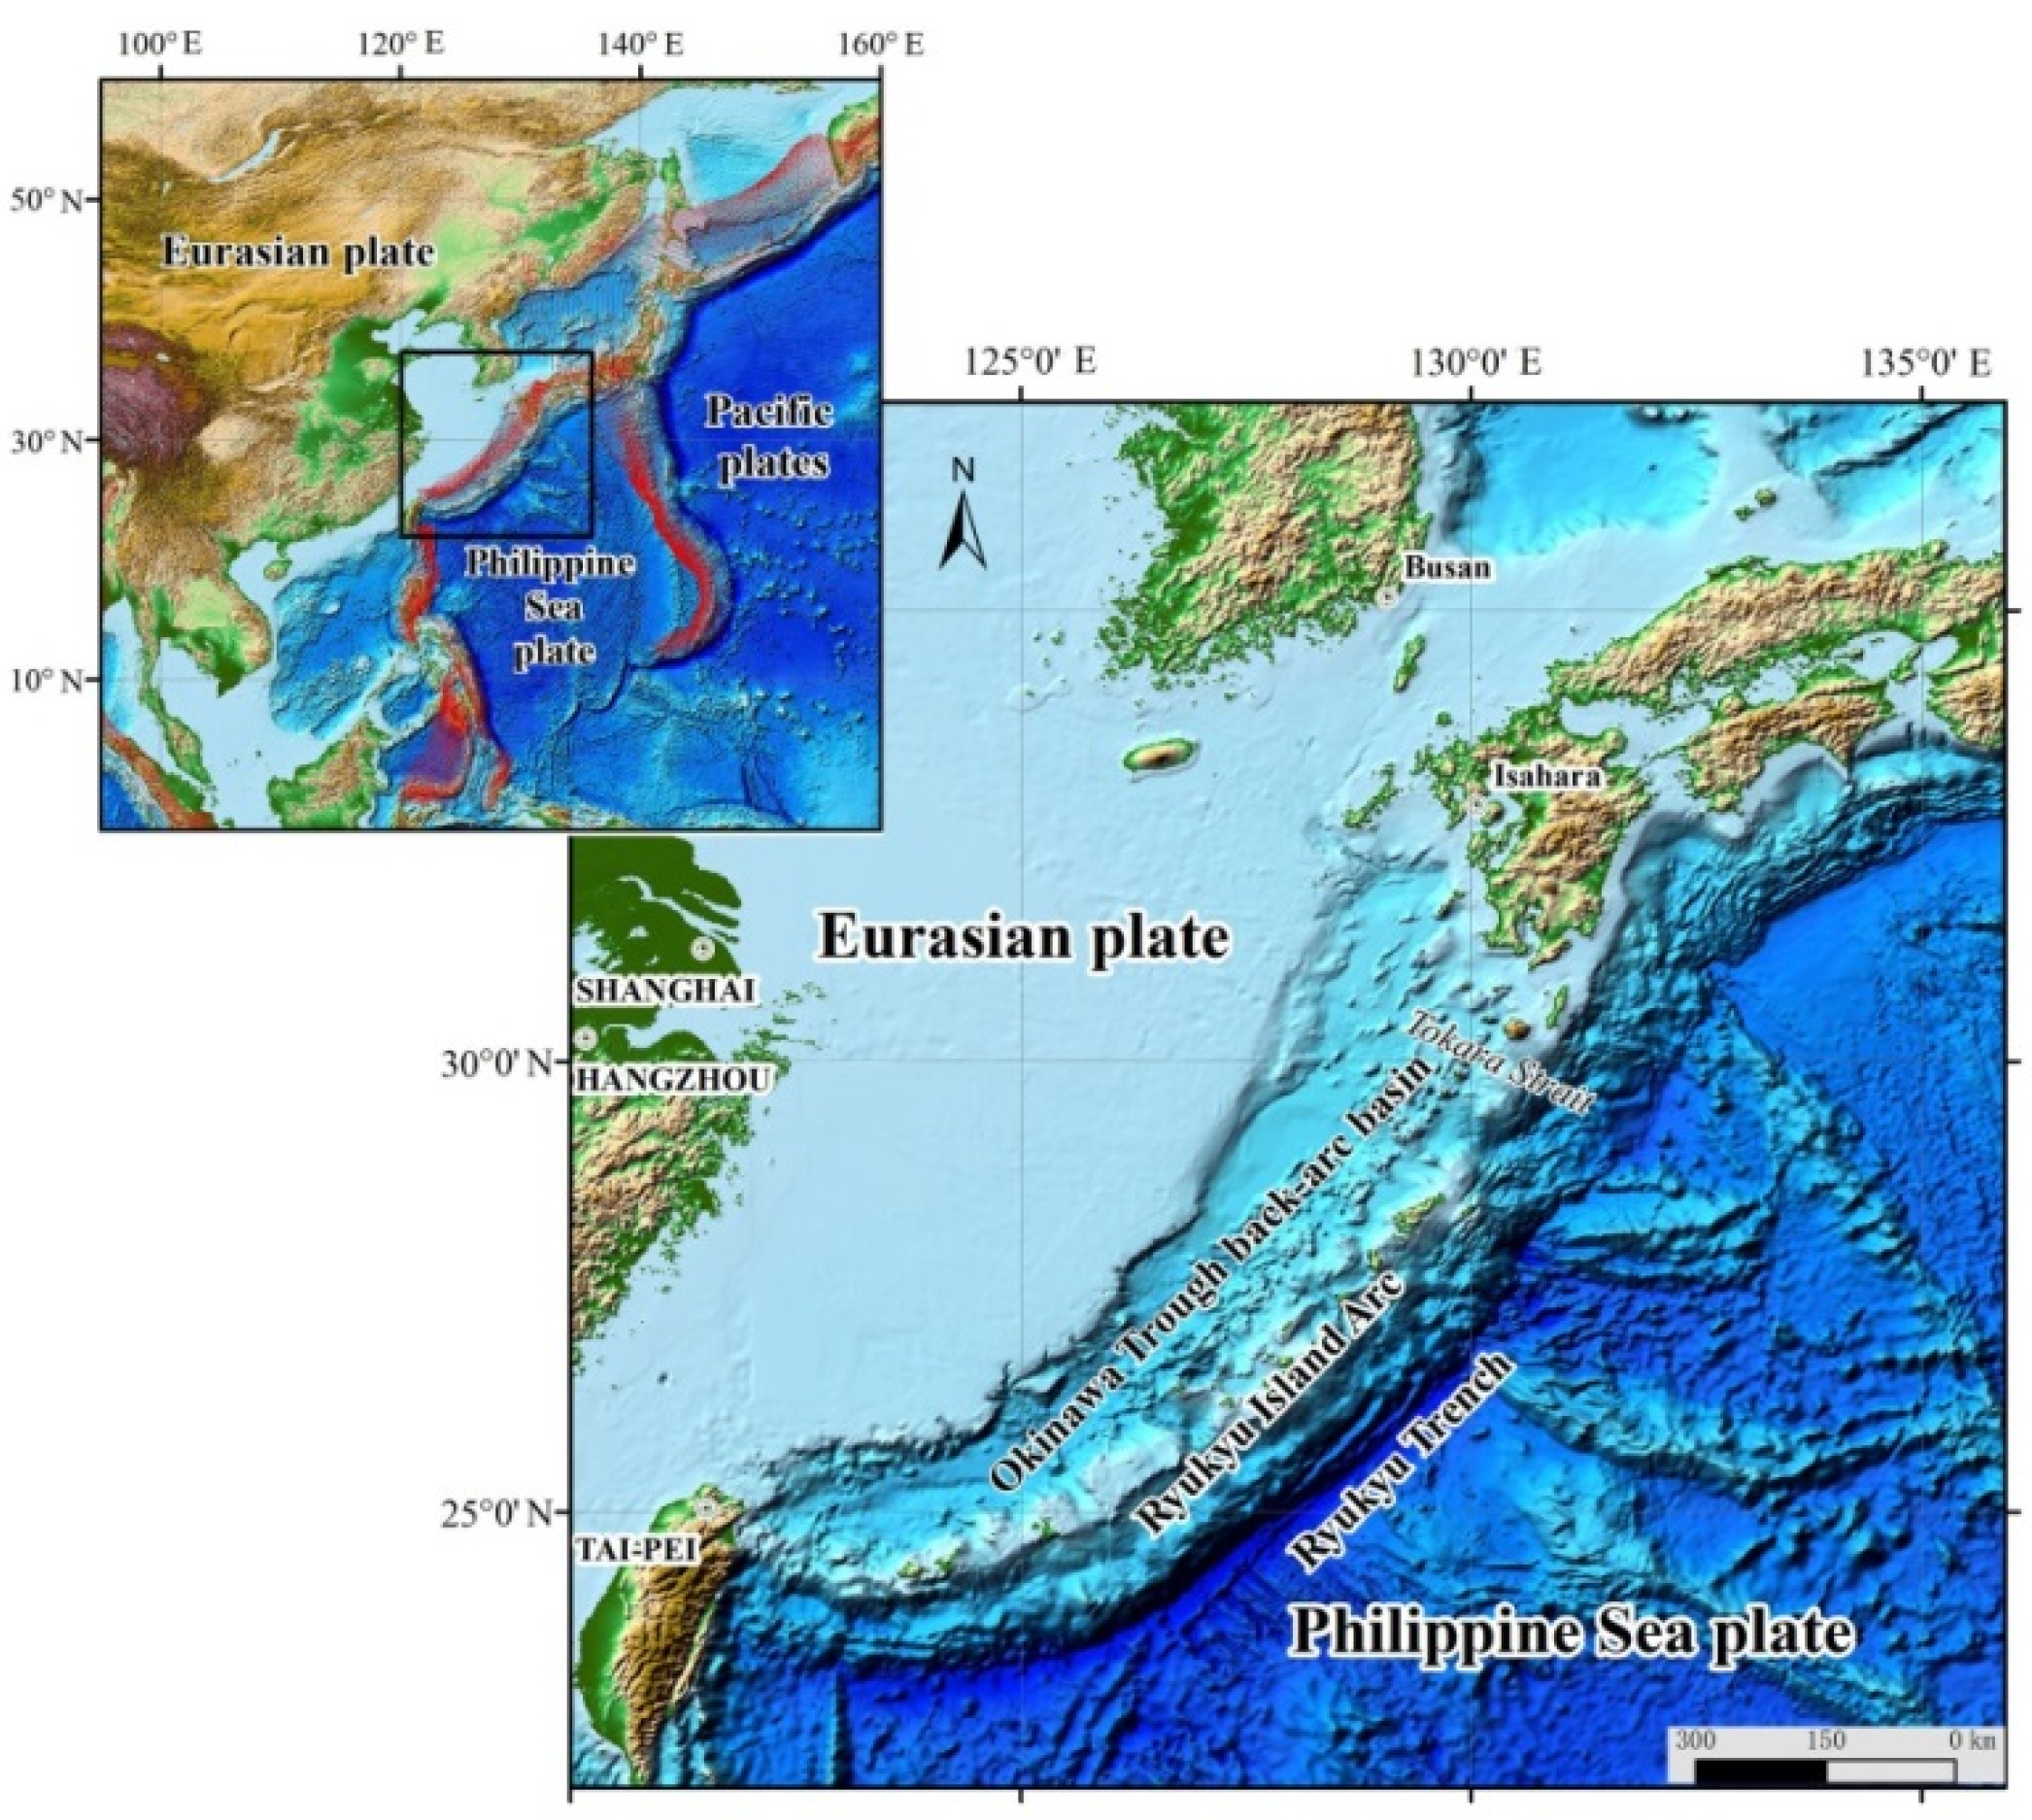
2. Seismotectonic Background of the Ryukyu Islands Subduction Zone
3. Characteristics of the Seismic Activity in the Ryukyu Islands Subduction Zone
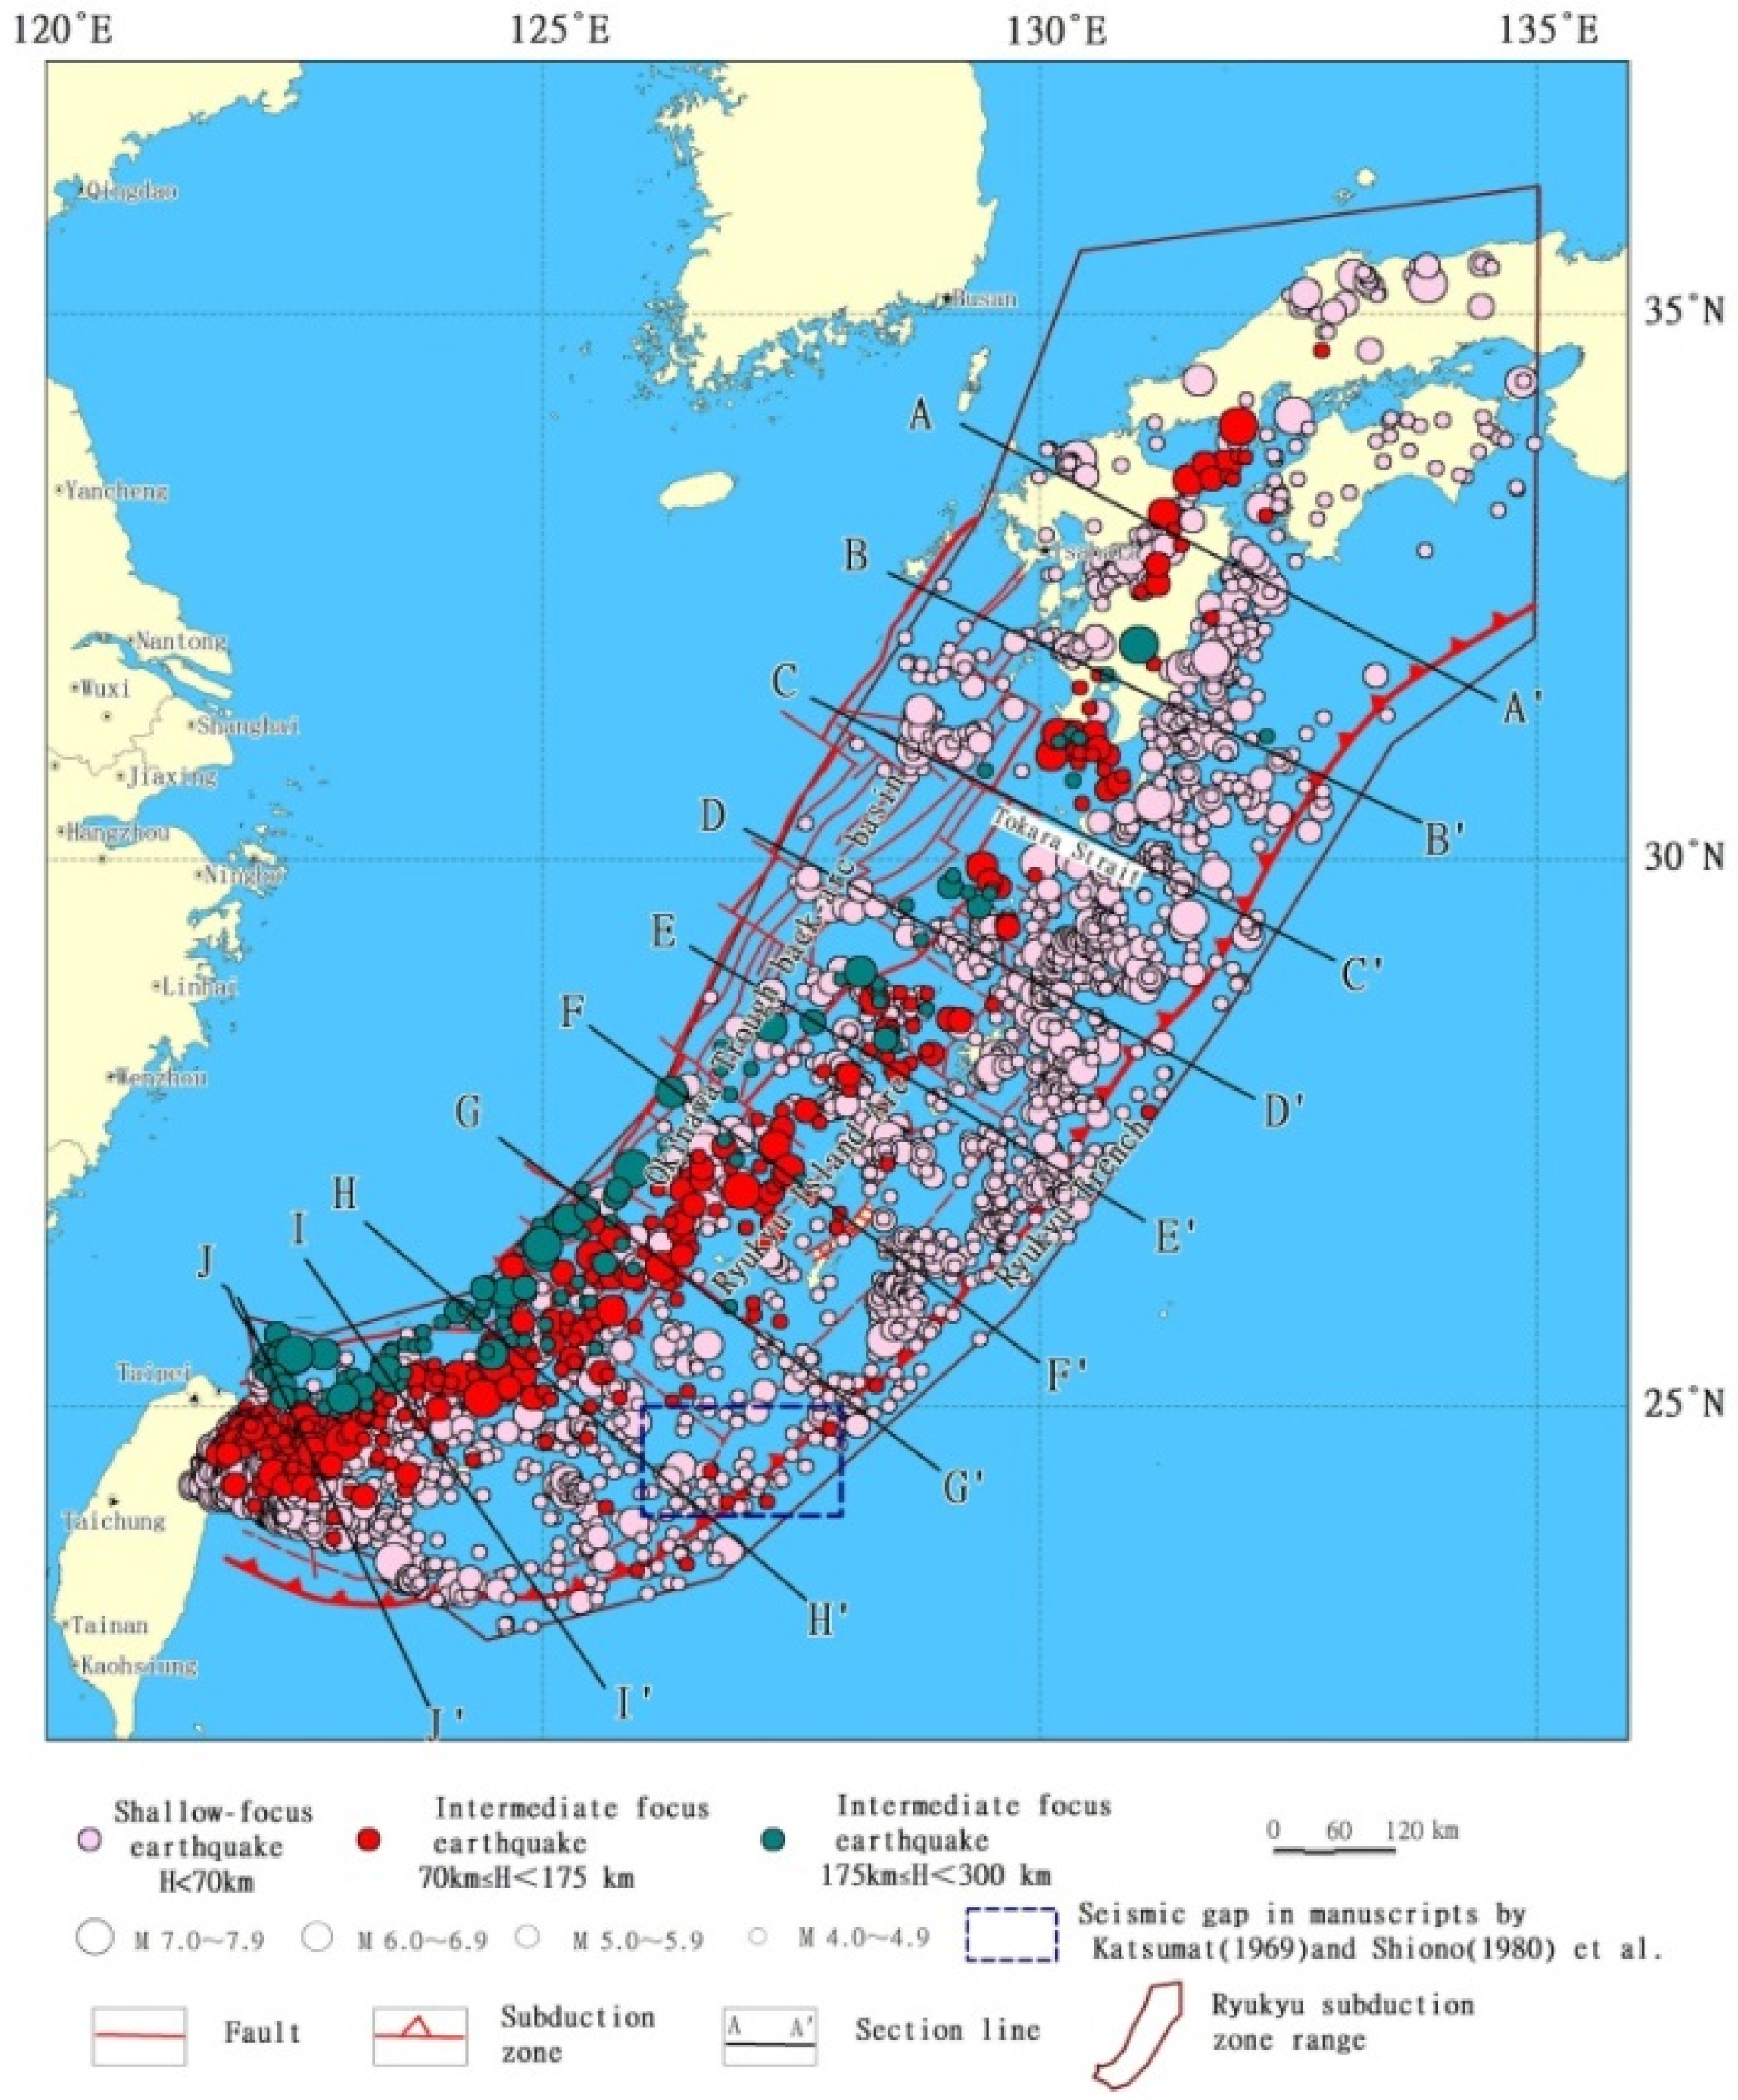
3.1. Epicenter Distribution
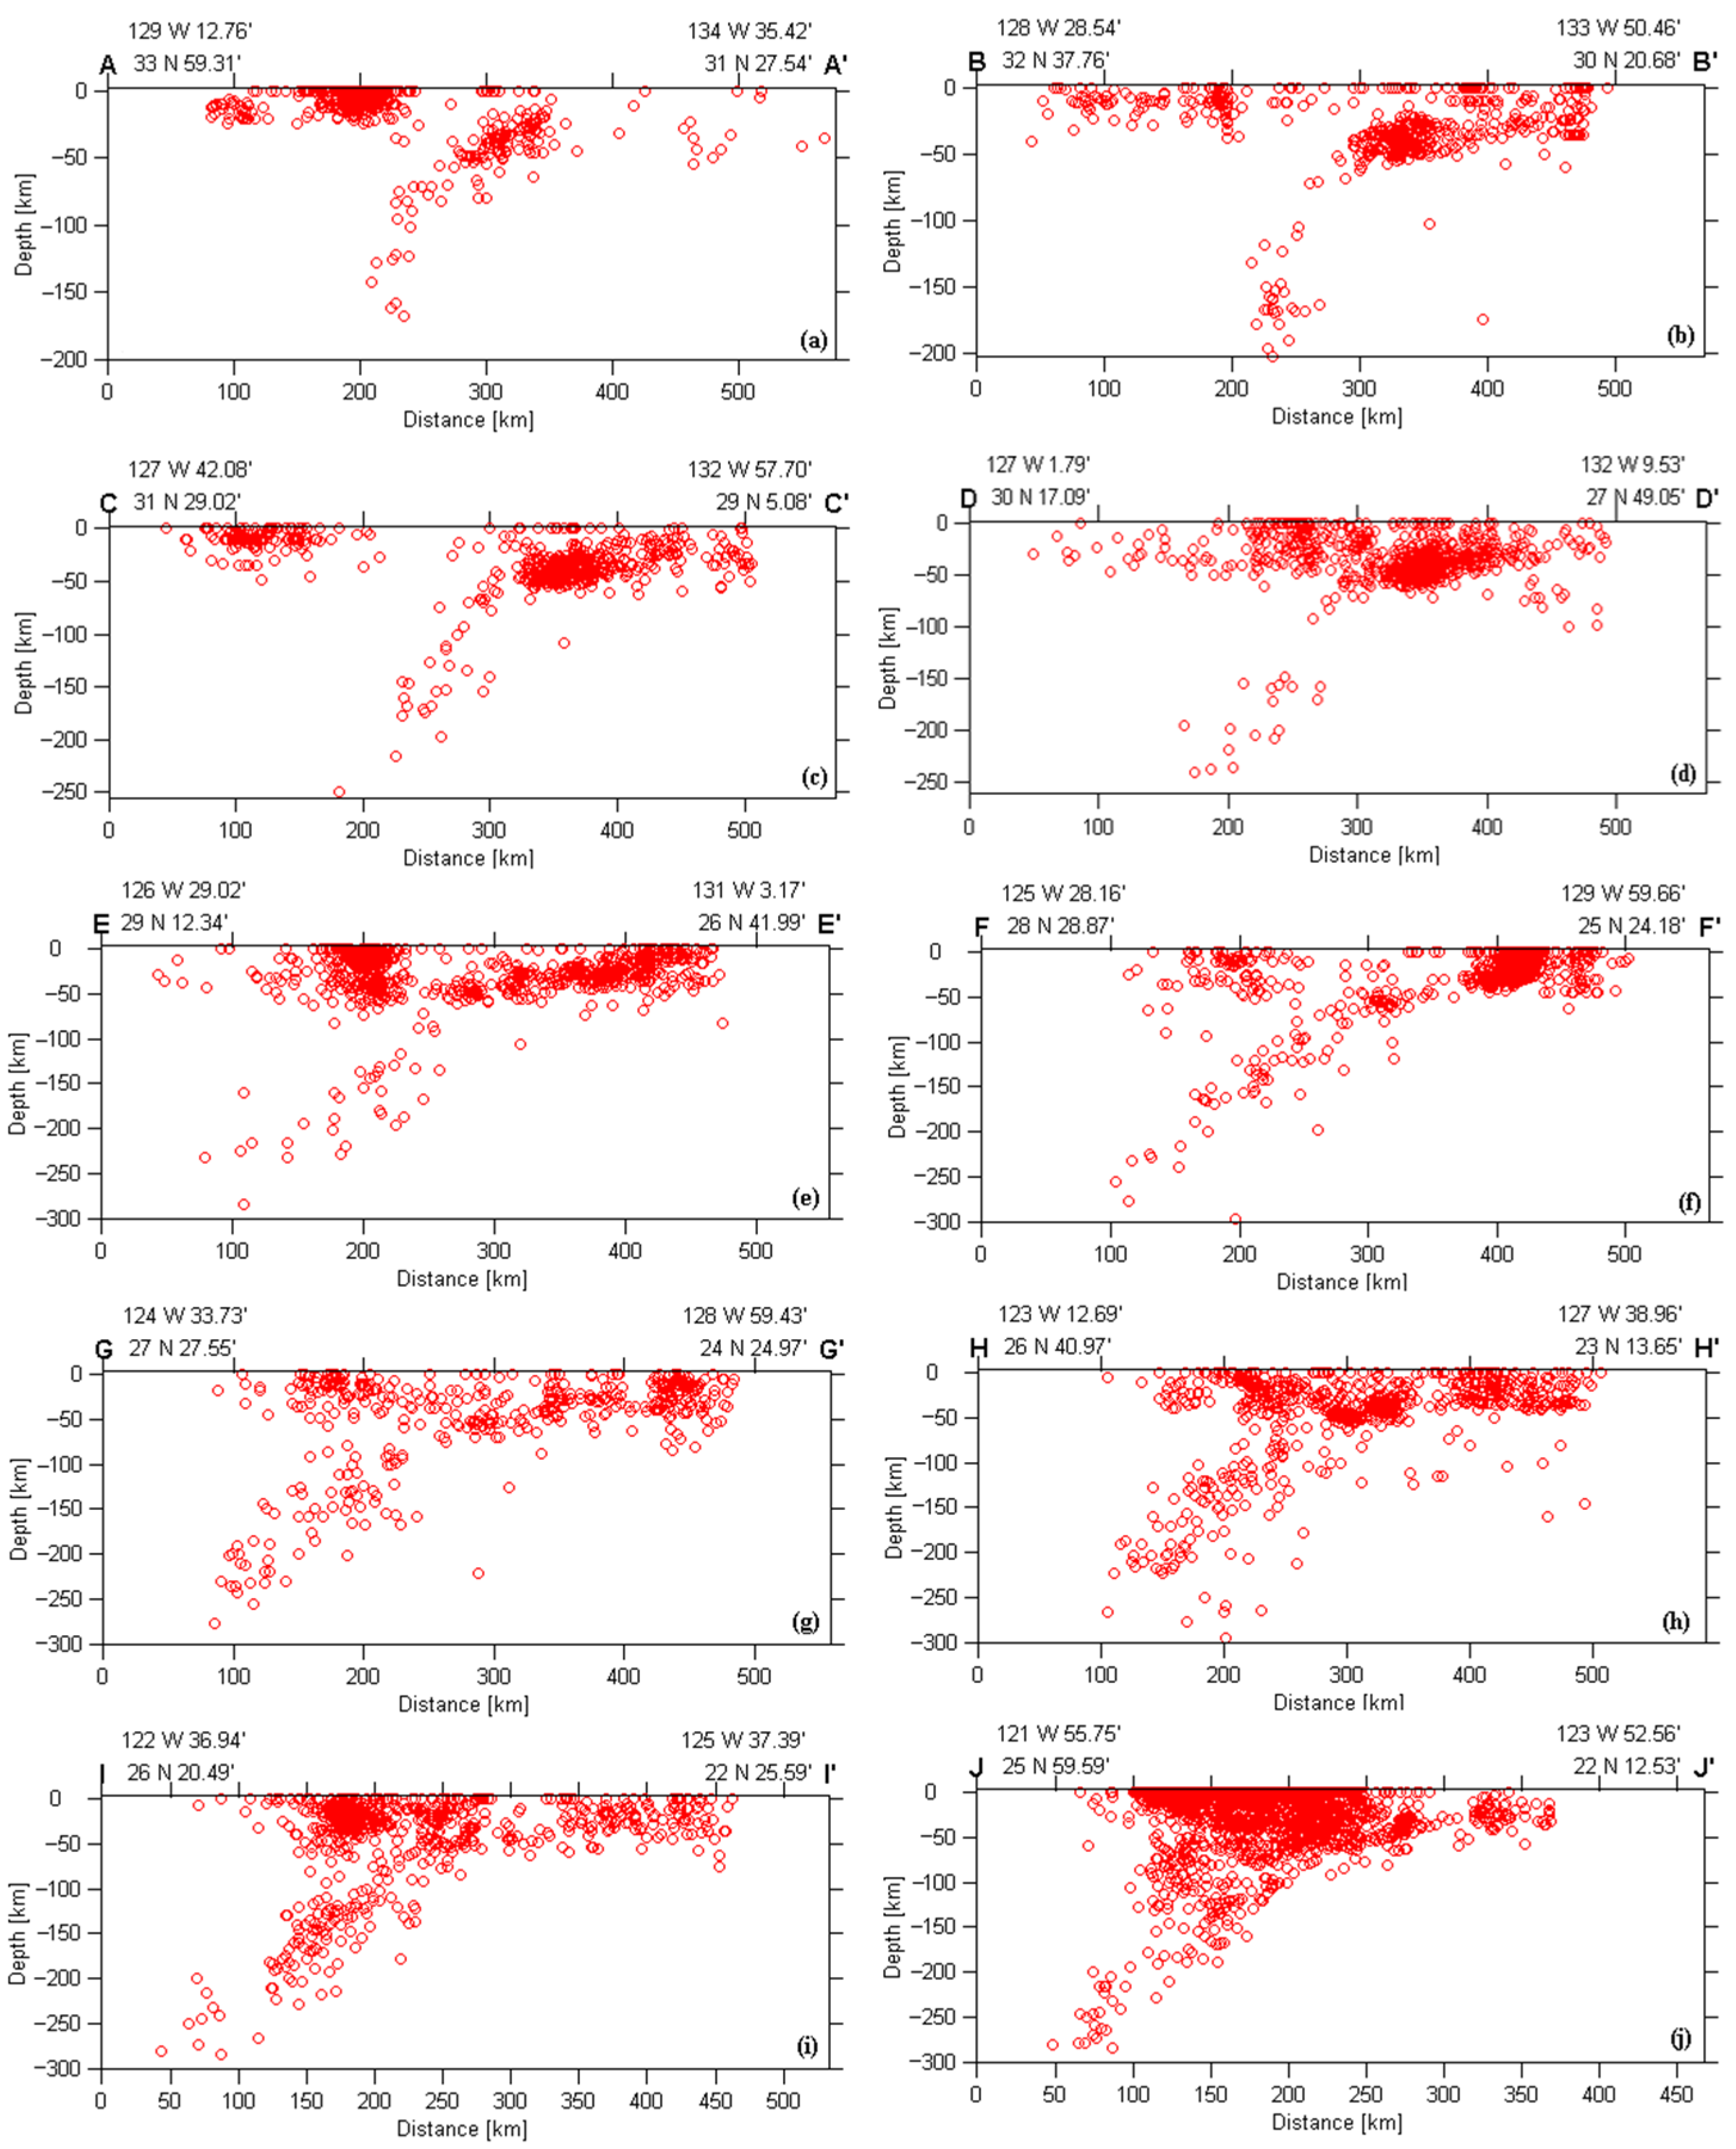
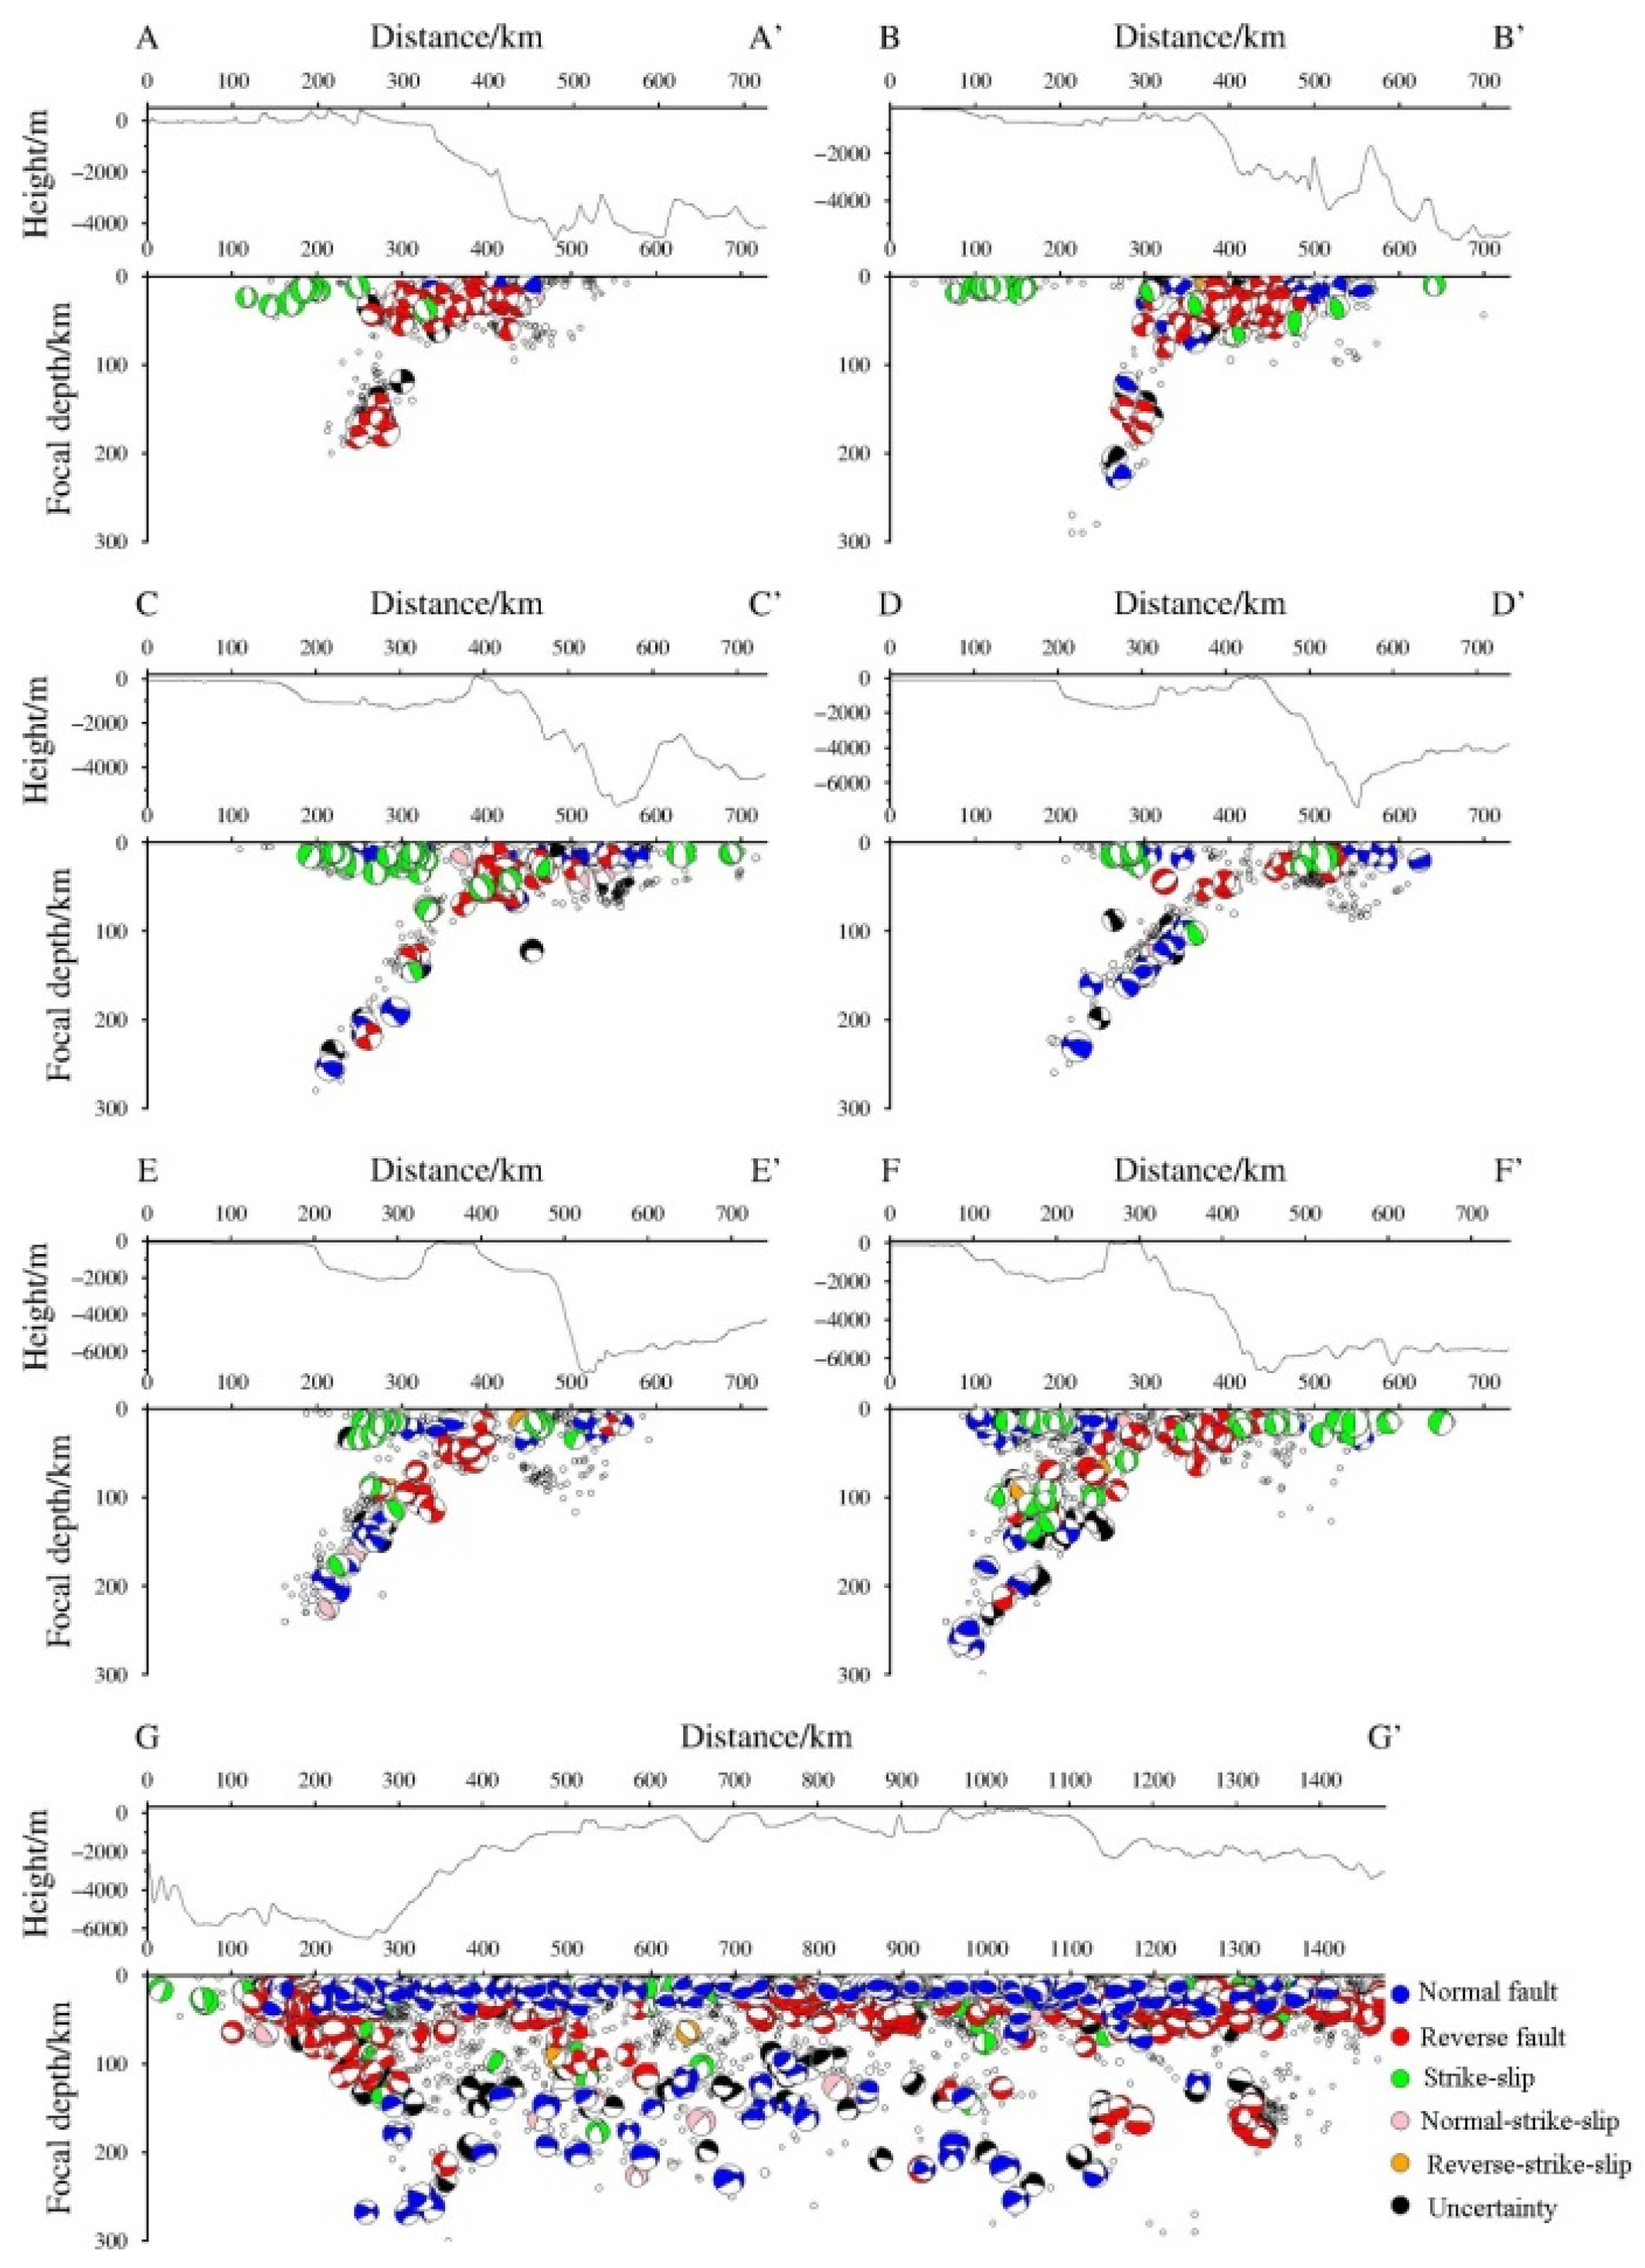
3.2. Focal Depth Distribution
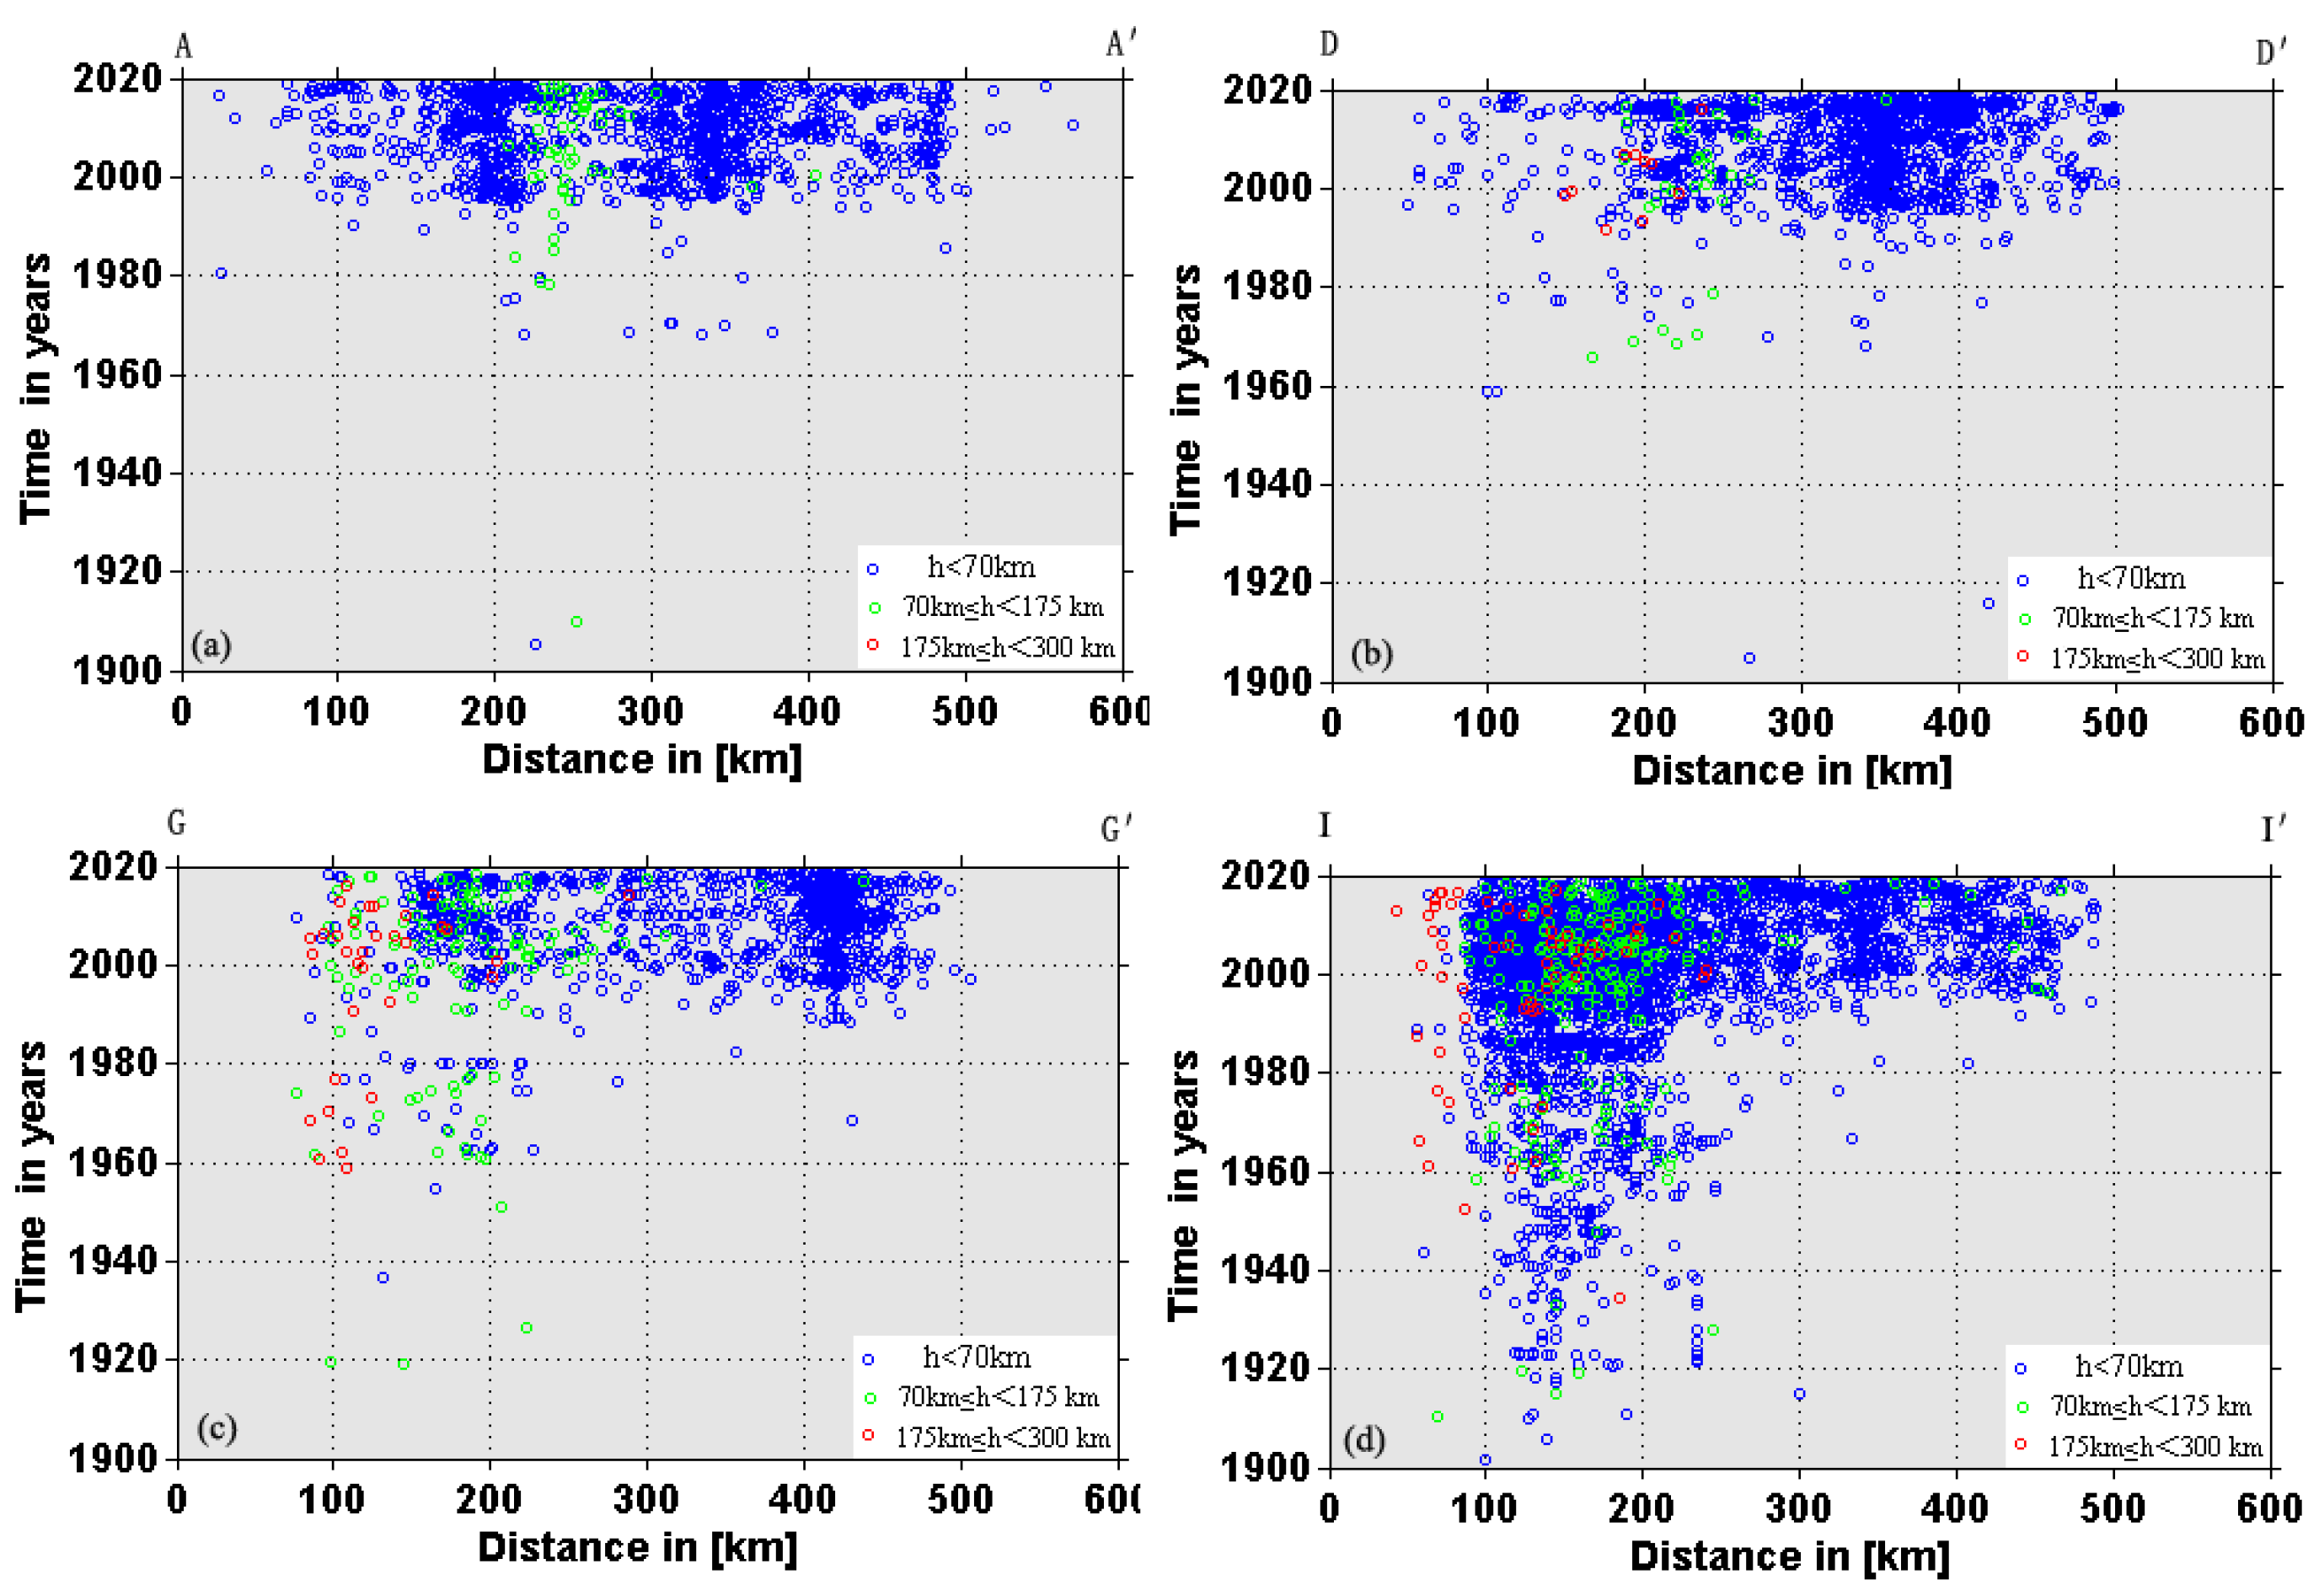
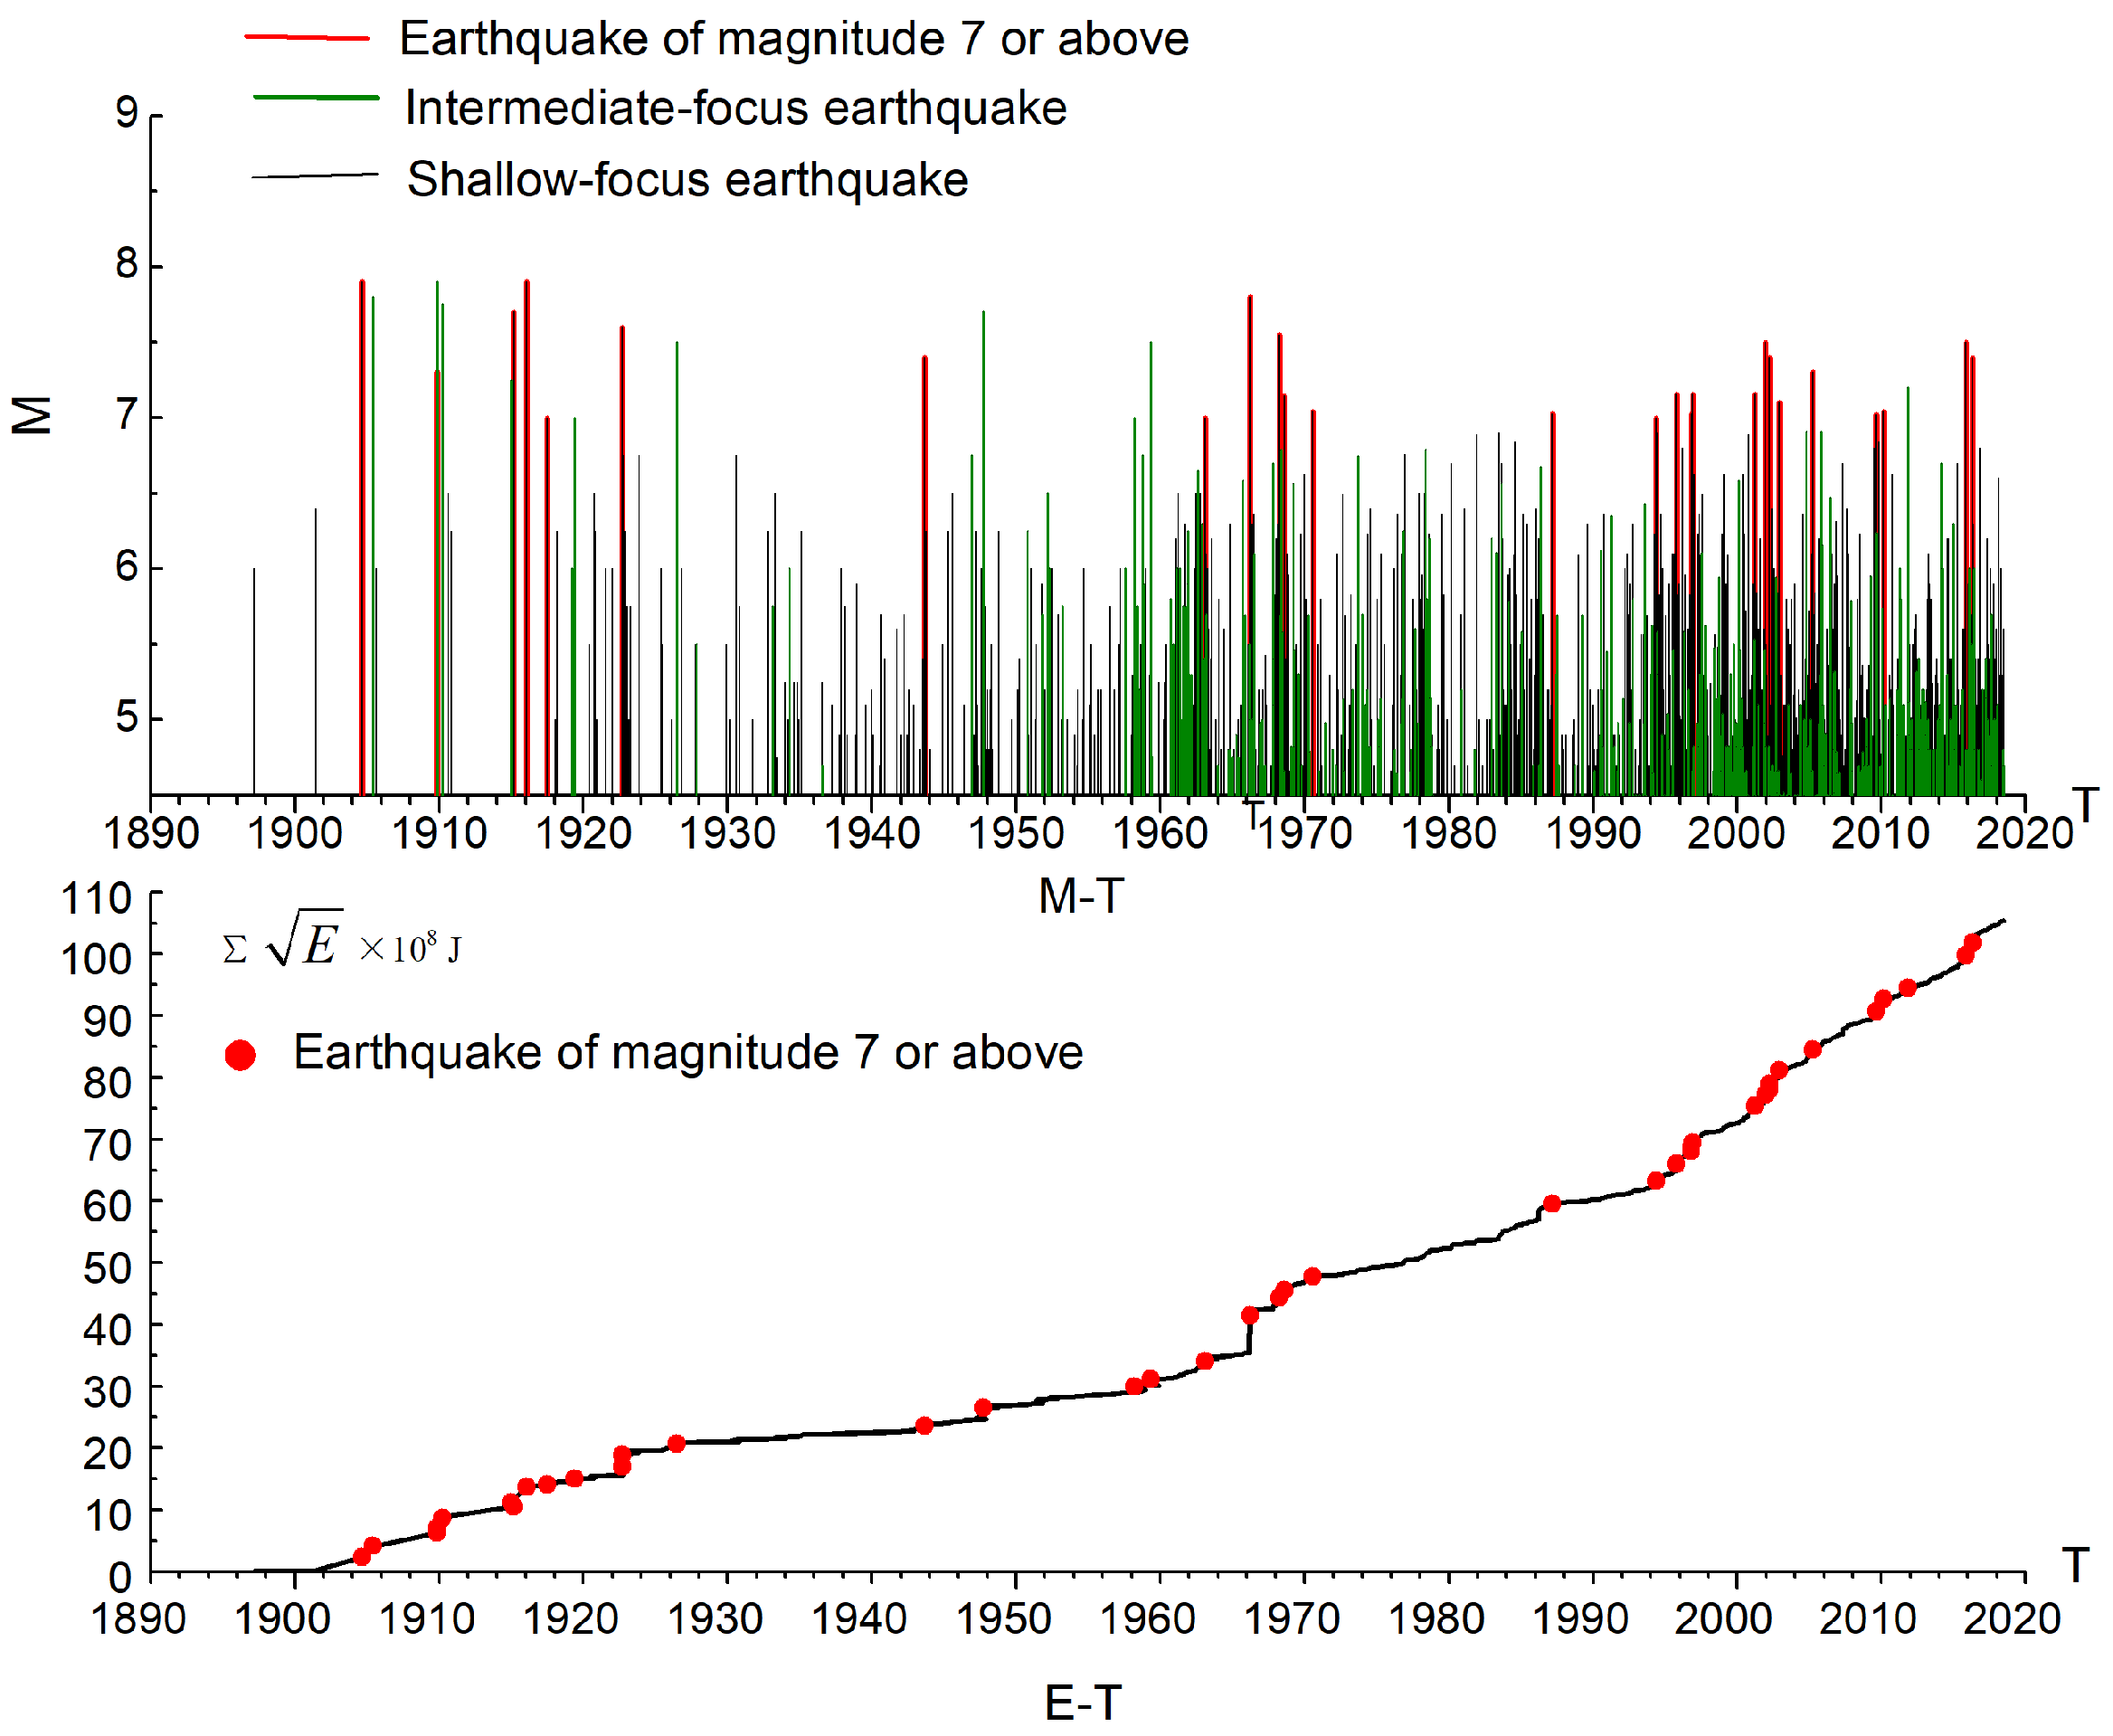
3.3. Temporal Distribution
4. Characteristics of the Tectonic Stress Field
4.1. Characteristics of the Focal Mechanism Solutions
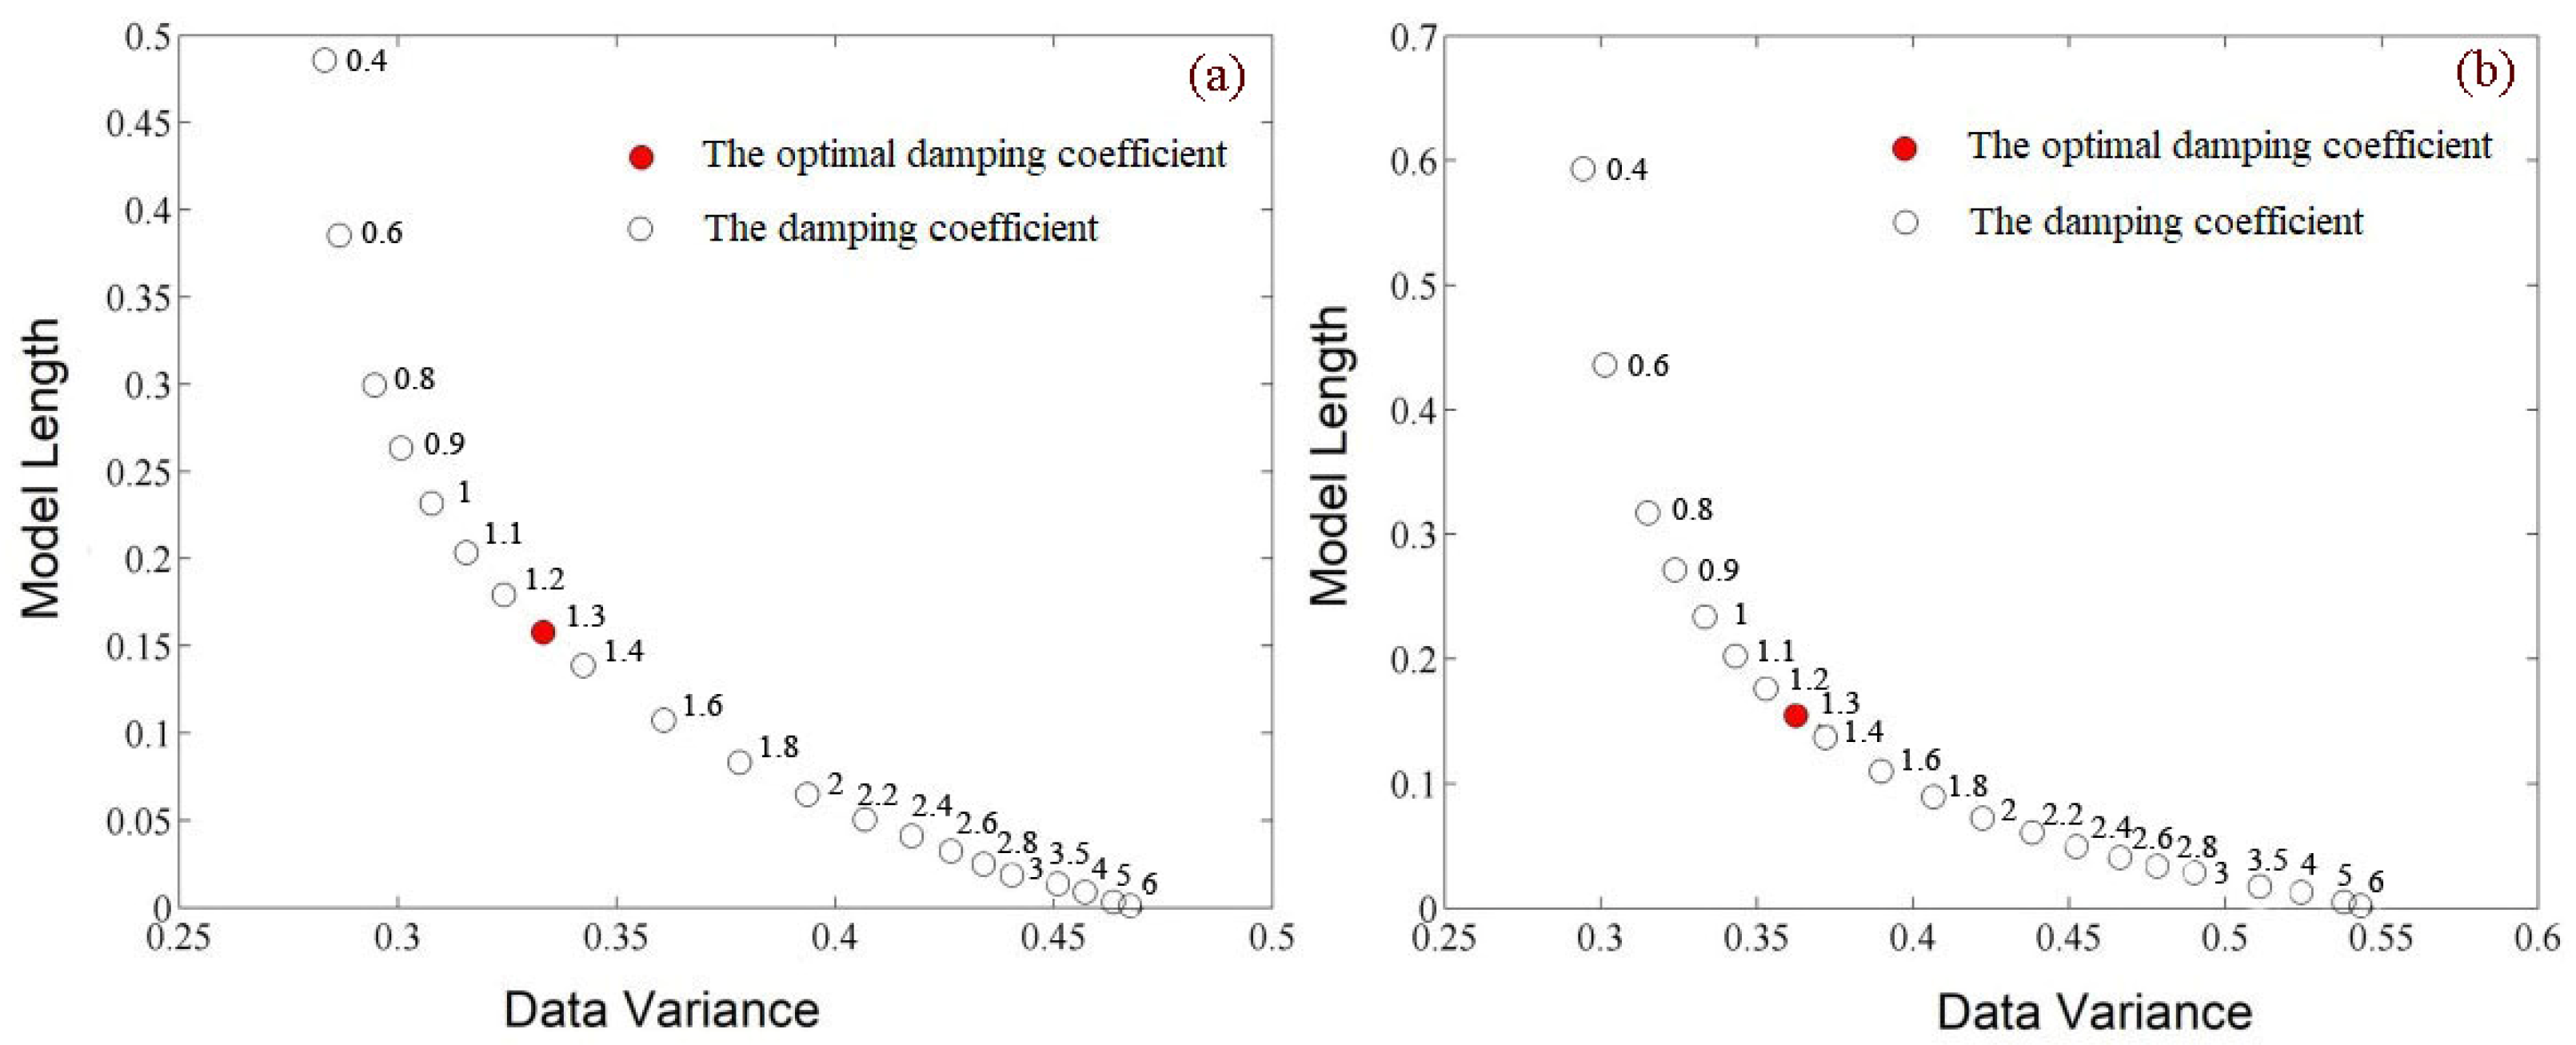
4.2. Selection of an Optimal Damping Coefficient
4.3. Analysis of the Tectonic Stress Field
5. Conclusions
- (1)
- The subduction depth of the Ryukyu Islands subduction zone in the mantle gradually increases from north to south, and the subduction dip angle changes from steep to gentle from north to south. In the northern part of the Tokara Strait, the Benioff zone reaches a maximum depth of 250 km in the mantle, and the Benioff zone bends within a range of 70 km, exhibiting a sagging shape with high subduction dip angles of 70–73°. In the southern part of the Tokara Strait, the maximum depth of the Benioff zone in the mantle is 300 km. The subduction dip angle is gentler near the Tokara Strait than in the north, and the dip angle is about 50–55°. The shape and dip angle of the Benioff zone in the southern part of the Ryukyu Islands subduction zone are gentler, with a dip angle of about 45–50°.
- (2)
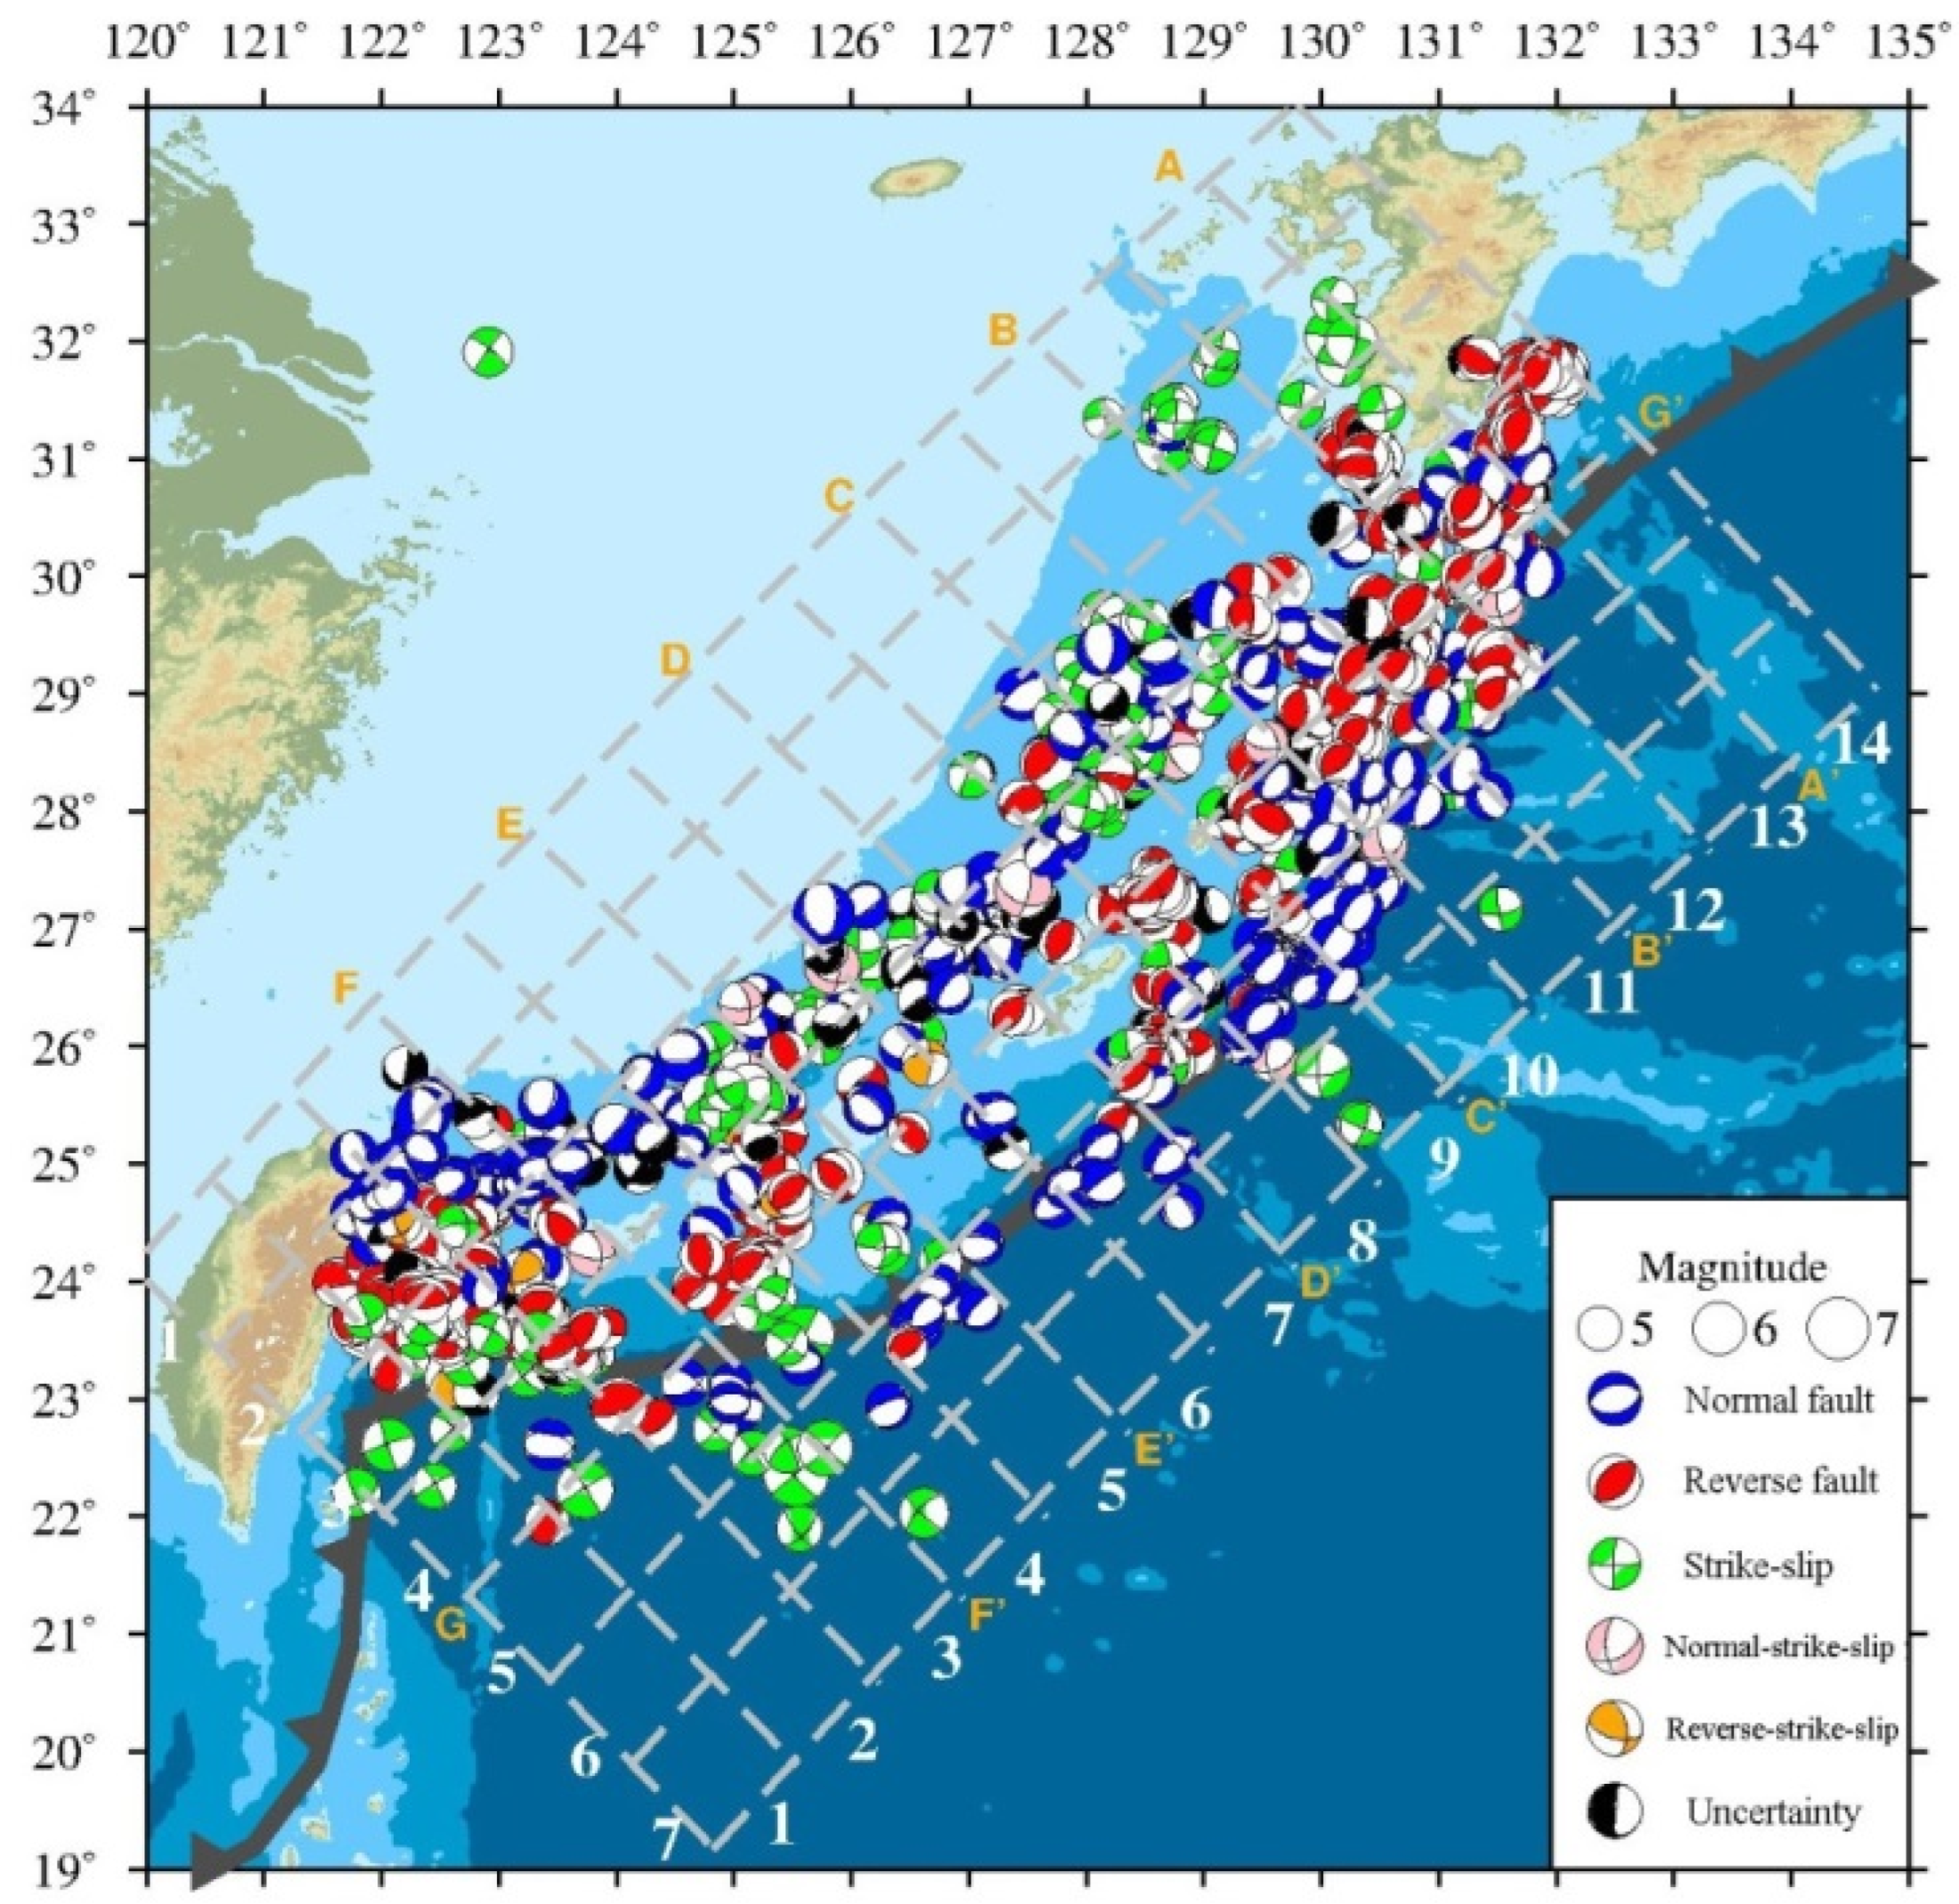
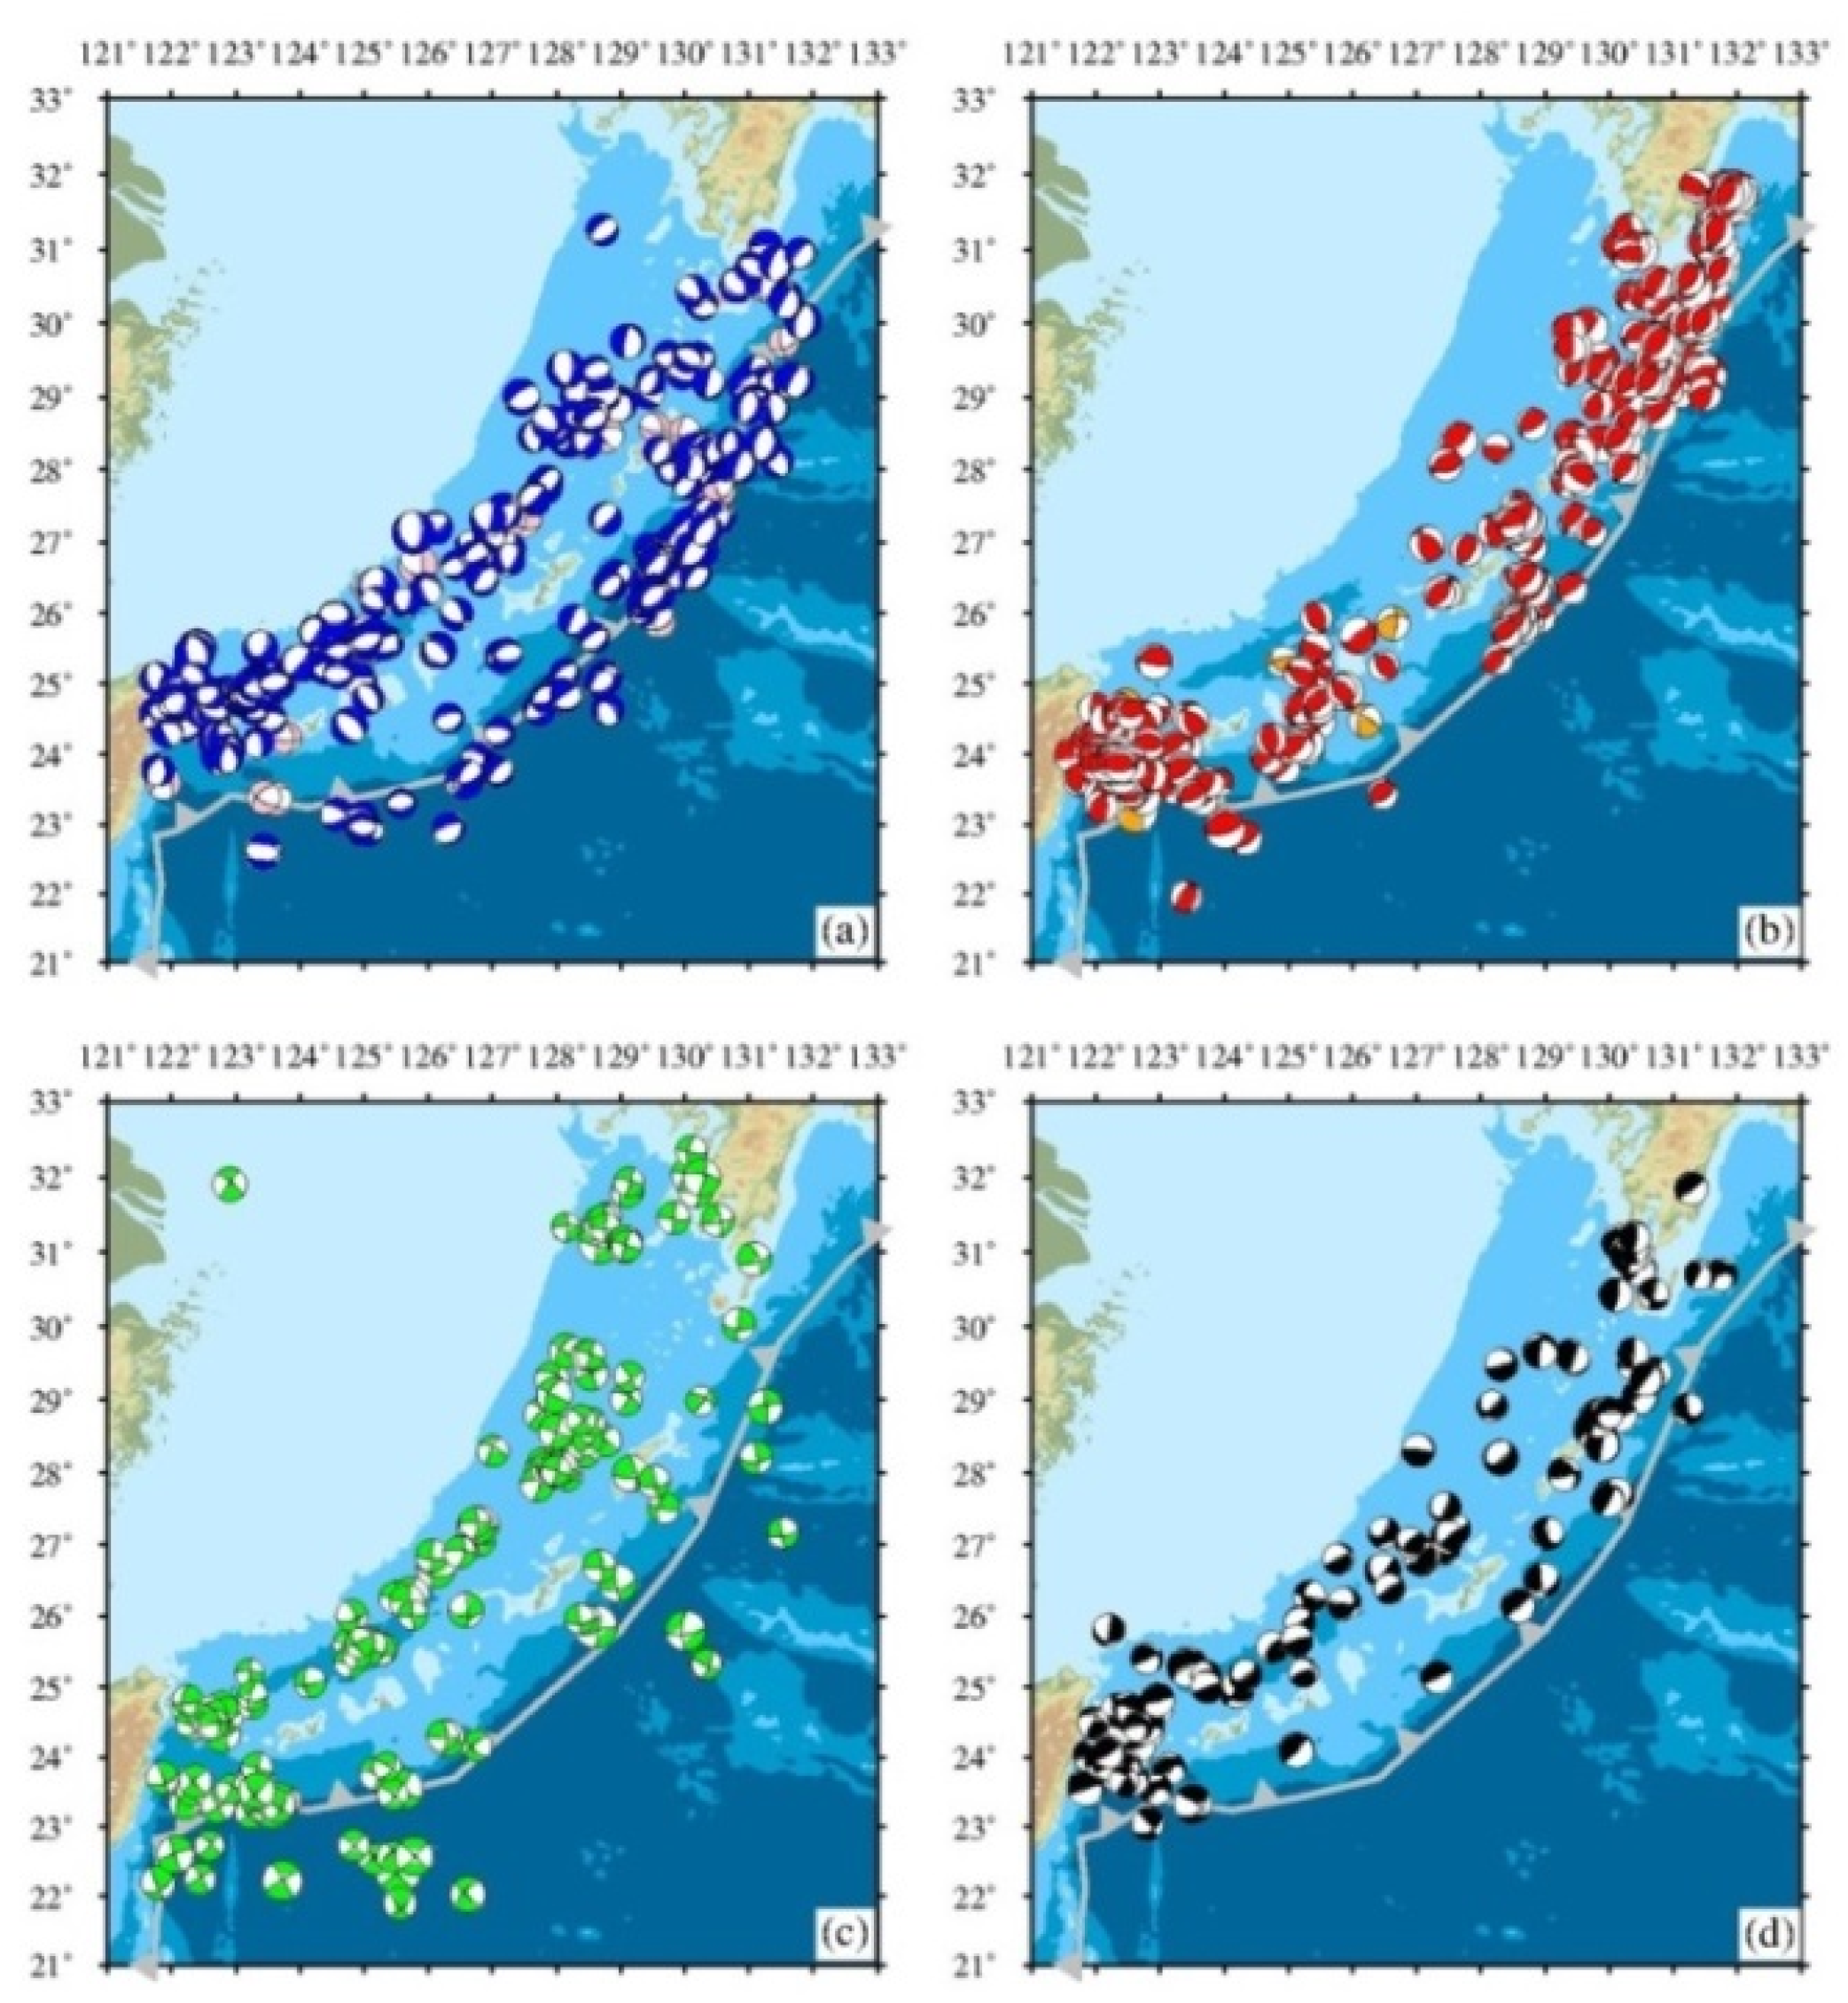
- The thrust earthquakes are mainly distributed along the Ryukyu Island Arc. This may be due to the shearing between the subducting plate and the overlying plate, so the earthquakes here are reverse fault type. The normal fault type earthquakes are located in the periphery of the reverse fault type earthquake concentration area, and they spread along the Ryukyu Trench and Okinawa Trough. The subducting plate may bend when it is about to subduct, which leads to stretching of this part of the plate and thus produces the normal fault earthquakes in the trench where the strike of the fault plane is the same as that of the trench. Most of the strike-slip type earthquakes are located in the Okinawa Trough, and a few are scattered in the southeastern part of the Ryukyu Trench, with focal depth of less than 30 km, indicating that there are many oblique faults in the shallow part of the Okinawa Trough.
- (3)
- The tectonic stress field of the Ryukyu Islands subduction zone is extensional along the subduction direction in the northern part of the Tokara Strait and is compressional along the subduction direction in the southern part of the Tokara Strait. This difference is related to the plate convergence speed and the differences in the physical properties, such as the viscosity and density of the surrounding mantle. The subducting plates in the north have a low convergence speed. Due to the active volcanism, there are high-temperature and low-viscosity substances in the upper mantle, and the resistance of the plate is small. The plate has negative buoyancy and sinks at a high dip angle in a tensional state. Conversely, the plates in the central and southern regions have a high convergence speed, the viscosity of the surrounding mantle is high, and the difference between the densities of the mantle and plate is small. The plates are subjected to greater resistance and are therefore subjected to compressive stress.
- (4)
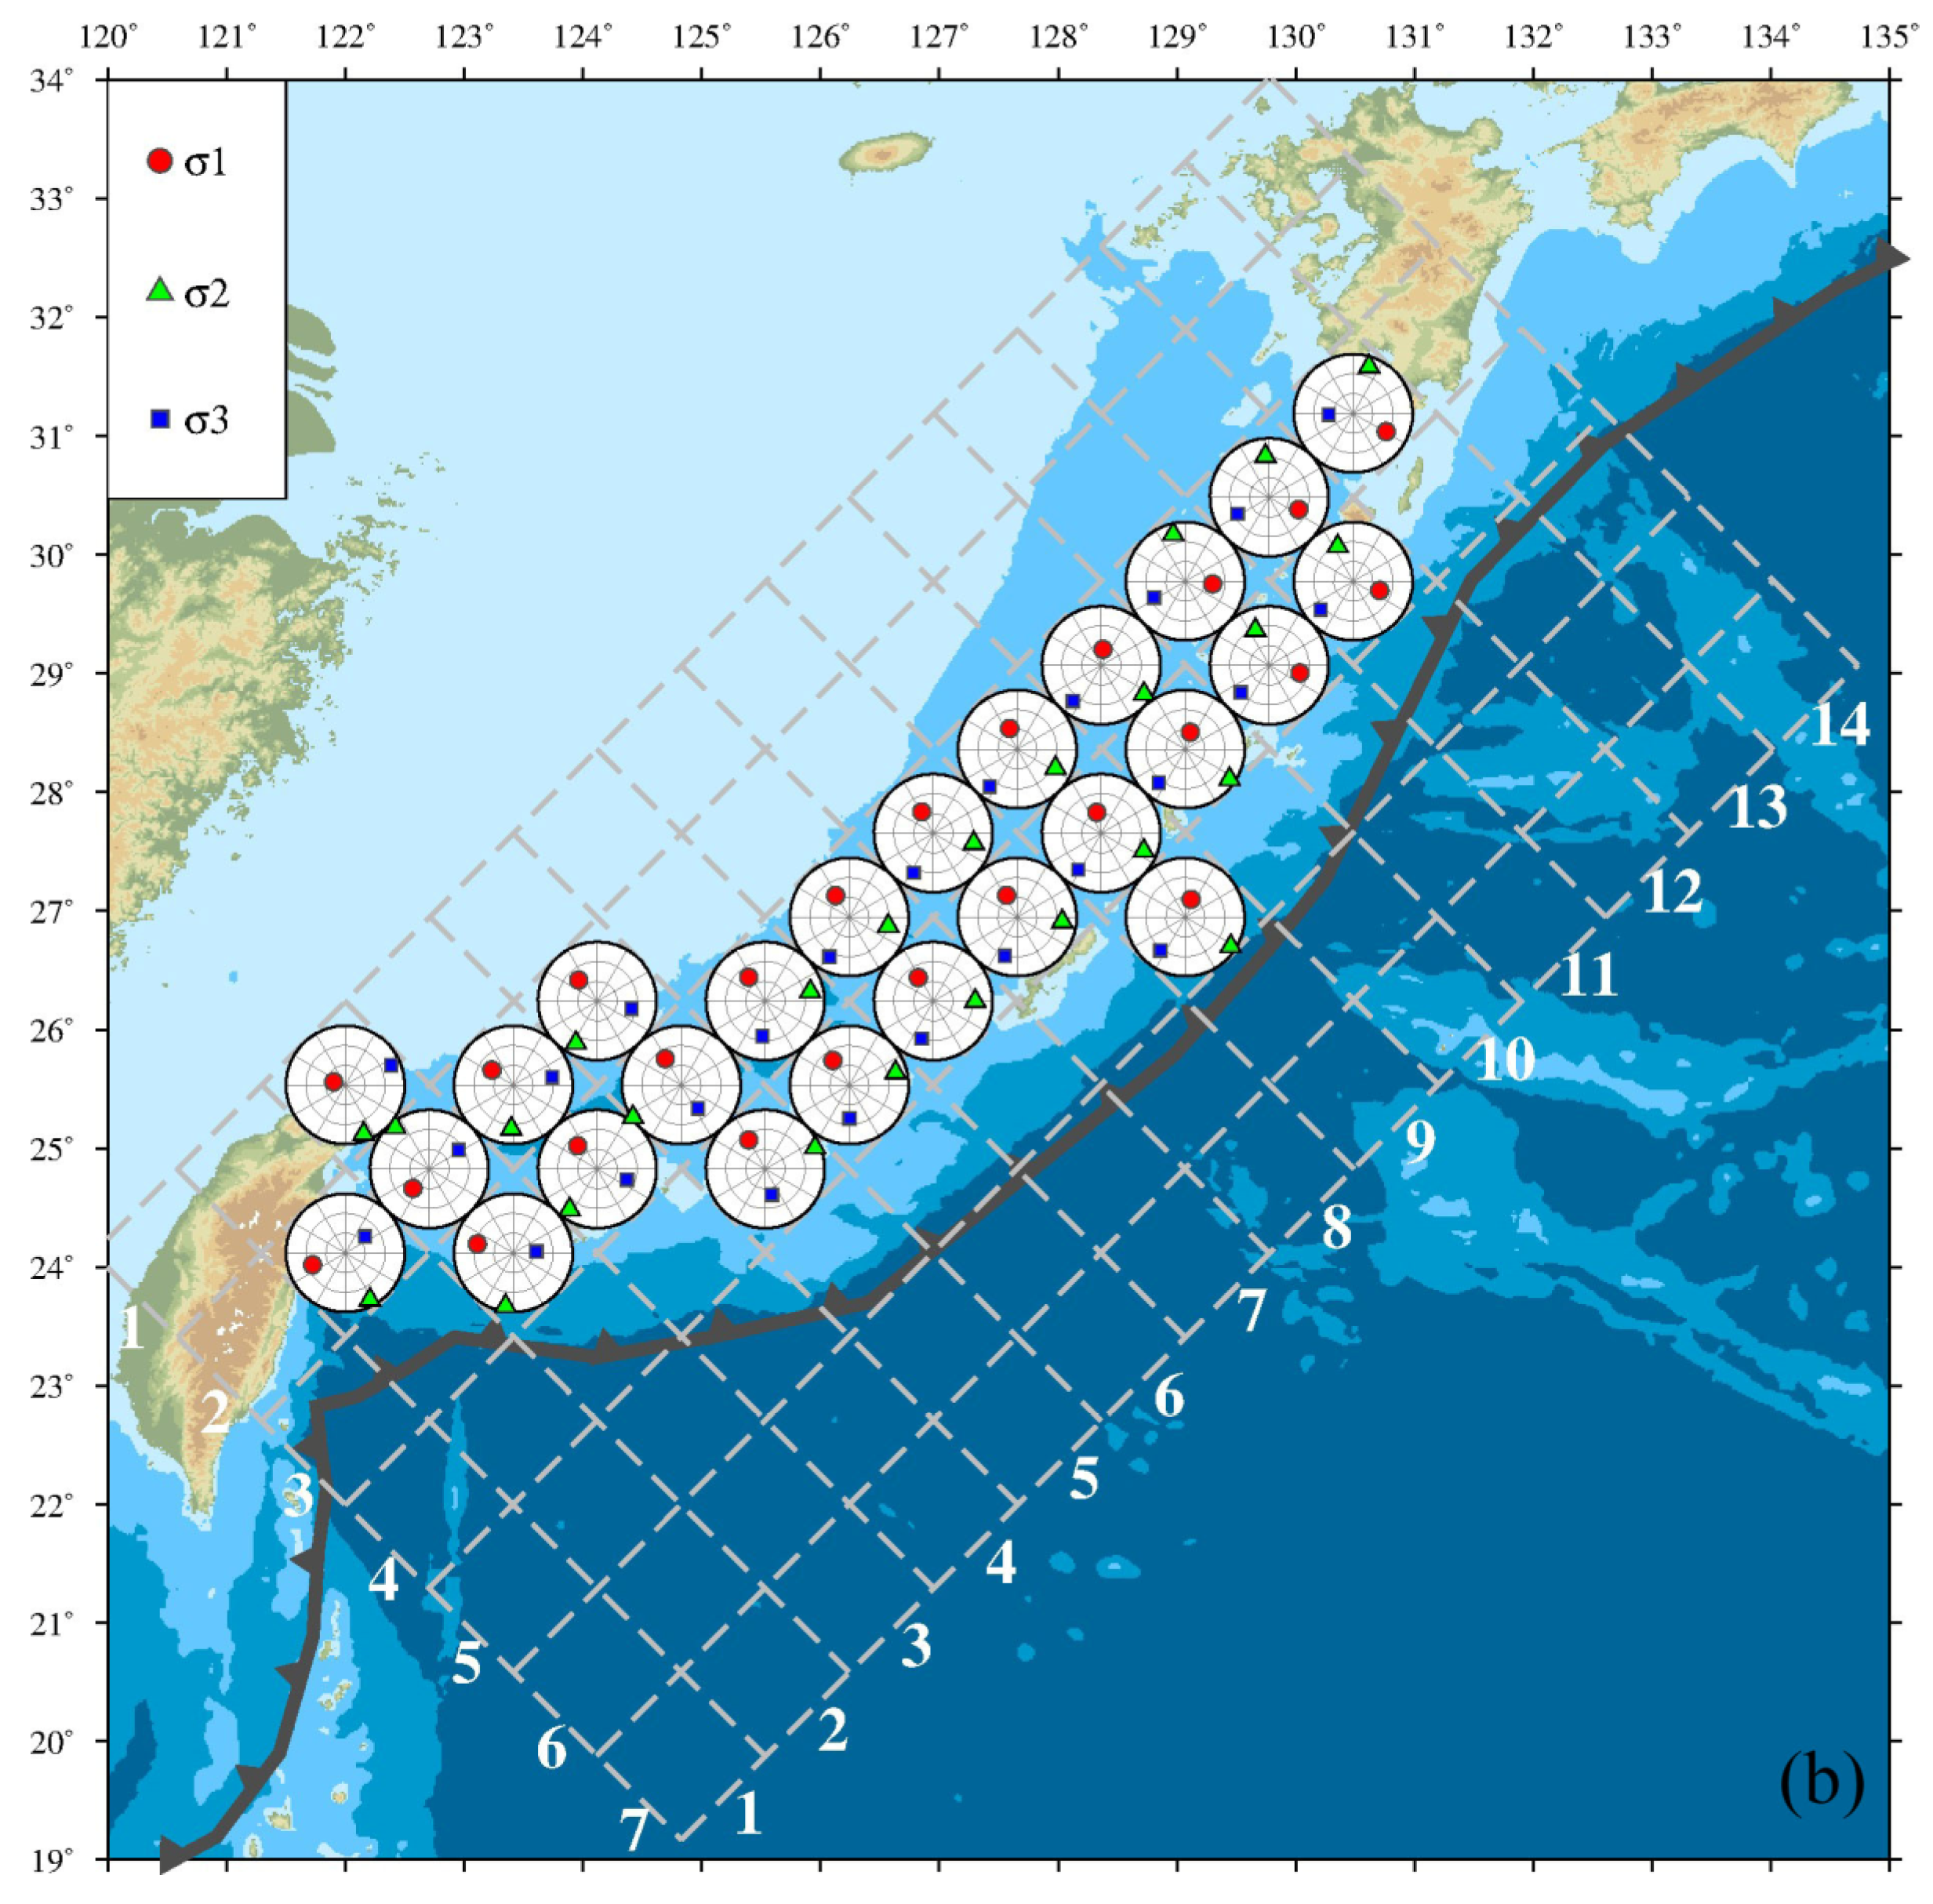
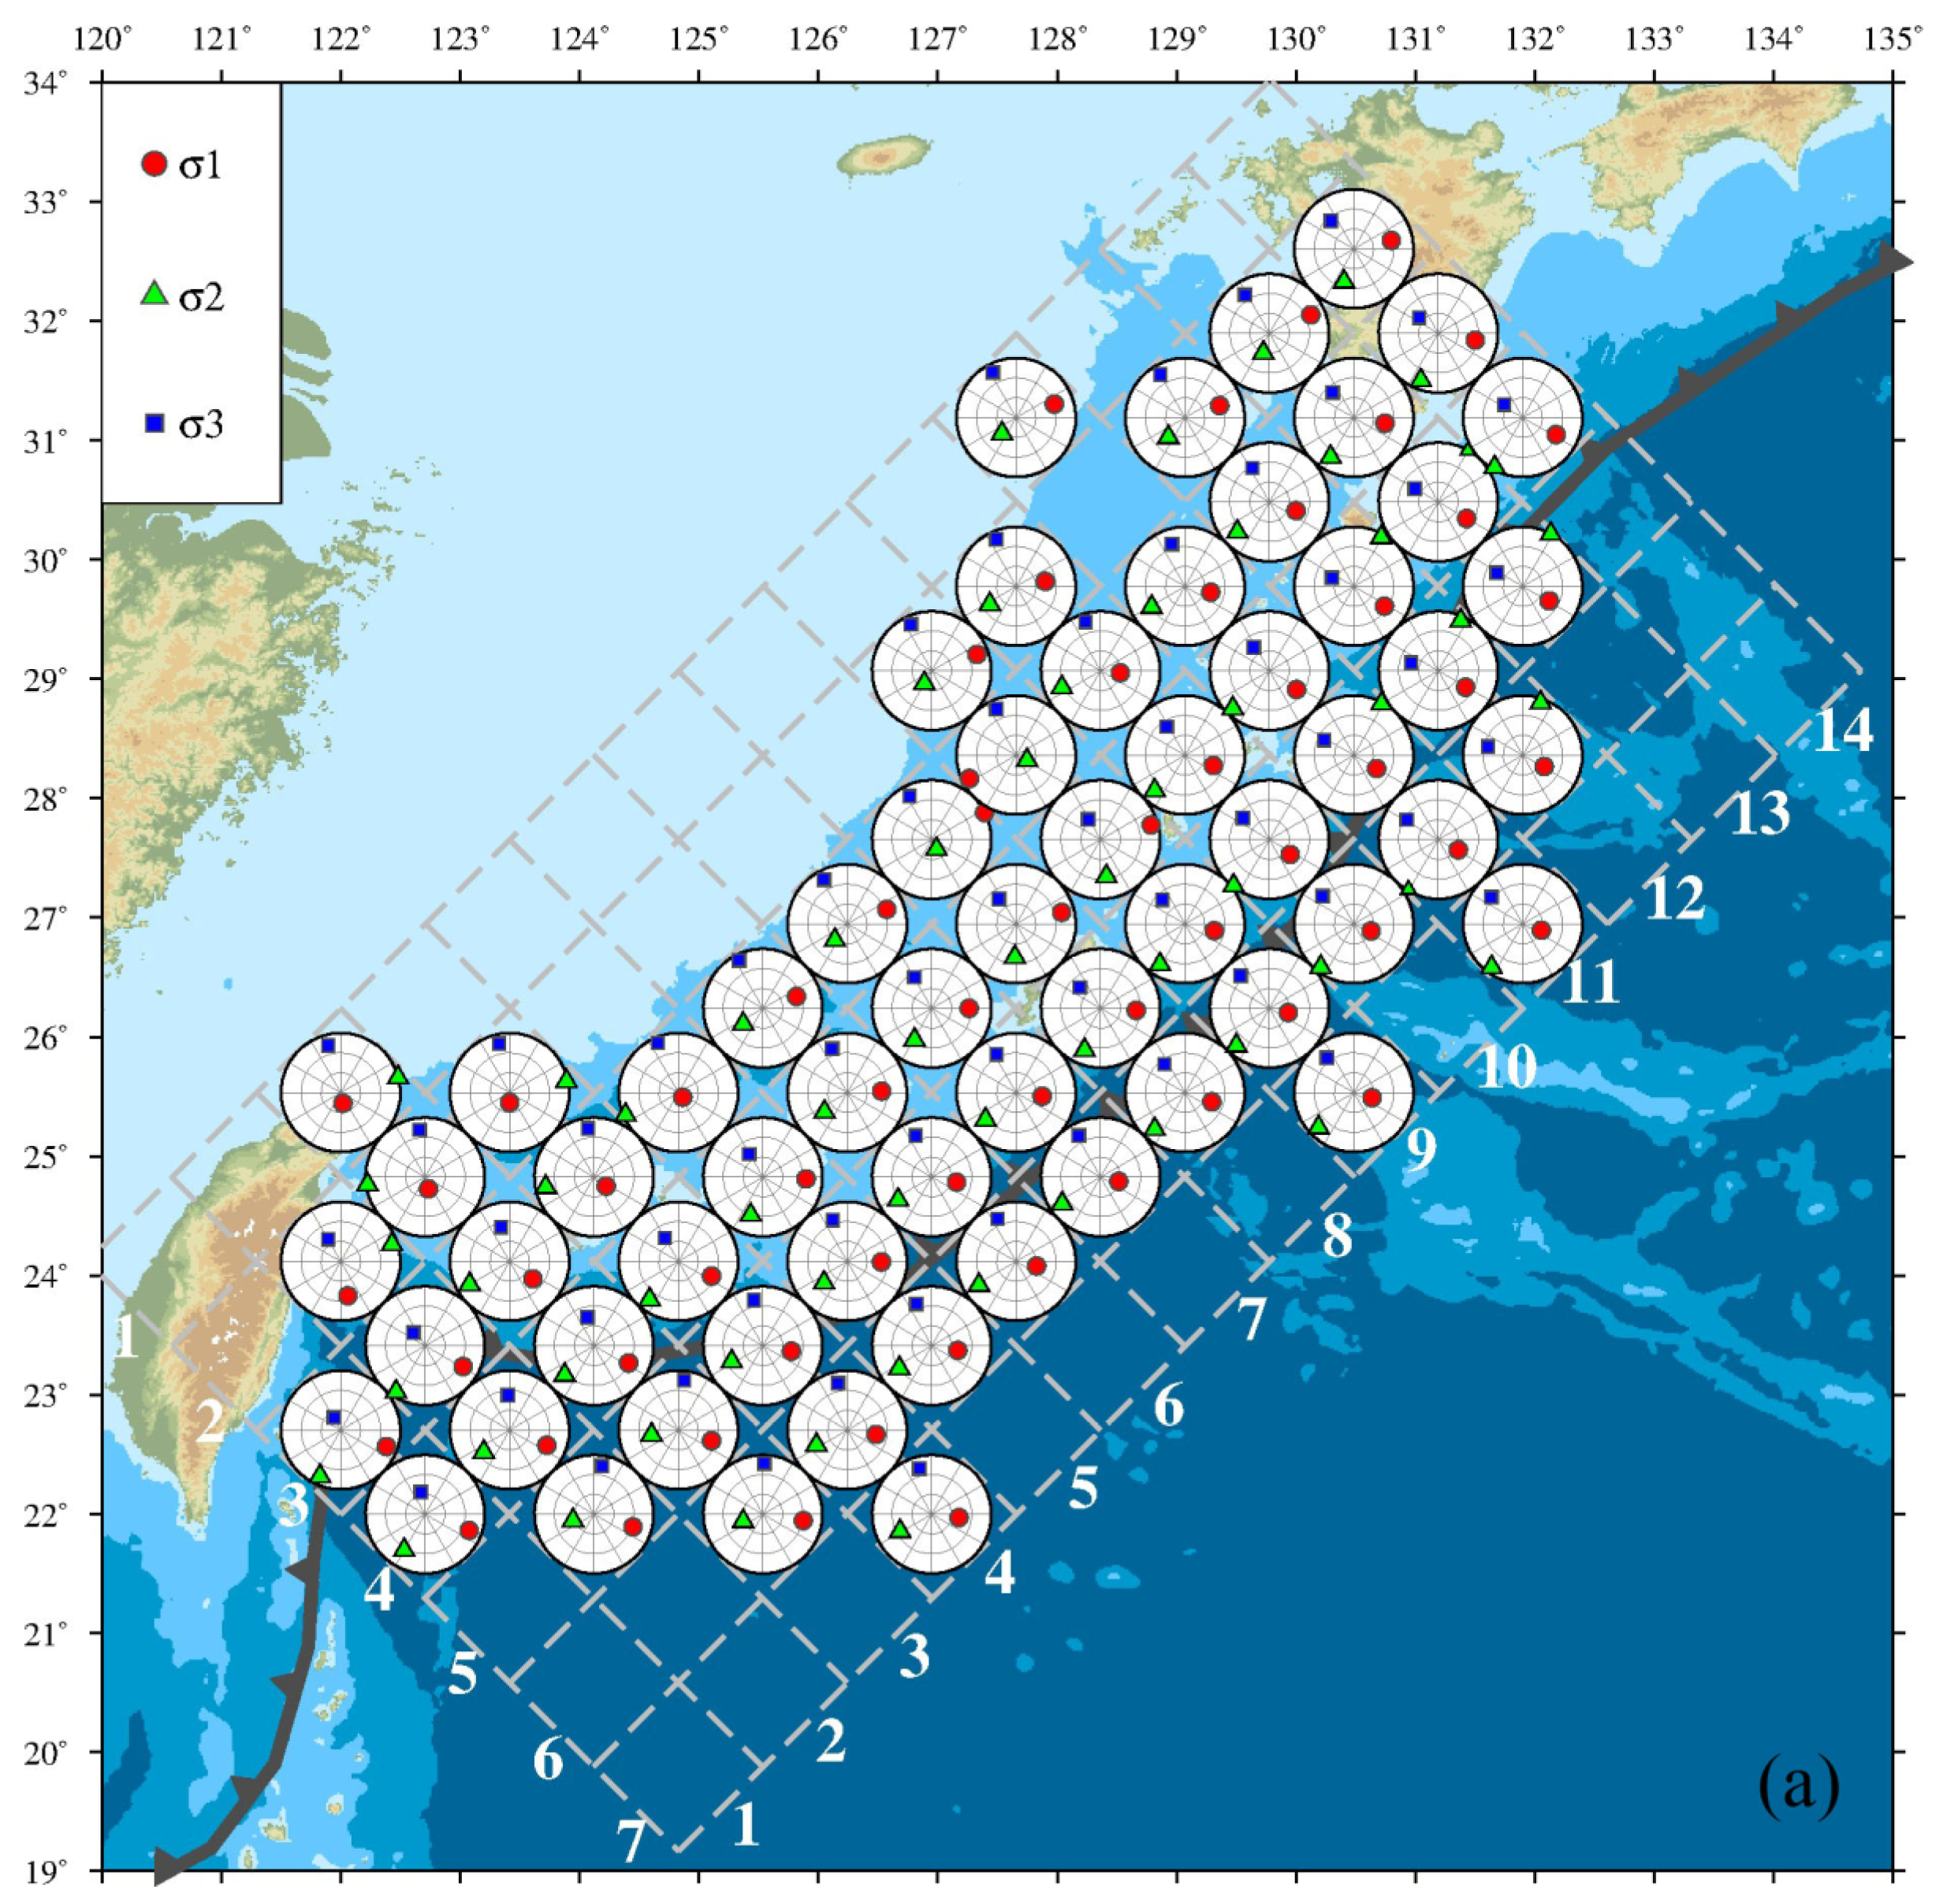
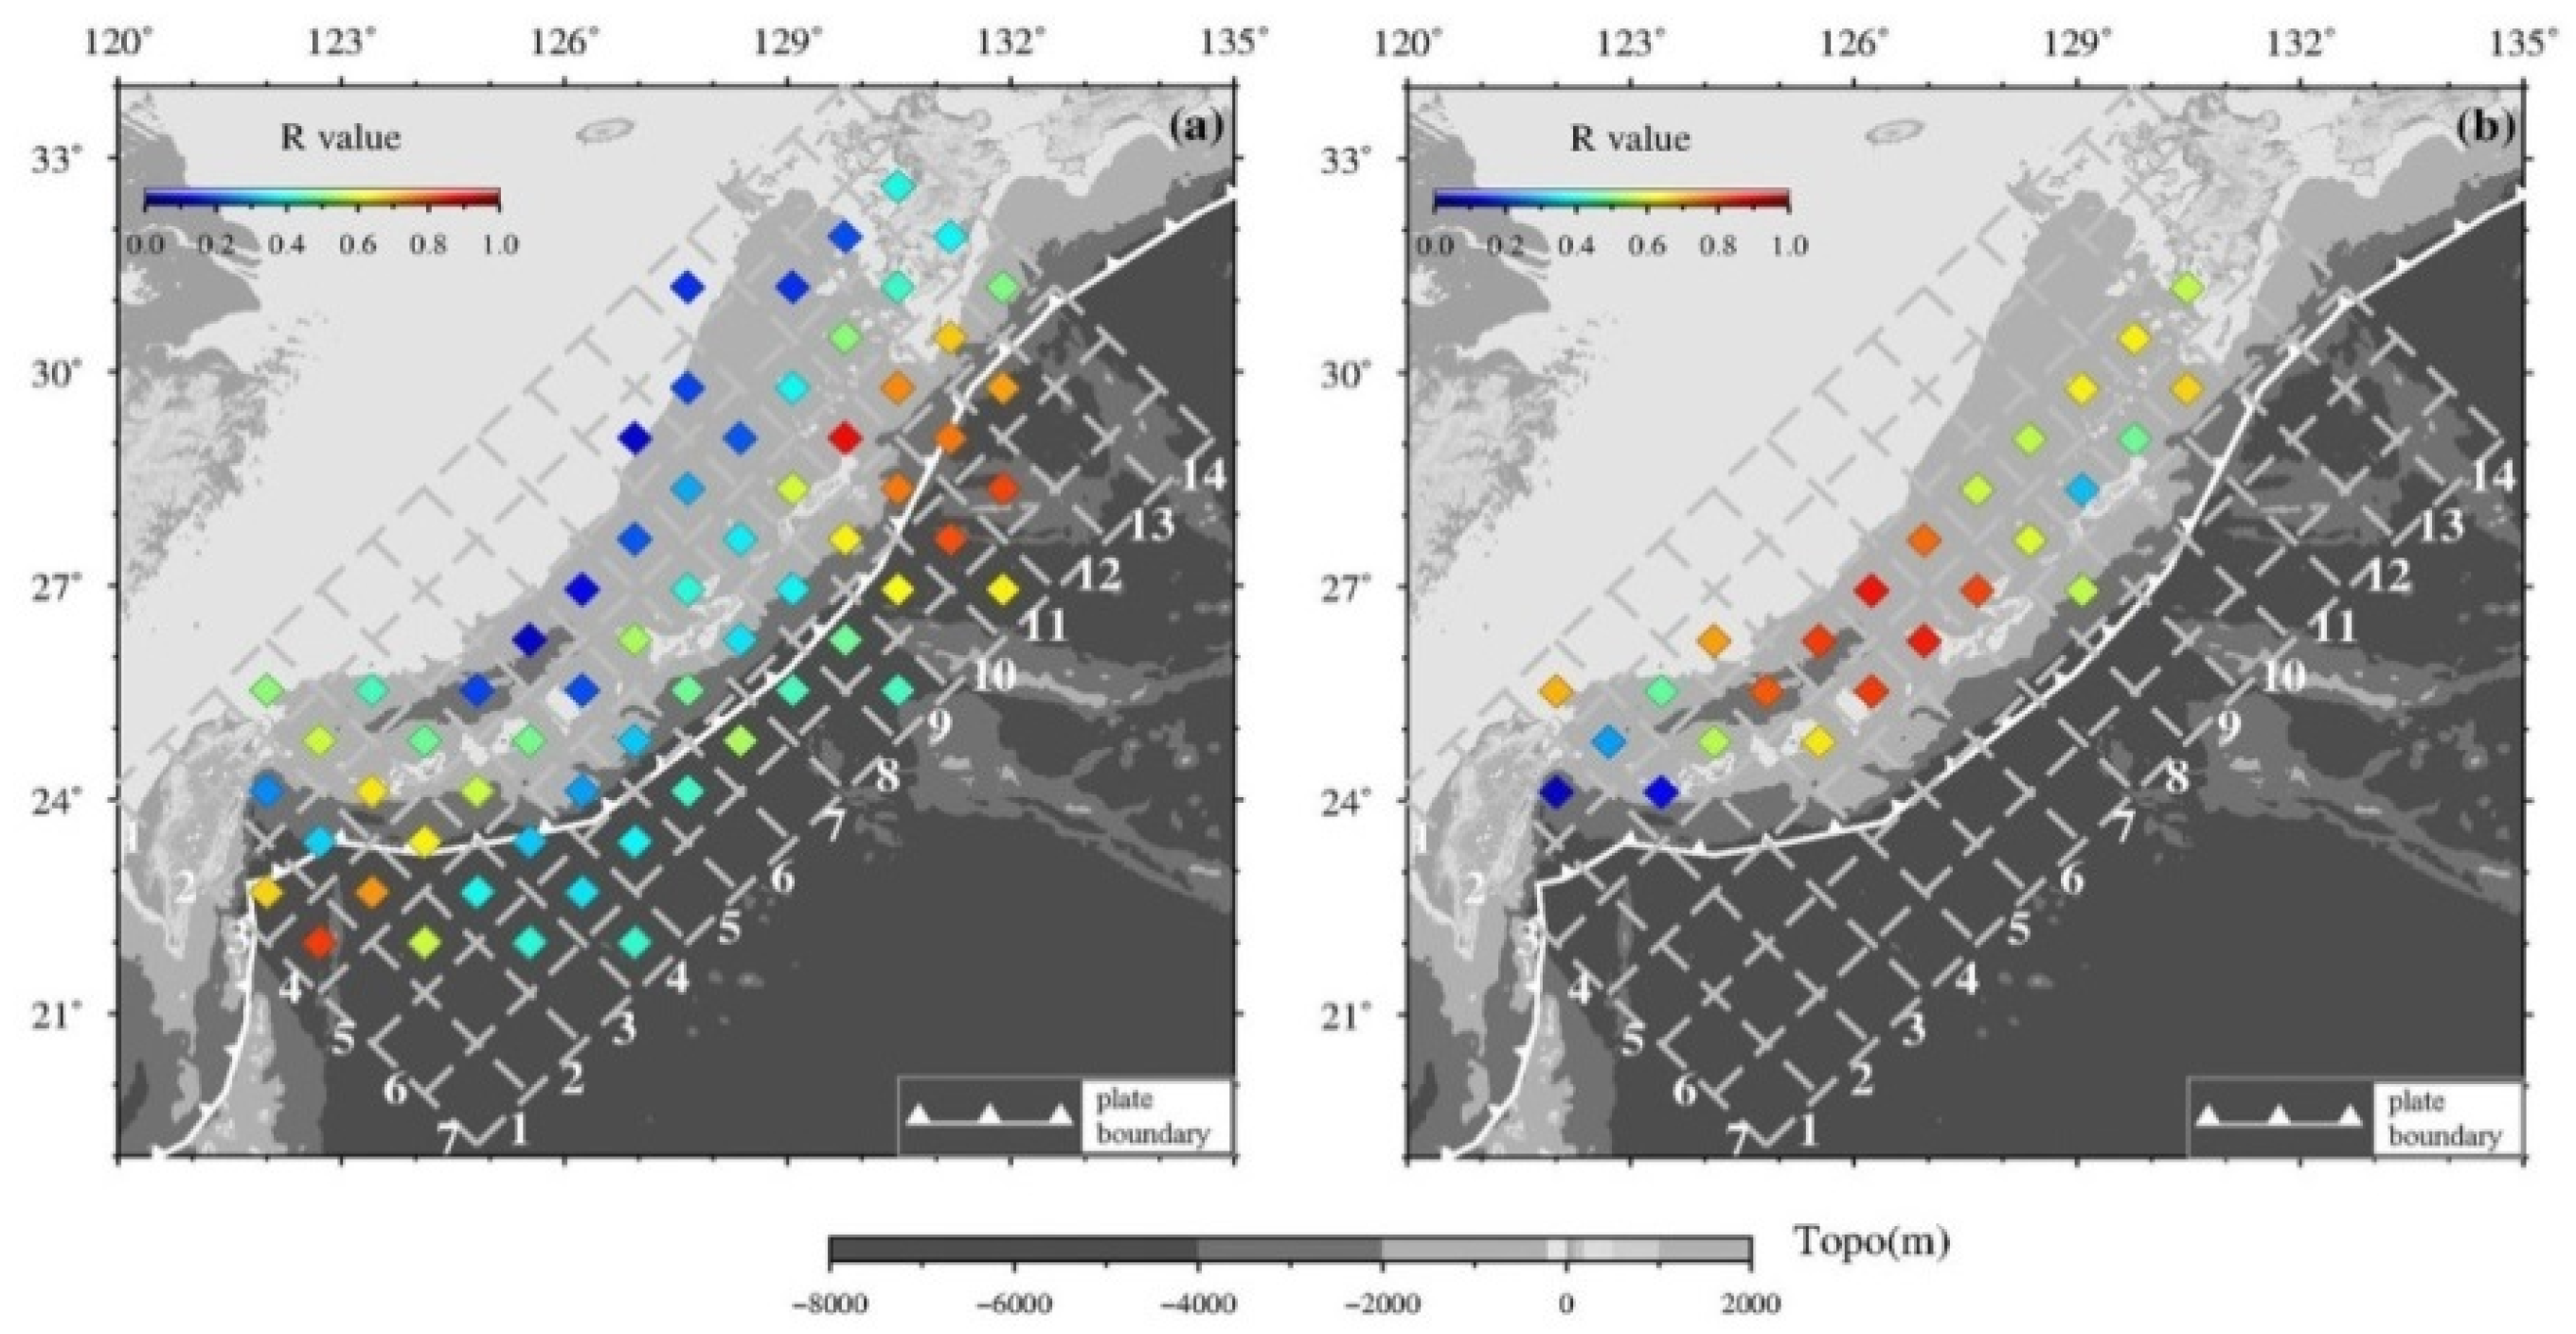
- In the Okinawa Trough on the inner side of the Ryukyu Island Arc and the deep ocean trench on the outer side of the arc, the extensional axis of the focal mechanism solutions of the shallow earthquakes is mainly perpendicular to the extension direction of the trough and the trench. In the Ryukyu Island Arc, the compressive axis is mainly perpendicular to the extension direction of the island arc. Consequently, the ocean trough is carrying out NW expansion into a back-arc basin in the same direction as the subduction of the Philippine Sea Plate under the Eurasian Plate. The Ryukyu arc is still under strong NW–SE compressive stress. The R value of the shallow stress field of the Okinawa Trough is low, and the σ3 is stable in the NNW direction with a small dip angle (>30°). The stress field in the shallow part of the Okinawa Trough transitions from strike-slip type to normal fault type from north to south, reflecting the difference in the degree of development of the trough, and the southern segment of the trough is beginning the transition to an expansion stage.
Author Contributions
Funding
Institutional Review Board Statement
Informed Consent Statement
Data Availability Statement
Conflicts of Interest
References
- Zhang, J.; Li, H.; Chen, Q.; Zhang, H.; Zhou, B. Review on the Research of Subduction Zone. Geol. Surv. Res. 2015, 38, 18–34. (In Chinese) [Google Scholar]
- Muldashev, I.A.; Sobolev, S.V. What controls maximum magnitudes of giant subduction earthquakes? Geochem. Geophys. Geosystems 2020, 21, e2020GC009145. [Google Scholar] [CrossRef]
- Xu, J.-G.; Wu, G.; Feng, D.-C.; Fan, J.-J. Probabilistic multi-hazard fragility analysis of RC bridges under earthquake-tsunami sequential events. Eng. Struct. 2021, 238, 112250. [Google Scholar] [CrossRef]
- Xu, J.; Feng, D.; Mangalathu, S.; Jeon, J. Data-driven rapid damage evaluation for life-cycle seismic assessment of regional reinforced concrete bridges. Earthq. Engng. Struct. Dyn. 2022, 51, 2730–2751. [Google Scholar] [CrossRef]
- Lan, J.-Y.; Liu, J.; Wang, T.; Diwakar, K.; Naqvi, M.W.; Hu, L.-B.; Liu, X.-Q. A centrifuge study on the effect of the water cover on the ground motion of saturated marine sediments. Soil. Dyn. Earthq. Eng. 2022, 152, 107044. [Google Scholar] [CrossRef]
- Lan, J.; Liu, J.; Song, X. Study on the influence of the seafloor soft soil layer on seismic ground motion. Nat. Hazards Earth Syst. Sci. 2021, 21, 577–585. [Google Scholar] [CrossRef]
- Lan, J.; Diwakar, K.; Hu, L.; Gao, Y. An Experimental Study of Dynamic Shear Modulus and Damping Ratio of the Calcareous Sand in the South China Sea. J. Coast. Res. 2021, 37, 964–972. [Google Scholar] [CrossRef]
- Yan, R.; Yan, M.; Yu, H.; Yang, D. Influences of temperature and pore pressure on the geomechanical behaviors of methane hydrate-bearing sand. Int. J. Geomech. 2022, 22, 04022201. [Google Scholar] [CrossRef]
- Yan, R.; Lu, D.; Song, Y.; Yu, H.; Zhang, Q.; Zhou, J. Modeling the Mechanical Behavior of Methane Hydrate-Bearing Soil Considering the Influences of Temperature and Pore Pressure. Energy Fuels 2022, 36, 12510–12523. [Google Scholar] [CrossRef]
- Mamoru, K.; Lynn, R.S. Seismicity and Tectonics of the Western Pacific: Izu-Mariana-Caroline and Ryukyu-Taiwan Regions. J. Geophys. Res. 1969, 74, 5923–5948. [Google Scholar]
- Fitch, T.J. Plate convergence, transcurrent faults and internal deformation adjacent to Southeast Aisa and the western Pacific. J. Geophys. Res. 1972, 77, 4432–4460. [Google Scholar] [CrossRef]
- Shiono, K.; Mikumo, T.; Ishikawa, Y. Tectonics of the Kyushu-Ryukyu arc as evidenced from seismicity and focal mechanism of shallow to intermediate-depth earthquakes. J. Phys. Earth 1980, 28, 17–43. [Google Scholar] [CrossRef]
- Zang, S.; Ning, J.; Xu, L. The distribution of earthquakes, Behavior of the subduction zone and stress state in the Ryukyu island arc. Acta Seismol. Sin. 1989, 11, 113–123. (In Chinese) [Google Scholar]
- Xie, Z.; Li, S.; Lv, Y.; Xu, W.; Zhang, Y.; Liu, W. Unified earthquake catalog for China’s seas and adjacent regions and its completeness analysis. Seismol. Geol. 2020, 42, 993. (In Chinese) [Google Scholar]
- Seno, T.; Sakurai, T.; Stein, S. Can the Okhotsk Plate be discriminated from the North American plate? J. Geophys. Res. 1996, 101, 11305. [Google Scholar] [CrossRef]
- Nagamune, T. Intermediate-Depth Earthquakes and Tectonics of the Kyushu-Ryukyu Region. Zisin 1987, 40, 417–423. [Google Scholar] [CrossRef] [Green Version]
- Nagamune, T.; Tashiro, H. Shape of the Wadati-Benioff zone beneath Kyushu, Japan. J. Seismol. Soc. Jpn. 1989, 42, 13–19. [Google Scholar]
- Yakiwara, H.; Shimizu, H.; Miyamachi, H. Three dimensional seismic velocity structure of crust and upper mantle beneath the Kyushu island. Programme Abstr. Volcanol. Soc. Jpn. 1996, 1996, 143. [Google Scholar]
- Hardebeck, J.L.; Michael, A.J. Damped regional-scale stress inversions: Methodology and examples for southern California and the Coalinga aftershock sequence. J. Geophys. Res. Solid Earth 2006, 111, 310. [Google Scholar] [CrossRef]
- Martínez-Garzón, P.; Kwiatek, G.; Ickrath, M.; Bohnhoff, M. MSATSI: A MATLAB Package for Stress Inversion Combining Solid Classic Methodology, a New Simplified User-Handling, and a Visualization Tool. Seismol. Res. Lett. 2014, 85, 896–904. [Google Scholar] [CrossRef] [Green Version]
- Peterson, E.T.; Seno, T. Factors affecting seismic moment release rates in subduction zones. J. Geophys. Res. Solid Earth 1984, 89, 10233–10248. [Google Scholar] [CrossRef]
- Eguchi, T.; Uyeda, S. Seismotectonics of the Okinawa Trough and Ryukyu Arc. Mem. Geol. Soc. China 1983, 5, 189–210. [Google Scholar]
- Kimura, M. Back-arc rifting in the Okinawa Trough. Mar. Pet. Geol. 1985, 2, 222–240. [Google Scholar] [CrossRef]


| Range | σ1 Axis | σ2 Axis | σ3 Axis | R | ||||
|---|---|---|---|---|---|---|---|---|
| Column | Row | Strike (°) | Dip (°) | Strike (°) | Dip (°) | Strike (°) | Dip (°) | |
| 1 | 3 | 168.44 | 73.45 | 75.53 | 0.86 | −14.72 | 16.53 | 0.51 |
| 1 | 11 | 70.18 | 29.12 | −138.24 | 57.65 | −27.12 | 12.85 | 0.17 |
| 2 | 2 | 168.38 | 36.98 | 71.72 | 8.76 | −29.5 | 51.64 | 0.26 |
| 2 | 3 | 165.12 | 71.42 | −97.55 | 2.46 | −6.73 | 18.4 | 0.57 |
| 2 | 4 | 179.62 | 75.17 | 78.81 | 2.84 | −11.93 | 14.55 | 0.44 |
| 2 | 9 | 70.1 | 17.41 | −149.92 | 67.74 | −24.2 | 13.44 | 0.09 |
| 2 | 10 | 80.14 | 45.5 | −124.47 | 41.78 | −22.97 | 12.57 | 0.19 |
| 2 | 12 | 70.84 | 34.96 | −139.45 | 51.01 | −30.02 | 15.07 | 0.17 |
| 2 | 13 | 66.16 | 21.69 | −162.75 | 58.81 | −32.74 | 21.26 | 0.2 |
| 2 | 14 | 77.1 | 32.07 | −163.24 | 38.31 | −39.23 | 35.3 | 0.4 |
| 3 | 1 | 109.98 | 16.72 | −155.9 | 13.43 | −29.02 | 68.3 | 0.67 |
| 3 | 2 | 118.76 | 25.04 | −147.54 | 7.87 | −41.39 | 63.59 | 0.33 |
| 3 | 3 | 127.09 | 46.25 | −119.98 | 20.45 | −13.88 | 36.64 | 0.65 |
| 3 | 4 | 126.9 | 67.13 | −101.89 | 15.53 | −7.21 | 16.37 | 0.48 |
| 3 | 5 | 136.76 | 80.64 | −113.11 | 3.25 | −22.61 | 8.77 | 0.19 |
| 3 | 6 | 70.44 | 36.45 | −128.6 | 52 | −26.51 | 9.3 | 0.08 |
| 3 | 7 | 69.71 | 26.79 | −143.22 | 58.97 | −27.78 | 14.49 | 0.12 |
| 3 | 8 | 62.87 | 0.41 | 154.27 | 73.67 | −27.25 | 16.32 | 0.21 |
| 3 | 9 | −116.32 | 11.09 | 116.77 | 71.93 | −23.5 | 14.09 | 0.29 |
| 3 | 10 | 96.13 | 60.13 | −113.37 | 26.56 | −16.92 | 12.67 | 0.21 |
| 3 | 11 | 102.96 | 50.11 | −121.84 | 30.67 | −17.35 | 22.87 | 0.38 |
| 3 | 12 | 108.27 | 47.9 | −133.01 | 23.48 | −26.86 | 32.64 | 0.51 |
| 3 | 13 | 100.02 | 42.31 | −149.46 | 21.06 | −40.42 | 40.27 | 0.43 |
| 3 | 14 | 100.77 | 33.65 | −159.65 | 14.03 | −50.44 | 52.79 | 0.37 |
| 4 | 1 | 110.12 | 19.3 | −149.65 | 26.88 | −11.07 | 55.94 | 0.82 |
| 4 | 2 | 112.42 | 29.63 | −130.31 | 38.85 | −2.95 | 36.99 | 0.73 |
| 4 | 3 | 116.48 | 31.82 | −135 | 27.11 | −13.21 | 45.82 | 0.64 |
| 4 | 4 | 113.98 | 35.57 | −142.8 | 17.74 | −31.24 | 48.96 | 0.57 |
| 4 | 5 | 92.48 | 25.02 | −162.28 | 29.39 | −30.8 | 49.62 | 0.49 |
| 4 | 6 | 87.66 | 38.17 | −130.55 | 44.98 | −19.08 | 20.12 | 0.2 |
| 4 | 7 | 90.11 | 33.61 | −151.35 | 35.71 | −29.29 | 36.45 | 0.54 |
| 4 | 8 | 75.6 | 19.4 | −177.58 | 39.4 | −34.46 | 44.24 | 0.41 |
| 4 | 9 | 73.94 | 10.88 | 171.27 | 33.59 | −31.54 | 54.22 | 0.36 |
| 4 | 10 | 110.3 | 44.4 | −139.34 | 19.56 | −32.54 | 39.14 | 0.58 |
| 4 | 11 | 124.91 | 40.5 | −135.81 | 10.68 | −33.93 | 47.52 | 0.87 |
| 4 | 12 | 122.79 | 35.22 | 28.94 | 5.44 | −68.66 | 54.24 | 0.74 |
| 4 | 13 | 120.49 | 40.78 | 30.13 | 0.41 | −60.34 | 49.21 | 0.68 |
| 4 | 14 | 116.95 | 33.87 | −150.54 | 3.73 | −55.02 | 55.87 | 0.5 |
| 5 | 2 | 107.95 | 28.36 | −106.66 | 56.74 | 9.1 | 15.91 | 0.57 |
| 5 | 3 | 107.8 | 37.54 | −100.48 | 48.89 | 6.5 | 14.3 | 0.39 |
| 5 | 4 | 100.62 | 46.12 | −117.09 | 37.26 | −11.26 | 19.72 | 0.32 |
| 5 | 5 | 91.05 | 38.51 | −132.86 | 42.15 | −19.42 | 23.73 | 0.28 |
| 5 | 6 | 101.9 | 52.07 | −124.35 | 28.32 | −21.12 | 23.02 | 0.32 |
| 5 | 7 | 97.65 | 50.64 | −131.51 | 28.21 | −27.02 | 25.01 | 0.48 |
| 5 | 8 | 93.36 | 36.24 | −159.18 | 22.26 | −44.65 | 45.4 | 0.35 |
| 5 | 9 | 103.21 | 44.68 | −148.42 | 17.68 | −42.91 | 40.01 | 0.37 |
| 5 | 10 | 125.92 | 51.46 | −142.13 | 1.55 | −50.9 | 38.5 | 0.64 |
| 5 | 11 | 120.52 | 50.19 | 28.36 | 1.8 | −63.14 | 39.75 | 0.76 |
| 5 | 12 | 121.09 | 41.95 | 24.32 | 7.48 | −73.79 | 47.07 | 0.76 |
| 5 | 13 | 118.75 | 44.31 | 28.11 | 0.65 | −62.56 | 45.68 | 0.72 |
| 6 | 3 | 98.89 | 28.4 | −110.05 | 58.29 | 1.76 | 12.93 | 0.41 |
| 6 | 4 | 98.37 | 46.21 | −115.75 | 38.44 | −11.08 | 17.7 | 0.35 |
| 6 | 5 | 99.87 | 50.24 | −124.8 | 30.61 | −20.42 | 22.77 | 0.37 |
| 6 | 6 | 102.6 | 58.55 | −122.43 | 23.37 | −23.48 | 19.8 | 0.43 |
| 6 | 7 | 103.5 | 61.93 | −124.88 | 19.5 | −27.73 | 19.37 | 0.54 |
| 6 | 8 | 108.65 | 47.39 | −140.48 | 18.14 | −36.22 | 36.95 | 0.44 |
| 6 | 9 | 103.23 | 61.04 | −138.55 | 14.66 | −41.74 | 24.38 | 0.48 |
| 6 | 10 | 112.73 | 61.97 | −142.42 | 7.77 | −48.47 | 26.74 | 0.62 |
| 6 | 11 | 117.83 | 56.21 | −149.08 | 2.06 | −57.7 | 33.71 | 0.8 |
| 6 | 12 | 118.12 | 53.23 | 18.85 | 6.87 | −76.16 | 35.91 | 0.81 |
| 7 | 4 | 96.93 | 48.79 | −118.49 | 35.51 | −15 | 18.11 | 0.42 |
| 7 | 9 | 105.61 | 61.52 | −134.73 | 15.03 | −38 | 23.59 | 0.44 |
| 7 | 11 | 108.56 | 60.28 | −144.44 | 9.47 | −49.38 | 27.88 | 0.64 |
| Range | σ1 Axis | σ2 Axis | σ3 Axis | R | ||||
|---|---|---|---|---|---|---|---|---|
| Column | Row | Strike (°) | Dip (°) | Column | Row | Strike (°) | Dip (°) | |
| 1 | 3 | −74.15 | 71.72 | 159.46 | 11.09 | 66.58 | 14.35 | 0.7 |
| 2 | 2 | −110.09 | 37.26 | 152.23 | 9.96 | 49.72 | 50.97 | 0.07 |
| 2 | 3 | −139.82 | 51.68 | −39.18 | 8.3 | 57.15 | 37.08 | 0.28 |
| 2 | 4 | −55.2 | 50.41 | −177.2 | 23.66 | 78.34 | 29.67 | 0.47 |
| 2 | 5 | −41.76 | 47.31 | −153.12 | 18.57 | 102.34 | 36.76 | 0.72 |
| 3 | 3 | −75.82 | 33.71 | −171.5 | 8.44 | 86.28 | 54.97 | 0.13 |
| 3 | 4 | −40.26 | 43.61 | −145.69 | 15.6 | 109.62 | 42.24 | 0.55 |
| 3 | 5 | −31.65 | 43.19 | −123.63 | 2.11 | 144.12 | 46.74 | 0.79 |
| 3 | 6 | −34.61 | 45.9 | 78.18 | 20.57 | −175.45 | 36.92 | 0.82 |
| 3 | 7 | −32.27 | 51.33 | 102.8 | 29.54 | −153.57 | 22.58 | 0.86 |
| 3 | 8 | −28.65 | 53.34 | 104.13 | 26.81 | −153.47 | 23.02 | 0.77 |
| 3 | 9 | −20.12 | 56.55 | 116.43 | 25.62 | −143.52 | 19.98 | 0.57 |
| 3 | 10 | 5.73 | 65.75 | 123.81 | 11.98 | −141.57 | 20.76 | 0.56 |
| 3 | 11 | 95.45 | 48.49 | −14.38 | 16.71 | −117.29 | 36.66 | 0.64 |
| 3 | 12 | 112.3 | 41.74 | −5.24 | 27.4 | −117.34 | 35.97 | 0.64 |
| 3 | 13 | 118.97 | 33.07 | 18.62 | 15.42 | −92.55 | 52.62 | 0.56 |
| 4 | 5 | −29.69 | 39.25 | 66.75 | 7.82 | 166.06 | 49.68 | 0.65 |
| 4 | 6 | −33.78 | 45.11 | 74.69 | 17.51 | 179.86 | 39.67 | 0.82 |
| 4 | 7 | −32.72 | 47.72 | 90.24 | 26.33 | −162.88 | 30.39 | 0.85 |
| 4 | 8 | −25.98 | 53.39 | 95.9 | 21.43 | −161.99 | 28.13 | 0.81 |
| 4 | 9 | −12.22 | 57.58 | 112.97 | 20.1 | −147.52 | 24.3 | 0.59 |
| 4 | 10 | 16.22 | 63.15 | 124.16 | 8.86 | −141.65 | 25.13 | 0.31 |
| 4 | 11 | 104.04 | 42.19 | −21.55 | 32.71 | −133.74 | 30.46 | 0.48 |
| 4 | 12 | 108.97 | 47.7 | −24.28 | 31.95 | −130.85 | 24.58 | 0.67 |
| 5 | 9 | 17.53 | 61.78 | 122.7 | 7.99 | −143.22 | 26.87 | 0.56 |
Publisher’s Note: MDPI stays neutral with regard to jurisdictional claims in published maps and institutional affiliations. |
© 2022 by the authors. Licensee MDPI, Basel, Switzerland. This article is an open access article distributed under the terms and conditions of the Creative Commons Attribution (CC BY) license (https://creativecommons.org/licenses/by/4.0/).
Share and Cite
Xie, Z.; Wang, E.; Lyu, Y. Seismicity and Stress State in the Ryukyu Islands Subduction Zone. Sustainability 2022, 14, 15146. https://doi.org/10.3390/su142215146
Xie Z, Wang E, Lyu Y. Seismicity and Stress State in the Ryukyu Islands Subduction Zone. Sustainability. 2022; 14(22):15146. https://doi.org/10.3390/su142215146
Chicago/Turabian StyleXie, Zhuojuan, Enhui Wang, and Yuejun Lyu. 2022. "Seismicity and Stress State in the Ryukyu Islands Subduction Zone" Sustainability 14, no. 22: 15146. https://doi.org/10.3390/su142215146