Article

Extreme Positive Indian Ocean Dipole in 2019 and Its Impact on Indonesia

1
Department of Physics, Faculty of Mathematics and Natural Sciences, Sriwijaya University, Indralaya 30662, Indonesia
2
Department of Atmospheric and Planetary Sciences, Sumatra Institute of Technology, Bandar Lampung 35365, Indonesia
3
Department of Fisheries, Faculty of Agriculture, Universitas Gadjah Mada, Yogyakarta 55281, Indonesia
4
Department of Oceanography, Faculty of Fisheries and Marine Sciences, Diponegoro University, Semarang 50275, Indonesia
5
Center for Coastal Disaster Mitigation and Rehabilitation Studies, Diponegoro University, Semarang 50275, Indonesia
6
Department of Atmospheric and Oceanic Science, University of Maryland, College Park, MD 20742, USA
7
Faculty of Earth Science and Technology, Bandung Institute of Technology, Bandung 40132, Indonesia
8
Department of Marine Science, Faculty of Mathematics and Natural Sciences, Sriwijaya University, Indralaya 30662, Indonesia
*
Author to whom correspondence should be addressed.
Sustainability 2022, 14(22), 15155; https://doi.org/10.3390/su142215155
Submission received: 21 September 2022 / Revised: 8 November 2022 / Accepted: 9 November 2022 / Published: 16 November 2022
(This article belongs to the Special Issue Impact of Indo-Pacific Climate Variability)

Abstract

:
The evolution of an extreme positive Indian Ocean Dipole (pIOD) that took place in the tropical Indian Ocean during the late boreal summer to early winter of 2019 is examined in terms of coupled ocean–atmosphere dynamics. The patterns of anomalous sea-surface temperature (SST) revealed a typical pIOD characteristic: cooling (warming) in the southeastern (western) tropical Indian Ocean. Based on the Dipole Mode Index (DMI), the evolution of the event started in mid-July and gradually strengthened with an abrupt weakening in early September before coming to its peak in late October/early November. It quickly weakened in November, and then it terminated in mid-December. During the peak phase of the event, the SST anomaly in the southeastern (western) tropical Indian Ocean reached about −2 °C (+1 °C). The pattern of anomalous SST was followed by an anomalous pattern in precipitation, in which deficit precipitation was observed over the eastern Indian Ocean, particularly over the Indonesia region. Earlier study has shown that dry conditions associated with the pIOD event created a favorable condition for a forest-peat fire in southern Sumatra. The number of fire hotspots has increased significantly during the peak phase of the 2019 pIOD event. In addition, anomalously strong upwelling forced by strong southeasterly wind anomalies along the southern coast of Java and Sumatra had induced a surface chlorophyll-a (Chl-a) bloom in this region. High surface Chl-a concentration was collocated with the negative SST anomalies observed off the southwest Sumatra coast and south Java.

1. Introduction

Southern coasts of Indonesia (west-southwest Sumatra and south of Java) are the center of the eastern pole of the Indian Ocean Dipole (IOD). Similar to oscillation in the tropical Pacific Ocean associated with El Nino-Southern Oscillation (ENSO), the IOD is an oscillation mode in the tropical Indian Ocean, marked by unusually low (high) SST anomalies in the southeastern (western) tropical zone and associated surface wind anomalies [1,2,3]. The IOD develops through coupled ocean–atmospheric interaction, known as a positive Bjerknes feedback, in which the SST zonal gradient, zonal wind stress, thermocline depth, and upwelling interact to intensify disturbance from the background state [4]. More recently, a delayed oscillator has been proposed to be involved in the evolution of the IOD [5]. Both Bjerknes feedback and a delayed oscillator are at work during the development of IOD. The evolution of IOD is seasonally phase-locked. It develops in early boreal summer, matures in boreal fall (September–November), and most of the events disappear in early boreal winter (December–January) [4].
The IOD plays an important role in the hydrological cycle on its surrounding continent [6,7]. During positive IOD, excess rainfall over the western Indian Ocean, particularly East Africa and India, and deficit rainfall over the eastern Indian Ocean, resulting in drought in Indonesia and Australia, follow the dipole pattern in SST anomalies. Recent studies have shown that extreme positive IOD events could lead to forest-peat fires in Indonesia [8,9] and widespread Australian bush fires [10,11].
In 2019, an extreme positive IOD event was reported to have occurred in the tropical Indian Ocean [12,13,14,15,16,17]. It has been suggested that the 2019 IOD event was generated by an increase in inter-hemispheric pressure gradient over the Indonesia region due to a strengthening of Australian high and a weakening of sea level pressure over the South China Sea [15]. Du et al., [12] have suggested that anomalously strong westward propagating downwelling Rossby waves in boreal spring caused thermocline warming in the southwest tropical Indian Ocean then enhanced a positive Bjerknes feedback leading to the development of extreme positive IOD in 2019.
Moreover, a unique feature of the 2019 event compared to the previous positive IOD events is that the air–sea heat flux contributed to the cooling of the eastern pole [16]. High chlorophyll-a (Chl-a) concentration was observed in the eastern tropical Indian Ocean associated with strong-wind-induced upwelling along the western coast of Sumatra and along the eastern equatorial Indian Ocean [11]. On the other hand, low Chl-a concentration in the west of the tropical Indian Ocean was associated with anomalously strong downwelling leading to low-nutrient water.
The objective of this study is to evaluate the evolution of the 2019 extreme IOD and its impact on Indonesia. In particular, this study examines how the drought led to forest-peat fires in Sumatra and the effect of anomalously strong upwelling on the distribution and concentration of surface Chl-a within Indonesian seas.

2. Data and Methods

2.1. Data

To elucidate the evolution of SST anomalies in the tropical Indian Ocean associated with the IOD event in 2019, we used daily optimum interpolation sea surface temperature (OISST) from the National Oceanic and Atmospheric Administration (NOAA). The gridded data have a spatial resolution of 0.25° and they are available from January 1982 until present (available at http://www.ncdc.noaa.gov/oa/climate/research/sst/ access on 22 November 2021).
Daily gridded wind data were obtained from the European Centre for Medium-Range Weather Forecasts (ECMWF) Reanalysis (ERA5) with horizontal resolution of 0.25° and there are 27 pressure levels in the vertical direction from 1000 mb to 100 mb with various vertical resolutions. The data, from January 1979 until the present, are available at the Asia-Pacific Data Research Center (APDRC), University of Hawaii (http://apdrc.soest.hawaii.edu) and were accessed on 15 November 2021.
The Ocean Surface Current Analyses Real-time (OSCAR) data were used which represent the current within the mixed layer at a depth of about 15 m. Note that the currents were estimated based on geostrophy, Ekman, and thermal wind dynamics from the gradient of sea surface height, ocean vector winds, and sea surface temperature fields [16]. The gridded data have spatial and temporal resolutions of 0.33° and 5 days, respectively. They are available from October 1992 to present (https://podaac.jpl.nasa.gov/dataset/OSCAR_L4_OC_third-deg) and were accessed on 5 November 2021.
The daily gridded precipitation with spatial resolution of 0.5° were obtained from the Climate Prediction Center (CPC) Global Unified Gauge-Based Analysis (https://psl.noaa.gov/data/gridded/data.cpc.globalprecip.html). The data available refer to January 1979 until present and were accessed on 10 November 2021. Monthly sea surface height (SSH) data were from the Global Ocean Data Assimilation System (GODAS) (https://psl.noaa.gov/data/gridded/data.godas.html). The data have a meridional resolution of 0.33°, while zonal resolution is 1°, and the data available refer to January 1980 to the present and were accessed on 11 November 2021.
In order to evaluate possible impact of 2019 IOD on the forest fire in Indonesia, in particular in Sumatra, the fire hotspot data from the Fire Information for Resource Management System (FIRMS) of the National Aeronautics and Space Administration (NASA)—Moderate Resolution Imaging Spectroradiometer (MODIS) and Visible Infrared Imaging Radiometer Suite (VIIRS) were used in this study (https://earthdata.nasa.gov/earth-observation-data/near-real-time/firms) and accessed on 24 November 2021. Here, we used land burning confidence level of ≥80% to classify the hotspots as a real fire on the land. Note that the confidence level used to define fire pixels is based on a threshold, in which the ≥80% level is categorized as a high confidence for fire pixel [18]. Meanwhile, the possible impact of 2019 IOD on the oceanic chlorophyll-a (Chl-a) was analyzed by using MODIS Chl-a data [19]. Level three monthly data of surface Chl-a with spatial resolution of 9 km were used in this study for the period of January 2003 until December 2020 (https://oceancolor.gsfc.nasa.gov/cgi/l3). The Dipole Mode Index (DMI) and Niño Index are publicly available from https://stateoftheocean.osmc.noaa.gov/sur/ind/dmi.php and were accessed on 1 September 2021.

2.2. Method

The gridded daily data were first averaged into monthly data, then the monthly climatology was computed based on the period of January 1982 to December 2019, except for the Chl-a data which was based on the period of January 2003 to December 2019 and surface current from January 2000 to December 2019. The monthly climatology calculation is defined as [20]:
C ¯ ( x , y ) = 1 n i = 1 n c i ( x , y , t ) ,
where C ¯ ( x , y ) is the monthly climatology value at position (x,y), c i ( x , y , t ) is i-th value of the data at (x,y) position and time t, and n is the number of months. Then, the monthly anomalies were obtained by subtracting their monthly climatological fields to the data.
We used surface wind data (i.e., zonal and meridional wind components) to calculate the surface wind stress (τ) using formula,
τ = ρ a C D U 2 ,
where ρ a is the air density (1.25 kg m−3), C D is the drag coefficient (2.6 × 10⁻³), and U is the surface wind speed.
In order to describe the temporal evolution and intensity of the IOD event, we used time series of the Dipole Mode Index (DMI). The index was calculated by the gradient of SST anomalies between the western tropical Indian Ocean (50° E–70° E, 10° S–10° N) and its eastern counterpart (90° E–110° E, 10°S-Equator) [1]. To show the possible evolution of El Niño/La Niña event in the tropical Pacific during 2019, we used Niño index as a proxy. In this study, we used the Niño1+2, Niño3, Niño3.4 and Niño4 indices which describe the SST evolution in the tropical Pacific [21]. The Niño1+2 index is defined as the average SST anomalies in the eastern tropical Pacific (0°–10° S, 90° W–80° W), and the Niño3 index is the average SST anomalies within the area of (5° N–5° S, 150° W–90° W). The Niño4 index represents the average SST anomalies in the central Pacific (5° N–5° S, 160° E–150° W), while the Niño3.4 is the average SST anomalies in the intersection of Niño3 and Niño4 (5° N–5° S, 170° W–120° W). A positive value of DMI or Niño indices indicate that a positive IOD or El Niño event is occurring. When a positive IOD or El Niño event is taking place, anomalous southeasterly winds blow along the southern coast of Java-Sumatra. As a response of the ocean to these southeasterly winds, offshore Ekman transport (upwelling) is observed along the coast leading to a decrease in SST (negative anomaly). The alongshore upwelling also causes an increase in surface Chl-a concentration there. The situations are reversed during the negative IOD or La Niña event.

3. Results

3.1. Evolution of the Extreme Positive Indian Ocean Dipole in 2019

Figure 1a shows the time series of DMI, which reflects the temporal evolution of extreme positive IOD events in 2019. A rapid increase in the DMI was observed from late July, though there was a sharp weakening from mid-August to early September (Figure 1a—black curve). The DMI, thereafter, gradually increased and reached its peak in late October. Note that the maximum DMI value was +2.74 °C, and it became the largest DMI value over the last two decades (2000–2020). For that reason we suggest that the positive IOD in 2019 was an extreme positive IOD event. The DMI rapidly decreased from mid-November as a warming tendency was observed in the eastern pole. The IOD terminated in mid-December when the eastern pole became positive. An early study suggests that the DMI is controlled by the SST variability in the western and eastern poles. We can see that the eastern tropical Indian Ocean started to cool in early May, but constant cooling began in early June and continued to reach its peak in late October (Figure 1a—red curve). Meanwhile, the warming tendency in the western tropical Indian Ocean started in late July, interrupted by a short cooling event in August before it showed a steady warming tendency from early September and reached its peak in late October (Figure 1a—green curve). The warming tendency in the western pole reached its peak in late October and has continued even though the IOD had terminated. It is seen that the DMI evolution in 2019 was mainly dominated by the variability of the eastern pole, which is the typical positive IOD event.
While the positive IOD event took place in the tropical Indian Ocean, a normal condition was observed in the tropical Pacific. All Niño indices show that there was no El Niño/La Niña phenomenon in the tropical Pacific during 2019 (Figure 1b).
To illustrate the spatio-temporal evolution of the extreme positive IOD event in 2019, the variability of SST and surface wind stress anomalies are shown in Figure 2. Negative SST anomalies covered the southeastern tropical Indian Ocean and extended westward to about 80° E in May (Figure 2a—shading). Meanwhile, the western equatorial Indian Ocean was covered by positive SST anomalies, which also showed as being zonally extended from the eastern coast of Africa to about 70° E. The cooling in the southeastern tropical Indian Ocean was associated with southeasterly wind anomalies observed along the southern coast of Java and Sumatra that induced an offshore Ekman transport leading to upwelling along the coast (Figure 2a—vector). As shown previously by the DMI time series (Figure 1a), the weakening of SST cooling (warming) in the eastern (western) pole was observed in June. The spatial pattern of winds and SST anomalies revealed that the alongshore winds off south Java were weakened, and the cooling SST was confined to the southern coast of Java (Figure 2b). Similarly, negative SST anomalies were observed in the western tropical Indian Ocean off the African coast.
In July, the southeasterly wind anomalies were gradually strengthened in the south of Java, and the cooling tendency slightly strengthened (Figure 2c). However, negative SST anomalies were persistent in the western tropical Indian Ocean. A typical SST pattern representing positive IOD event developed in August as the southeasterly wind anomalies along the southern coast of Java and Sumatra, and easterly wind anomalies were strengthened (Figure 2d). The SST gradient maintained in the following months as the eastern (western) pole became cooler (warmer) (Figure 2e). It reached its peak in October-November, showing a typical positive IOD pattern with negative (positive) SST anomalies covering the eastern (western) basin (Figure 2f,g). In December, the SST pattern disappeared, and basin-wide warming was observed (Figure 2h). Note that the easterly wind anomalies were still observed along the equator, indicating that surface heat flux plays an essential role in the warming in the eastern tropical Indian Ocean [17,22,23].
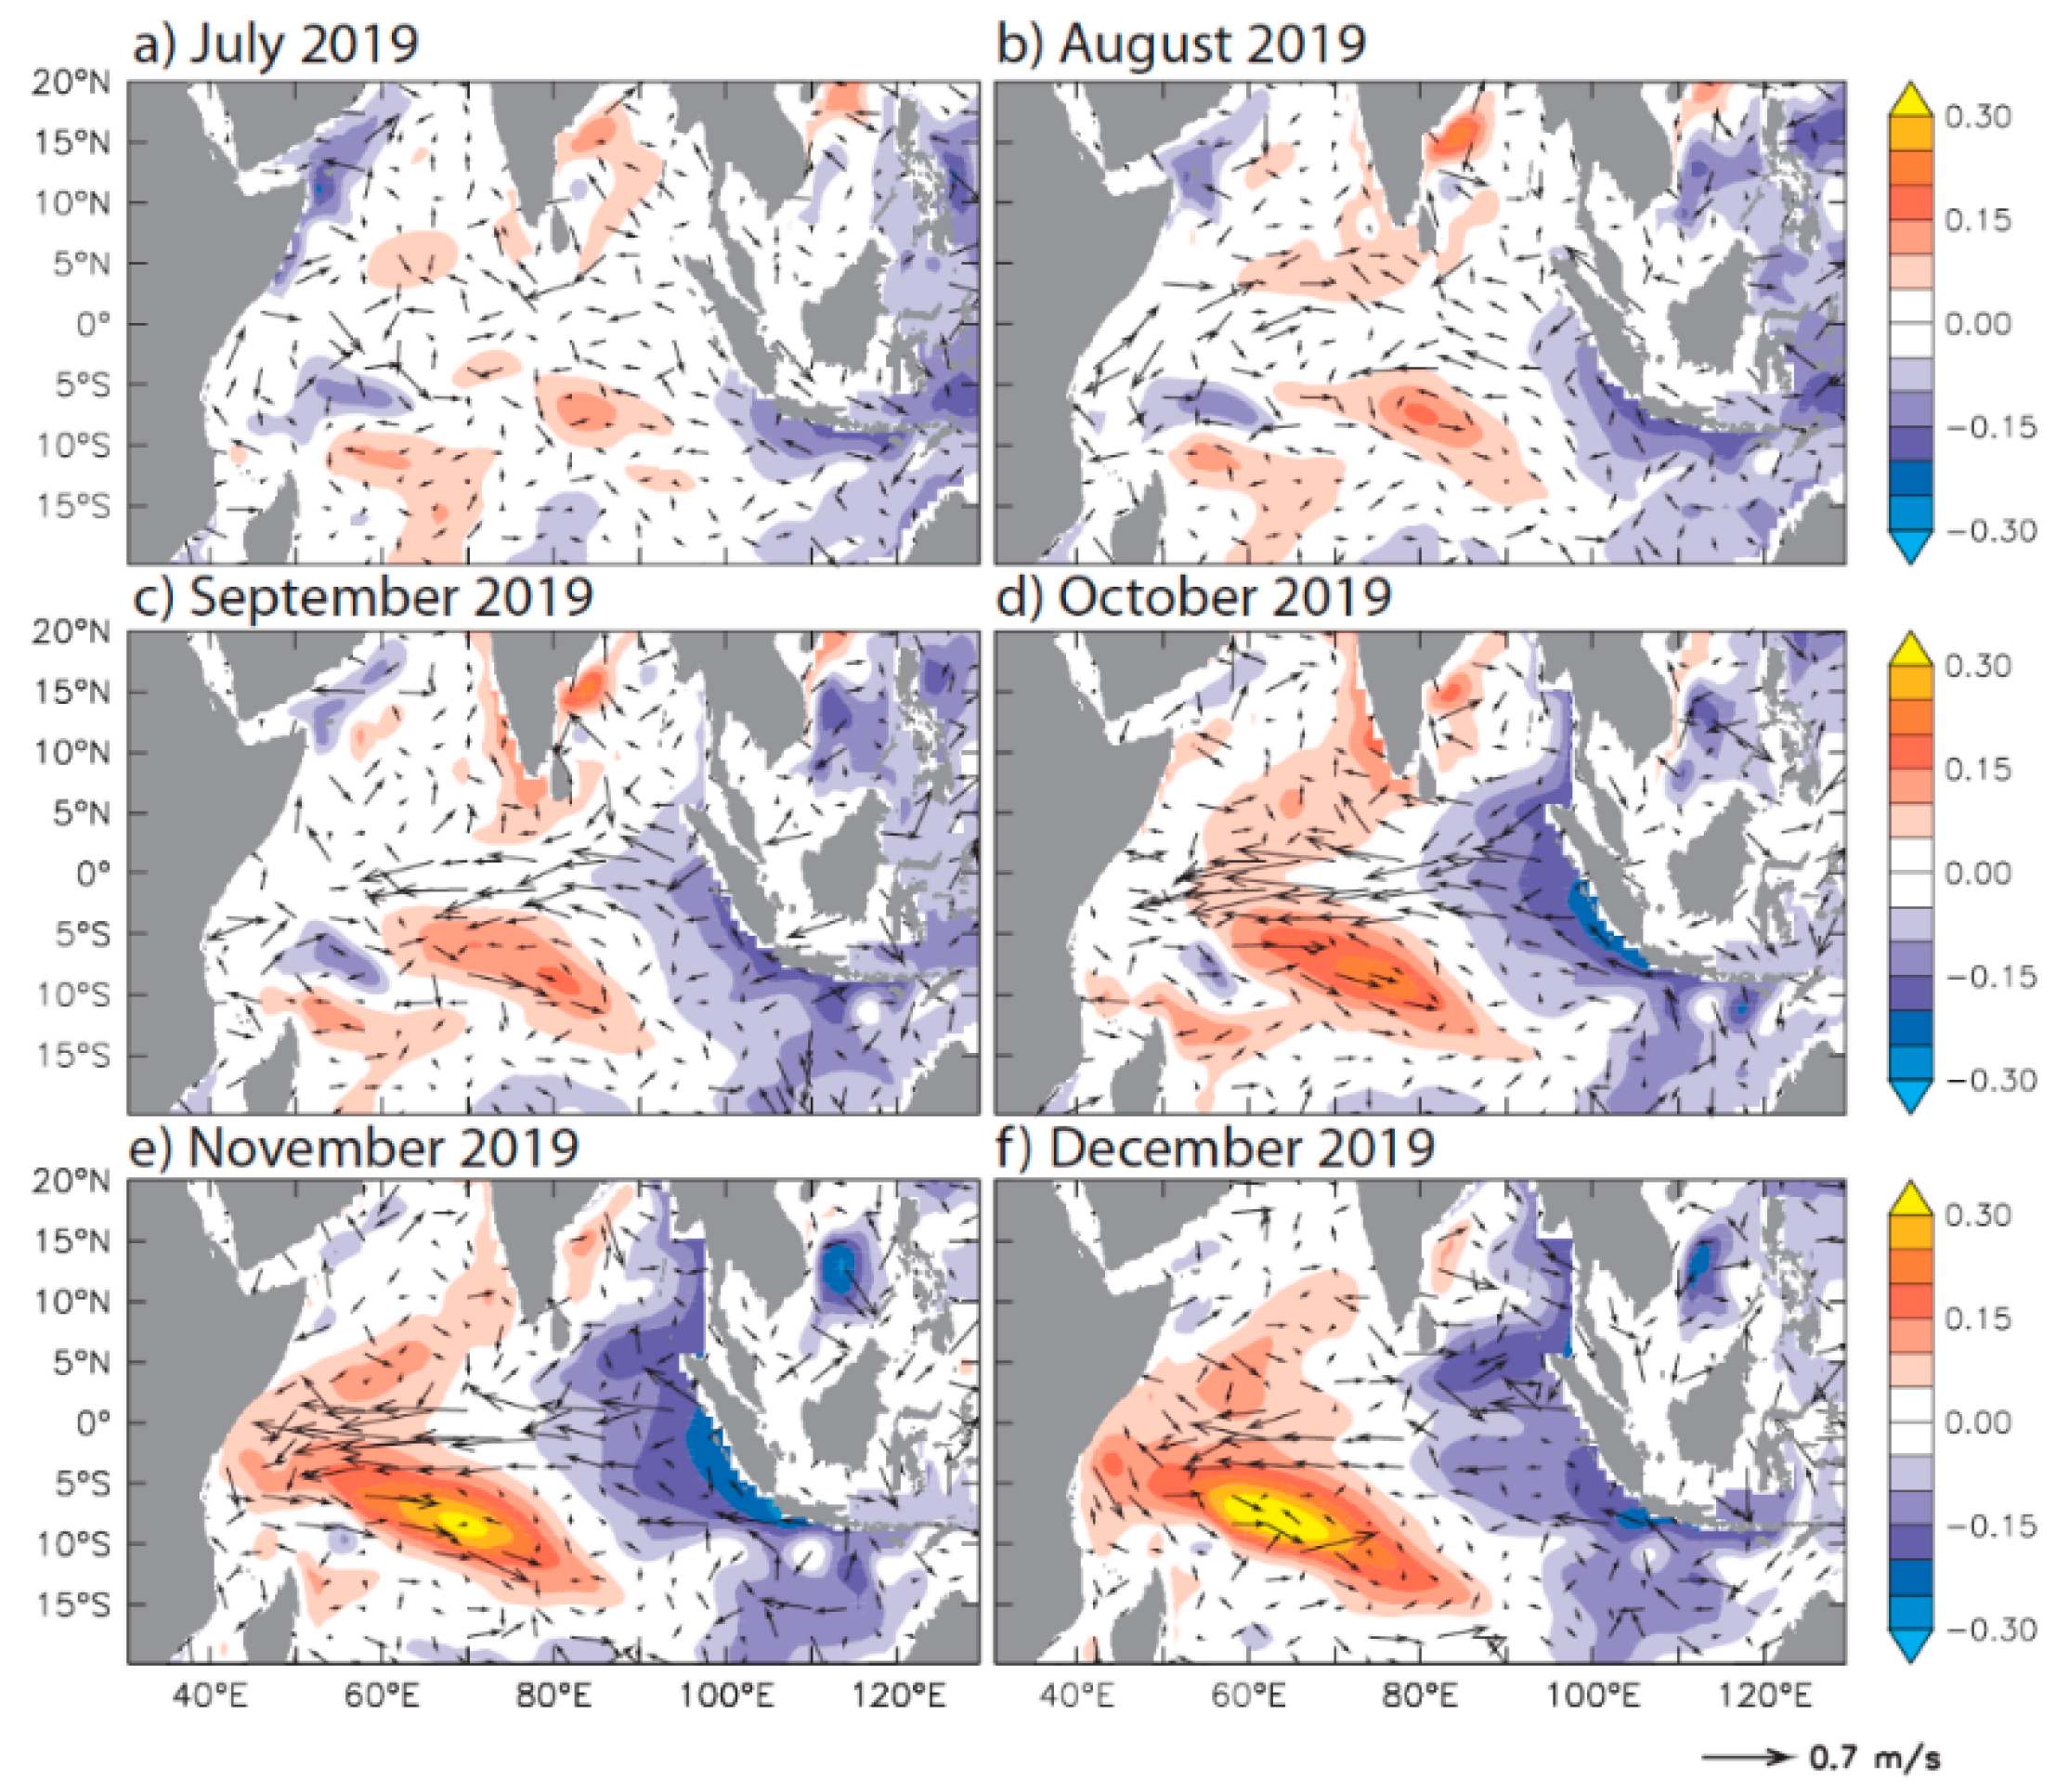
Previous studies have suggested that the evolution of IOD events is associated with the propagation of wind-forced equatorial waves [24,25]. Figure 3 presents the monthly variation of SSH and surface current anomalies during July–December 2019. The SSH anomalies patterns show the propagation of off-equatorial Rossby waves and equatorial and coastal Kelvin waves. Initial development of downwelling off-equatorial Rossby waves (positive SSH anomalies) was observed in the central Indian Ocean between 5°–10° S (Figure 3a). Negative SSH anomalies along the southern coast of Java and Sumatra indicate that upwelling has been occurring there. The downwelling Rossby waves were further developed and propagated westward as the easterly wind anomalies along the equator were strengthened in August (Figure 3b). Meanwhile, upwelling signals (negative SSH anomalies) associated with upwelling Kelvin waves were observed in the eastern equatorial Indian Ocean and along the western coast of Sumatra—the southern coast of Java.
Both downwelling Rossby waves and upwelling Kelvin waves got stronger as the easterly wind anomalies fully developed along the equatorial Indian Ocean, especially when the IOD came to its peak in October–November (Figure 3d,e). The downwelling off-equatorial Rossby waves propagated westward from the central Indian Ocean to the western boundary, deepening the thermocline there and warming the SST in the west pole. On the other hand, the upwelling Kelvin waves propagated eastward in the eastern equatorial Indian Ocean and then propagated further southeastward and northeastward along the coastal waveguides as upwelling coastal Kelvin waves. These upwelling Kelvin waves were shoaling the thermocline and cooling the SST in the eastern pole. We note that the downwelling off-equatorial Rossby waves reached the western boundary and reflected into the interior Indian Ocean as downwelling equatorial Kelvin waves in November–December (Figure 3e,f). In the eastern boundary, part of the upwelling equatorial Kelvin waves reflected westward as upwelling Rossby waves reached the western coast of Sumatra (Figure 3d–f). Even though the IOD terminated in December 2019, the signals of equatorial wave dynamics were still visible as the easterly winds anomaly remained along the equatorial Indian Ocean (Figure 3f). This further indicates that the surface heat flux may have played a dominant role in the termination of the 2019 IOD event [17,22,23].
The surface current anomalies did not show a clear pattern during the development phase of the 2019 IOD event (Figure 3a,b). However, during the peak phase of the 2019 IOD, strong westward current anomalies were observed along the equatorial Indian Ocean (Figure 3c–e). These westward current anomalies, forced by easterly wind anomalies along the equator, indicated the absence of the fall Wyrtki jet during October–November 2019, as previously suggested for positive IOD events [22,26]. Surface current anomalies maintained along the equatorial Indian Ocean after the IOD terminated in December, as did prevailing easterly wind anomalies (Figure 3f).

3.2. Comparison with Previous Positive Indian Ocean Dipole

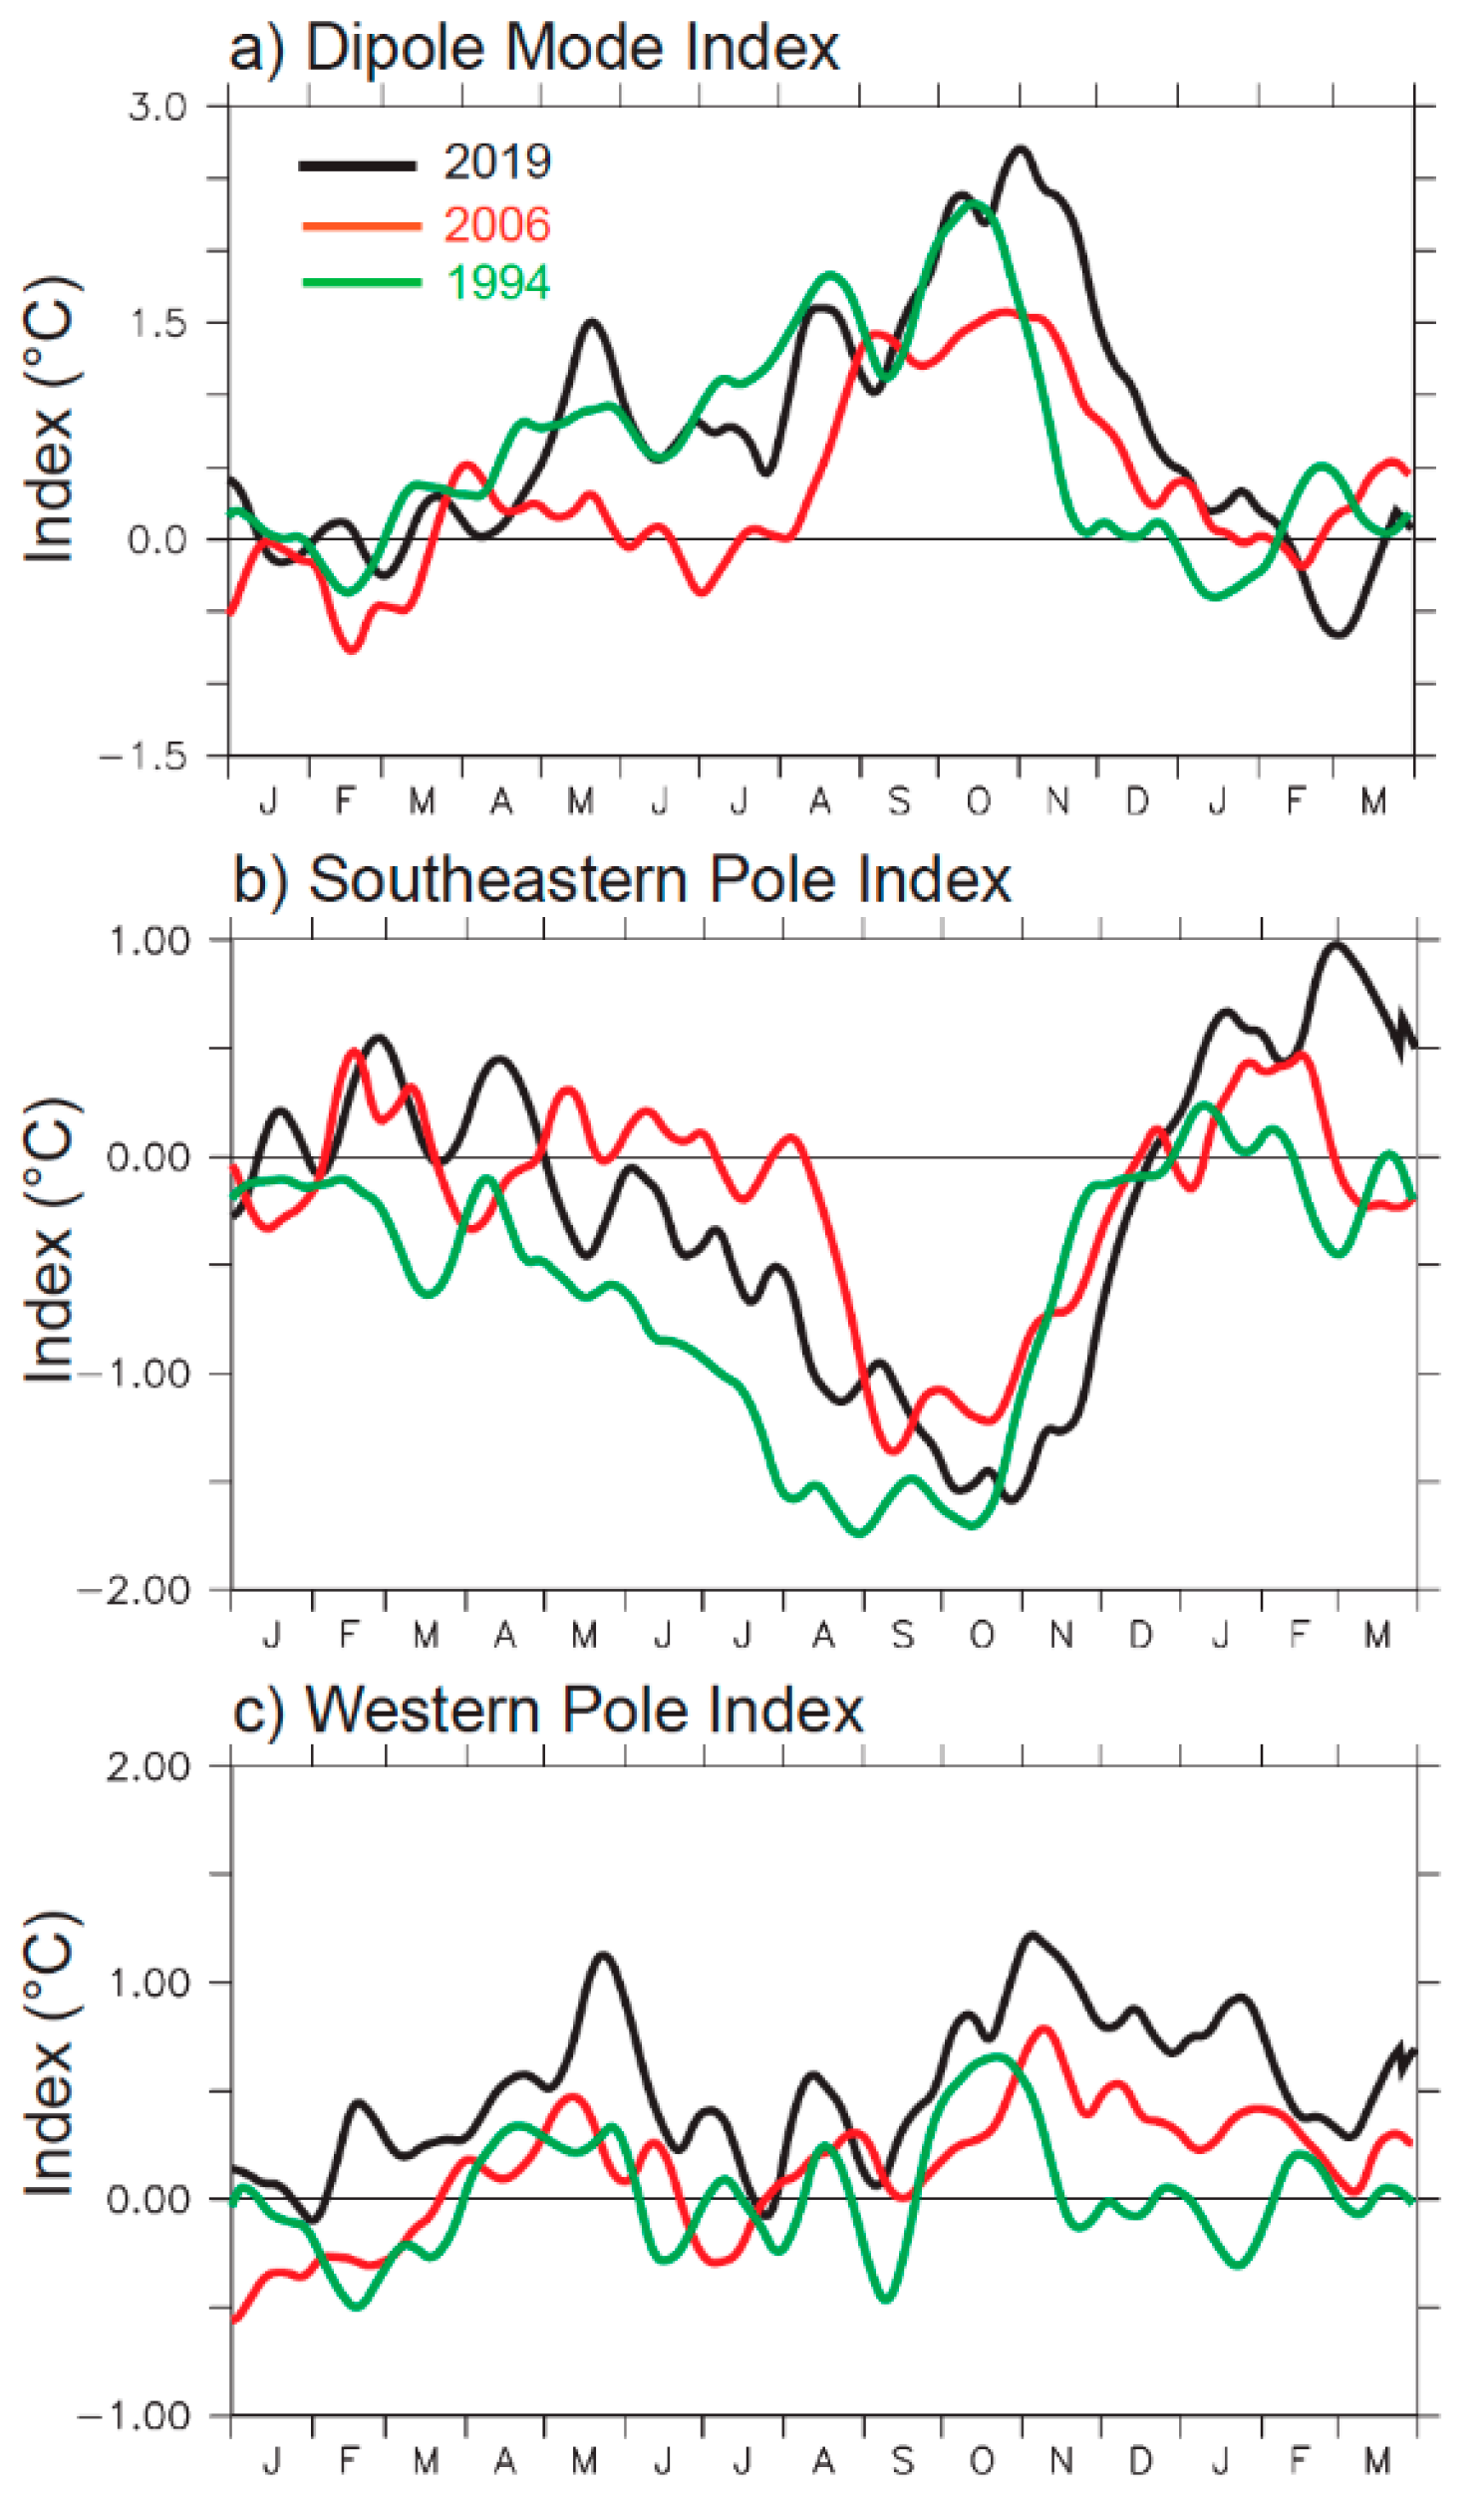
To study how strong the extreme 2019 positive IOD event was, we compared it with previous IOD occurrences. Here, we chose two pure positive IOD events (1994 and 2006) without El Niño/La Niña taking place in the tropical Pacific [14,15]. Figure 4 shows the time series of DMI, east and west pole during three positive IOD occurrences in 1994, 2006, and 2019. The DMI time series revealed that the 2019 IOD was stronger and longer than the other two events in 1994 and 2006 (Figure 4a). It lasted for about five months from mid-July to mid-December 2019, with the maximum DMI value reaching about +2.74 °C.
Southeastern tropical cooling and western tropical warming mark a typical positive IOD, as seen in these three positive IOD events (Figure 4b,c). The cooling of the southeastern pole during 2019 was comparable in magnitude to that of the 1994 event, but they showed different phases; the 1994 cooling began and terminated earlier than 2019. Meanwhile, the 2006 cooling was shorter and weaker than the other two events. On the other hand, the western tropical warming in 2019 was more prominent than the other two IODs in 1994 and 2006 (Figure 4c). The magnitude and the duration of 2019 warming were higher and more prolonged, respectively. We noted that the western tropical Indian Ocean’s warming in 1994 was the weakest and shortest compared to the other two IOD events.
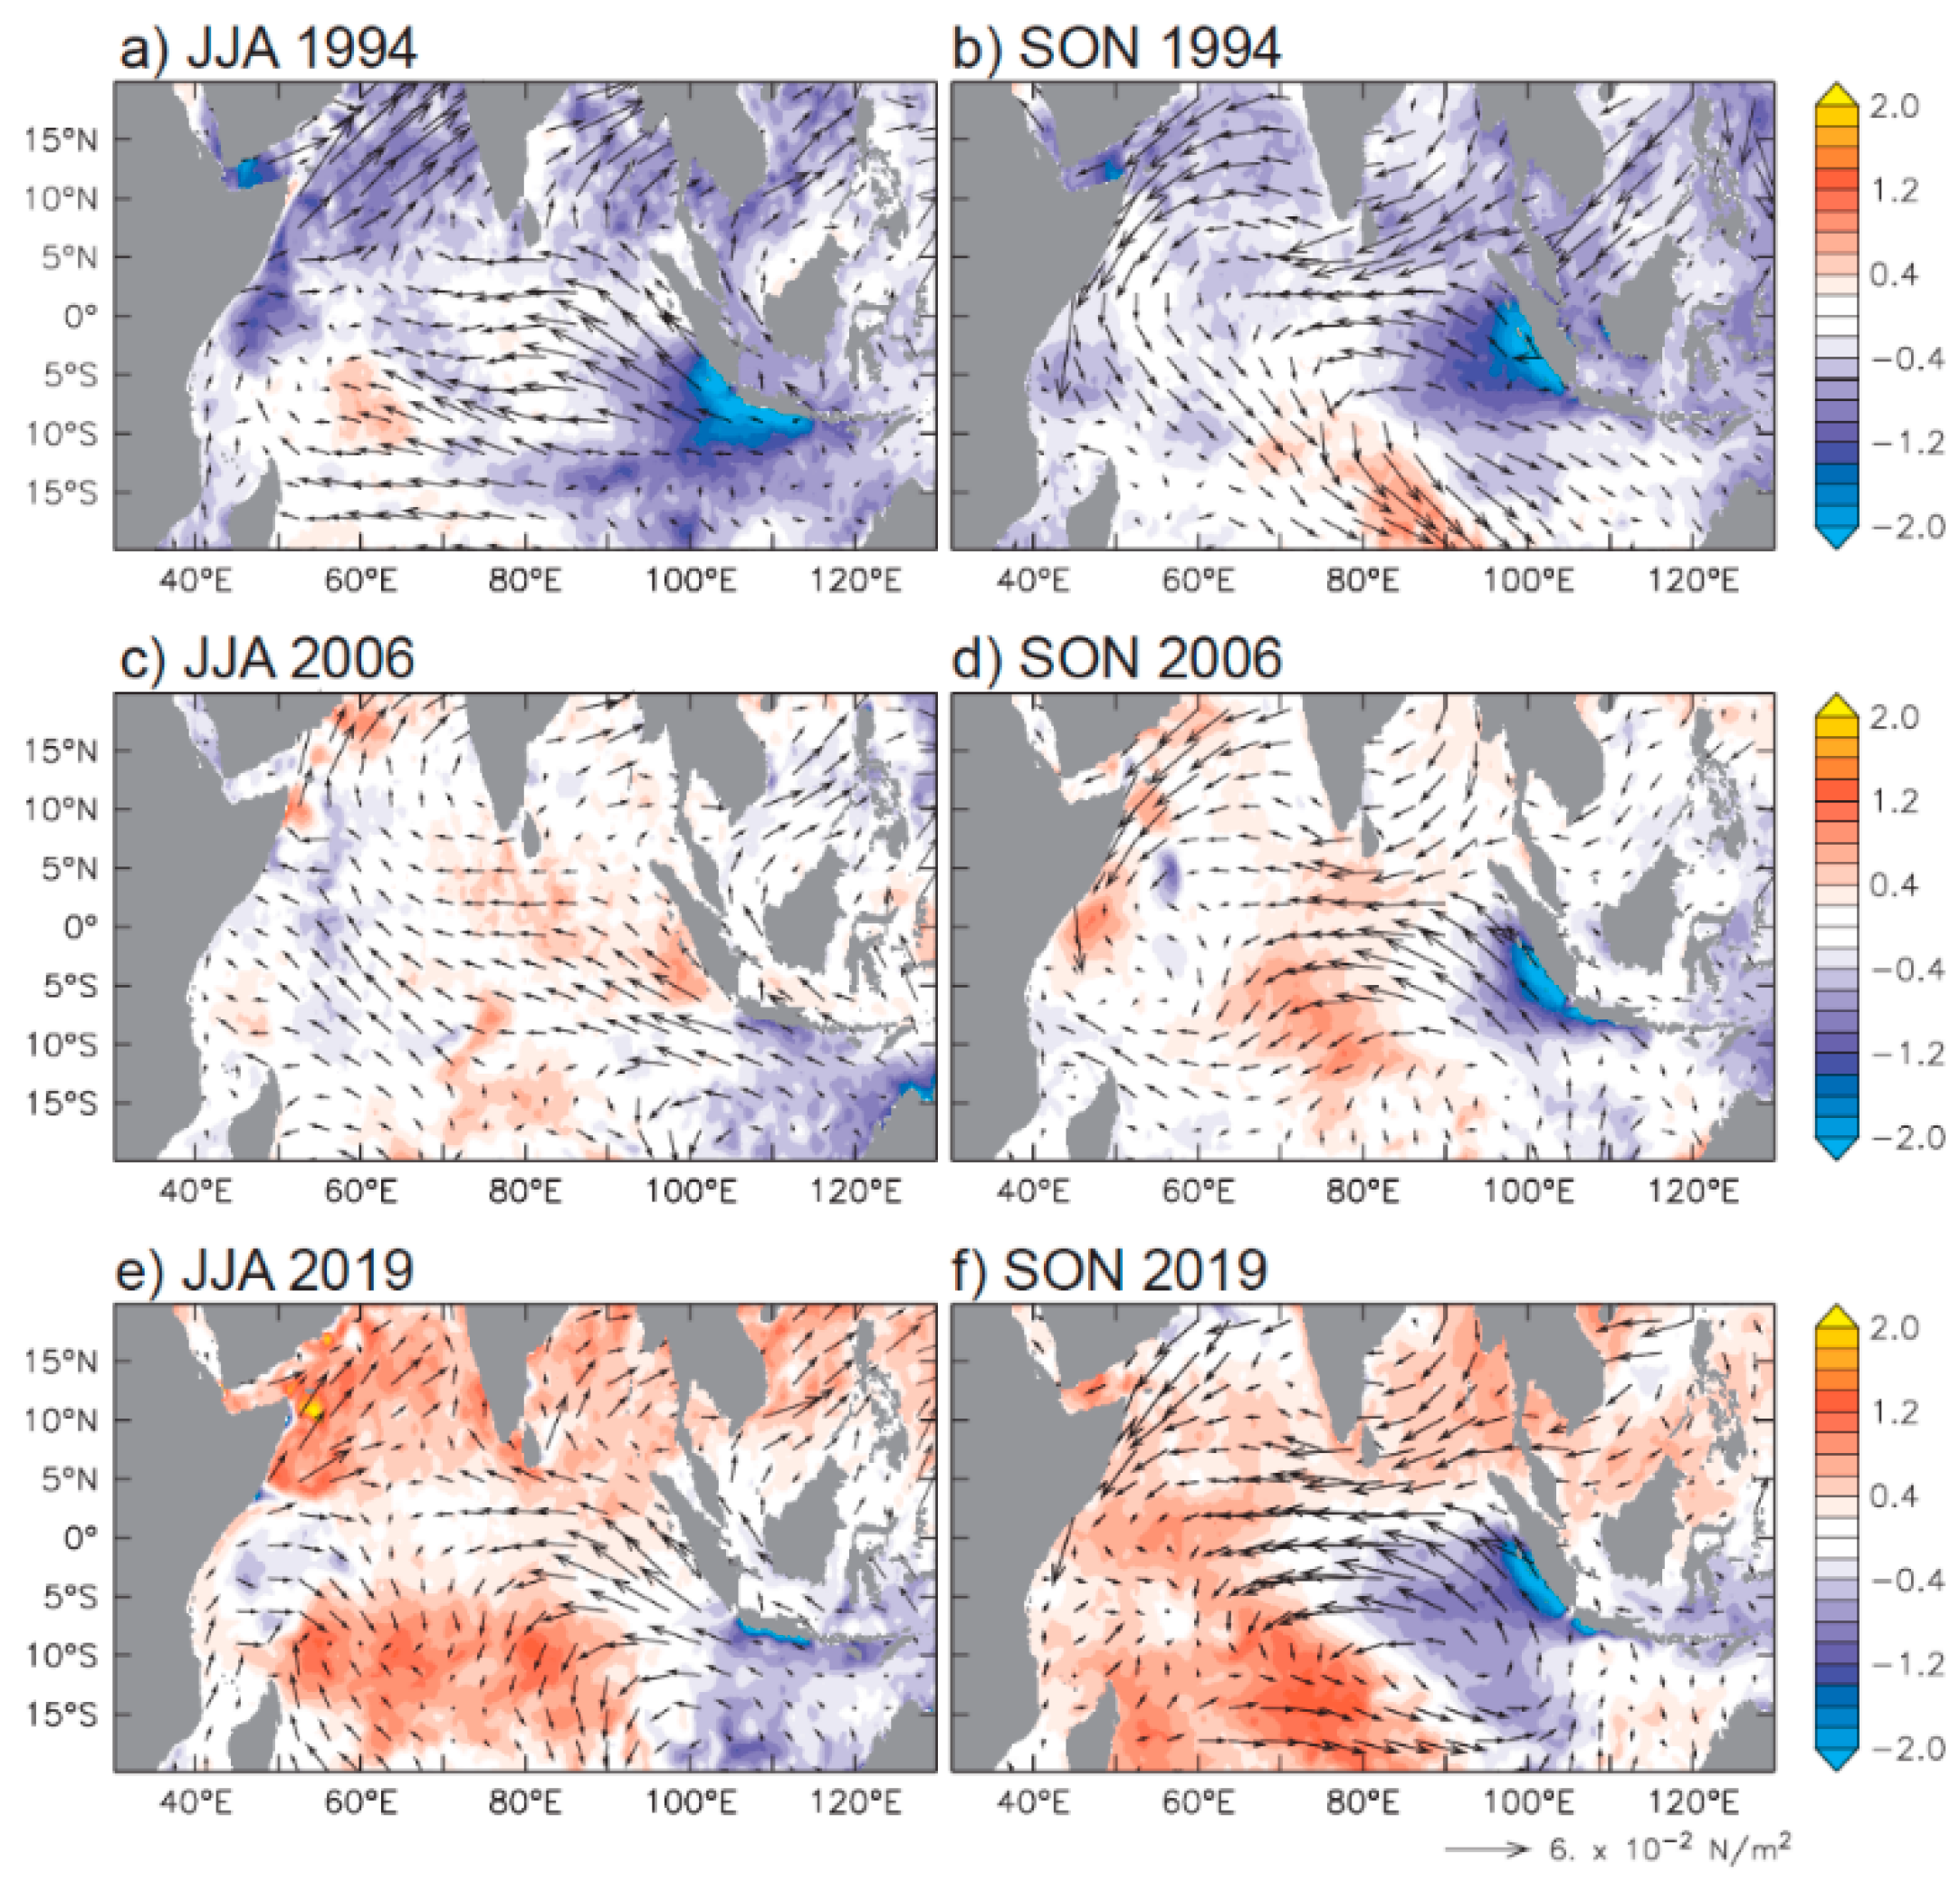
To compare the spatial patterns of those three positive IOD events, we calculated the seasonal average of SST and surface wind stress anomalies during boreal summer (June-July-August/JJA) and boreal fall (September-October-November/SON) for each IOD event (Figure 5). Robust pattern of SST gradient in the tropical Indian Ocean during the peak phase of the event in boreal fall (SON), with negative (positive) SST anomalies covering the southeastern (western) tropical Indian Ocean, marked the different between the 2019 extreme IOD event and the other two events of 1994 and 2006 (Figure 5e,f). The SST pattern during the 2006 event indicated that the SST cooling in the southeastern region was narrower, while the prominent SST warming was found in the central tropical Indian Ocean (Figure 5c,d) [27]. Meanwhile, the SST pattern during the 1994 event was dominated by the cooling in the southeastern pole (Figure 5a,b). The remarkable difference in the SST gradient was associated with the magnitude of the surface wind stress. We found that the surface wind stress anomalies during the peak phase of the 2019 IOD were stronger and extended further westward compared to those observed during the 1994 and 2006 IODs (Figure 5b,d,f).
The associated Walker circulation also indicated different patterns for those three positive IOD events. Figure 6 depicts the anomalous Walker circulations that occurred during the peak of the IOD events in boreal fall (SON). As expected, all IOD occurrences showed the downward (upward) branch of the Walker circulation over the negative (positive) SST anomalies. The downward branch was seen across Indonesia and the surrounding region in 1994, extending from roughly 75° E to 150° E, while the upward branch was seen east of 75° E (Figure 6a). The Walker circulation in the 2006 IOD was narrower than that of the 1994 IOD (Figure 6b). The downward branch was found between 85° E and 135° E, while the upward branch was found between 40° E and 75° E. The 2019 extreme IOD event, on the other hand, exhibited downward motion over Indonesia between 75° E and 140° E, with upward motion observed more westward than prior IOD occurrences, east of roughly 65° E (Figure 6c). We noted that the difference in Walker circulation between those three IOD occurrences was linked to the different patterns of SST anomalies.

3.3. Impact of the Extreme Positive Indian Ocean Dipole in 2019

Based on remotely sensed and reanalyzed data, this study assessed the evolution of the 2019 extreme positive IOD event. Based on the DMI time series, it shows that the 2019 IOD event was the strongest (highest value was +2.74 °C) and longest (from mid-July to mid-December) in the recent two decades (Figure 1a). Without the development of El Niño in the tropical Pacific Ocean, the 2019 extreme IOD event was classified as a pure event (Figure 1b). Furthermore, the spatial patterns of SST and surface wind anomalies also presented clearly a typical positive IOD pattern (Figure 2). Negative (positive) SST anomalies were found in the southeastern (western) tropical Indian Ocean, and the southeasterly and easterly winds prevailed over the eastern tropical Indian Ocean. As a response of the ocean to the surface wind anomalies, the equatorial waves (off-equatorial Rossby waves and equatorial Kelvin waves) were also generated, highlighting the importance of ocean dynamics in the formation of the 2019 extreme IOD (Figure 3).
The Indonesian region has unique precipitation patterns, with three distinct patterns that are strongly influenced by ENSO [28]. In addition, previous studies have shown the significant impact of positive IOD events on Indonesia, particularly precipitation [4,29,30,31]. The 2019 extreme IOD event also significantly affected Indonesian precipitation. Figure 7 shows the monthly precipitation anomalies during 2019. The southern parts of Indonesia, from the south part of Sumatra to the south part of Papua, have already experienced deficit precipitation in June 2019 (Figure 7a). Meanwhile, the northern parts of Indonesia experienced surplus precipitation. In July, all Indonesian regions experienced deficit precipitation, except the north part of Papua (Figure 7b). Deficit precipitation continued in August, while the excess rainfall over Papua slightly shifted to the eastern part (Figure 7c). We also noted excess precipitation over the north part of Sumatra.
In September, all the Indonesian regions experienced deficit precipitation, and the highest deficit was observed over the coldest SST anomalies (Figure 7d). Interestingly, the deficit precipitation was confined to the southwestern parts of Indonesia over the southern half of Sumatra and Java in October (Figure 7e). Moreover, there was a dipole-like pattern of precipitation over the Sumatra region. Robust excess (deficit) precipitation was observed over the north (south) parts of Sumatra. Meanwhile, the north parts and the eastern parts of Indonesia experienced excess rainfall. We hypothesized that the coupled precipitation–local SST relationships play a role in the precipitation distribution. However, further study is required to evaluate the interaction between precipitation and local SST variations quantitatively. Finally, the Indonesian regions again experienced deficit precipitation in November (Figure 7f) before gradually receiving more rainfall in the following months.
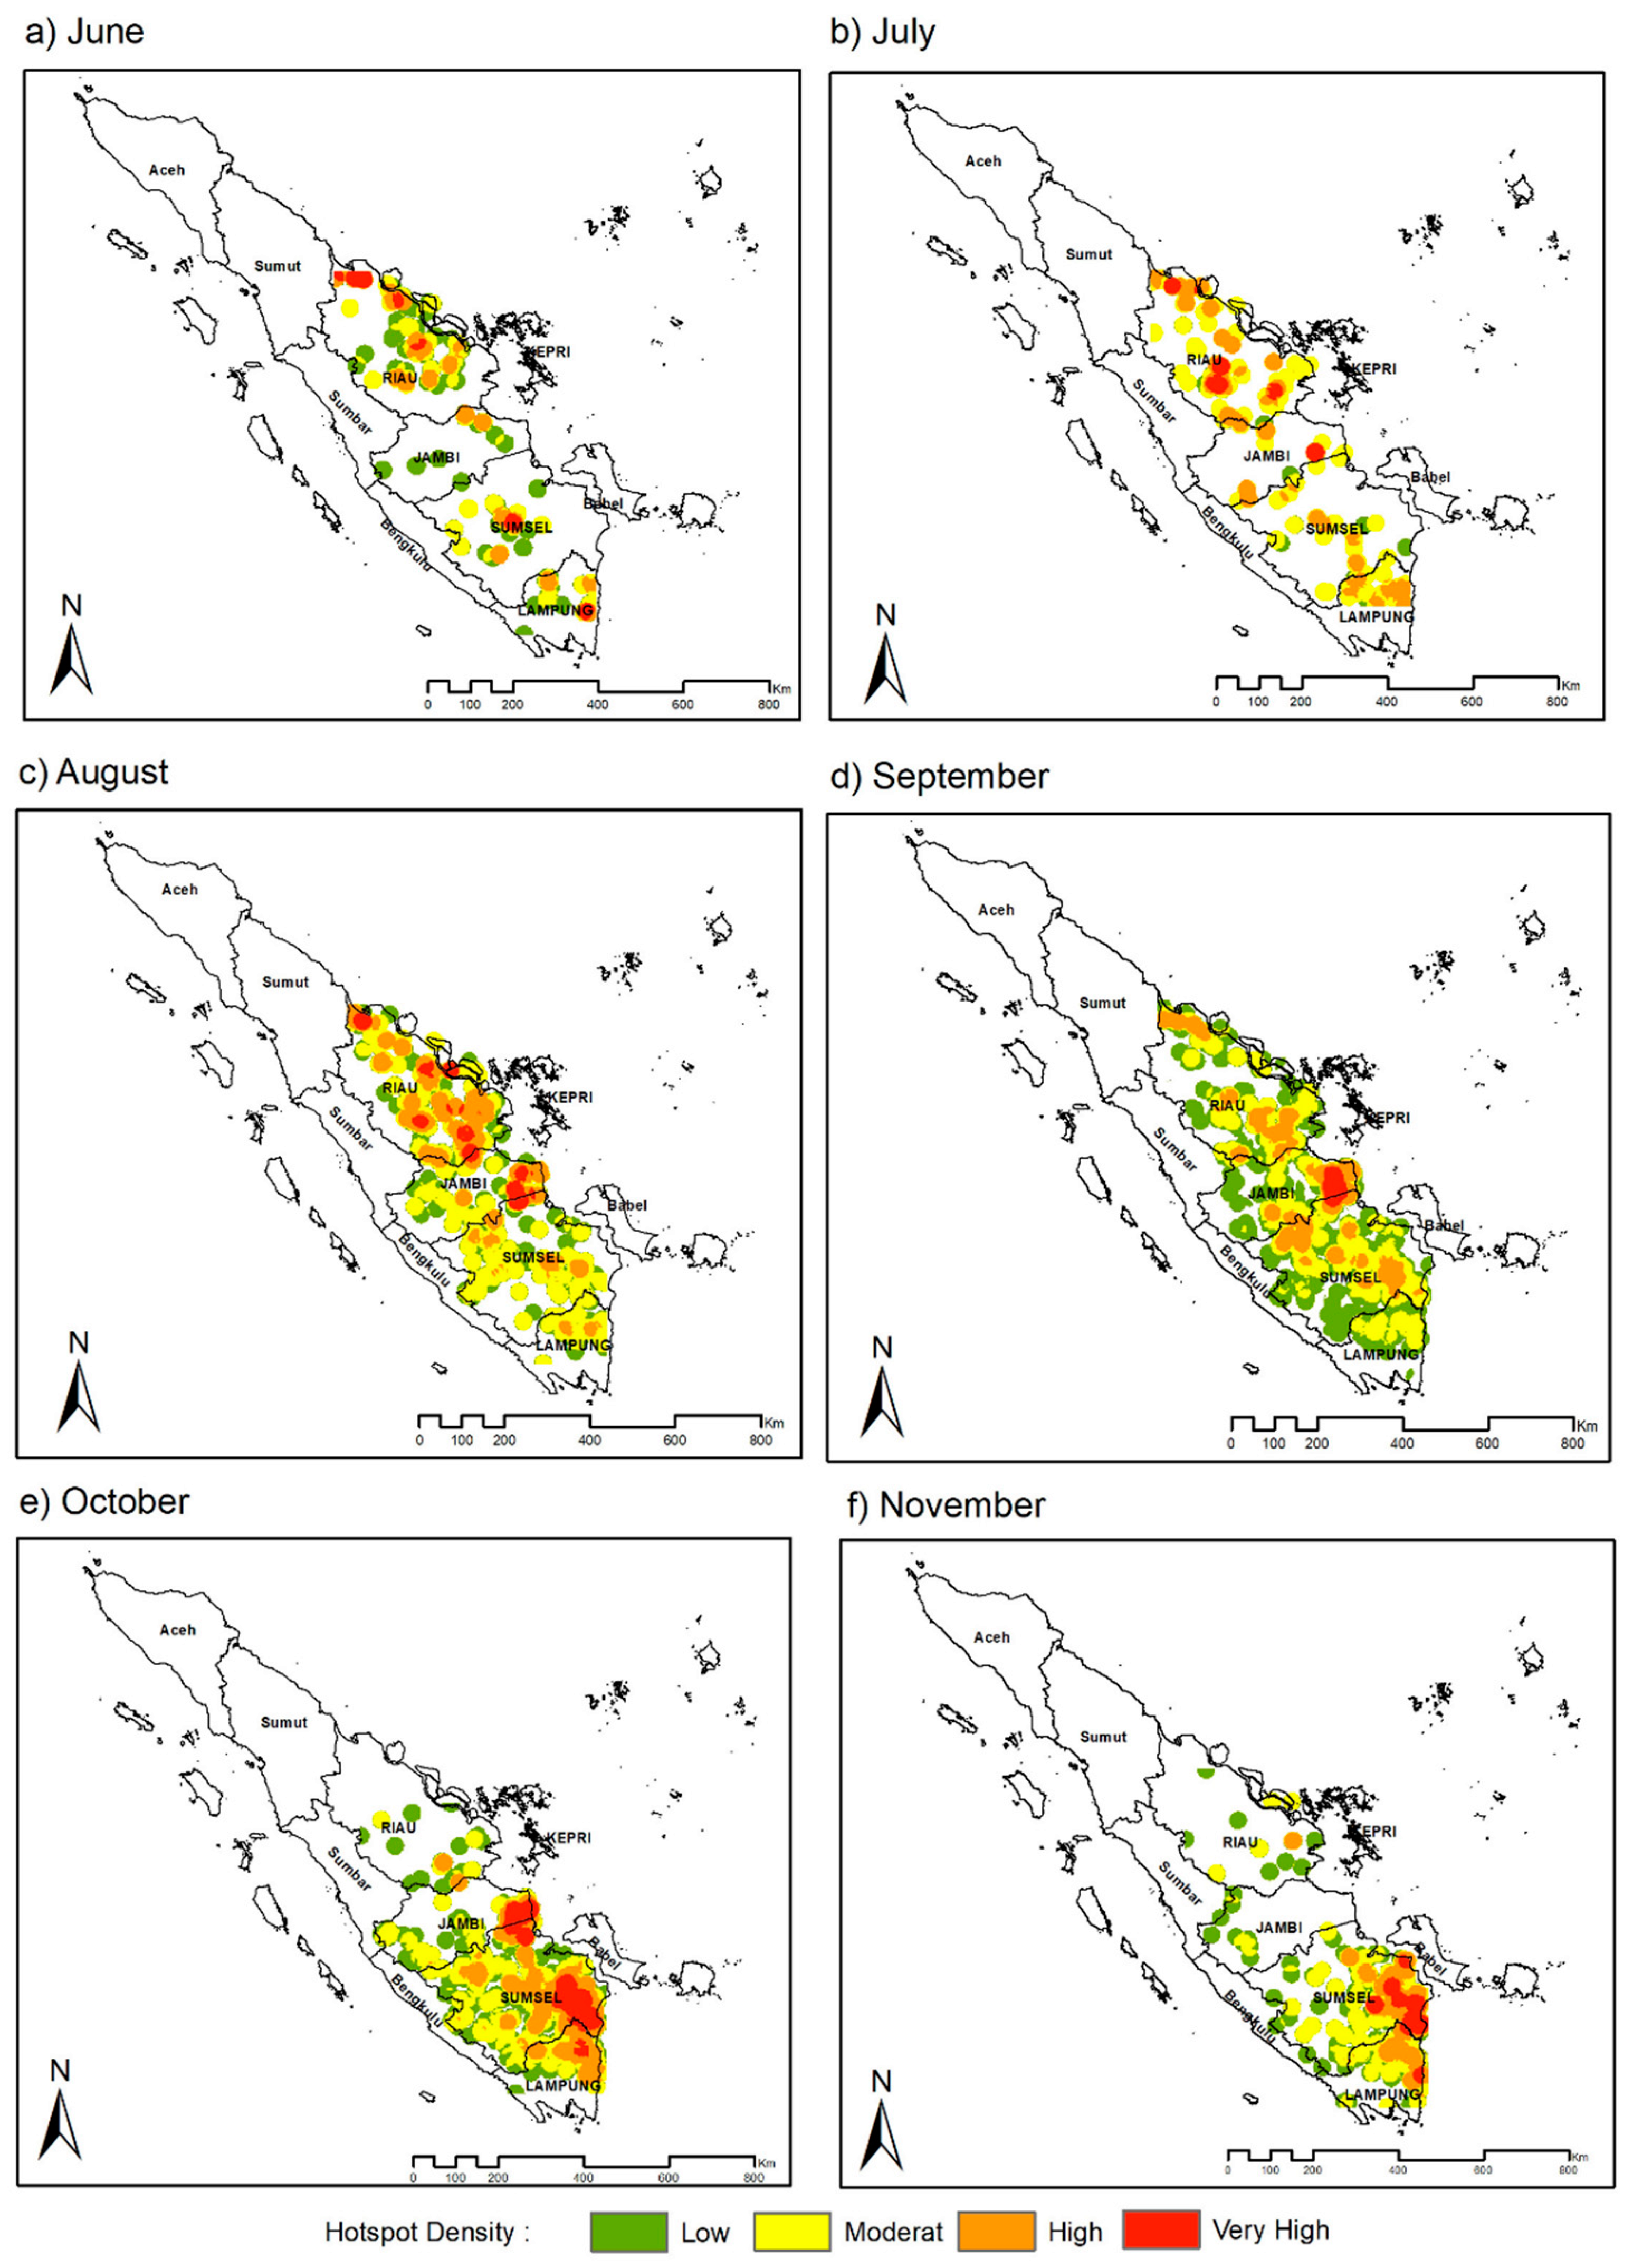
It has been suggested that the deficit precipitation associated with climate modes in the Indo-Pacific region causes forest-peat fires in Sumatra and Kalimantan islands [32,33]. We evaluated the forest-peat fires in southeastern Sumatra, where the highest and continuous deficit precipitation was observed. Figure 8 shows the hotspot density during the evolution of the 2019 extreme IOD from July to November. Note that a point density analysis has been used to calculate the frequency of data points (number of hotspots) within a specific cell. In this study, we defined a cell of 1 km2 and calculated the number of hotspots within the radius of 10 km. The output of hotspot density is categorized into four levels, namely low, moderate, high, and very high.
The distribution of hotspots was found to reflect the spread of precipitation (Figure 8). Higher hotspot density was mostly detected in the central-east of Sumatra in July, where there was a deficiency of precipitation. The hotspots were identified in all parts of southeastern Sumatra as the shortfall precipitation spreads more broadly in August-September. The number of hotspots varied across the region, with higher density in August in the northern section and then a slight shift to the middle area in September. Deficit precipitation was noted throughout the southern section of Sumatra during the peak of IOD in October and November. As a result, the hotspots were more concentrated in the south, with the highest density in the southeast. Note that the southeastern area of Sumatra is mostly the peat area [8].
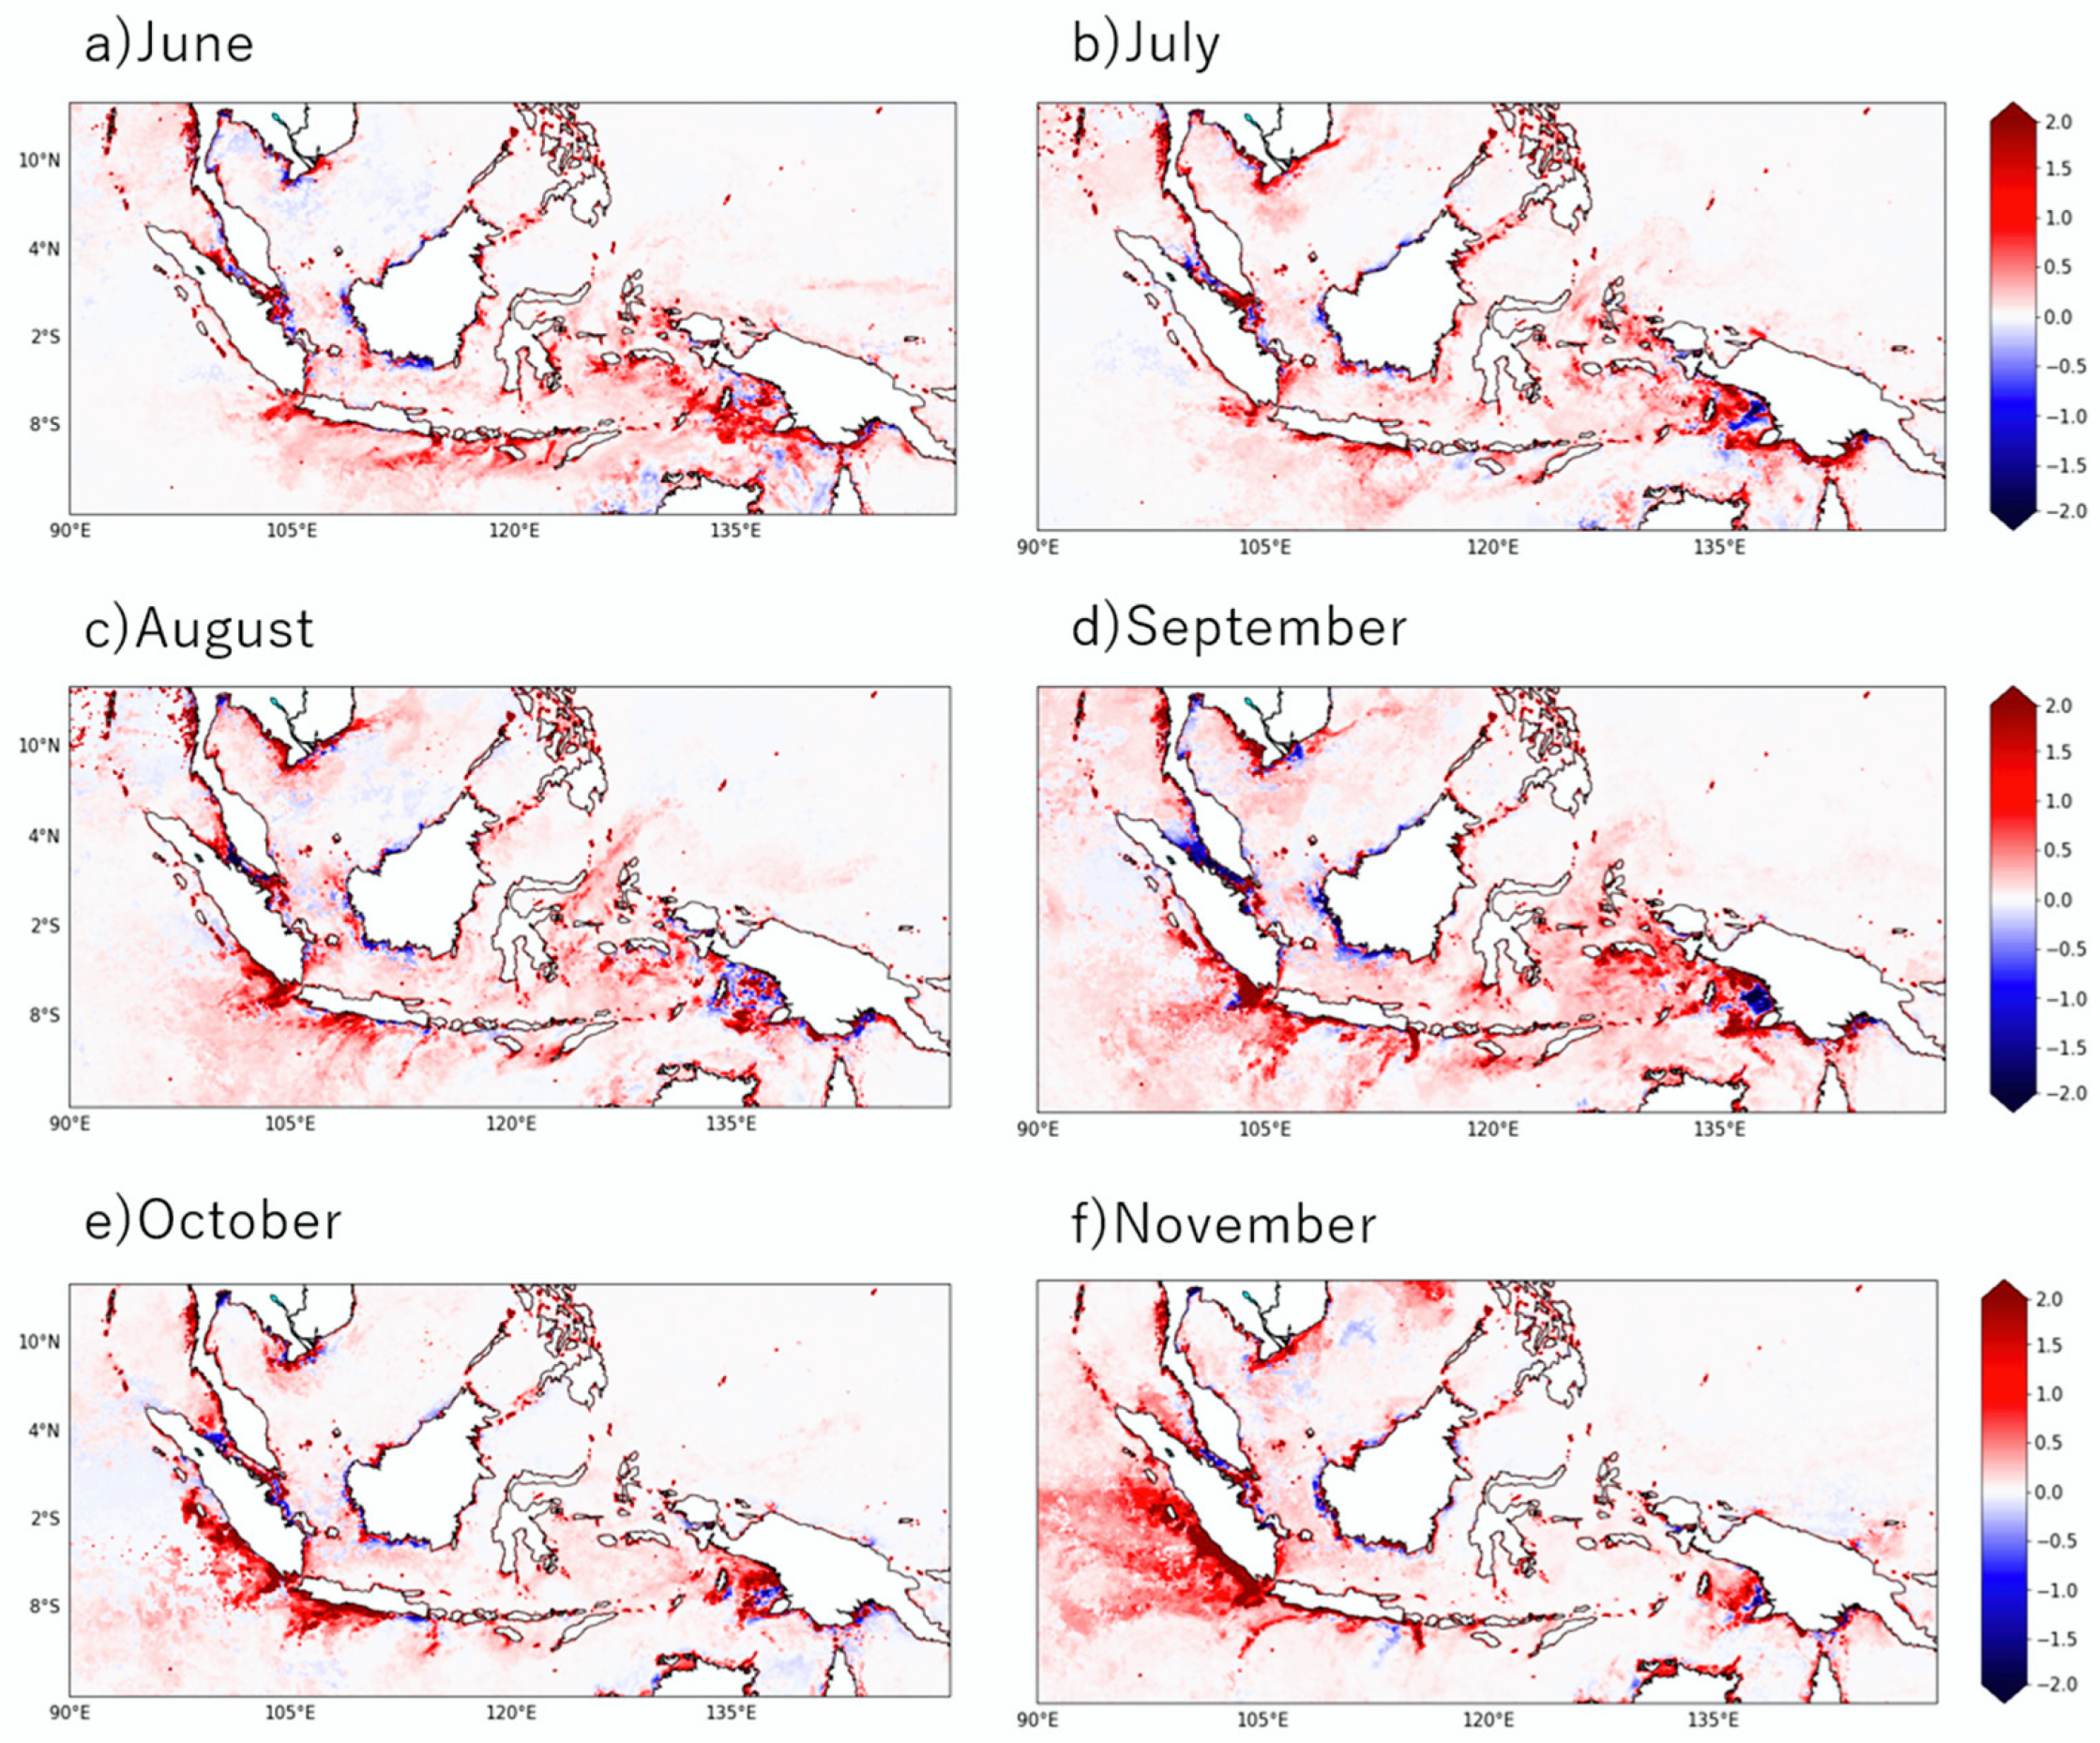
The 2019 extreme IOD event was also associated with anomalously strong upwelling within most Indonesian seas, particularly along the southern coast of Java and Sumatra. This anomalously strong upwelling has been suggested to enhance surface Chl-a within the Indonesian seas [19,34]. Anomalously high Chl-a concentration was observed in the Indonesian seas during the evolution of IOD (Figure 9). A high Chl-a concentration was mainly found in the upwelling area off south Java and Sumatra. The highest concentration was observed off of southwestern Sumatra and the southern coast of West Java in October and November when the IOD reached its peak phase. High Chl-a concentration was also found in the Banda Sea, Maluku Sea, Halmahera Sea, and southern Makassar Strait. These high Chl-a concentrations highlighted the occurrence of strong upwelling associated with the 2019 extreme IOD event.

4. Conclusions

Based on remotely sensed and reanalyzed data, this study assessed the evolution of the 2019 extreme positive IOD event. Based on the DMI time series, it shows that the 2019 IOD event was the strongest (highest value was +2.74 °C) and longest (from mid-July to mid-December) in the recent two decades (Figure 1a). Without the development of El Niño in the tropical Pacific Ocean, the 2019 extreme IOD event was classified as a pure event (Figure 1b). Furthermore, the spatial patterns of SST and surface wind anomalies also clearly presented a typical positive IOD pattern (Figure 2). Negative (positive) SST anomalies were found in the southeastern (western) tropical Indian Ocean, and the southeasterly and easterly winds prevailed over the eastern tropical Indian Ocean. As a response of the ocean to the surface wind anomalies, equatorial waves (off-equatorial Rossby waves and equatorial Kelvin waves) were also generated, highlighting the importance of ocean dynamics in the formation of the 2019 extreme IOD (Figure 3).
The 2019 extreme IOD event dramatically influenced precipitation over the Indonesian region (Figure 7). Deficit precipitation during 2019 led to a drier condition in Indonesia, thus providing favorable conditions for forest-peat fires. Severe forest-peat fires have been observed over the southeastern Sumatra region, causing a spread of hazes over the region and surrounding area. The highest hotspot density was observed in the south of Sumatra, where there are mostly peat areas (Figure 8) [8]. Furthermore, as a consequence of the anomalously strong upwelling associated with anomalously strong southeasterly winds, surface Chl-a concentration in the Indonesian seas was enhanced (Figure 9). The highest Chl-a concentrations were found in the upwelling regions, particularly off of southwestern Sumatra and south Java.

Author Contributions

Conceptualization, I.I., W.M.; methodology, I.I., R.D.S.; software, I.I., D.O.L., A.D.S.; validation, W.M., M.I., R., A.W.; formal analysis, I.I.; investigation, I.I., R.Y.S.; resources, I.I., D.O.L., A.D.S., M.I., R.; data curation, I.I., W.M., A.D.S.; writing—original draft preparation, I.I.; writing—review and editing, R.Y.S., A.W., R.D.S., J.D.S., K.; visualization, I.I., D.O.L., A.D.S.; supervision, R.D.S.; project administration, W.M.; funding acquisition, I.I., W.M. All authors have read and agreed to the published version of the manuscript.

Funding

This research was funded by the Ministry of Education, Culture, Research and Technology, Republic of Indonesia under the “Penelitian Dasar Unggulan Perguruan Tinggi (PDUPT) 2022 Number: 057/E5/PG.02.00.PT/2022” and the “Penelitian Unggulan Profesi” University of Sriwijaya 2022 research grants. R.D.S is supported by NASA grant#80NSSC18K0777 through the University of Maryland, College Park, USA and Adjunct Professor Program, WCU Diponegoro University 2022.

Institutional Review Board Statement

Not applicable.

Informed Consent Statement

Not applicable.

Data Availability Statement

The data presented in this study are open and freely available. The SST data are available at http://www.ncdc.noaa.gov/oa/climate/research/sst/ (accessed on 22 November 2021), the ECMWF wind data are available at http://apdrc.soest.hawaii.edu (accessed on 15 November 2021). The SSH data are obtained from https://psl.noaa.gov/data/gridded/data.godas.html (accessed on 11 November 2021). OSCAR data are available at https://podaac.jpl.nasa.gov/dataset/OSCAR_L4_OC_third-deg (accessed on 5 November 2021) Daily precipitation CPC data are available at https://psl.noaa.gov/data/gridded/data.cpc.globalprecip.html (accessed on 10 November 2021) Hotspot data from FIRMS are available at https://earthdata.nasa.gov/earth-observation-data/near-real-time/firms (accessed on 24 November 2021). Chlorophyll-a data are available at https://oceancolor.gsfc.nasa.gov/cgi/l3 (accessed on 1 September 2021).

Acknowledgments

Part of this research is supported by the University of Sriwijaya under the “Penelitian Unggulan Profesi 2022” and the Ministry of Education, Culture, Research and Technology, Republik of Indonesia under the “Penelitian Dasar Unggulan Perguruan Tinggi (PDUPT) 2022 (057/E5/PG.02.00.PT/2022) research grants. A.W. is supported by Universitas Diponegoro under the scheme of High reputation of International Publication Research with grant number 185-98/UN7.6.1/PP/2022. We thank Eko Siswanto (JAMSTEC) for processing the surface Chl-a data. We thank the anonymous reviewers for the critical and useful comments.

Conflicts of Interest

The authors declare no conflict of interest. The funders had no involvement in the study’s design, data collection, analysis, or interpretation, manuscript writing, or the decision to publish the findings.

References

  1. Saji, N.H.; Goswami, B.N.; Vinayachandran, P.N.; Yamagata, T. A dipole mode in the tropical Indian Ocean. Nature 1999, 401, 360–363. [Google Scholar] [CrossRef] [PubMed]
  2. Webster, P.J.; Moore, A.; Loschnigg, J.P.; Leben, R.R. Coupled ocean-atmosphere dynamics in the Indian Ocean during 1997–1998. Nature 1999, 401, 356–360. [Google Scholar] [CrossRef] [PubMed]
  3. Murtugudde, R.; McCreary, J.P.; Busalacchi, A.J. Oceanic processes associated with anomalous events in the Indian Ocean with relevance to 1997-1998. J. Geophys. Res. Earth Surf. 2000, 105, 3295–3306. [Google Scholar] [CrossRef] [Green Version]
  4. Yamagata, T.; Behera, S.K.; Luo, J.; Masson, S.; Jury, M.R.; Rao, S.A. Coupled ocean-atmosphere variability in the tropical Indian Ocean. Geophys. Monogr. Ser. 2004, 147, 189–211. [Google Scholar] [CrossRef]
  5. McPhaden, M.J.; Nagura, M. Indian Ocean dipole interpreted in terms of recharge oscillator theory. Clim. Dyn. 2014, 42, 1569–1586. [Google Scholar] [CrossRef]
  6. Sahu, N.; Behera, S.K.; Yamashiki, Y.; Takara, K.; Yamagata, T. IOD and ENSO impacts on the extreme stream-flows of Citarum river in Indonesia. Clim. Dyn. 2012, 39, 1673–1680. [Google Scholar] [CrossRef]
  7. Sahu, N.; Robertson, A.W.; Boer, R.; Behera, S.; DeWitt, D.G.; Takara, K.; Kumar, M.; Singh, R.B. Probabilistic seasonal streamflow forecasts of the Citarum River, Indonesia, based on general circulation models. Stoch. Environ. Res. Risk Assess 2017, 31, 1747–1758. [Google Scholar] [CrossRef]
  8. Putra, R.; Sutriyono, E.; Kadir, S.; Iskandar, I.; Lestari, D.O. Dynamical link of peat fires in South Sumatra and the climate modes in the Indo-Pacific region. Indones. J. Geogr. 2019, 51, 18–22. [Google Scholar] [CrossRef] [Green Version]
  9. Pan, X.; Chin, M.; Ichoku, C.M.; Field, R.D. Connecting Indonesian Fires and Drought With the Type of El Niño and Phase of the Indian Ocean Dipole During 1979–2016. J. Geophys. Res. Atmos. 2018, 123, 7974–7988. [Google Scholar] [CrossRef]
  10. Cai, W.; Cowan, T.; Raupach, M. Positive Indian Ocean Dipole events precondition southeast Australia bushfires. Geophys. Res. Lett. 2009, 36, L19710. [Google Scholar] [CrossRef]
  11. Wang, G.; Cai, W. Two-year consecutive concurrences of positive Indian Ocean Dipole and Central Pacific El Niño preconditioned the 2019/2020 Australian “black summer” bushfires. Geosci. Lett. 2020, 7, 19. [Google Scholar] [CrossRef]
  12. Ratna, S.B.; Cherchi, A.; Osborn, T.J.; Joshi, M.; Uppara, U. The Extreme Positive Indian Ocean Dipole of 2019 and Associated Indian Summer Monsoon Rainfall Response. Geophys. Res. Lett. 2021, 48, e2020GL091497. [Google Scholar] [CrossRef]
  13. Shi, W.; Wang, M. A biological Indian Ocean Dipole event in 2019. Sci. Rep. 2021, 11, 2452. [Google Scholar] [CrossRef] [PubMed]
  14. Du, Y.; Zhang, Y.; Zhang, L.Y.; Tozuka, T.; Ng, B.; Cai, W. Thermocline Warming Induced Extreme Indian Ocean Dipole in 2019. Geophys. Res. Lett. 2020, 47, e2020GL090079. [Google Scholar] [CrossRef]
  15. Lu, B.; Ren, H.L. What Caused the Extreme Indian Ocean Dipole Event in 2019? Geophys. Res. Lett. 2020, 47, e2020GL087768. [Google Scholar] [CrossRef]
  16. Wang, G.; Cai, W.; Yang, K.; Santoso, A.; Yamagata, T. A Unique Feature of the 2019 Extreme Positive Indian Ocean Dipole Event. Geophys. Res. Lett. 2020, 47, e2020GL088615. [Google Scholar] [CrossRef]
  17. Aparna, A.R.; Girishkumar, M.S. Mixed layer heat budget in the eastern equatorial Indian Ocean during the two consecutive positive Indian Ocean dipole events in 2018 and 2019. Clim. Dyn. 2022, 58, 3297–3315. [Google Scholar] [CrossRef]
  18. Giglio, L.; Schroeder, W.; Hall, J.V.; Justice, C.O. MODIS Collection 4 Active Fire Product Use’ s Guide Table of Contents; Revisión B; Science Systems and Applications, Inc.: Lanham, MD, USA, 2018; Volume 1. [Google Scholar]
  19. Sari, Q.W.; Utari, P.A.; Setiabudidaya, D.; Yustian, I.; Siswanto, E.; Iskandar, I. Surface chlorophyll-a variations in the Southeastern Tropical Indian Ocean during various types of the positive Indian Ocean Dipole events. Int. J. Remote Sens. 2020, 41, 171–184. [Google Scholar] [CrossRef]
  20. Wirasatriya, A.; Setiawan, R.Y.; Subardjo, P. The Effect of ENSO on the Variability of Chlorophyll-a and Sea Surface Temperature in the Maluku Sea. IEEE J. Sel. Top. Appl. Earth Obs. Remote Sens. 2017, 10, 5513–5518. [Google Scholar] [CrossRef]
  21. Trenberth, K.E. The Definition of El Niño. Bull. Am. Meteorol. Soc. 1997, 78, 2771–2777. [Google Scholar] [CrossRef]
  22. Horii, T.; Hase, H.; Ueki, I.; Masumoto, Y. Oceanic precondition and evolution of the 2006 Indian Ocean dipole. Geophys. Res. Lett. 2008, 35, 1–6. [Google Scholar] [CrossRef]
  23. Iskandar, I.; Nagura, M.; McPhaden, M.J. Role of the eastern boundary-generated waves on the termination of 1997 Indian Ocean Dipole event. Geosci. Lett. 2021, 8, 35. [Google Scholar] [CrossRef]
  24. Rao, S.A.; Behera, S.K.; Masumoto, Y.; Yamagata, T. Interannual subsurface variability in the tropical Indian Ocean with a special emphasis on the Indian Ocean Dipole. Deep. Res. Part II Top. Stud. Oceanogr. 2002, 49, 1549–1572. [Google Scholar] [CrossRef]
  25. Feng, M.; Meyers, G. Interannual variability in the tropical Indian Ocean: A two-year time-scale of Indian Ocean Dipole. Deep. Res. Part II Top. Stud. Oceanogr. 2003, 50, 2263–2284. [Google Scholar] [CrossRef] [Green Version]
  26. Vinayachandran, P.N.; Iizuka, S.; Yamagata, T. Indian Ocean dipole mode events in an ocean general circulation model. Deep. Res. Part II Top. Stud. Oceanogr. 2002, 49, 1573–1596. [Google Scholar] [CrossRef]
  27. Vinayachandran, P.N.; Kurian, J.; Neema, C.P. Indian Ocean response to anomalous conditions in 2006. Geophys. Res. Lett. 2007, 34, 1–6. [Google Scholar] [CrossRef]
  28. Aldrian, E.; Susanto, R.D. Identification of three dominant rainfall regions within Indonesia and their relationship to sea surface temperature. Int. J. Climatol. 2003, 23, 1435–1452. [Google Scholar] [CrossRef]
  29. Utari, P.A.; Khakim, M.Y.N.; Setiabudidaya, D.; Iskandar, I. Dynamics of 2015 positive Indian Ocean Dipole. J. South. Hemisph. Earth Syst. Sci. 2019, 69, 75. [Google Scholar] [CrossRef]
  30. Lestari, D.O.; Sutriyono, E.; Sabaruddin, S.; Iskandar, I. Respective Influences of Indian Ocean Dipole and El Niño-Southern Oscillation on Indonesian Precipitation. J. Math. Fundam. Sci. 2018, 50, 257–272. [Google Scholar] [CrossRef] [Green Version]
  31. Lee, H. General Rainfall Patterns in Indonesia and the Potential Impacts of Local Seas on Rainfall Intensity. Water 2015, 7, 1751–1768. [Google Scholar] [CrossRef]
  32. Huijnen, V.; Wooster, M.J.; Kaiser, J.W.; Gaveau, D.L.A.; Flemming, J.; Parrington, M.; Inness, A.; Murdiyarso, D.; Main, B.; Van Weele, M. Fire carbon emissions over maritime southeast Asia in 2015 largest since 1997. Sci. Rep. 2016, 6, 26886. [Google Scholar] [CrossRef] [PubMed]
  33. Wooster, M.J.; Perry, G.L.W.; Zoumas, A. Fire, drought and El Niño relationships on Borneo (Southeast Asia) in the pre-MODIS era (1980–2000). Biogeosciences 2012, 9, 317–340. [Google Scholar] [CrossRef] [Green Version]
  34. Iskandar, I.; Rao, S.A.; Tozuka, T. Chlorophyll-a bloom along the southern coasts of Java and Sumatra during 2006. Int. J. Remote Sens. 2009, 30, 663–671. [Google Scholar] [CrossRef]
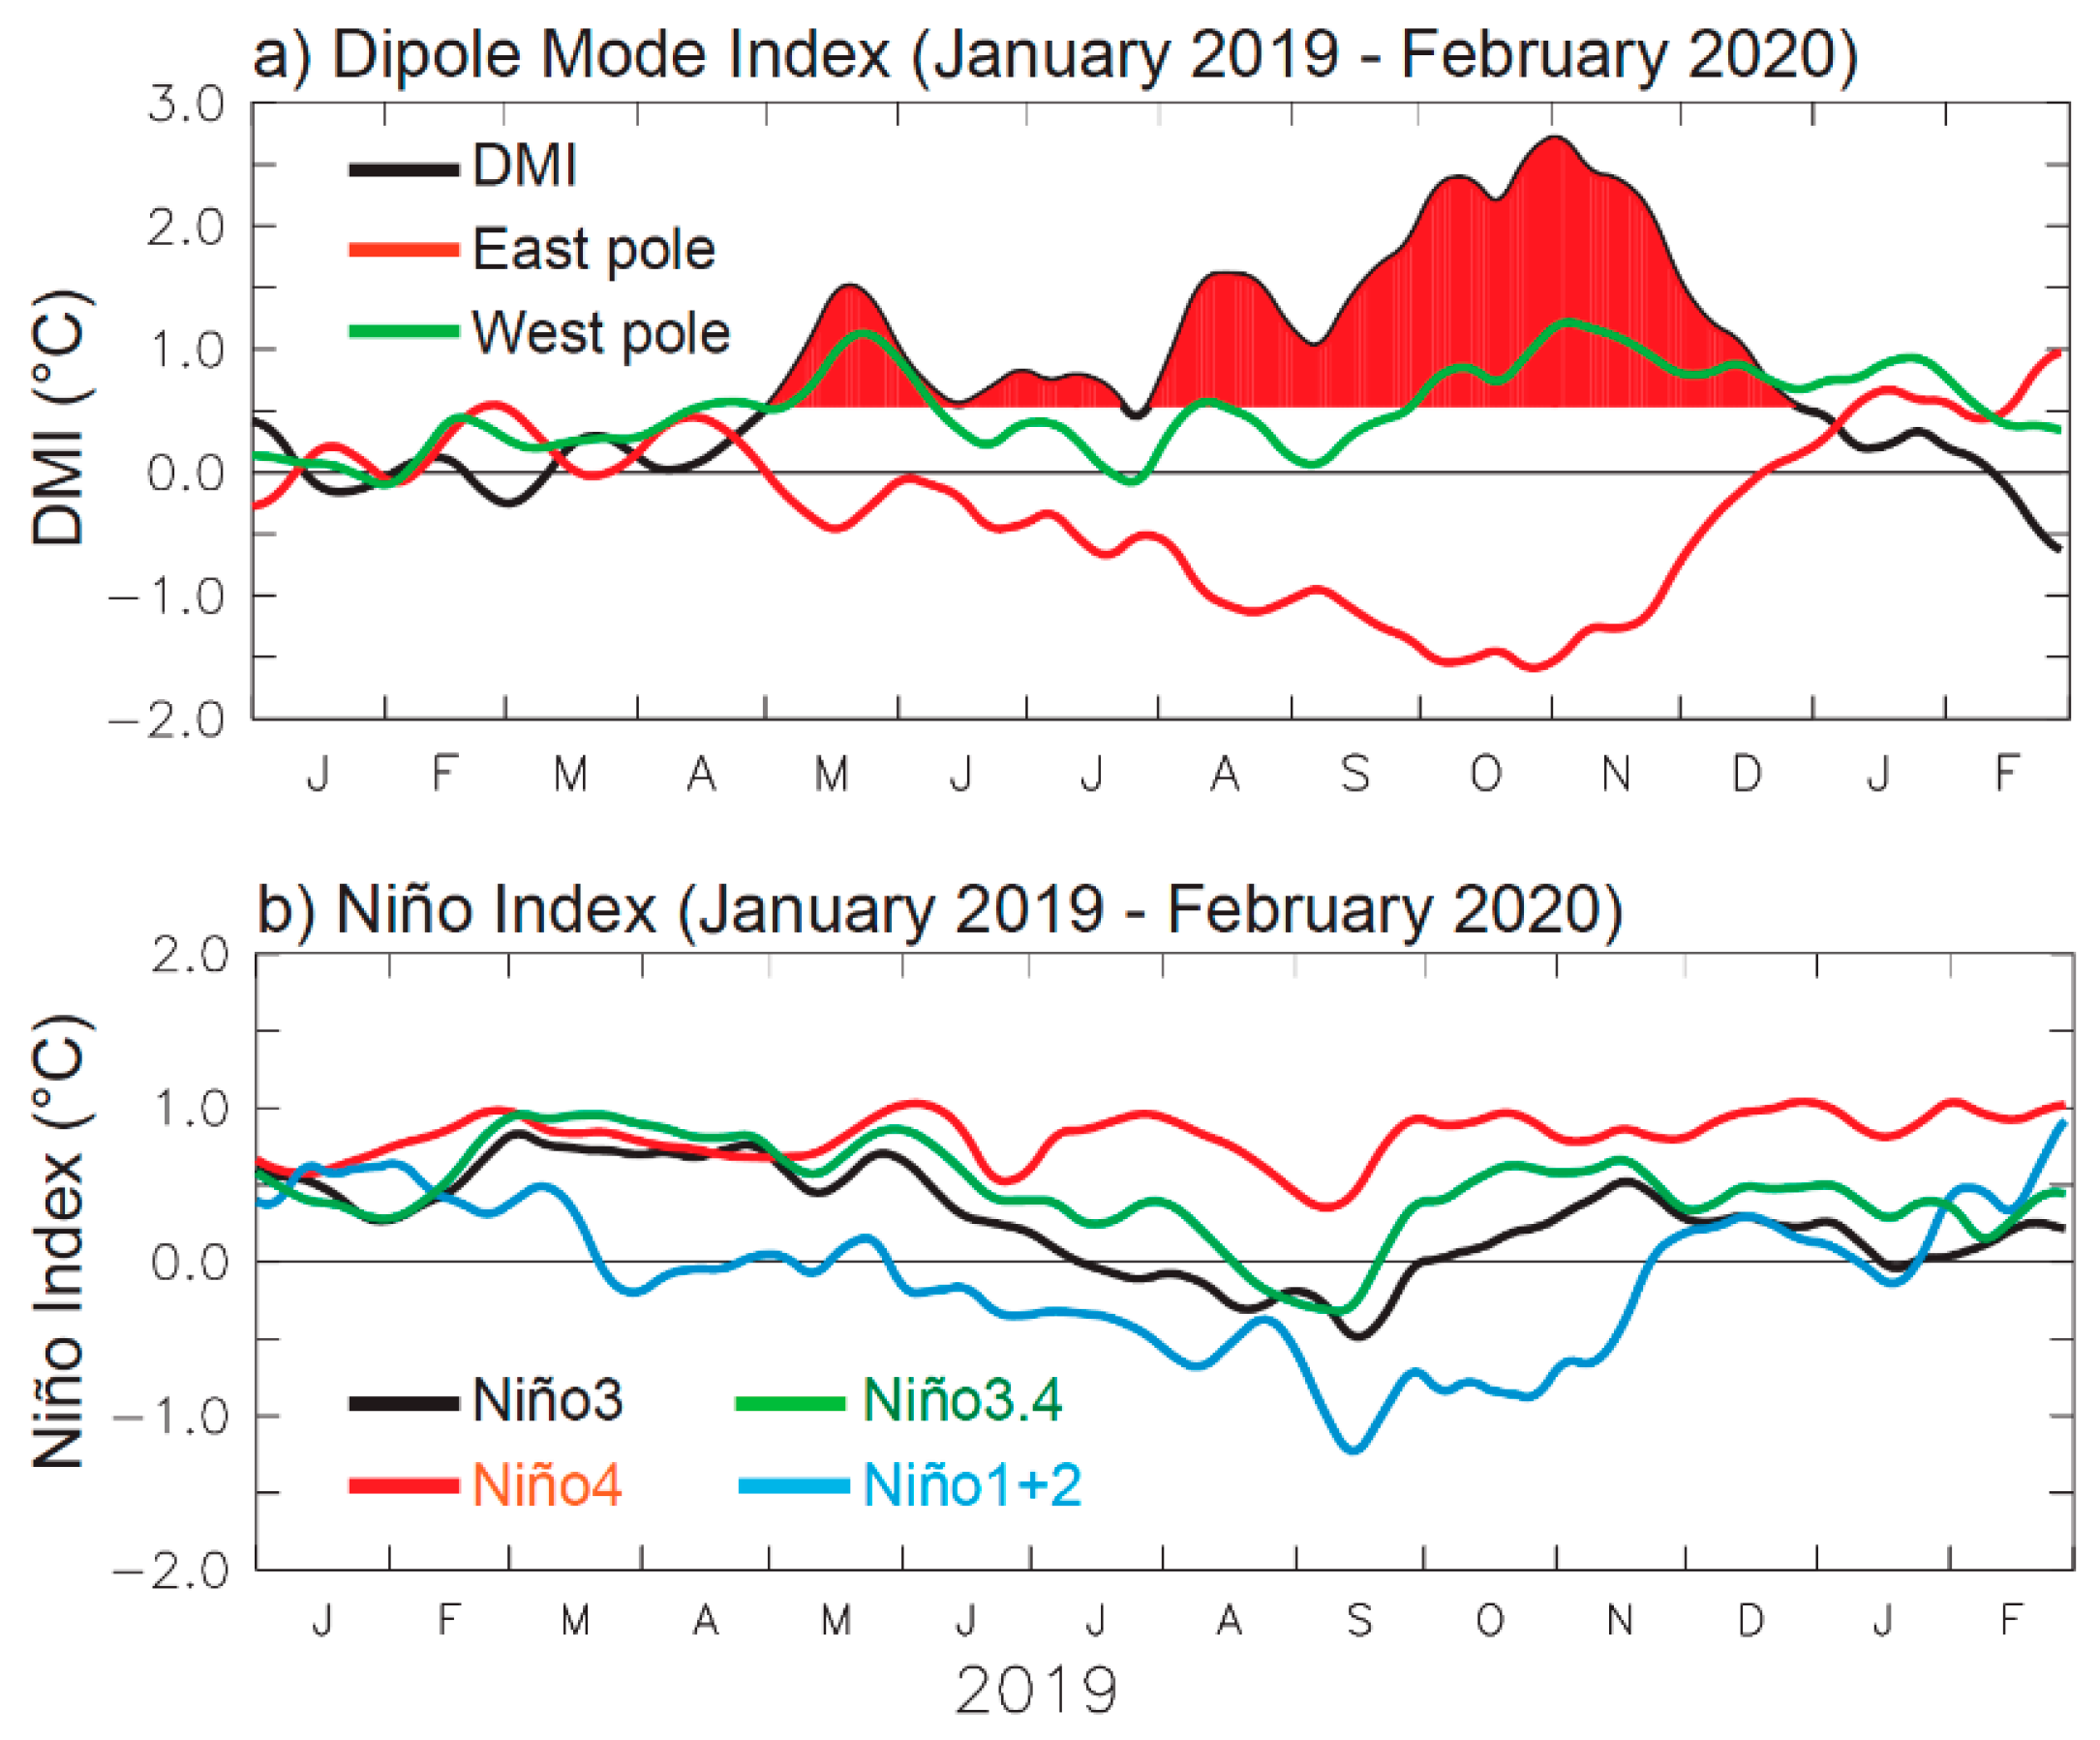
Figure 1. Time series of (a) Dipole Mode Index (black), eastern (red), and western (green) poles indices; and (b) Niño indices from January 2019–February 2020. Note that the red shading area indicates the DMI value above one standard deviation.
Sustainability 14 15155 g001
Figure 2. Monthly sea surface temperature anomalies (°C—shading) and surface wind stress anomalies (N/m2vector) during May–December 2019. Unit vector for the wind stress is 6 × 10⁻² N/m2.
Sustainability 14 15155 g002
Figure 3. Monthly sea surface height anomalies (m—shading) and surface current anomalies (m/s—vector) during July–December 2019. Unit vector is 0.7 m/s.
Sustainability 14 15155 g003
Figure 4. Time series of (a) Dipole Mode Index, (b) southeastern pole index, and (c) western pole index from three positive IOD events in 1994 (green), 2006 (red) and 2019 (black).
Sustainability 14 15155 g004
Figure 5. Seasonally-averaged SST (shading) and surface wind stress (vector) anomalies during boreal summer (JJA) and boreal fall (SON) of 1994 (a,b), 2006 (c,d), and 2019 (e,f).
Sustainability 14 15155 g005
Figure 6. Anomalous Walker circulation across the tropical Indian Ocean as far as the western Pacific Ocean averaged between 10° S and 10° N during boreal fall (SON) of (a) 1994, (b) 2006, and (c) 2019 positive IOD events.
Sustainability 14 15155 g006
Figure 7. Monthly precipitation anomalies (mm/day) from June to November 2019.
Sustainability 14 15155 g007
Figure 8. Hospots density (km2) observed over the southeastern part of Sumatra during July–November 2019.
Sustainability 14 15155 g008
Figure 9. Monthly anomaly of the surface chlorophyll-a concentration (mg m−3) within the Indonesian seas during June–November 2019.
Sustainability 14 15155 g009
Publisher’s Note: MDPI stays neutral with regard to jurisdictional claims in published maps and institutional affiliations.