Abstract
Predicting flight delays has been a major research topic in the past few decades. Various machine learning algorithms have been used to predict flight delays in short-range horizons (e.g., a few hours or days prior to operation). Airlines have to develop flight schedules several months in advance; thus, predicting flight delays at the strategic stage is critical for airport slot allocation and airlines’ operation. However, less work has been dedicated to predicting flight delays at the strategic phase. This paper proposes machine learning methods to predict the distributions of delays. Three metrics are developed to evaluate the performance of the algorithms. Empirical data from Guangzhou Baiyun International Airport are used to validate the methods. Computational results show that the prediction accuracy of departure delay at the 0.65 confidence level and the arrival delay at the 0.50 confidence level can reach 0.80 without the input of ATFM delay. Our work provides an alternative tool for airports and airlines managers for estimating flight delays at the strategic phase.
1. Introduction
Air transport demand has been increasing continuously before the coronavirus pandemic. The number of flights performed in mainland China by passenger airlines reached 4.611 million in 2019, which is 6.1% higher than the previous year. The on-time performance has been improved as well. The punctuality in 2019 is 81.65%, while the average flight delay is 14 min per flight [1]. Although the coronavirus pandemic has brought a huge impact on the air transport industry, it is foreseen that air traffic would recover quickly when the pandemic ends. Nevertheless, air transport demand at most busy airports will exceed airport capacity due to slow improvement in airport capacity. Thus, demand and capacity management is still one of the most important issues in the air transportation field.
Slot allocation is an effective means of airport demand-capacity management [2,3]. A slot is defined as the right given to an air carrier to use all the infrastructure and services within the airport at a specific date and time. The slot coordinator or slot coordination department will allocate slots to the airlines under the guidance of certain rules given airlines’ slot requests and the declared capacity of the airport. The Worldwide Airport Slot Guidelines (WASG) issued by the International Air Transport Association (IATA) is a fundamental regulatory reference for most countries. The slot allocation process takes place twice a year, namely the summer season and the winter season [4]. The summer season starts on the last Saturday in March of the calendar year, and it ends on the Saturday before the last Sunday in October of the following year, while the winter season is from the Saturday before the last Sunday of October of the calendar year to the last Sunday of March of the following year. Airlines generate flight schedules based on the allocated slots to provide air transport services to customers. The flight schedule, which is up to several months prior to the day of the flight operation, is mainly based on the allocated airport slots. This flight schedule submitted by the airline after the slot allocation is also known as the strategic flight schedule. The strategic flight schedule is generally in the form of a series of scheduled arrival and departure operations. For example, flight CA1365 is scheduled to operate at 4 p.m. every day from Monday to Sunday, taking off from Beijing Capital International Airport (IATA code: PEK) and landing at Guangzhou Baiyun International Airport (IATA code: CAN), using the Airbus A330 aircraft.
Much research effort has been devoted to the optimization of slot allocation, which generally aims to minimize displacements to airline’s slot requests [5]. In [2], the authors present an extensive review of the current slot allocation models and practices. They classified the models into two categories: single airport slot allocation optimization model and network-wide slot allocation optimization model. A single airport slot allocation optimization model, with the goal of minimizing the displacements between the airlines’ slot requests, is developed in [3]. The testing results at several airports in Europe show that fewer interventions could achieve the optimal allocation of slots with such an optimization model. In practice, airlines have to obtain at least one departure slot at the origin airport and one landing slot at the destination airport to operate a flight. Sometimes, an airline may have to negotiate with other airlines or slot coordinators to swap/adjust the allocated slot to match the origin airport slot. An integer linear programming model is developed in [6] to study slot allocation at all airports in Europe, considering all the constraints in a single slot allocation model as well as flying time constraints. Both single airport slot allocation and network-wide slot allocation ensure that the number of scheduled flights per unit of time does not exceed the airport declared capacity. There would be no delay if the flights departed or arrived at their scheduled slots. However, flights often experience arrival/departure delays during the day of the operation due to uncertainties such as weather, aircraft maintenance, and passengers. The currently published strategic flight schedules do not provide information on the potential flight delays that may occur.
Over the past years, there are extensive studies on flight delays from various perspectives, including modeling and measuring delay propagation [7,8,9,10] and predicting flight delays [11,12,13,14]. Of particular interest is predicting flight delays using machine learning techniques. A recent study [15] presents a review of flight delay prediction works. The commonly investigated methods include decision tree, Bayesian learning, neural networks, support vector machines, and random forest [16,17,18]. One group of studies aims to predict the values of flight delay. For instance, a reinforcement learning algorithm is developed to predict the average airport delay time. The algorithm is tested with data from the New York John F. Kennedy Airport (JFK). The results show that if the accuracy is set within the ±5 min range, the prediction accuracy can achieve 60% approximately [19]. To account for the importance of weather in affecting flight delays, a prediction model that estimates airport delays using data from weather forecast products is developed in [20]. In [21], the authors propose a random forest algorithm to predict flight departure delay in the air traffic network. The most delayed network connections (i.e., origin–destination airport pair) are selected for testing. The results show that the average regression test error achieves 19% for a 2 h prediction horizon with a 60 min delay threshold. The second group of studies aims to predict the levels of flight delays. This group of studies is also known as delay classification prediction. For example, the authors uses recurrent neural networks to classify delays at several airports [16]. The performance of the model at the network level would be enhanced if one uses a deeper network architecture. The work in [17] combines the multi-label random forest classification algorithm and the approximate delay propagation model to improve the prediction performance.
Although machine learning methods are extensively used in flight delay prediction, most of the works focus on short-range flight delay prediction, from a few hours to a few days (see Figure 1). The common purpose of predicting tactical/pre-tactical flight delays is to support the preparation and implementation of traffic flow management initiatives, such as Ground Delay Programs, Mile-In-Trail restrictions, etc. Little work has been conducted to predict flight delay at the strategic stage. Of course, the needs for predicting flight delays at the strategic level are different from the former two. One possible application of strategic flight delay prediction is to assess the quality of flight schedule. Airlines and airports may need that information to develop strategic plans for preparing their resources in reaction to severe flight delays. For example, additional staff would be scheduled in a particular time because those frequent long-time flight delays were predicted. An urgent need for strategic flight delay prediction is the setting of airport declared capacity. As discussed above, great efforts have been devoted to optimizing slot allocation under the assumption that the airport declared capacity is determined (i.e., how flights can be scheduled in one time unit). In fact, setting airport declared capacity is challenging due to unresolved issues [22]. Setting a higher declared capacity can schedule more flights, but it may result in frequent flight delays because of low operation capacity. Setting lower declared capacity can provide high on-time performance, but it may waste scarce airport capacity. The prediction of flight delays at the strategic level can provide support to decision makers to choose airport declared capacity.

Figure 1.
The classification of predication of flight delay.
We note that the work in [23] develops a machine learning approach to predict flight delays and cancellations in the strategic phase (6 months prior to the day of the operation) using features from the strategic flight schedule. The machine learning algorithms, LightGBM, multilayer perceptron (MLP), and random forest (RF), were tested with the data from London Heathrow Airport. Among many input features of the model, the arrival Air Traffic Flow Management (ATFM) delay deserves further debate. ATFM delay is defined as “the duration between the last Estimated Take-Off Time (ETOT) and the Calculated Take-Off Time (CTOT) allocated by the Network Manager” [24]. Thus, predicting flight delay requires calculating the CTOT, which is estimated from software (Network Manager). As expected, the overall prediction accuracy varies between 0.75 and 0.79 depending on the machine learning algorithms. The recall is around 0.5. Predicting the status of a flight several months in advance is indeed challenging.
Almost all the above-mentioned work aims to predict the deterministic status of flight delay, which is either given by the value of flight delay or by the status of delay (on-time, delayed, cancelled). In contrast, Zoutendijk and Mitici [25] develops a machine learning method, using mixture density networks and random forest regression to predict probabilistic individual flight delays. The estimated distribution of flight delays was integrated into a flight-to-gate assignment model. The results show that integrating probabilistic delay prediction into the flight-to-gate assignment problem can significantly improve the robustness of the solution.
In [23], the authors develop classification algorithms for flight delay prediction. However, simply predicting whether a strategic flight has an arrival/departure delay is only a rough reflection of the strategic flight’s performance. So, we convert the strategic flight delays prediction problem into a forecasting problem. Forecasting strategic flight delays is a huge challenge in the strategic phase because it occurs long before the day of the execution. To improve the robustness of the forecasting algorithms, we focus on the prediction of the distribution for flight delay. To the best of our knowledge, in this paper, we address for the first time the prediction distributions of strategic flight delays. Taken together, we propose a machine learning-based approach to predict distributions of strategic flight delays. Specifically, we propose supervised machine learning algorithms to predict distributions of flight delays scheduled in the strategic phase (several months prior to the day of operation). Three evaluation metrics are proposed to measure the prediction results. We demonstrate the performance of our approach using flight schedule data from Guangzhou Baiyun International Airport in the period 2017–2019.
The structure of this paper is organized as follows. Section 2 describes the data used in this paper. Section 3 introduces the features engineering and machine learning algorithms. Three metrics are proposed to evaluate the prediction results. Section 4 compares the performance of algorithms. Section 5 summarizes the contributions of this paper and provides outlines for future research.
2. Data
The scheduled flights data of Guangzhou Baiyun International Airport (ICAO code: ZGGG) were used in this study. The data contain six strategic flight schedules covering all the flights operated from 26 March 2017 to 28 March 2020. An example of scheduled flights from the data is shown in Table 1. Every scheduled flight has the following information: flightID, aircraft type, origin airport, destination airport, Estimated Time of Departure (ETD), Estimated Time of Arrival (ETA), and days of the week. Days of the week shows which days of the week the strategic flight will be executed. For example, “123....” means that the strategic flight will be executed on Monday, Tuesday, and Wednesday each week. The Actual Time of Departure (ATD) and Actual Time Arrival (ATA) of a scheduled flight are recorded if the flight was operated. A flight is said to be delayed if it departs (arrives) more than 15 min after the scheduled time of departure (arrival). A departure (arrival) flight is considered to be cancelled if this flight is not executed in the day scheduled to depart (arrive). Due to the limitation of the data, we do not consider cancellation in this work.

Table 1.
Strategic Flight Schedule.
According to the regulations of Federal Aviation Administration (FAA) and the Civil Aviation Administration of China (CAAC), a flight is considered to be cancelled if its delay is greater than 180 min. Thus, we removed all the flights that were delayed more than 180 min.
Figure 2 plots the average hourly departure (arrival) delay of flights operated from 6:00 a.m. to 24:00, while Figure 3 plots the departure (arrival) delay rate of hourly flights operated from 6:00 a.m. to 24:00. The delay rate is defined as the proportion of flights with delay longer than 15 min to the total number of hourly scheduled flights. As it can be seen from Figure 2, the average departure delay at ZGGG is significantly higher than the average arrival delay. The average arrival delay of the airport increases almost linearly before 16:00; then, it fluctuates slightly and goes up to the maximum of 20 min per flight. The average departure delay of the airport increases almost linearly before 17:00; then, it fluctuates slightly and goes up to a maximum of 35 min per flight. Similar trends can be observed in arrival delay. That is, delay increases almost linearly from 8:00 to 21:00. From Figure 3, we can see that the average departure delay rate of the airport is significantly higher than the arrival delay rate. The average arrival delay rate at the airport is less than 0.24, while most of the hourly departure delay rates vary between 0.5 and 0.6.
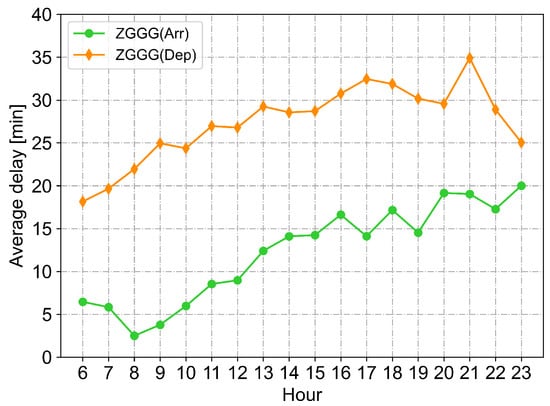
Figure 2.
Average hourly arrival/departure delay.
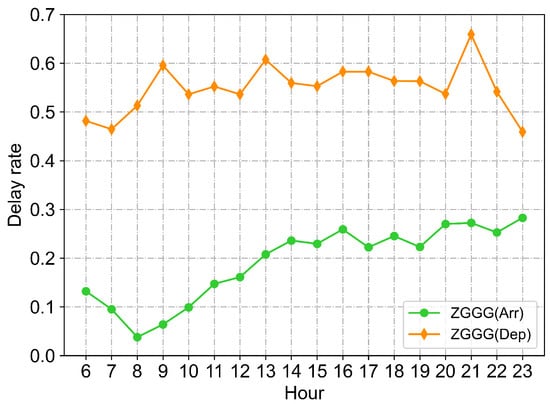
Figure 3.
Airport hourly arrival/departure delay rate.
Figure 4 and Figure 5 shows the distribution of arrival (departure) delay of one flight in one schedule season. The kernel density estimation and the normal distribution fitting are used to fit the curves. It can be seen that the kernel density curve is very close to the fitted normal distribution curve. Therefore, we assume that flight delays follow normal distributions. The mean and standard deviation are used to describe the delay distribution. Thus, the goal of our supervised learning algorithms is to predict the and for every flight in the strategic flight schedules.
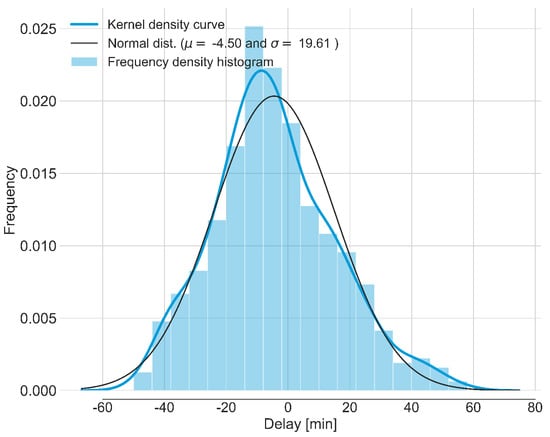
Figure 4.
An example of an arrival flight delay distribution.
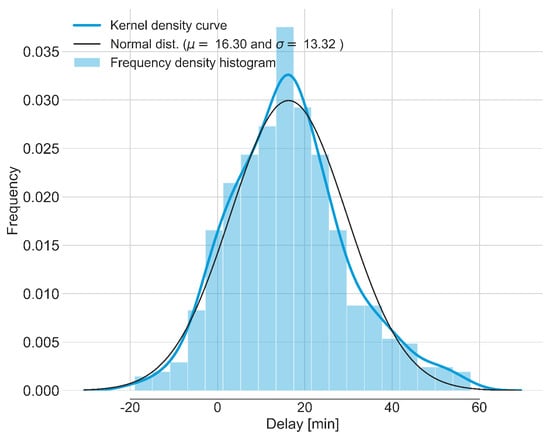
Figure 5.
An example of a departure flight delay distribution.
3. Machine Learning Algorithms for Distribution Prediction of Flight Delays
3.1. Feature Selection
Here, we discuss the selection of features that are used in our prediction model. The final features selected are shown in Table 2. The features Aircraft, Airport, Year, Day of week, Airline, STD Hour, and STA Hour are directly obtained from the strategic flight schedules. Flight frequency is the frequency of a flight operated per week. Flying Time is the time difference between ETD and ETA (i.e., schedule block time). Base Aviation is a binary variable, indicating whether the airline has a base in ZGGG. Hourly flights is the number of scheduled departure (arrival) flights per hour at ZGGG.

Table 2.
Feature description for the algorithm (C—Categorical, N—Numerical, T—trigonometric transform function).
Because Aircraft, Airport, and Airline are categorical variables, machine learning algorithms may not be able to process them directly. Due to the high dimension of classification features, binary encoding and one-hot encoding methods are not suitable for our work. These two algorithms will generate high-dimensional columns, and the training time will be greatly increased. Ordinal encoding is not suitable neither because ordinal encoding is often used for data with size relationships between variables. Thus, the beta object coding method is used to encode these variables [26].
Trigonometric functions are employed to convert Day of week, STD Hour, and STA Hour to keep the nature of periodicity [27]. For example, t = 24:00 and t = 01:00 cannot be directly encoded as 24 and 1, which makes them far apart. In fact, they are continuous, 24:00 today is 0:00 tomorrow. Therefore, for a particular hour t on one day, the trigonometric functions and are converted to ensure 24 h periodicity. After trigonometric conversion, t = 24:00 and t = 1:00 will be continuous hours. Similarly, the period of the feature Day of week is 7 days.
Numerical variables such as Flying time and Hourly flights are normalized; that is, the data are mapped uniformly to the interval . This will change the dimensional expression into a dimensionless expression. The normalization method used here is Max–Min standardization, which is the linear transformation of original data. The transformation function is given as follows:
where x is the original data, is the minimum in the original data, and is the maximum in the original data.
3.2. Framework for Distribution Prediction of Flight Delays
According to previous studies [23], three machine learning algorithms are selected to predict the distribution of flight delays: multilayer perceptron (MLP), LightGBM and random forest (RF). The work in [28] proved through a large number of experiments that random search is better than grid search in machine learning tuning. Therefore, the random search algorithm is adopted in this paper to search for the hyperparameters of every machine learning algorithm.
Figure 6 shows the main process of machine learning algorithms for distribution prediction of strategic flight delays. The process is divided into three parts: feature engineering, machine learning algorithms, and performance evaluation. First, the features are determined and encoded using corresponding methods. Then, the data are divided into a training set and test set. Specifically, the training set contains five strategic flight schedules, which are used to train the machine learning algorithms. The test set contains one strategic flight schedule to test the performance of every algorithm. The output of an algorithm include the mean and standard deviation of every flight. Last, we compare the algorithms’ performance via three evaluation metrics (see more detail in Section 3.3). The k-fold cross-validation is adopted to evaluate the algorithms’ performance [29]. The main idea of the k-fold cross-validation is that the sample will be split into k groups. Each group will be treated as a validation sample (or a testing data set) to evaluate the model. Because we have six flight schedules, therefore, we set .
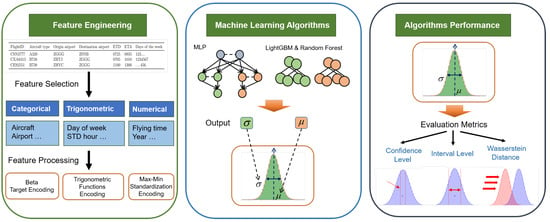
Figure 6.
Machine learning algorithms for distribution prediction of flight delays.
3.2.1. MLP
MLP is a forward-structured artificial neural network that maps a set of input variables to a set of output variables [30]. MLP can be viewed as a directed graph consisting of multiple layers of nodes fully connected to the next layer. The MLP network structure includes an input layer, hidden layer and output layer, and an algorithm called back propagation is used to train the model. MLP often uses the dropout to drop part of the input in the neural network layer to solve overfitting to a certain extent. The loss function of MLP is the difference between the predicted value and the real value, and the algorithm updates the network weights through back propagation according to the loss function to train the network. Therefore, the choice of the loss function has a great influence on the training effect of the algorithm. For the regression prediction problems, the loss function usually is the Mean Squared Error (MSE), which is shown in Equation (2).
where is the original data, is the predicted data, and m is the number of samples in the original data.
However, our focus here is on interval prediction rather than point prediction. Our attention is given to whether the predicted delay distribution is close enough to the real delay distribution. Thus, the quantile loss function (Quantile) which estimates the conditional quantile of a given predicted value is selected in this work (see Equation (3)).
where is the quantile setting value, .

Table 3.
The hyperparameter setting of MLP (MSE).

Table 4.
The hyperparameter setting of MLP (Quantile).
3.2.2. LightGBM
Traditional Boosting algorithms require scanning all sample points for every feature to select the best segmentation point, which is very time consuming. The work in [31] proposes Light Gradient Boosting Machine (LightGBM) to solve this problem. LightGBM uses Gradient-Based One-side Sampling (GOSS). Instead of using all sample points to calculate gradients, LightGBM calculates gradients after sampling. Exclusive Feature Building (EFB) does not use all features to obtain the best segmentation point but rather correlates some features together to reduce the feature dimension. General decision tree algorithms grow trees through a level-wise strategy, which does not distinguish leaf nodes in the same layer, but in fact, some leaf nodes in the same layer do not need to grow. LightGBM uses leaf-wise tree growth to avoid these problems, and it prevents overfitting with a max depth limit. Table 5 shows the hyperparameter settings of LightGBM.

Table 5.
The hyperparameter settings of LightGBM.
3.2.3. Random Forests
In [32], an ensemble learning algorithm of different decision trees called random forest is proposed. Random forest includes random and forest. Forest represents the idea of integrated learning, which includes multiple estimators for learning and prediction without interference. Random represents the construction of sub-data sets by sampling randomly with a back from the original data set, and the amount of data in the sub-data set should be the same as that in the original data set. Every estimator in the forest is divided into a corresponding sub-data set to construct a sub-decision tree and make judgments independently. When new data need to be predicted through random forest, voting is adopted to obtain the final output. For example, if there are three sub-decision trees in the random forest, two of them predict the result as 0.3, and the third one predicts the result as 0.6. Then, the final result of the random forest is (0.6 + 0.3 + 0.3)/3 = 0.4. That is, random forest outputs the mean of all the decision trees’ outputs. Every estimator does not use all features in learning but randomly selects a few features before learning. The hyperparameter setting of random forest for distribution delay prediction is shown in Table 6.

Table 6.
The hyperparameter setting of random forest.
3.3. Performance Evaluation Metrics
To compare the performance of distribution prediction, MSE cannot be used to evaluate the performance of the algorithms. Here, we propose three metrics to evaluate the prediction results, the prediction accuracy under given confidence level, the regional area under given interval level and Wasserstein distance.
The prediction accuracy under given confidence level is defined as follows. The algorithm predicts the mean and standard deviation of the delay distribution of a flight, and it generates the corresponding normal distribution curve. If the mean value of the actual delay distribution falls within this confidence interval under this confidence level, the prediction is said to be a correct prediction. Figure 7 shows a correct prediction for a flight at the 70% confidence level.
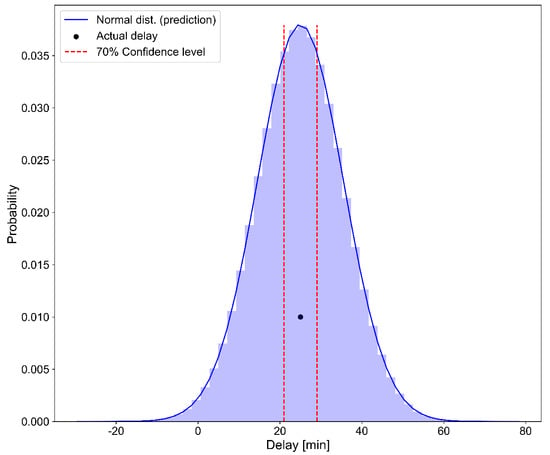
Figure 7.
An example of correct prediction at 70% confidence level.
The regional area under given interval level is defined as follows. The algorithm predicts the mean and standard deviation of the delay distribution of a single flight, and it generates the corresponding normal distribution curve. The mean value of the actual delay distribution corresponds to two points on the x-axis at given interval level. A larger regional area indicates a more accurate prediction. Figure 8 shows an example of a delay distribution with a mean value of 30 min and a delay interval level of 20 min.
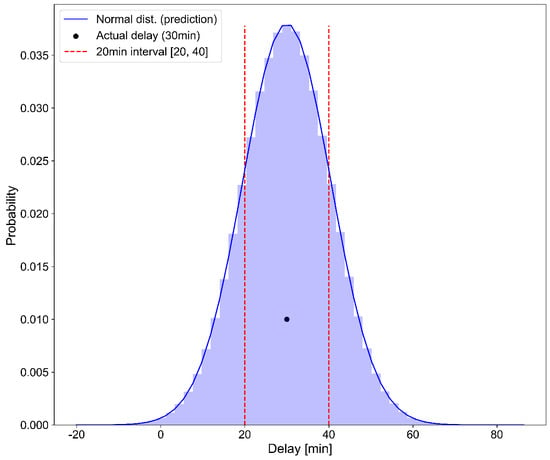
Figure 8.
An example of prediction for 20 min interval level.
The Wasserstein distance is used to measure the difference between the actual delay distribution and the predicted delay distribution. The smaller the value, the more accurate the prediction. Figure 9 shows an example of the Wasserstein distance between two distributions. Wasserstein distance, also known as bulldozer distance, is simply the cost of pushing one distribution into another [33]. This paper does not use the Kullback–Leibler (KL) divergence to measure the distance between the predicted distribution and the actual distribution, because every flight in the schedule follows a different normal distribution, and the KL divergence is not comparable. Then, the function for calculating the Wasserstein distance is given as follows.
where P, Q are the two distributions to calculate the Wasserstein distance. x is the starting point, and y is the target point to be pushed to. r is the cost of the operation, while is the distribution of all possible joint distributions P, Q. The total cost is obtained using the Expectation Maximum (EM) method to find the minimum value.
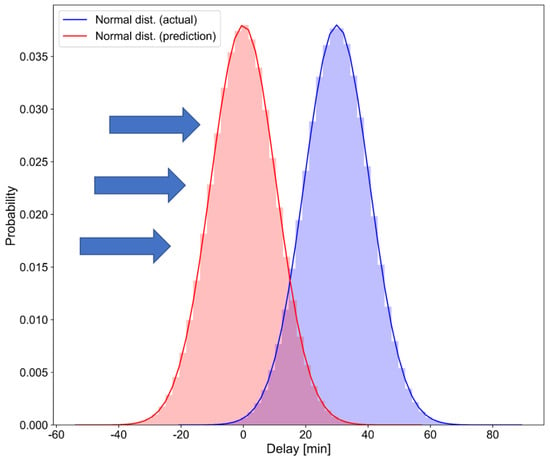
Figure 9.
An example of Wasserstein distance between two distributions.
To evaluate the overall performance of the algorithm, three metrics are proposed correspondingly. The prediction accuracy rate under given confidence level is defined as the percentage of flights in the strategic flight schedule that are correctly predicted at this confidence level. The average regional area under given interval level is defined as the average of the regional area at this interval level in the strategic flight schedule. The Wasserstein distance’s kernel density curve is plotted to demonstrate the performance of Wasserstein distance.
4. Results
4.1. The Prediction of Individual Flight Delays
Figure 10, Figure 11 and Figure 12 shows the performance of different algorithms using three evaluation metrics in predicting arrival delays (left) and departure delays (right). Overall, the performance of predicting departure delay distribution is significantly better than that of predicting arrival delays. This may be because departures have higher average delays and delay rates as shown in Figure 2 and Figure 3. The accuracy of prediction of departure delay at a 0.65 confidence level and arrival delay at a 0.50 confidence level can be over 0.80. At the interval level of 55 min, the regional area of the arrival delay reaches 0.7, and the regional area of the departure delay reaches 0.9. The MLP algorithm, which uses MSE as a loss function, shows the worst performance in all three evaluation metrics. The MLP algorithm using a quantile loss function, LightGBM, and random forest algorithms show little difference. In the prediction of departure delay distributions, the MLP (quantile) algorithm shows the best performance. In the Wasserstein distance’s kernel density curve, it has the thinnest distribution, indicating that the predicted delay distribution and the actual delay distribution have high similarity.
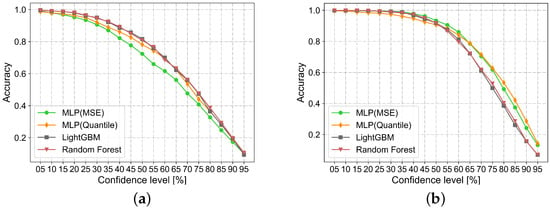
Figure 10.
The performance under different confidence levels (Arrival (a), Departure (b)).
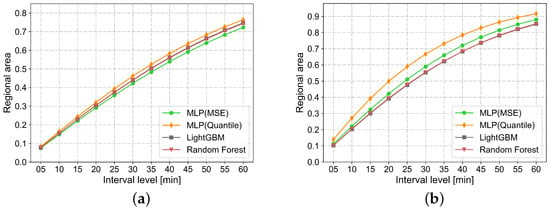
Figure 11.
The performance under different interval levels (Arrival (a), Departure (b)).
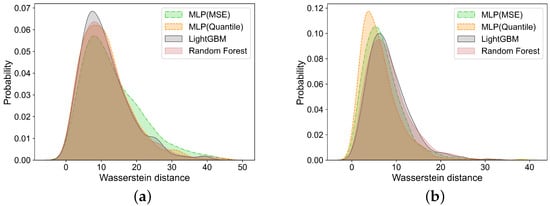
Figure 12.
The performance of Wasserstein distance (Arrival (a), Departure (b)).
4.2. The Prediction of Flight Delays of a Flight Schedule
In this section, we evaluate the predicting performance from an entire flight schedule perspective. After obtaining all distributions of individual flight delays, we can have the delay distribution of an entire strategic flight schedule. Figure 13 plots the Cumulative Distribution Function (CDF) of flight delays of an entire schedule from actual (original), actual (fitted), and predicted data. We can see that the predicted distributions, actual (fitted), and the actual (original) distributions are generally consistent, indicating that our approach can generally capture the main characteristics of flight delays. However, the predicted delays are more concentrated than the actual (fitted) delays. The cumulative value of predicted delays grows slower than the actual ones in the beginning, but it reaches 1.0 faster.
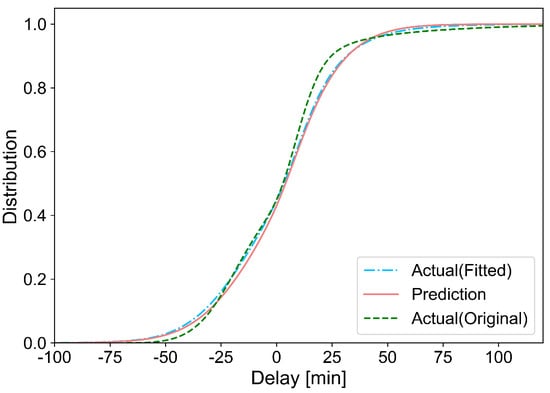
Figure 13.
CDF curve of strategic flight schedules among actual (original), actual (fitted) and prediction.
The Probability Density Function (PDF) and CDF of the mean of flight delays are drawn in Figure 14. The results suggest that it is much more difficult to predict single flight delays than to predict the distributions of delays. In particular, due to the difference in the arrival and departure delays of the strategic flight schedule, the PDF presents bimodal distributions for both predicted and actual data. In general, the prediction algorithm has a good performance for flights whose delays are between 10 and 30 min.
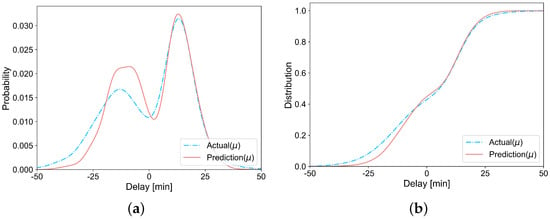
Figure 14.
(a,b) PDF and CDF curve of the mean of every flight between actual and prediction.
5. Conclusions and Discussion
In this paper, we proposed machine learning algorithms to predict the distributions of flights in a strategic schedule. We tested various distribution functions to model flight delays, including Beta distribution, Erlang distribution, and Normal distribution. The results suggest that Normal distribution is better able to capture the stochastic nature of flight delay. Three machine learning algorithms, LightGBM, MLP, and RF, have been employed to predict the distribution of flight delays. To measure prediction performance, three metrics are defined. We tested our algorithms with real flight data at Guangzhou Baiyun International Airport. The prediction accuracy of departure delay at a 0.65 confidence level and the arrival delay at the 0.50 confidence level can reach 0.80. Our work provides an alternative tool for airports and airlines managers for estimating flight delays at the strategic phase.
There are several limitations of the work. First, since there are many factors that affect flight delay, we could fit the delay distribution for every single flight with multiple normal distributions. Second, we do not predict cancellations due to the limitation of data. Given the low probability of flight cancellation, it would be much more challenging to predict correctly. Last, the prediction performance may be enhanced if a sophisticated model is constructed or if a more precise loss function is developed for each machine learning algorithm.
Author Contributions
Conceptualization, Z.W., C.L. and M.H.; methodology, Z.W., C.L. and L.L.; software, Z.W.; formal analysis, Z.W. and X.H.; investigation, Z.W., C.L., L.L. and M.H.; writing—original draft preparation, Z.W. and M.H.; writing—review and editing, L.L., D.D. and M.H.; funding acquisition, Z.W. and L.L. All authors have read and agreed to the published version of the manuscript.
Funding
This research was supported by the National Natural Science Foundation of China (Grant Nos. U2033203, 61773203, 61903187).
Institutional Review Board Statement
Not applicable.
Informed Consent Statement
Not applicable.
Data Availability Statement
The data used to support the findings of this study are available from the Central-south Air Traffic Management Bureau, Civil Aviation Administration of China, upon request.
Conflicts of Interest
The authors declare no conflict of interest.
References
- Civil Aviation Administration of China. 2019 Civil Aviation Industry Development Statistical Bulletin. 2020. Available online: http://www.caac.gov.cn/XXGK/XXGK/TJSJ/202006/t20200605_202977.html (accessed on 6 June 2022).
- Zografos, K.G.; Madas, M.A.; Androutsopoulos, K.N. Increasing airport capacity utilisation through optimum slot scheduling: Review of current developments and identification of future needs. J. Sched. 2017, 20, 3–24. [Google Scholar] [CrossRef]
- Zografos, K.G.; Salouras, Y.; Madas, M.A. Dealing with the efficient allocation of scarce resources at congested airports. Transp. Res. Part C Emerg. Technol. 2012, 21, 244–256. [Google Scholar] [CrossRef]
- International Air Transport Association. Worldwide Airport Slot Guidelines. 2020. Available online: https://www.iata.org/en/policy/slots/slot-guidelines/ (accessed on 6 June 2022).
- Ribeiro, N.A.; Jacquillat, A.; Antunes, A.P.; Odoni, A.R.; Pita, J.P. An optimization approach for airport slot allocation under IATA guidelines. Transp. Res. Part B Methodol. 2018, 112, 132–156. [Google Scholar] [CrossRef]
- Pellegrini, P.; Bolić, T.; Castelli, L.; Pesenti, R. SOSTA: An effective model for the Simultaneous Optimisation of airport SloT Allocation. Transp. Res. Part E Logist. Transp. Rev. 2017, 99, 34–53. [Google Scholar] [CrossRef]
- Pyrgiotis, N.; Malone, K.M.; Odoni, A. Modelling delay propagation within an airport network. Transp. Res. Part C Emerg. Technol. 2013, 27, 60–75. [Google Scholar] [CrossRef]
- Wang, Y.; Li, M.Z.; Gopalakrishnan, K.; Liu, T. Timescales of delay propagation in airport networks. Transp. Res. Part E Logist. Transp. Rev. 2022, 161, 102687. [Google Scholar] [CrossRef]
- Li, Q.; Jing, R. Characterization of delay propagation in the air traffic network. J. Air Transp. Manag. 2021, 94, 102075. [Google Scholar] [CrossRef]
- Cai, Q.; Alam, S.; Duong, V.N. A Spatial–Temporal Network Perspective for the Propagation Dynamics of Air Traffic Delays. Engineering 2021, 7, 452–464. [Google Scholar] [CrossRef]
- Yu, B.; Guo, Z.; Asian, S.; Wang, H.; Chen, G. Flight delay prediction for commercial air transport: A deep learning approach. Transp. Res. Part E Logist. Transp. Rev. 2019, 125, 203–221. [Google Scholar] [CrossRef]
- Khanmohammadi, S.; Chou, C.A.; Lewis, H.W.; Elias, D. A systems approach for scheduling aircraft landings in JFK airport. In Proceedings of the 2014 IEEE International Conference on Fuzzy Systems (FUZZ-IEEE), Beijing, China, 6–11 July 2014; IEEE: Piscataway, NJ, USA, 2014; pp. 1578–1585. [Google Scholar]
- Khan, W.A.; Ma, H.L.; Chung, S.H.; Wen, X. Hierarchical integrated machine learning model for predicting flight departure delays and duration in series. Transp. Res. Part C Emerg. Technol. 2021, 129, 103225. [Google Scholar] [CrossRef]
- Zhu, X.; Li, L. Flight time prediction for fuel loading decisions with a deep learning approach. Transp. Res. Part C Emerg. Technol. 2021, 128, 103179. [Google Scholar] [CrossRef]
- Sternberg, A.; Soares, J.; Carvalho, D.; Ogasawara, E. A review on flight delay prediction. arXiv 2017, arXiv:1703.06118. [Google Scholar]
- Kim, Y.J.; Choi, S.; Briceno, S.; Mavris, D. A deep learning approach to flight delay prediction. In Proceedings of the 2016 IEEE/AIAA 35th Digital Avionics Systems Conference (DASC), Sacramento, CA, USA, 25–29 September 2016; IEEE: Piscataway, NJ, USA, 2016; pp. 1–6. [Google Scholar]
- Chen, J.; Li, M. Chained predictions of flight delay using machine learning. In Proceedings of the AIAA Scitech 2019 Forum, San Diego, CA, USA, 7–11 January 2019; p. 1661. [Google Scholar]
- Choi, S.; Kim, Y.J.; Briceno, S.; Mavris, D. Cost-sensitive prediction of airline delays using machine learning. In Proceedings of the 2017 IEEE/AIAA 36th Digital Avionics Systems Conference (DASC), St. Petersburg, FL, USA, 17–21 September 2017; IEEE: Piscataway, NJ, USA, 2017; pp. 1–8. [Google Scholar]
- Balakrishna, P.; Ganesan, R.; Sherry, L.; Levy, B.S. Estimating taxi-out times with a reinforcement learning algorithm. In Proceedings of the 2008 IEEE/AIAA 27th Digital Avionics Systems Conference, St. Paul, MN, USA, 26–30 October 2008; IEEE: Piscataway, NJ, USA, 2008; pp. 3–D. [Google Scholar]
- Klein, A.; Craun, C.; Lee, R.S. Airport delay prediction using weather-impacted traffic index (WITI) model. In Proceedings of the 29th Digital Avionics Systems Conference, Salt Lake City, UT, USA, 3–7 October 2010; IEEE: Piscataway, NJ, USA, 2010; p. 2-B. [Google Scholar]
- Rebollo, J.J.; Balakrishnan, H. Characterization and prediction of air traffic delays. Transp. Res. Part C Emerg. Technol. 2014, 44, 231–241. [Google Scholar] [CrossRef]
- Odoni, A. A Review of Certain Aspects of the Slot Allocation Process at Level 3 Airports Under Regulation 95/93; Technical Report ICAT-2020-09; MIT: Cambridge, MA, USA, 2021. [Google Scholar]
- Lambelho, M.; Mitici, M.; Pickup, S.; Marsden, A. Assessing strategic flight schedules at an airport using machine learning-based flight delay and cancellation predictions. J. Air Transp. Manag. 2020, 82, 101737. [Google Scholar] [CrossRef]
- EUROCONTROL. Airport ATFM Delay. [WebPage]. 2022. Available online: https://www.eurocontrol.int/prudata/dashboard/metadata/airport-atfm-delay/ (accessed on 6 June 2022).
- Zoutendijk, M.; Mitici, M. Probabilistic flight delay predictions using machine learning and applications to the flight-to-gate assignment problem. Aerospace 2021, 8, 152. [Google Scholar] [CrossRef]
- Motoki, M. Beta Target Encoding. [WebPage]. 2018. Available online: https://mattmotoki.github.io/beta-target-encoding.html (accessed on 6 June 2022).
- Horiguchi, Y.; Baba, Y.; Kashima, H.; Suzuki, M.; Kayahara, H.; Maeno, J. Predicting fuel consumption and flight delays for low-cost airlines. In Proceedings of the Twenty-Ninth IAAI Conference, San Francisco, CA, USA, 6–9 February 2017. [Google Scholar]
- Bergstra, J.; Bengio, Y. Random search for hyper-parameter optimization. J. Mach. Learn. Res. 2012, 13, 281–305. [Google Scholar]
- Wong, T.T.; Yeh, P.Y. Reliable Accuracy Estimates from k-Fold Cross Validation. IEEE Trans. Knowl. Data Eng. 2020, 32, 1586–1594. [Google Scholar] [CrossRef]
- Hinton, G.E. Connectionist learning procedures. In Machine Learning; Elsevier: Amsterdam, The Netherlands, 1990; pp. 555–610. [Google Scholar]
- Ke, G.; Meng, Q.; Finley, T.; Wang, T.; Chen, W.; Ma, W.; Ye, Q.; Liu, T.Y. Lightgbm: A highly efficient gradient boosting decision tree. Adv. Neural Inf. Process. Syst. 2017, 30, 3149–3157. [Google Scholar]
- Breiman, L. Random forests. Mach. Learn. 2001, 45, 5–32. [Google Scholar] [CrossRef]
- Rüschendorf, L. The Wasserstein distance and approximation theorems. Probab. Theory Relat. Fields 1985, 70, 117–129. [Google Scholar] [CrossRef]
Publisher’s Note: MDPI stays neutral with regard to jurisdictional claims in published maps and institutional affiliations. |
© 2022 by the authors. Licensee MDPI, Basel, Switzerland. This article is an open access article distributed under the terms and conditions of the Creative Commons Attribution (CC BY) license (https://creativecommons.org/licenses/by/4.0/).