The loading damage process of coal specimens can be divided into four stages based on the stress–strain curve characteristics of coal specimens under uniaxial loading, namely, the initial compaction stage (OA), linear elastic deformation stage (AB), yield deformation stage (BC), and macroscopic fracture development stage (CD) [
12]. Due to the presence of prefabricated holes and microcracks in the coal, the prefabricated holes and microcracks in the coal are gradually compressed and closed after the initial loading stage (OA section). This is the coal’s first compaction stage where the stress–strain curve gradually increases. The coal specimen reaches the elastic deformation stage as a result of continuous loading (AB section) and its stress–strain curve grows linearly; as external stress is increased further (BC section), the coal rock enters the yield deformation stage and reaches maximal strength. The stress–strain curve of the coal that produces plastic deformation tends to increase, slow down, and fluctuate slightly from the linear elastic deformation stage to the yield deformation stage. After the coal reaches peak strength (CD section), it rapidly enters the macroscopic fracture development stage, where the coal suffers rapid deformation damage and the stress–strain curve rapidly decreases [
13].
3.1. Evolutionary Characteristics of Energy Dissipation
Stress loading causes coal damage, which is a destabilizing phenomenon. The energy conservation equation of a coal specimen under uniaxial compression static loading is illustrated in Equation (1):
where
is the positive work performed on the coal specimen by the loading system,
is the total energy absorbed by the coal,
is the elastic strain energy stored in the coal, and
is the coal’s dissipated energy.
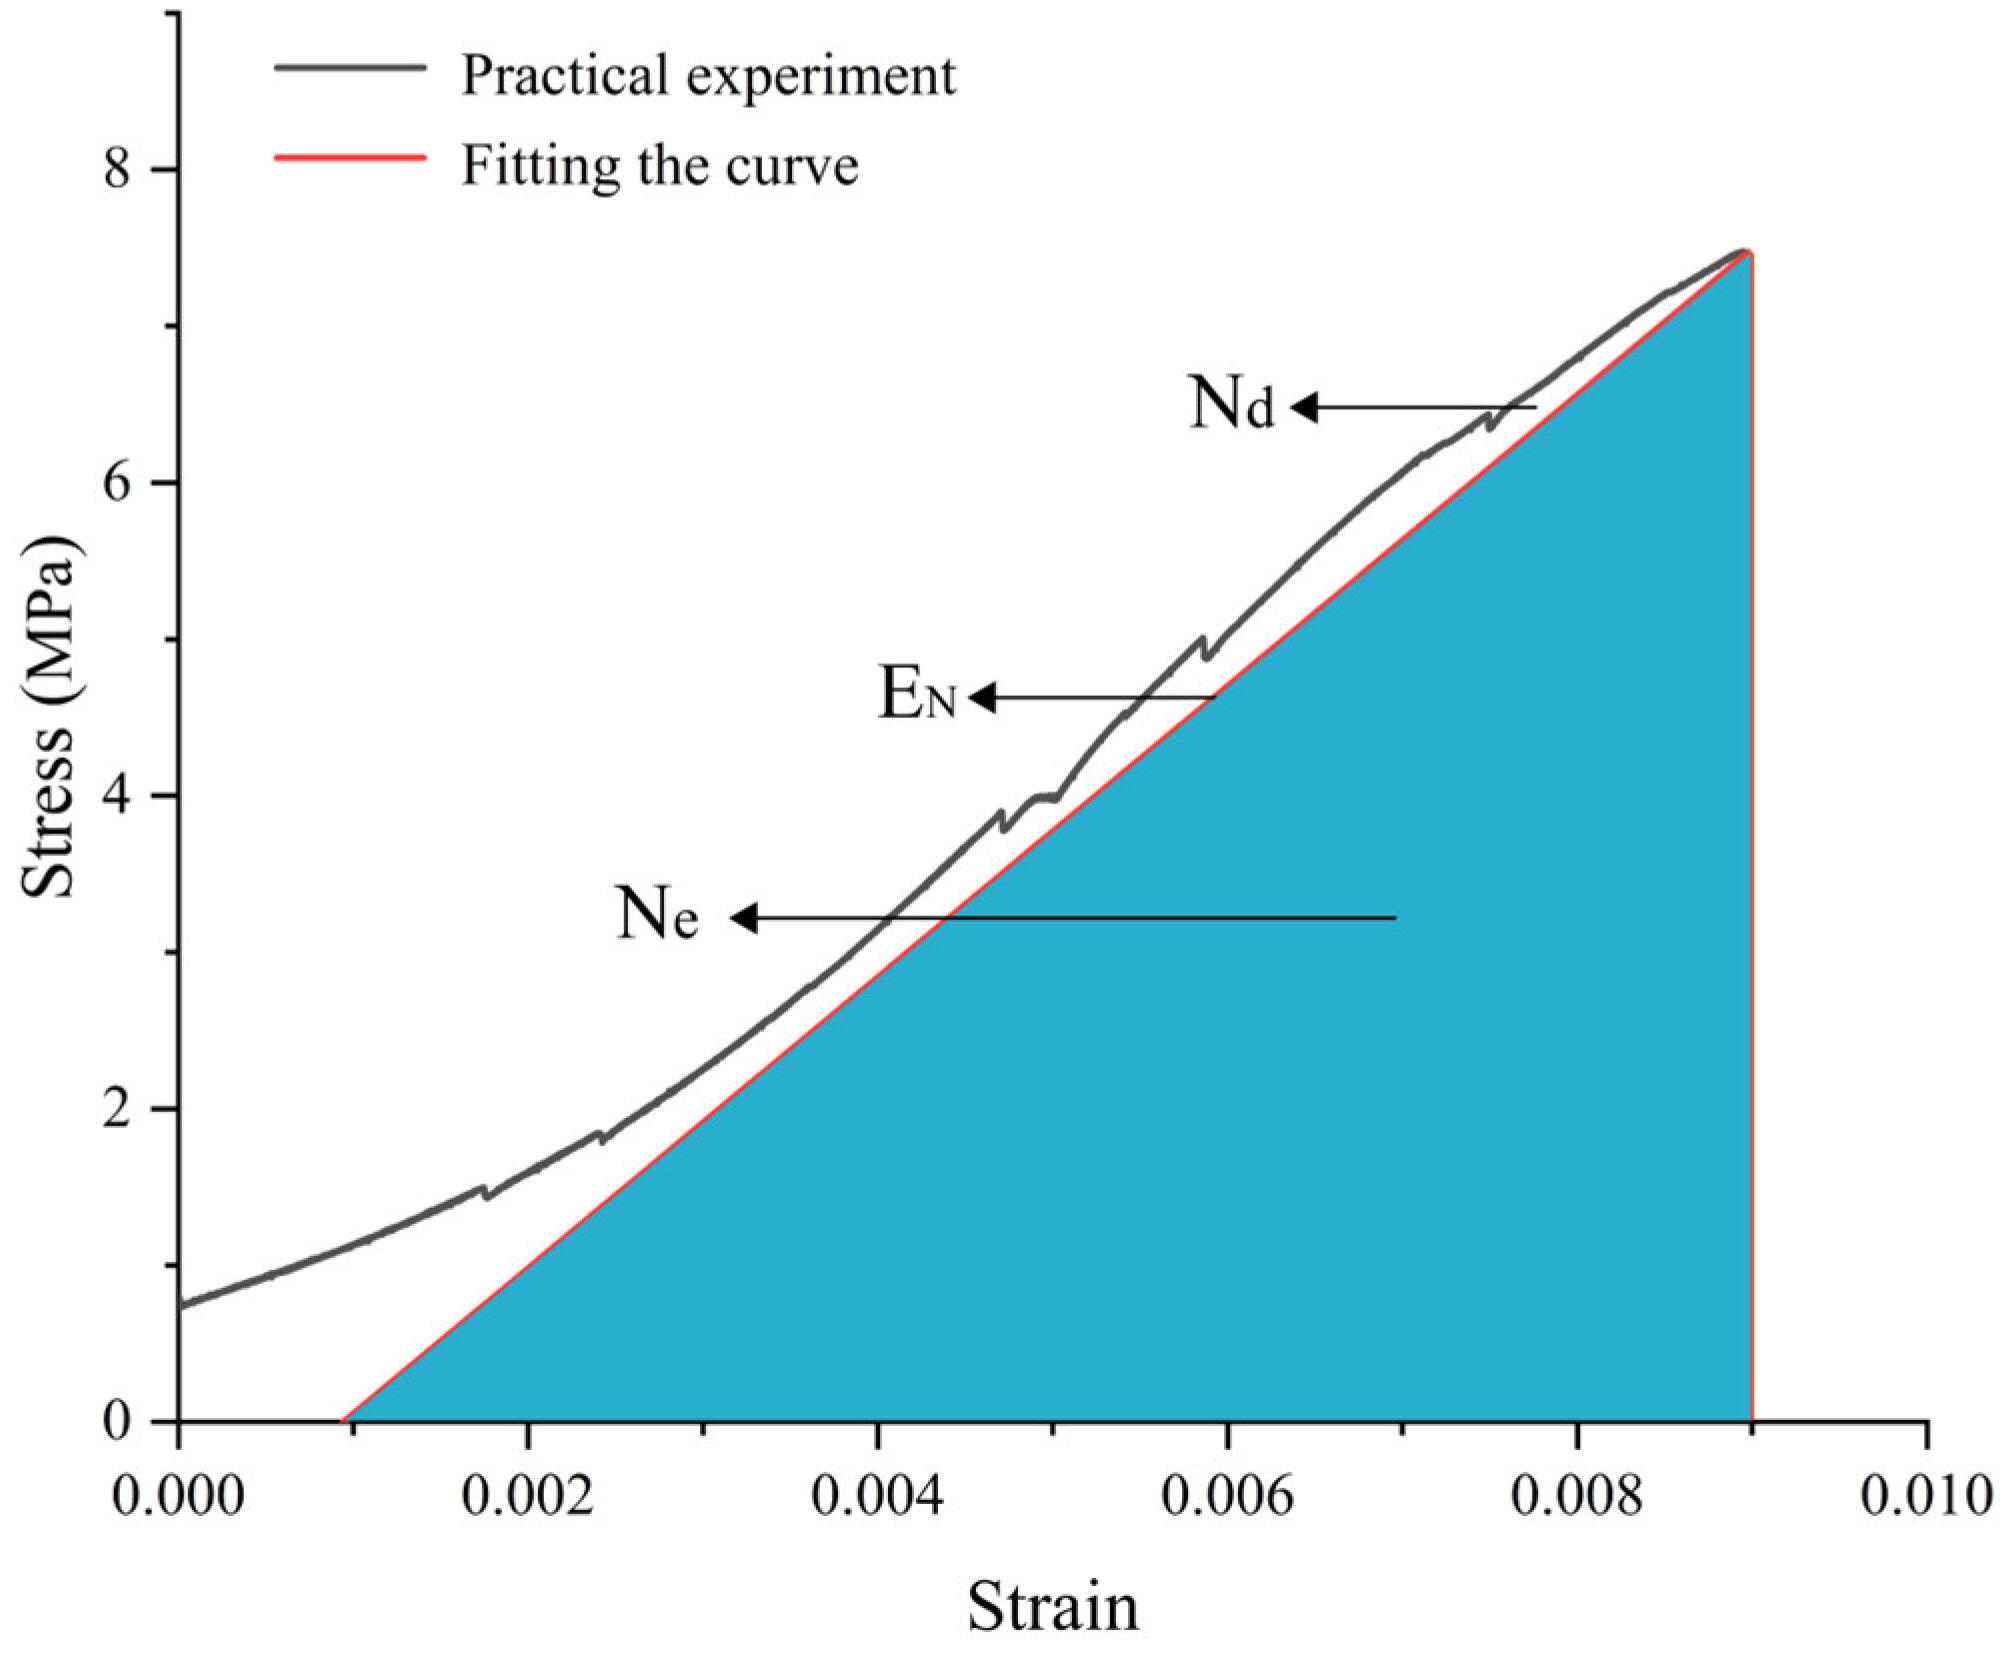
Figure 2 takes the S1 sample as a template to represent the general law of coal energy and more intuitively represents the relationship between elastic energy, dissipation energy, and total energy. As illustrated in
Figure 2, in the linear elastic phase,
is produced by integrating the partial region of the difference between the stress–strain curve and the fitted straight line
and
is obtained by integrating the fitted straight line.
Figure 3 depicts the relationship between dissipated energy, elastic energy, and total energy of coal specimens with holes at various times.
stands for the dissipative energy to total energy ratio,
for the elastic energy to dissipative energy ratio, and
for the elastic energy to total energy ratio. Under continuous loading, the
curve extends upward in the form of a step, and the
value grows with time, while the slope of the
curve keeps leveling off and the growth rate steadily slows down, as shown in
Figure 3. The fraction of elastic energy in the total energy increases as the stress–strain curve appears to fall or as the coal specimens break, according to the analysis of the AE and EMR diagrams. This means that energy dissipation is concentrated in the early stages of loading, and the rate of dissipation decreases as loading progresses. When the coal rock specimens undergo increasing linear elastic deformation and cracks appear in the coal specimens, the elastic energy of the specimen increases significantly. This means that energy dissipation is concentrated in the early stages of loading and the rate of dissipation decreases as the loading progresses. When the coal rock specimens undergo increasing linear elastic deformation and cracks appear in the coal, the elastic energy of the specimen increases significantly.
In the meantime, a comparison of the energy evolution diagrams of coal at different pore sizes reveals that the growth rate and values of small pore size coal specimens are both higher than those of large pore size coal specimens at the point of coal destabilization and rupture, indicating that the energy dissipation of small pore size coal specimens is lower and the effective utilization is higher. Meanwhile, the values of small-aperture specimens S1 and H1 lagged behind those of large-aperture specimens S2 and H2 and dropped from = 7.3 to 4.8 at the peak of the S2 specimen. This demonstrated a significant decrease in the amount of energy dissipated by large-aperture specimens when compared to small-aperture specimens. The proportion of elastic energy increased continuously, which improved the utilization of energy, and with the increasing loading time, the values also increased. The growth rate of small-aperture specimens S1 and H1 was relatively smooth, while the large-aperture specimens S2 and H2 showed a sudden rise after the sudden drop of stress in the specimen.
3.2. AE Response
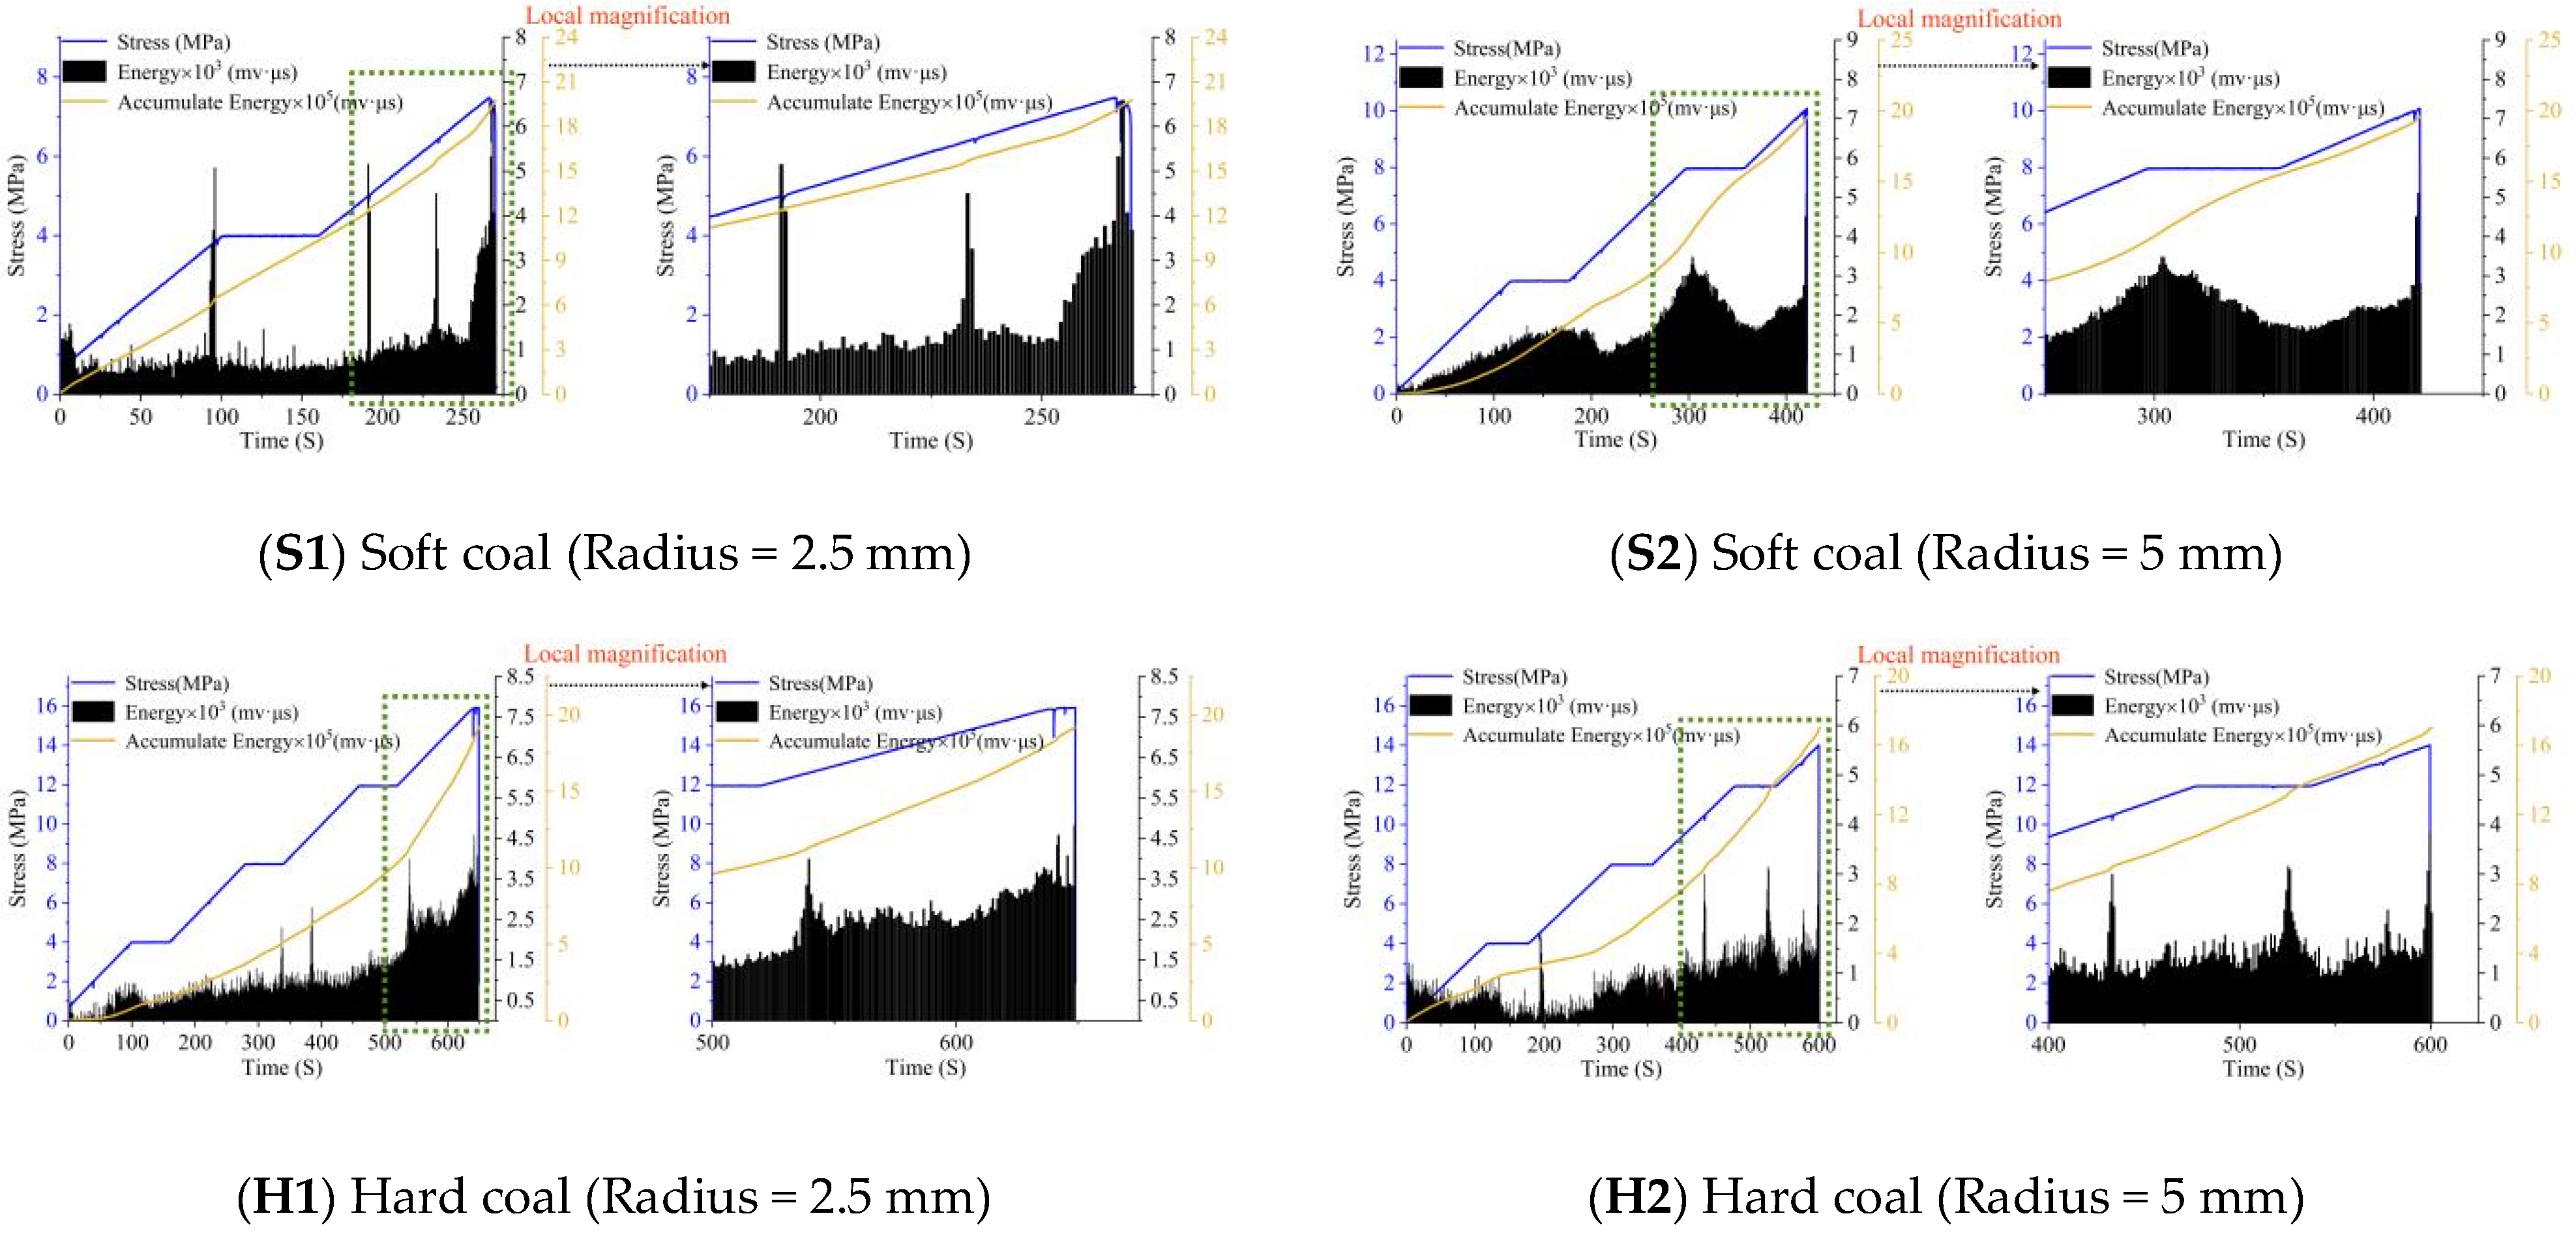
The energy and AE count generated during uniaxial compression deformation damage of soft and hard coal specimens with four different apertures were investigated.
Figure 4 depicts the specific experimental outcomes. Because the equipment cannot monitor the generation of cracks in the borehole and each count of AE represents the newly generated microcracks, the AE count is used to replace the number of cracks to be detected. Similarly, when the AE count changes significantly, it indicates the generation of cracks in the borehole.
The S1 counts and energy of the specimens containing soft coal with holes are higher during the pre-loading period, indicating that microfractures have begun to form, the soft coal destruction process has begun to concentrate, and the primary fractures have compacted. The counts and energy of S1 and S2 gradually decrease as the load increases, then gradually increase, until the counts and energies reach their maximum value when the stress reaches the pinnacle. At this point, the cracks continue to grow and expand as the load increases, eventually reaching their respective stress peaks at 280 s and 454 s, causing the specimens to collapse and shatter. The coal can still support for a while after the rupture occurs because there are more microfractures around the primary fractures and holes. The coal specimen’s primary fractures are first compacted at the start of compression, producing a specific AE signal that causes the AE characteristic curve to fluctuate in comparison to the stress characteristic curve [
15].
The H1 and H2 counts and energy of specimens containing hard coal with holes are low in the early stage and there are fewer microfractures, indicating that the hard coal damage process is not concentrated yet. The energy and pulse count increase as the load increases and the cracks grow and expand as the load increases. Because the time interval between the appearance of the AE count and energy “multi-peak” during the compression damage of hard coal is shorter and more concentrated, the time of the pre-cracking of hard coal compacted by the servo machine is shorter than that of soft coal and the preliminary confirmation is that the compression resistance of the hard coal is greater than that of soft coal, the brittleness of soft coal is greater than that of hard coal, and the time of the pre-cracking is shorter than that of soft coal.
The release of energy accumulated during the compression of the specimens with holes several times before and after the damage is what causes the “multiple peaks” to appear in the counting and energy curves of coal specimens with holes. The AE counts and energy both reach the highest peak value at the peak stress, indicating that the accumulated energy is released instantly during the uniaxial compression damage of the specimens. The comparison between the cumulative acoustic emission count and the stress curve shows that whenever there is a relatively obvious drop in the stress, the acoustic emission count value also increases, and when it is approaching the stage of instability and rupture, it is often accompanied by the cumulative AE count. Then, the slope of the AE count increases. When the slope is positive infinity, the coal body is unstable and ruptures. It is proved that the sudden increase in the monitoring count value of the AE system can be used as a monitoring and early warning method when the coal body is unstable. The AE counts and energy of H1 specimens during the destruction process are much lower than those of H2 specimens and the peak AE counts and instantaneous release of energy during the destabilization and rupture of H1 specimens are also lower than those of H2 specimens, proving that the intensity of rupture of the precast hole coal with 5 mm diameter is greater than that of H2 specimens. Comparing the accumulated AE counts of the S2 and the H2, the AE count concentration area of the harder coal sample is closer to the instability failure period, indicating that the main cracks causing the hard coal failure are concentrated near the instability period.
3.3. EMR Response
The S1 experimental sample is a soft coal sample with a 2.5 mm aperture and an EMR probe arrangement with seven EMR channels on the specimen’s left side, 10 cm away from the sample, facing the aperture axis position, and eight magnetic radiation channels on the specimen’s right side, 5 cm away from the sample, facing the aperture axis position. The probe is fixed with insulating tape. The EMR sensor uses a probe with a reception frequency of 100 kHz and a preamplifier with an amplification of 40 dB. The electromagnetic shielding system is made up of a shielding chamber and a shielding mesh, both of which are made up of a copper mesh with a double-layer grid size of less than 0.15 mm.
The EMR signal and its energy value collected by the coal specimen during uniaxial compression work can be analyzed using the experimental system. Due to the existence of influencing factors such as environment, instrument accuracy, and adjustment of each experiment, each monitored electromagnetic radiation energy has a certain threshold value. Then, noise reduction for each electromagnetic radiation energy is optimized, retaining the part exceeding the threshold value. The stress of the coal specimen during uniaxial compression damage and the EMR influence curve during the damage can be seen in
Figure 5.
The EMR energy value represents the energy emitted during the fracture of the specimen. EMR is a type of electromagnetic energy that is released outward during the deformation and rupture of coal rock under stress. When compared to the amplitude signal, energy values are more sensitive to the response of coal rock damage, especially when the coal is unstable. This means that the electromagnetic waves generated by greater fissures in the coal have a higher energy content [
16].
The signal distribution characteristics are different in other loading stages due to the different nature of each specimen, but the majority of the signal changes are most obvious in the middle and early stages of loading, as can be seen in
Figure 5S2,H2, where the energy first reaches a higher peak in the early stage, then tends to level off and rises to a peak at the moment of instability of the coal specimen; the accumulation is most obvious in the middle and early stages of loading. It has been demonstrated that soft coal specimens with large pore sizes started to degrade and form microcracks during the initial phase [
17]. When compared to soft coal specimens with small pore diameters, bigger pore diameters alter the structure of the specimens, resulting in S2 specimens with lower load-bearing capacities and a faster rate of fracture expansion. The compressive strength improves with an increasing pore diameter in the range of 5–10 mm [
18].
When the stress level of the coal is low and the compression closure of mainly tiny cracks and prefabricated holes in the coal are slower to appear with new cracks, the specimens H1 and H2 EMR’s amplitude signals and the energy values of hard coal containing holes are relatively small during the pre-loading period. At the same time, the EMR accumulative energy curve maintains the same upward trend as the stress curve with the passage of loading time. With the increase in the step size, the EMR accumulative energy curve shows an increase in the slope at the moment of energy excitation, and the stress curve also shows a corresponding stress drop. The signal distribution features differ at various loading stages due to the distinct nature of each specimen, as shown in the figure, although the majority of the signal changes occur in the middle and late phases of loading, at the same time as the stress concentration. It has been established that the damage process of hard coal-containing pores occurs primarily in the latter stages when the stress of large pore size H2 specimens is lower than that of small pore size specimens. Because the specimen’s structure has been changed, the H2 specimen has a lower load-bearing capacity and a faster fracture expansion rate than the H1 specimen.
3.4. Strain Field Analysis Based on DIC
The DIC technique uses the image before deformation as a reference, divides the study area into a grid, treats each subregion as a rigid motion, and uses a specific search algorithm to calculate the correlation between strain and displacement in the subregion using a predefined correlation function [
19].
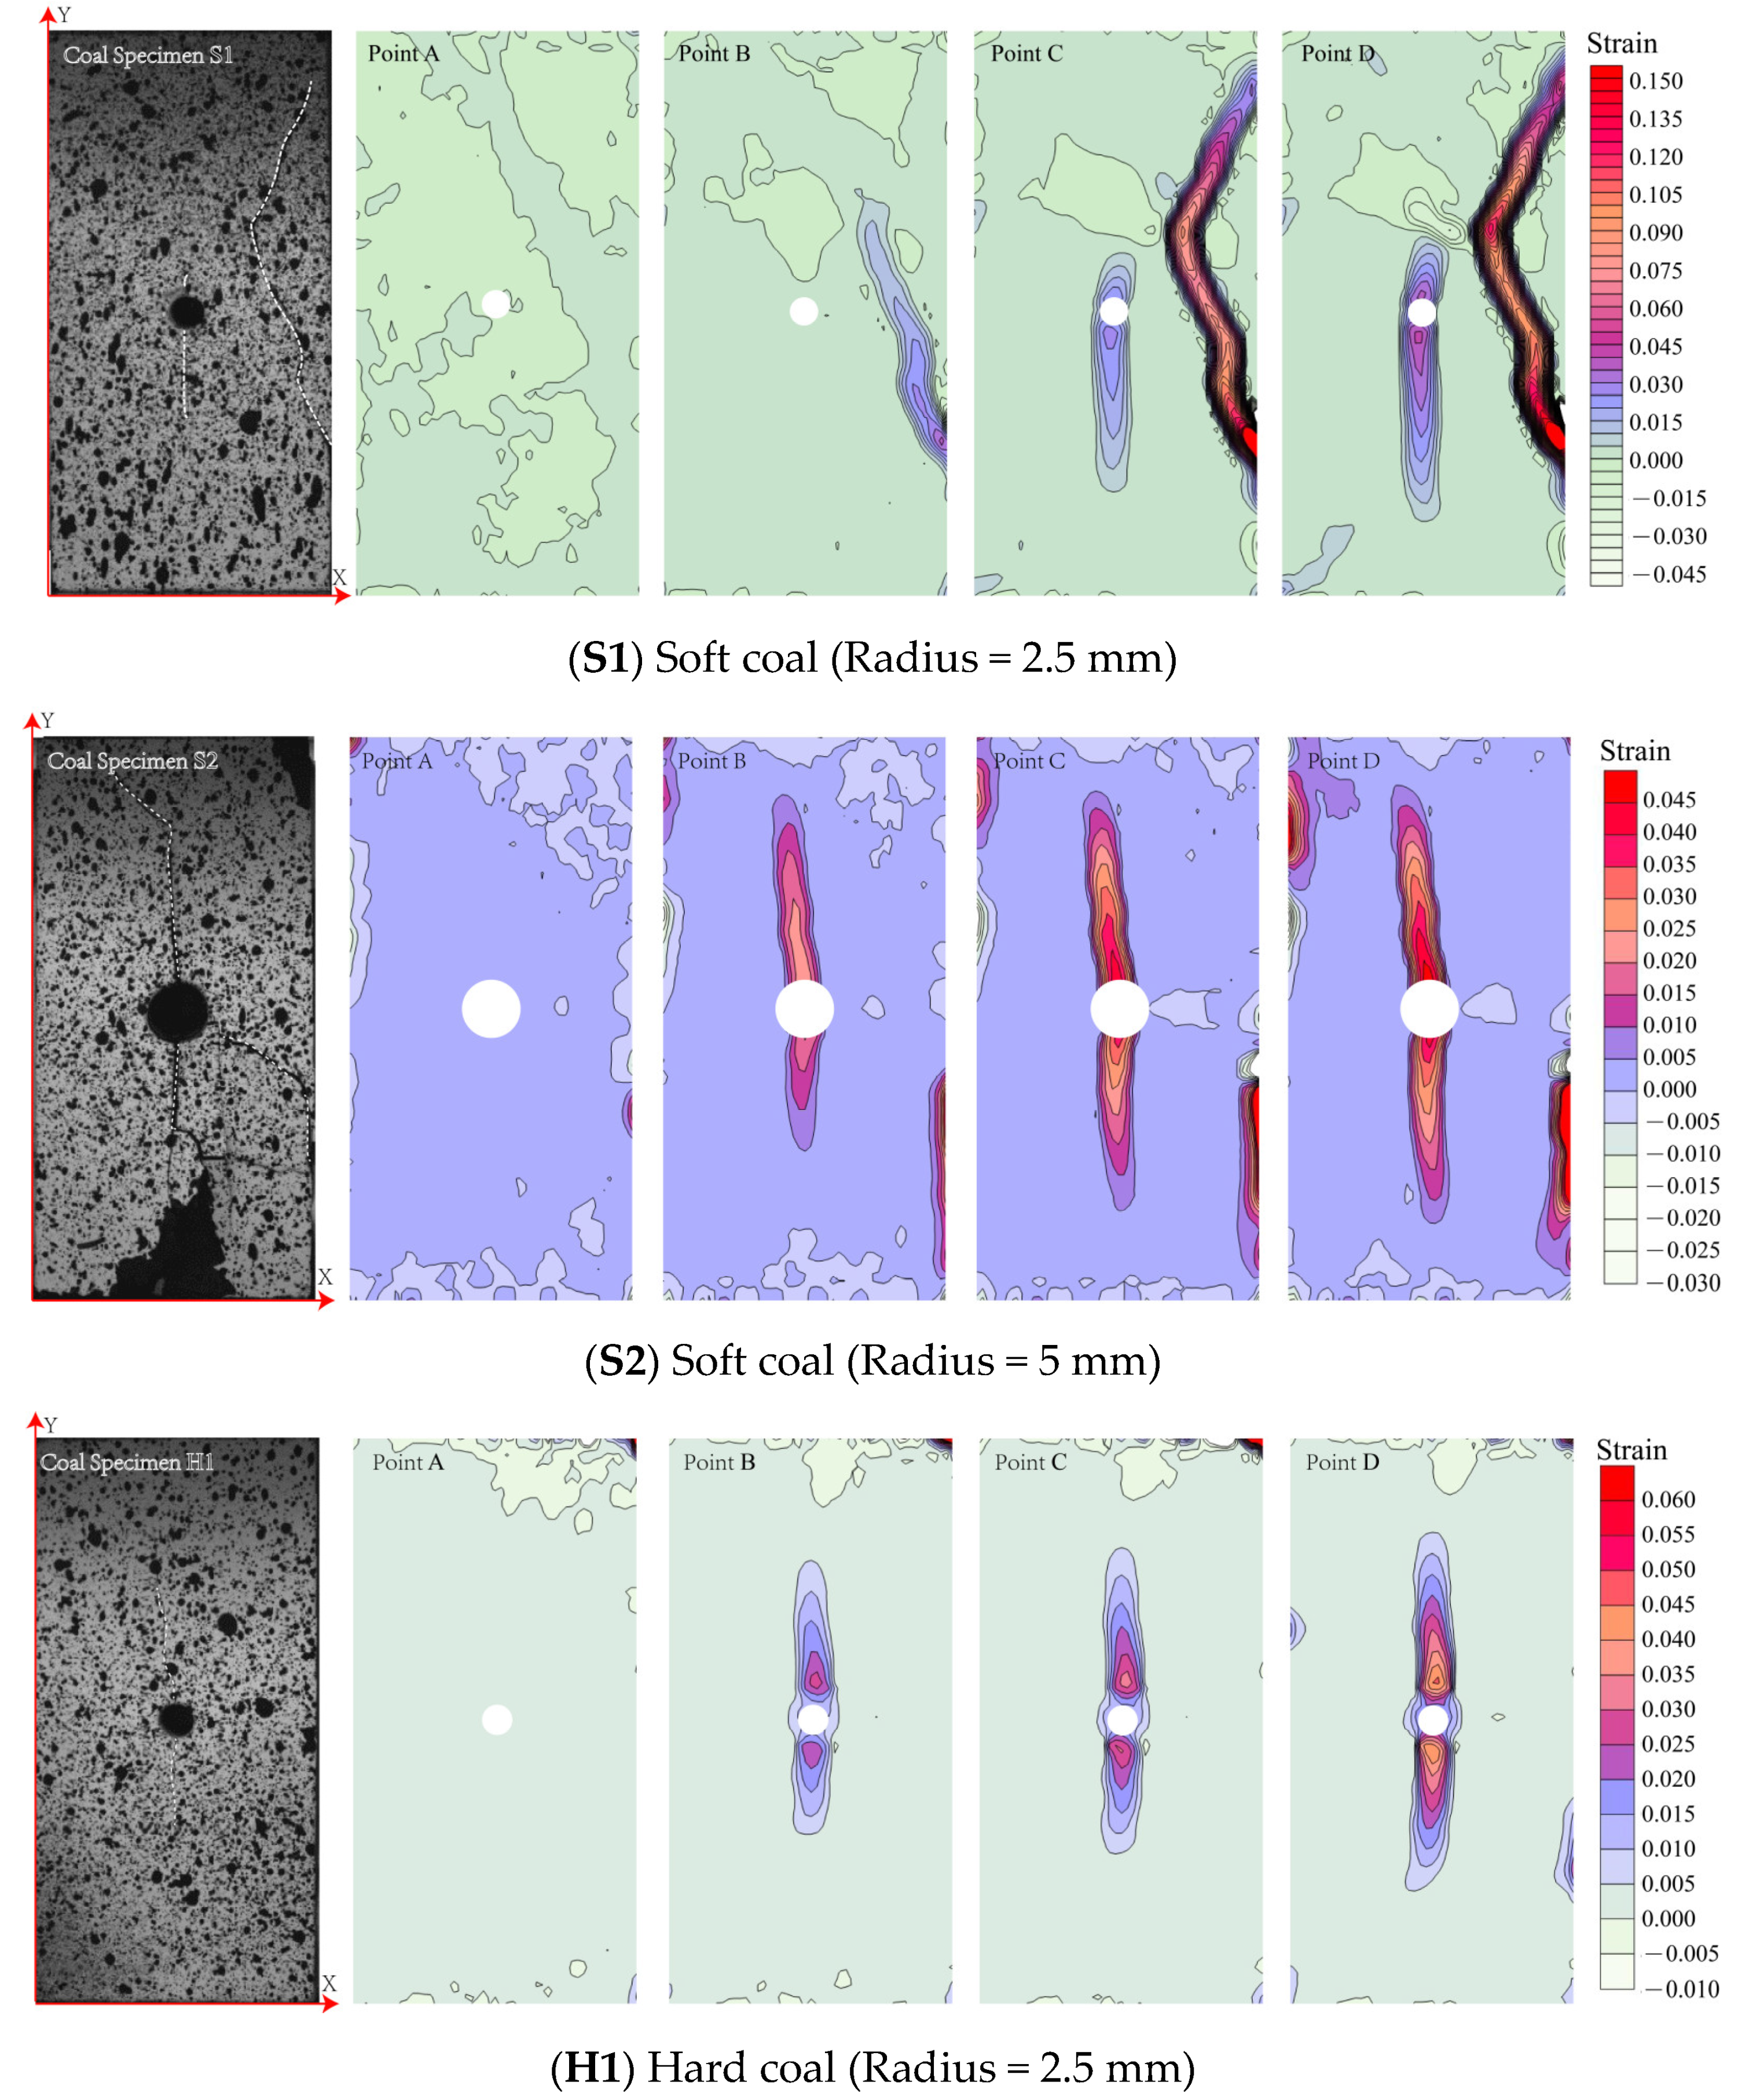
In uniaxial compression loading of soft and hard coal specimens in prefabricated holes, cracks mostly emerge from around the hole axially and eventually penetrate at the end face, forming an ‘I’-type crack macroscopic fracture damage zone through the hole, accompanied by the appearance of cracks far from the axial rupture, and the damage type of the specimens is tensile-shear damage [
20].
On the stress–strain curve, the DIC picture can be separated into four parts: OA (initial compaction stage), AB (elastic deformation stage), BC (yield deformation stage), and CD (compression stage) (macroscopic fracture extension stage). For DIC analysis, the coal specimen rupture maps corresponding to points A, B, C, and D of each stage are used. The longitudinal strain clouds of the coal specimen rupture process processed by DIC are shown in
Figure 6.
At about 80–90% of the ultimate load, the strain localization zone appears in the S1 specimen and this is when the nonlinear behavior starts (point B). The appearance of cracks in the middle of the specimen at the peak moment (point C), which increase quickly during the sudden decrease in load carrying capacity, indicates the occurrence of local instability inside the specimen when a strain concentration region appears in the axial region of the specimen hole.
In the S2 specimen, this rapid crack development was also seen. It demonstrates that the larger the prefabricated hole, the lower the maximum axial stress, and the easier it is to destabilize and break it. For the H1 specimen, during the initial loading OA, the internal pore of the specimen closed and gradually compressed, leaving the specimen surface free of cracks; during the AB stage, the stress acts on the upper and lower parts of the pore, resulting in the specimen in the axial position of the pore ’I’-type crack. The tensile crack at the upper end of the hole continued to widen as the load was increased in the CD stage and the specimen showed some destabilizing rupture. In the H2 specimen, the bending oblique cracking is more visible. As the loading progresses, the cracks around the hole join with the left and right fractures to generate macroscopic damage cracks, as seen in the physical image. The cracks around the holes become joined to the left and right fractures as the loading continues, generating macroscopic damage cracks.
The foregoing findings reveal that as stress increases, the degradation processes of soft and hard coal adopt distinct patterns. The soft coal’s AE and EMR signals alter dramatically during the pre-loading period, whereas the hard coal’s AE and EMR signals are mostly affected during the late loading period. Despite the differences between the AE and EMR signals of coal specimens with different pore sizes, they strongly coincide during the destabilization rupture stage. At the same time, the cracks on the DIC strain cloud are of the ‘I’ type and the cracks produced by the coal specimen with the large aperture are larger than those produced by the coal specimen with the small aperture. Additionally, the stress required for destabilization and crushing is much lower for the coal specimen with the large aperture than it is for the coal specimen with the small aperture. The size of the hole seriously affects the bearing capacity and bearing time of the coal specimen and changes the internal stress distribution of the coal specimen during loading. The peak stress required for the destruction of the large-aperture prefabricated hole coal specimen is much smaller than that of the small-aperture prefabricated hole coal specimen and the crack development speed of the small-aperture prefabricated hole coal specimen lags behind that of the large-aperture prefabricated hole coal specimen.
3.5. Micromechanical Behavior and Crack Propagation with PFC
A numerical simulation can more successfully represent the micro-mechanical behavior and crack propagation progression during the degradation of coal–rock combinations than theoretical studies and indoor experiments. The internal deformation of the coal rock happens when it is subjected to external loading and the microstructure surface is damaged; the particle flow program (PFC) is often used to depict the internal destruction fracture process of the coal rock. The PFC2D program was used to simulate the particle flow and the coal particles were idealized as round particles for computational purposes. The model is the same size as the specimen when it comes to computation volume and accuracy [
21]. A total of 22,230 particles were created to better approximate the inhomogeneity of coal particle distribution. Two walls were also put around the model, with a Linear Parallel Bond Contact Model (LPBC) employed between the walls and the particles, and the particle model was compressed uniaxially [
22]. The appropriate computational parameters were entered into the program using the PFC2D program, which is based on particle flow analysis. A linear parallel bonding model with a phased application of the axial loading rate was used to create the computational model [
23].
The increasing and interpenetrating microscopic fractures produced during the PFC2D numerical simulation calculations cause the macroscopic fractures produced in the specimen during loading, with the darker portion representing the particles and coal particles in the fracture profile and the lighter portion representing the fractures produced during the simulation, as well as the contact forces in the fracture diagram [
24]. The multi-factor analysis of variance was used to determine the degree of influence of the model’s meso-parameters on the macro-mechanical parameters. Additionally, the relationship between the macro-mechanical parameters and the meso-parameters and the relationship between the elastic mechanics parameters were established. Then, the mesoscopic parameters determined as: Particle density, Particle diameter, Particle contact modulus, etc. [
25].
The comparison of the coal rock simulation and experimental results are shown in
Figure 7 and the fine mechanical parameters of soft and hard coal specimens are shown in
Table 2.
The compression densification stage, elastic deformation stage, yielding stage, and macroscopic fracture expansion stage are the stages of the stress–strain curve. Hard coal has an 18 MPa peak point stress and the elastic modulus of the elastic deformation stage is 2.5 GPa [
26].
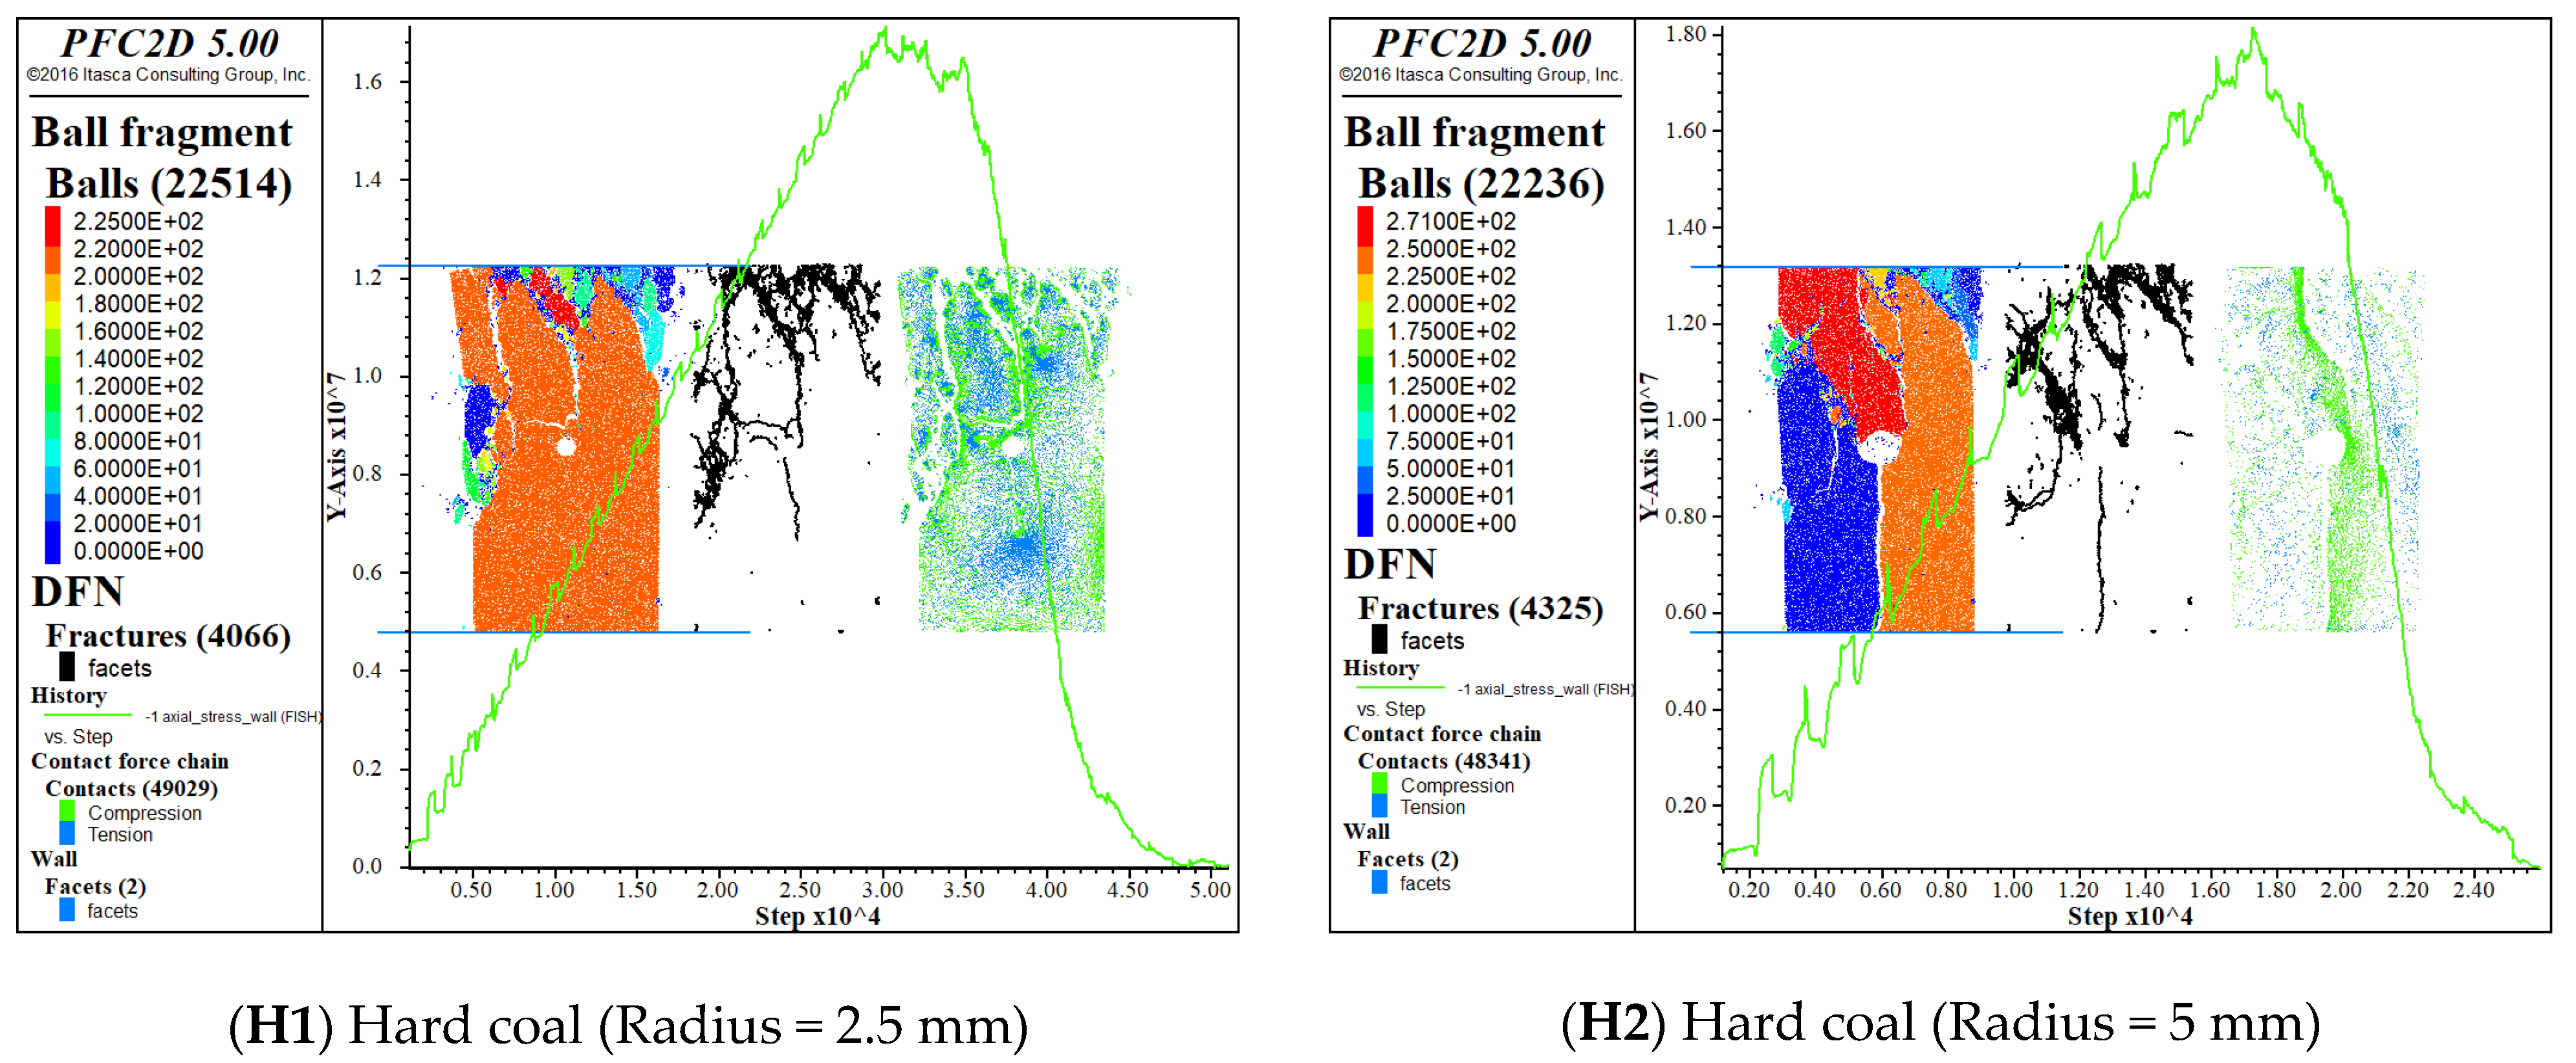
Figure 8 depicts the crack propagation process. The creation of cracks around the hole of the 5 mm hole coal specimen with the commencement of the top part of the coal can be observed and the damage degree of soft coal is smaller than hard coal. The soft coal specimen begins to have obvious crack generation when compared to the hard coal and the crack expansion of the coal with 5 mm holes is obvious when compared to the coal with 2.5 mm holes, indicating that the coal has entered the non-linear deformation stage. With continued loading, the cracks in the coal continue to expand, the stress reaches a peak point, the fracture surface forms in the upper right corner of the coal, and the axial cracks derived from the holes begin to extend to the coal axially; the soft coal ruptures at low stress while the hard coal ruptures at high stress and the 5 mm holes have a greater degree of axial rupture than the 2.5 mm holes. At that point, the coal has lost the majority of its load-bearing capability and the stress–strain curve begins to decline as the loading continues [
27]. In the final rupture of the coal, two types of cracks appeared: (1) axial tensile cracks, where stress concentration occurred near the axial direction of the hole due to the presence of hole defects, causing tensile cracks to expand and (2) remote cracks, where the axial load formed cracks away from the hole’s perimeter. It finally leads to the destabilization and rupture of the coal due to the combined activity of both types of fissures. The hole size and coal quality have a substantial influence on the fracture starting site of cracks in coal specimens including holes when loading conditions are applied.
As illustrated in
Figure 8, the axial crack growth around the hole is arranged from large to small as (H2) hard coal 5 mm > (H1) hard coal 2.5 mm > (S2) soft coal 5 mm > (S1) soft coal 2.5 mm, resulting in destabilizing damage and a significant drop in stress.
PFC2D software is used to track and monitor the energy evolution of the uniaxial compression process of coal bodies with holes, as well as to simulate and analyze it. In each cycle, the ball, clump, wall, and contact accumulate energy. Volume energy and contact energy are the two types of mechanical energy. The energy associated with volume is known as volumetric energy and in the case of a ball or clump, this is the energy caused by gravity. Where gravity is defined as the gravitational load and the applied force and moment (denoted as ebody), the energy dissipated by local damping (denoted as edamp), and the kinetic energy (denoted as ekinetic). For the wall, the energy exerted by the boundary (denoted as eboundary) is cumulative. In each step, the boundary work is the sum of the dot product of the force acting on the wall and the incremental displacement and the dot product of the moment acting on the wall and the incremental angular displacement. The contact energy is defined by the contact model. For all built-in contact models of the PFC, the energy list includes buffer dissipation energy (denoted as edashpot), parallel bond strain energy (denoted as epbstrain), sliding energy (denoted as eslip), and strain energy (denoted as estrain).
The H2 specimen is chosen in this instance for energy analysis, as seen in
Figure 9. In accordance with the step size, the border energy (eboundary), parallel bond strain energy (epbstrain), and strain energy estrain all grow and the rate of rising quickens until the stress curve flattens. The energy applied from the outside acts on the coal particles first, destroying the bonding between the particles, first transforming the bonding strain energy, then the energy is reflected on the macroscopic level, and then converted into strain energy, so the changing trend of the bonding strain energy is greater than that of the strain energy, but the increasing trend of the parallel bond strain energy and strain energy is slower than that of the boundary energy. When the stress is close to the compressive strength, both the strain energy and parallel bond strain energy reach the maximum value and it shows a downward trend with the increase in step size [
28,
29]. Sliding energy, local damping energy, cushion dissipation energy, and kinetic energy all start to grow when the stress reaches the compressive strength, where the kinetic energy grows at the fastest rate and the rate keeps increasing and the kinetic energy reaches its peak when the stress is reduced to the lowest point and the simulated specimen is destabilized and broken. Since the coal was loaded to reach the compressive strength before, although the stress curve appears to be locally reduced, the coal specimen still maintained a more stable structure. When the coal reaches the stress limit, the moment when the coal appears to have obvious cracks is when the kinetic energy growth appears, which indicates that the coal starts to destabilize and rupture at this moment; this moment is also when sliding energy appears, which also indicates that the main crack of the coal specimen destabilizes and damages at the moment of the stress limit leads to shear damage of the coal specimen.
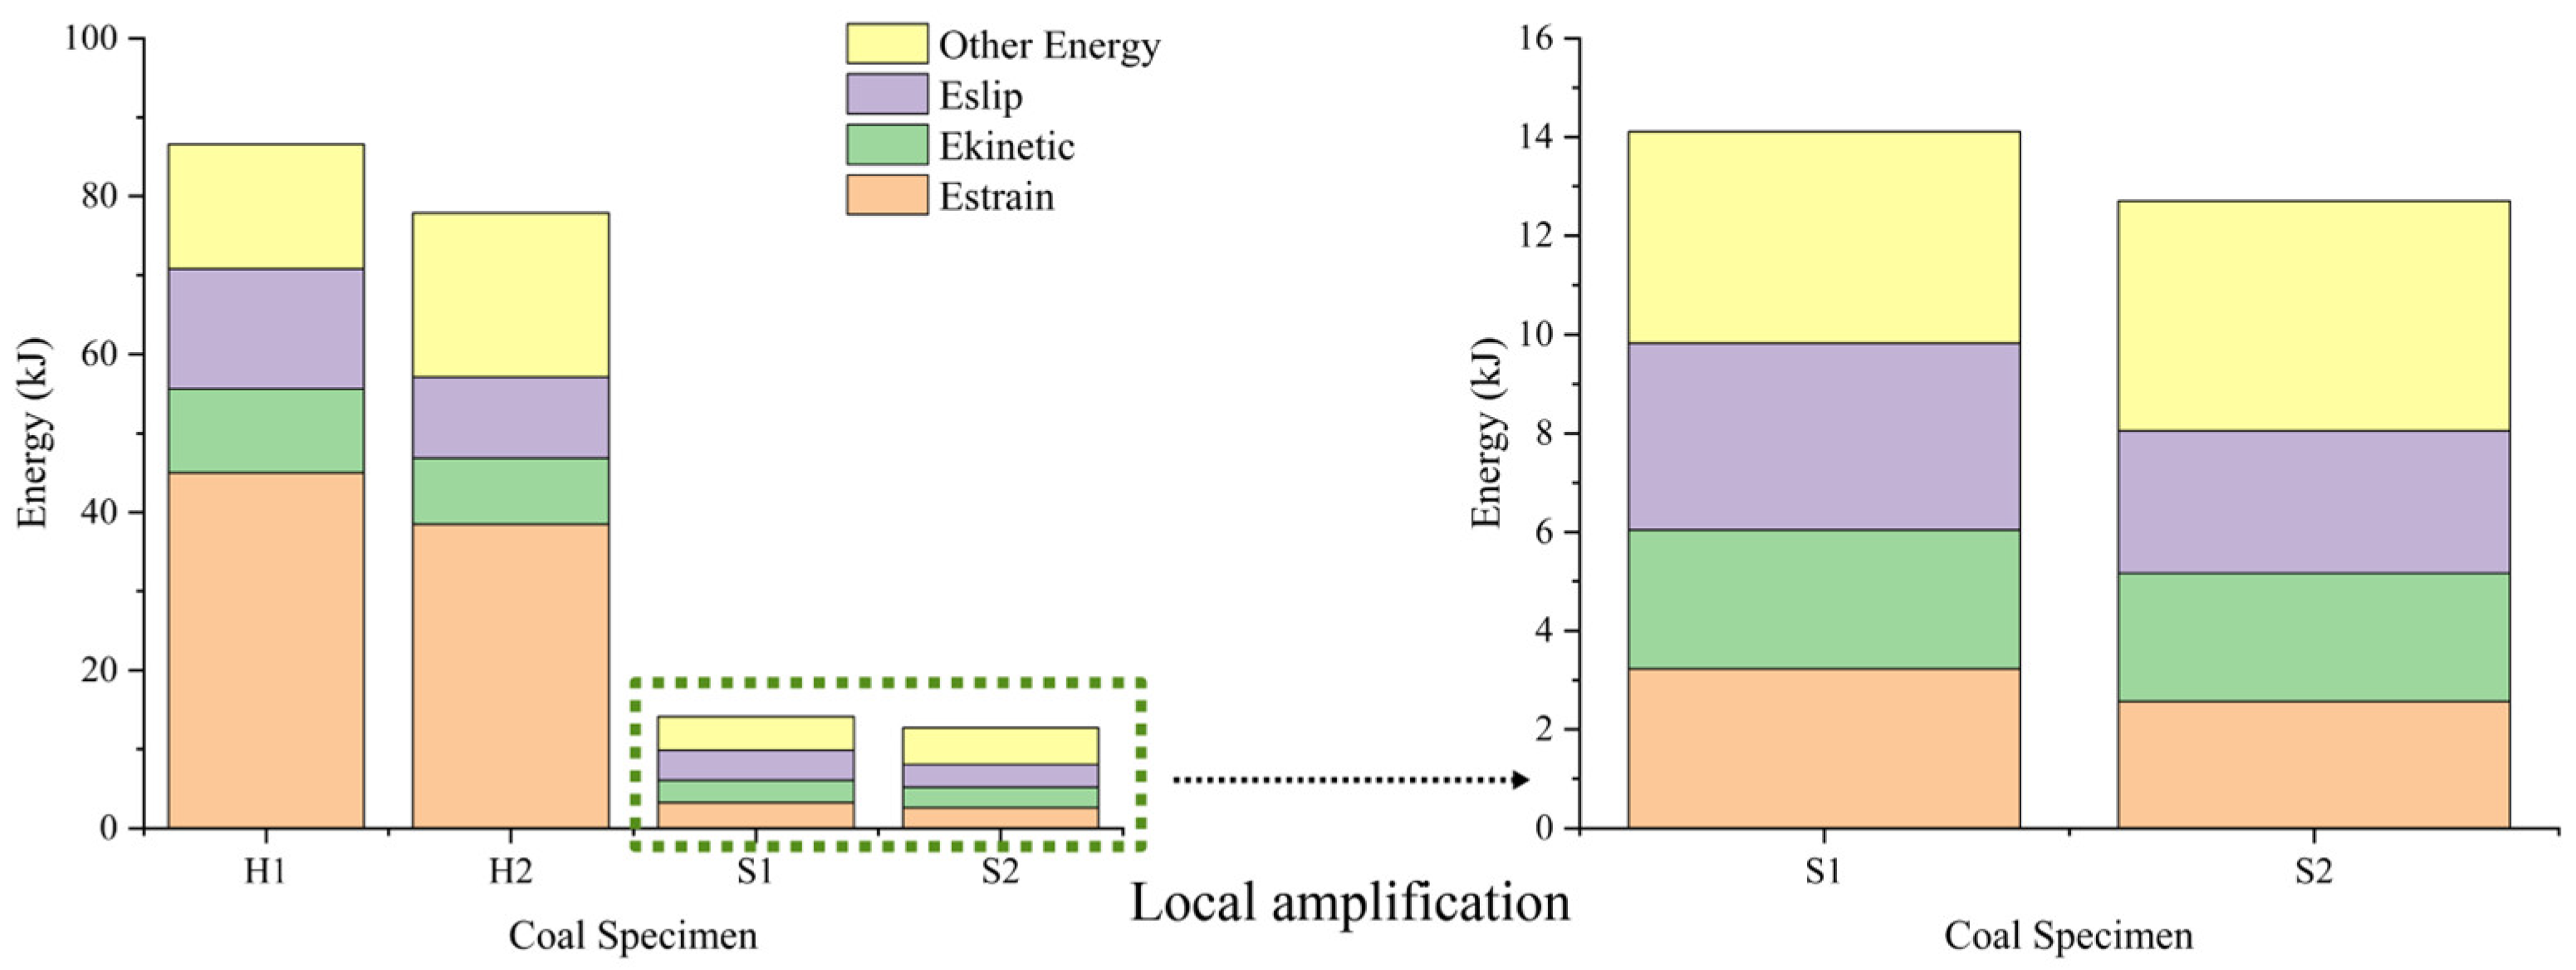
The energy dissipation is mainly reflected by kinetic energy, sliding energy, strain energy, and other energies. By analyzing the proportion of boundary energy accounted for by different energies of different coal specimens and then revealing the energy change law of energy loaded processes. As shown in
Figure 10 and
Table 3, there is a large gap between the boundary energy of soft and hard coal specimens and the energy required for destabilization and the crushing of hard coal specimens is larger; there is also a large gap between the ratio of kinetic energy and sliding energy of soft and hard coal, the ratio of kinetic energy to sliding energy of soft coal is less than or equal to 1, while the ratio of kinetic energy to sliding energy of hard coal is greater than 1. The proportion of strain energy of hard coal specimens is larger, indicating that the crushing forms of soft and hard coal bodies are different in the post-peak stage. As the hole increases, the energy of the coal body during the period of fragmentation decreases and the kinetic energy, sliding energy, and strain energy also decrease, such as for soft coal specimens S1 and S2 where the strain energy decreases from 3.23 kJ to 2.57 kJ with the expansion of the hole. At the same time, the sliding energy ratio of large-aperture specimens and small-aperture specimens after the crushing peak is also more obviously different and the ratio of sliding energy of large-aperture coal is slightly smaller than that of small-aperture coal, for which the sliding energy dropped from 3.79 to 2.89, indicating that the ratio of sliding energy decreases with the increase in the aperture.
Apart from PFC2D, more novel and strong numerical methods have been recently proposed for the fracture analysis of composites. Among them, the “Extended Finite Element” and “Bezier” methods proved to have a higher stability and accuracy than other numerical methods. Swati [
30] utilizes a generic material model of structures to simulate the initiation and propagation of 2D and 3D microcracks. This study simplifies the application of the extended finite element method in predicting multiple cracks applied to carbon fiber-reinforced composites (CFRC), thereby providing a recently developed extended cohesive damage model that provides a better understanding. Hossein Kabir [
31] extends a robust multi-step approach based on Bezier curves and shows that GnP with the largest aspect ratio is most effective for enhancing the elastic properties of the plate and potentially limiting edge crack growth.


