Article

A Decision-Making Model for Remanufacturing Facility Location in Underdeveloped Countries: A Capacitated Facility Location Problem Approach

1
The Key Laboratory of Metallurgical Equipment and Control Technology, Wuhan University of Science and Technology, Wuhan 430081, China
2
Hubei Key Laboratory of Mechanical Transmission and Manufacturing Engineering, Wuhan University of Science and Technology, Wuhan 430081, China
3
College of Mechanical Engineering, Hubei University of Automotive Technology, Shiyan 442002, China
4
Sevalo Construction Machinery Remanufacturing Co., Ltd., Wuhan 430040, China
*
Authors to whom correspondence should be addressed.
Sustainability 2022, 14(22), 15204; https://doi.org/10.3390/su142215204
Submission received: 27 October 2022 / Revised: 12 November 2022 / Accepted: 14 November 2022 / Published: 16 November 2022

Abstract

:
Underdeveloped countries are gradually opening remanufacturing facilities to recover end-of-life products (EOL). Locating these facilities in underdeveloped countries is quite challenging because many factors related to the environment, economics, and ethics have to be considered. This paper proposes a decision-making model for locating remanufacturing facilities, a critical factor in implementing remanufacturing in underdeveloped countries. Our principal objective is to obtain the capacity, number, and geographical locations for newly established remanufacturing facilities using a Capacitated Facility Location Problem (CFLP) approach. The mathematical model helps us find the number of facilities that will need to be opened to fully recover the EOL products and the total cost during the entire process. A case study on the establishment of SEVALO Remanufacturing Machinery Co., Ltd. in Cameroon is used to demonstrate the CFLP approach. The results and analyses show that the successful establishment of SEVALO in Cameroon will significantly help to reduce the quantity of construction machinery parts dumped into the environment.

1. Introduction

Due to the growing concerns over the environmental impact of end-of-life (EOL) products in underdeveloped countries, there have been calls for various recovery options for these EOL products, with remanufacturing being the most recommended. Many nations have massively adopted remanufacturing as an effective recovery option for EOL products due to its value-added opportunities in previous years [1]. Nowadays, remanufacturing is mainly carried out in developed countries and, to a lesser extent, in underdeveloped countries. Opening up remanufacturing facilities in underdeveloped countries is a step closer to absolute sustainability in these countries. However, opening new facilities requires decision making on the preferable locations of remanufacturing centers, collecting facilities, storage facilities, etc. [2]. With the poor establishment of infrastructures and an unpredictable supply chain system in underdeveloped countries, it is much more challenging to determine the geographical location for new facilities while considering the economic, social, and environmental benefits [3,4]. With the recent technological advancements in facility location, it has become an indispensable factor for companies to solve the facility location problem. Facility location has a weighty impact not only on the company but also on customers. A poorly located facility causes an increase in the overall capital, inventory, and transportation cost and degrades customer service [5]. The geographic locations, inventory, setup operation, management of production, and transportation cost (both monetary and ecological) of EOL products to remanufacturing centers are vital contributors to the general supply chain performance. These factors enable the proper establishment of a reverse logistics network for EOL products’ complete or partial recovery [6,7].
Underdeveloped countries often suffer from environmental pollution due to the poor location of infrastructures such as production plants, factories, storage facilities, etc. They are generally located close to human habitats, which causes health issues for nearby inhabitants [8]. Moreover, waste collecting facilities are not well located, which leads to people creating illegal dumpsites leading to difficulties in EOL product recovery. Underdeveloped countries have their objectives fixed on boosting their economy to be on the same level as developed countries. This means that the average annual amount of waste product generated will gradually increase, and with little or no remanufacturing facilities in place, they will gradually accumulate with time [9]. Facility location is a significant threat that underdeveloped countries need to tackle early enough. Otherwise, it will become more complicated in the future because these countries will be more focused on constructing more infrastructures than on managing the waste generated during the entire process [10]. Underdeveloped countries have poor urban planning due to the poor application of infrastructure location, be it hospitals, banks, private buildings, etc. This leads to a random location of facilities, and accessibility becomes quite challenging. Remanufacturing typically has an independent supply chain consisting of collecting facilities, warehouses, remanufacturing facilities, customers, and in some rare cases, disassembly facilities. The successful location of remanufacturing facilities is dependent on these other facilities [11]. Finding a database with geographical locations of collecting facilities is indispensable to the successful establishment of remanufacturing facilities in underdeveloped countries [12].
The proper location of facilities in underdeveloped countries ensures smooth and sustainable development. The establishment of a proper reverse logistic network system through the proper location of facilities will aid in the construction of a transportation network system. This will make it easier for other domains to equally develop and expand. In developed countries, there is a consistent pattern in the location of facilities which facilitates the smooth running of the remanufacturing supply chain and limits waste and energy dissipations. Applying these same strategies in underdeveloped countries will help establish a certain level of organization as the foundation of their development process. This will cover all three pillars of sustainability: environmentally through the reduction of pollution, economically through the increase in the country’s GDP, and socially through the creation of jobs for the citizens [3].
Various mathematical models to solve facility location problems have been proposed by previous researchers [13,14,15,16]. This research proposes a remanufacturing facility location decision-making model using the capacitated facility location problem (CFLP) model. CFLP is a location analysis, operations research, computational geometry, and optimal placement of facilities to minimize costs while considering factors such as the environmental impact on the surrounding environment. It is a branch of mixed-integer linear programming (MILP) used to obtain the terrestrial location of newly opened centers. “CFLP has been applied in the supply chain and reverse logistic network design for more than two decades” [17]. We gather information on the available dumpsites and waste communal facilities that will supply newly established facilities with remanufacturable EOL products. With this information and their respective geographical locations, we then use an MILP mathematical model to obtain the number of facilities, the capacity of each facility, the cost of opening each facility, and suitable locations for these remanufacturing facilities [18,19]. The formulation of this model changes depending on the problem parameters, whether it is a single or multi-product, one-time or multiple times while considering the stock level. Finding the optimal solution will take longer if there are too many constraints, so CFLP is the ideal model. We solved the mathematical model using IBM ILOG CPLEX Optimization Studio. An illustrative case is used in this paper to demonstrate the implementation of the model in a real-life situation. We used Cameroon as our illustrative case, with one of the leading remanufacturing companies in China, SEVALO Construction Machinery Remanufacturing Co. Ltd., Wuhan, China, opening its facilities in Cameroon.
The remaining outline of this research is presented as follows. Section 2 reviews the literature on remanufacturing facility location problem models. Section 3 shows the CFLP formulation and the current network. Section 4 gives an illustrative case for Cameroon and SEVALO; Section 5 comments on the results, research gaps, and future works; and Section 6 is the conclusion.

2. Literature Review

The first research on facility location dates far to 1929 when Weber studied warehouse location problems to diminish the total distance covered from the storage facility to the customers [20]. Much research has been conducted on CFLPs, which applies to medicine, state security, economy, business, politics, etc. These facilities could be an emergency center, a waste-dumping site, a collecting facility, a logistics center, a bank, etc., that needs to be located [5,19,21]. When making decisions on facility location, specific models (e.g., [22,23,24]) are inappropriate because they cannot correctly allocate resources to various facilities.
Based on previous research, formulating and computing CFLPs can be categorized into two main types: exact solution/modeling and heuristic methods. Some of the papers selected used either of these methods described in this literature review. Sandeep Silwal [25] proposed a stochastic optimization model for locating facilities based on the geometric quantity of uniform points. Wang et al. [26] studied the various algorithms for tackling emergency facility location problems. In their research, they proposed probabilistic and stochastic mathematical models. Wu et al. [27] proposed a controlled learning-driven heuristic algorithm for solving capacitated facility location and production planning. Chouksey et al. [28] developed a MILP model for capacitated facility location-allocation problems for maternal healthcare facilities in India. Han et al. [29] also designed a “mixed-integer programming” (MIP) model-based benders decomposition model for enhancing dynamic facility location-allocation for the maintenance of agricultural machinery. Zhu et al. [30] recommended a two-stage robust facility location problem with drones, mainly focusing on robust optimization. Bryne and Kalcsics [31] gave exact algorithms for five conditional location problems with continuous demand and polygonal barriers. Karagoz et al. [32] developed an interval type-2 fuzzy additive ratio assessment (ARAS) to evaluate end-of-life vehicle recycling facility locations. This is the first research that applied ARAS in the waste management area. Ryu and Park described “a branch-and-price algorithm for a single-source robust capacitated facility location under demand certainty” [33]. Biajolie et al. developed “a subjective random-key genetic algorithm for a two-stage capacitated facility location problem (TSCFLP) for transportation systems to minimize operational cost” [34]. Gadegaard et al. [35] proposed an enhanced cut-and-solve algorithm for a CFLP involving a sole supplier. Souto et al. [36] developed a hybrid mat-heuristic for TSCFLP using benchmark instances. Liu et al. [37] developed a mixed-integer quadratic program multi-commodity CFLP with complementarity demand functions. Saif & Delage [38] studied a data-driven distributional robust optimization model for CFLP. Chandra et al. [39] presented a non-convex MINLP model for installing wastewater treatment facilities. This research uses a multi-start neighborhood search and CFLP.
As far as remanufacturing facility location is concerned, we identified some past research work that used various methods for determining suitable locations for remanufacturing facilities. Lu and Bastel [40] studied a model that helps locate and allocate members and resources in a reverse logistics system, including remanufacturing. They suggested a 0–1 MILP model taking into consideration both forward and reverse logistics. They developed an algorithm based on lagrangian heuristics and tested its data from classical test problems. Abdulrahman et al. described “a strategic decision-making framework for Chinese auto-parts companies based on the analytic hierarchy process (AHP) to check the viability of remanufacturing” [41]. D’Adamo and Rosa [42] assessed industry remanufacturing based on a SWOT analysis and an AHP model. Deveci et al. described “an integrated neutrosophic decision-making model for remanufacturing facility location for automotive lithium-ion batteries” [43]. Du et al. [44] studied a decision-making model founded on “AHP-entropy weight and extension theory” for heavy machine tool remanufacturing. Deberg et al. [45] carried out an economic evaluation of the potential locations of a remanufacturing supply chain for robotic lawnmowers.
Several gaps have been identified in the previous research related to facility location problems in underdeveloped countries. As shown in Table 1, most research on facility location problems fails to incorporate production-planning processes. We also notice that almost no research talks about the possibility of applying the concept of facility location in underdeveloped countries. Moreover, few papers talk about multi-period and multi-product properties, probably due to the complex algorithms needed to design the programs. For simplicity, most papers just make assumptions such as single-period and single-product properties, but in reality, the situation is different and dynamic.
Although much research has been conducted on CFLPs for various facilities, few studies focus on CFLPs for remanufacturing facilities, more precisely in underdeveloped countries. The few studies on remanufacturing facility locations focus on companies with a well-designed supply chain network. Additionally, these facilities operate in an environment with an already well-established reverse logistics system, with fully operational collecting facilities and storage facilities. Almost no research focuses on the location of remanufacturing facilities in underdeveloped countries where the reverse logistics network is almost obsolete.

3. Materials and Methods

3.1. CFLP Formulation

The choice of using CFLP to solve the problems posed in this research is due to the fact that cost can be minimized. Determining a factory location that minimizes total weighted distances between suppliers and consumers is a common challenge since weights are a good indicator of how difficult it is to carry commodities. The answer to this issue offers the largest profit option while also effectively meeting all customers’ demands. Reverse logistic processes require specific facilities for the various activities to be carried out. We have collecting facilities, storage warehouses, remanufacturing facilities, and distribution centers. There are vehicles involved in transporting products from one facility to the other. For this study, we determine the geographic location of remanufacturing facilities. We use the CFLP model because of its positive feedback on real-life situations. The CFLP model is preferred to other models to find out the capacity, number, and geographical locations of newly opened remanufacturing facilities. On the other hand, the uncapacitated model does not consider the capacity of the various facilities. This is not suitable for our case, given that we aim to obtain a specific number of factories that need to be opened to recover the EOL products fully. This gives the specifics that facilitate the establishment of these facilities. From this model, the following questions can be answered: (1) the number of remanufacturing facilities required, (2) the optimal geographical location of remanufacturing centers, (3) the capability of each remanufacturing facility, (4) which remanufacturing center gets primary product from which collecting facility, and (5) the amount of investment. Here, we consider two facilities for our study: collecting and remanufacturing facilities. This is to simplify the number of variables in the CFLP model.
Let R = {1, ..., i} represent the set of remanufacturing centers, C = {1, ..., j} represent the set of collection facilities. Let G (RC, F) be a complete bipartite graph, where F is a set of arcs (m,n) with mR and n ⊂ C. Let Dn be the n-th client demand, fm be the cost of opening remanufacturing facility m, and cmn be the cost of sending products from facility m to collection facility n. Every remanufacturing facility m has a capacity Sm. Let ym be the binary variable associated with a condition of each facility m. If it equals 1, facility m is open, R ⊂ S, otherwise facility m is close. Let xmn be a continuous variable function that expresses the fraction of collection facility n’s demand satisfied by remanufacturing facility m [17]. We formulate the CFLP model based on the following equations:
M i n m R n C c m n ( D n ) x m n + m R f m y m                                              
Such that
m R X m n = 1                                         n C                                        
n C x m n ( D n )     m R s m y m             m R                                      
x m n     y m                                     m R ,   n C                              
y m     { 0 , 1 }                                           m R                                  
From the above equations, we can see that Equation (1) ensures the total cost is minimized, and Equation (2) guarantees the satisfaction of each client’s demand. Capacity constraint (3) ensures that the amount of product supplied by a remanufacturing facility does not surpass its production capacity. Equation (4) ensures that a non-operational facility does not supply any products to clients and ensures the non-negativity of the fraction of the client’s demand. Equation (5) gives binary values to yi variables. Combining the above constraints is used to answer the five questions raised above.

3.2. Current Network

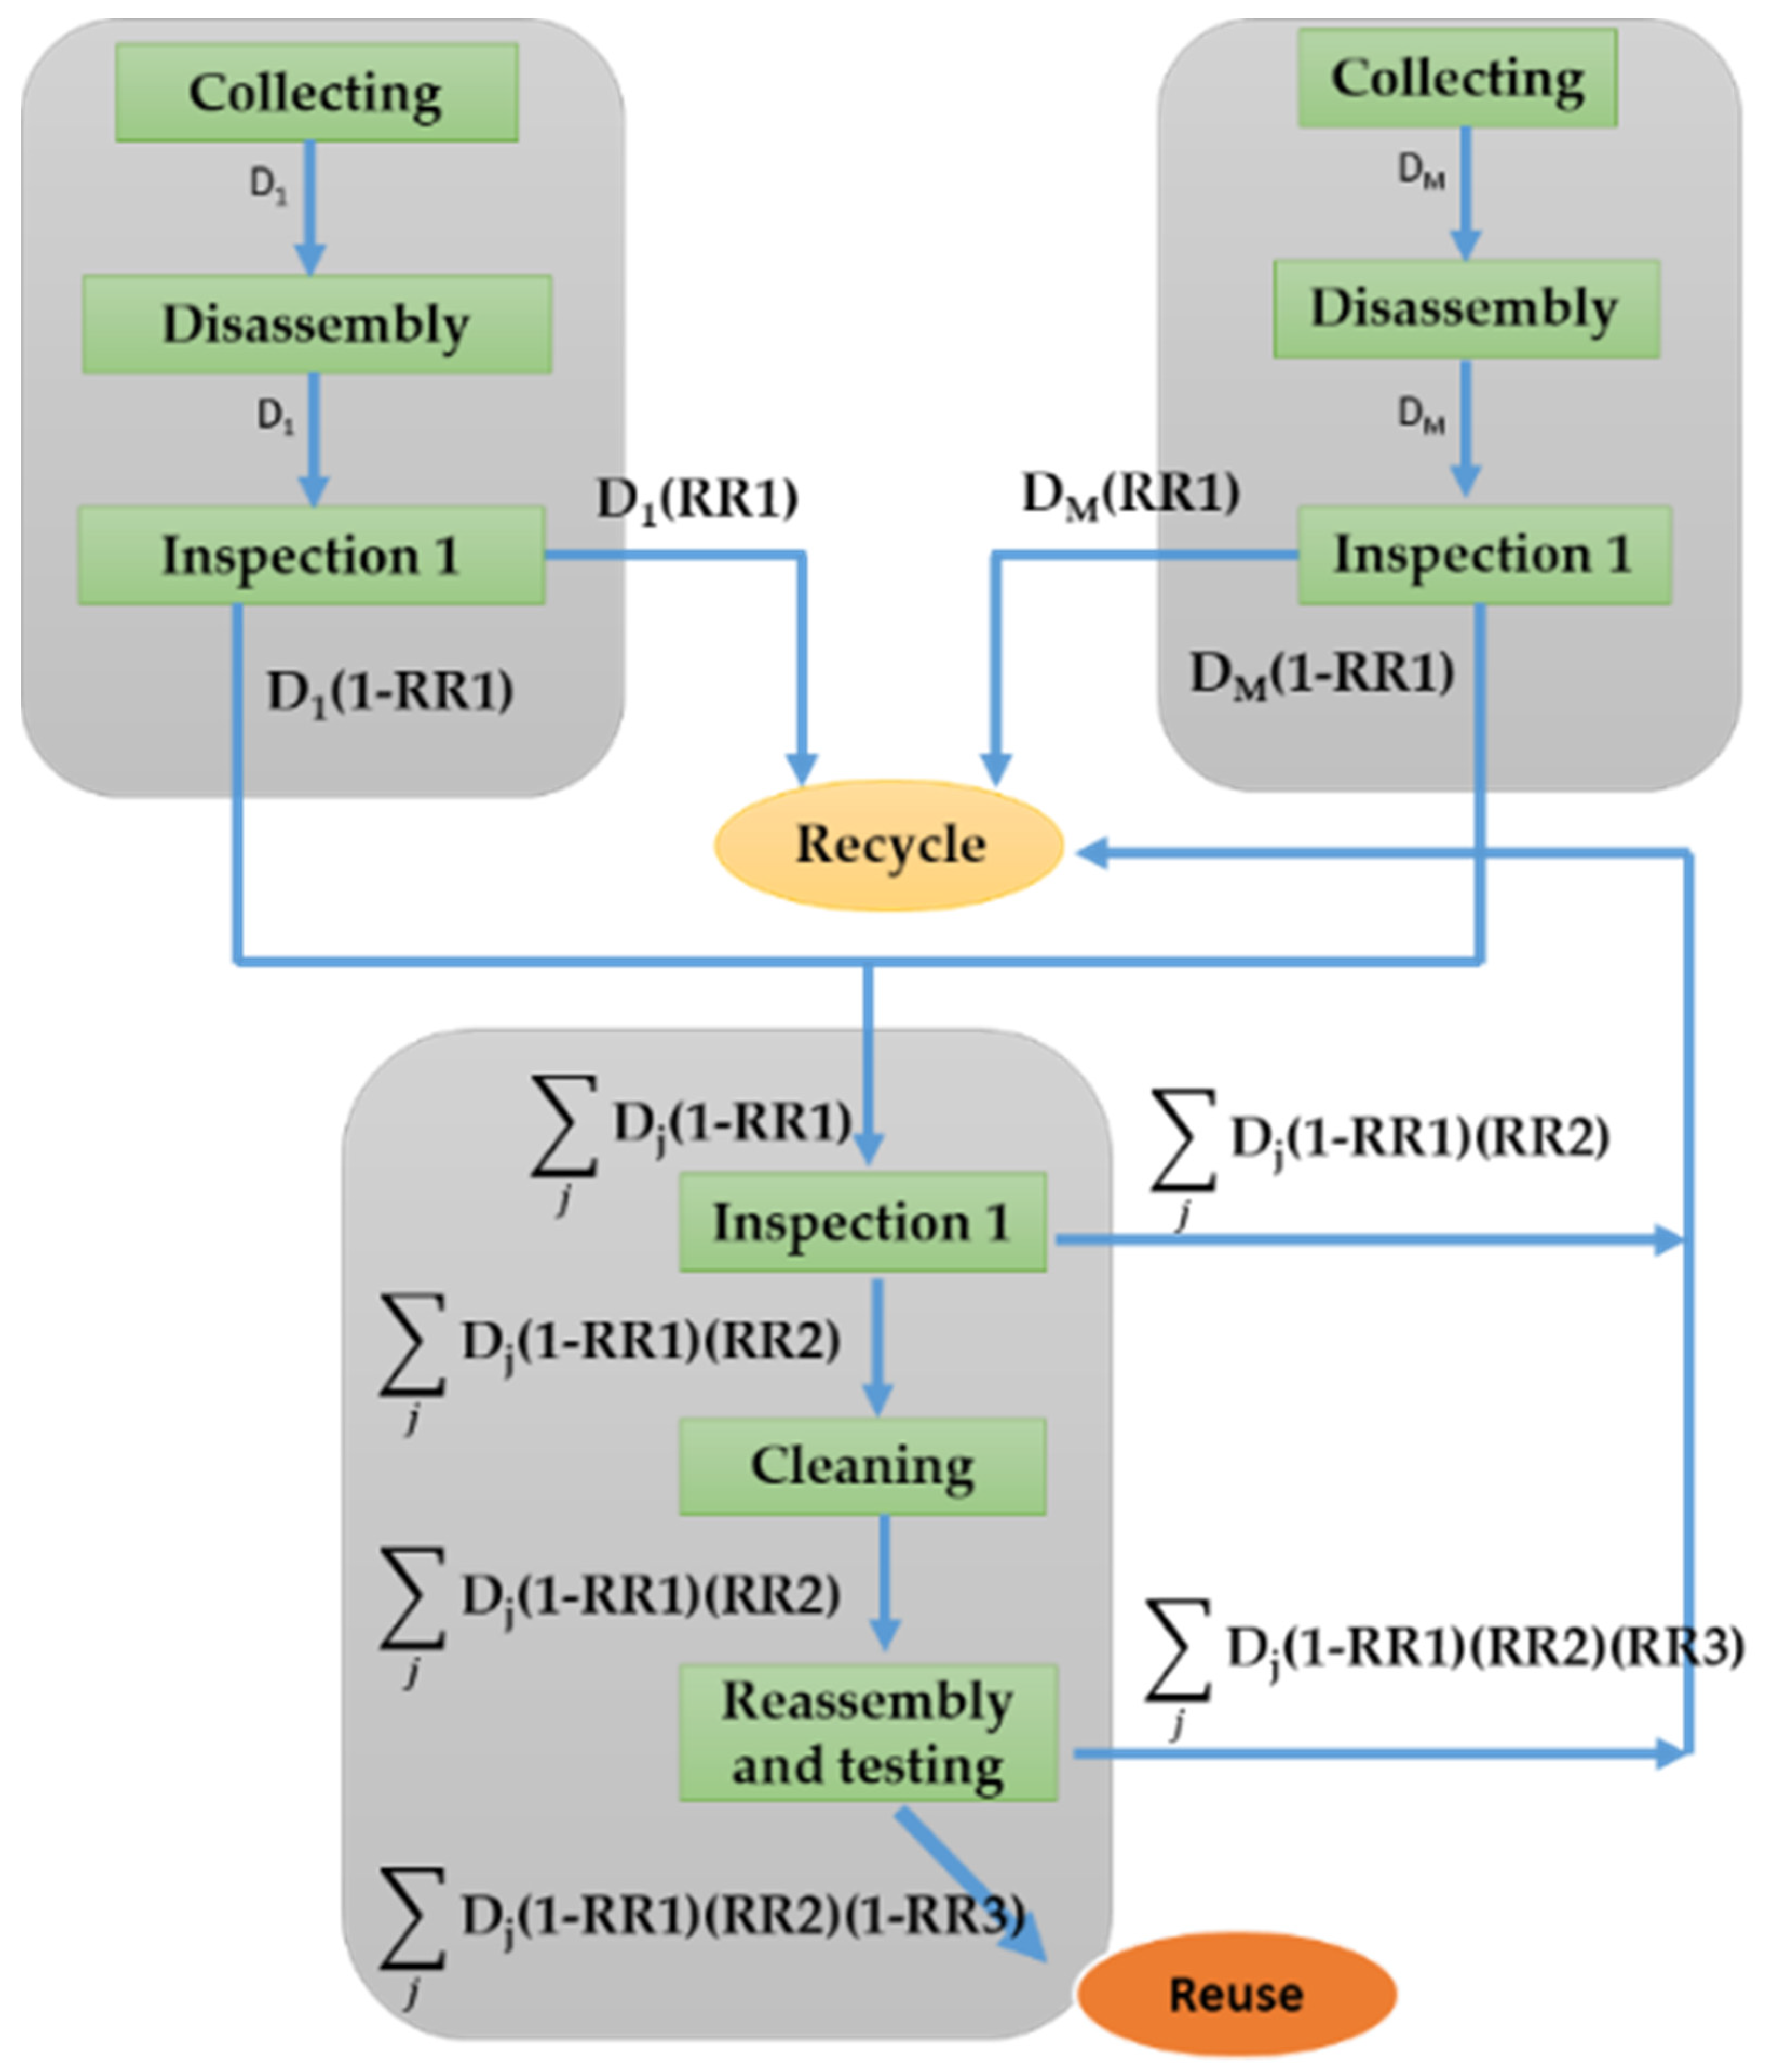
The complete process here is as follows; customers with worn-out tractors who seek to obtain a good-as-new one send their products to collecting facilities, and they specify the customization they will need for their tractors. Collecting facilities can also collect the products themselves, acting as a separate entity. The collecting facility disassembles and inspects the various parts, discards the unusable parts, and the remanufacturable parts are transported to remanufacturing facilities (NB: the remanufacturing facility does not cover the transportation fee here). Here, the return rate is RR1 (the percentage of returned products for recycling). The inspected products arrive at the remanufacturing facilities with the customization information (if the customers want their tractors to be customized). The remanufacturing facility then proceeds with the second round of inspection that aims to discard the non-needed parts and keep the parts that will undergo the subsequent processes. The return rate here is labeled as RR2. The subsequent processes are cleaning, repair, reassembling, and testing. After testing, the non-working products are rejected, and the return rate here is RR3. The complete system is demonstrated in Figure 1 below. The remanufactured product is then transported to the necessary collecting facility based on the previous demands.
The cost function considers monetary and environmental impact factors, precisely carbon emissions. The data used for this model consist of the demand of each collecting facility, the cost of opening a new and functional remanufacturing center, the cost of transporting a product from remanufacturing facilities to collecting facilities, and reprocessing cost for each remanufacturing facility. From the current data, an estimation of the demand for each collection facility can be obtained. These data can change over the years for individual collection facilities, but the total will remain constant. There are certain factors that are indispensable in the opening of new facilities, and they include the space required in constructing the facility, the machines required for processing, and the elements needed to run the machines, such as water, electricity, diesel, etc. These factors are inter-dependent, and all need to be in place before a facility can be opened. In this case, the production cost is dependent on the capacity of that facility. For simplicity, this cost is calculated based on the capacity of each remanufacturing facility and added to the opening cost and transportation cost to obtain the total cost. This cost is assumed to be fixed for each product, so we just multiply it by the total number of products. The remaining cost, other than opening costs, include: (a) the fuel consumption and capacity of the transportation vehicles dictate the transportation cost. (b) the production cost comprises the quantity of energy consumed during the whole remanufacturing process of the products (machines and extra materials needed). The amount of energy consumed by individual machines is estimated. If we assume that the remanufacturing processes remain the same, then the remanufacturing process cost will only depend on the annual demand from collecting facilities.

4. Illustrative Case

4.1. Background

The case study involves determining the geographical location of SEVALO Construction Machinery Remanufacturing Co. Ltd. facilities in Cameroon. SEVALO is a Chinese company based in China. It has branches in various cities in China and other countries in Europe and South America. The total number of tractors imported has increased from 700 tractors in 1982 to about 15,000 tractors by 2020. Most of these tractors are either out of use or in poor condition. SEVALO does not have collection facilities in Cameroon, and they will not need to establish their facilities since retailers do the collection. This reduces their workload to just remanufacturing processes.
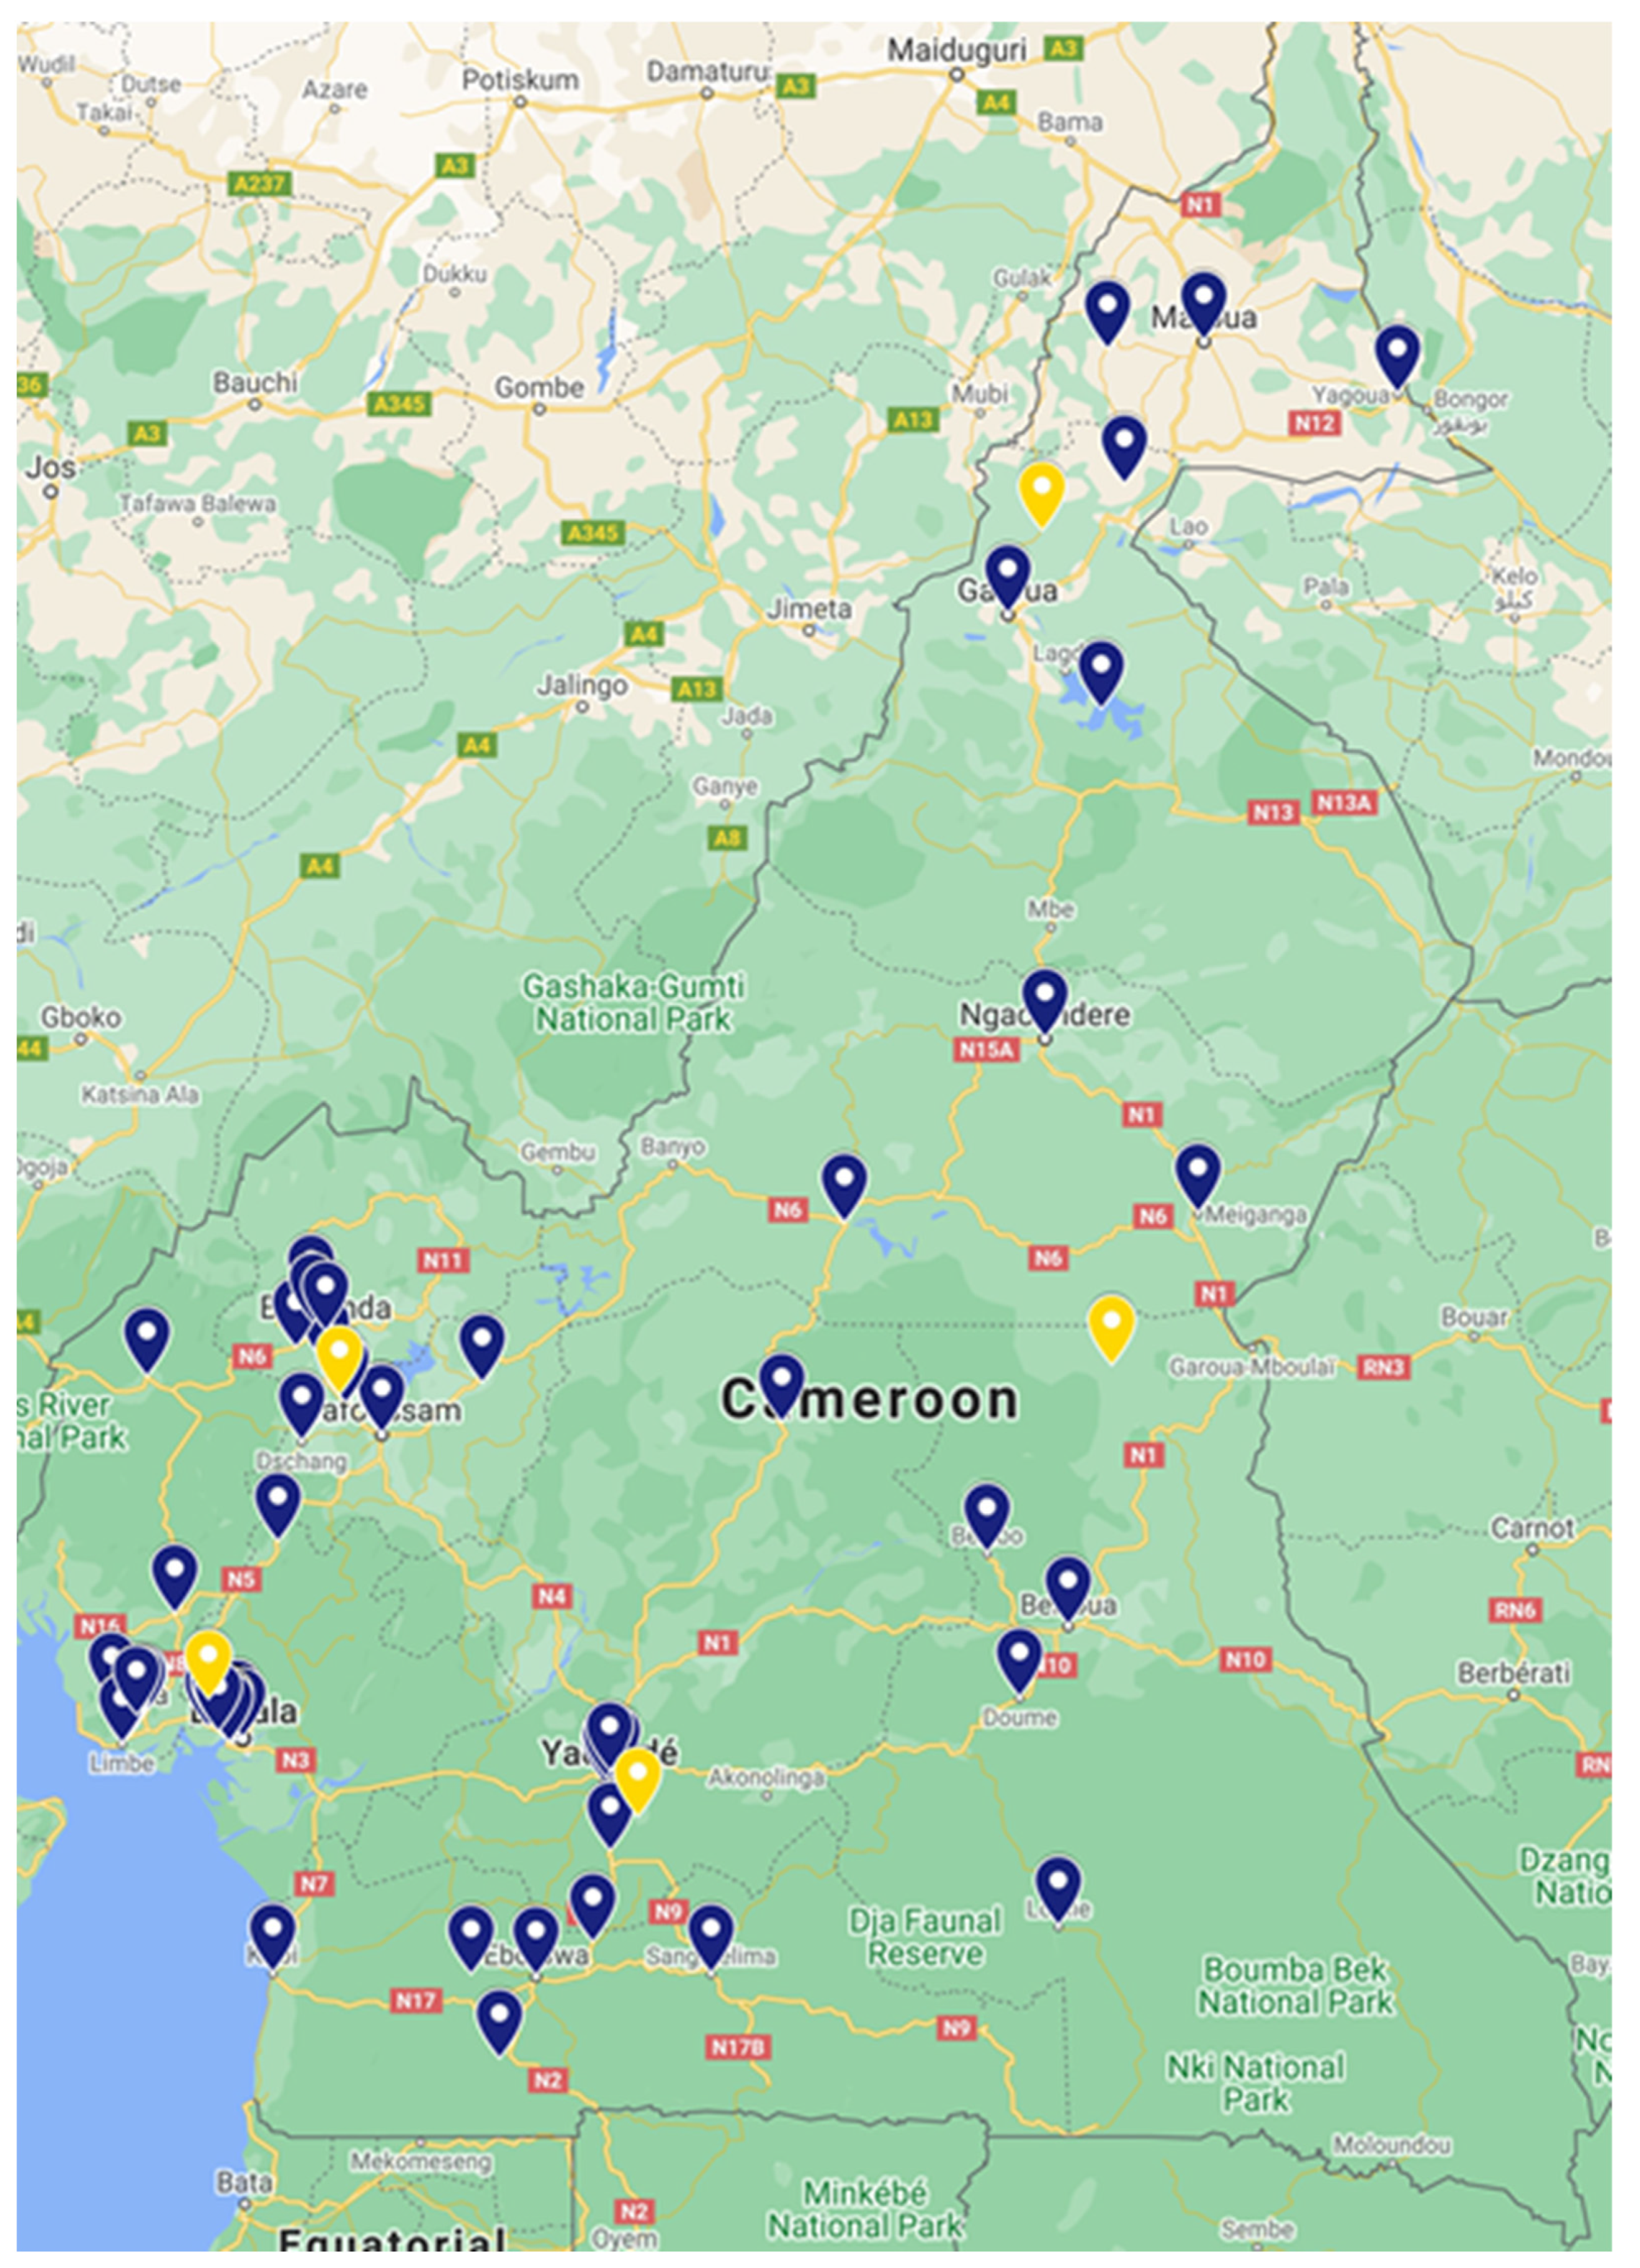
Figure 2 displays the terrestrial location of the 67 collecting facilities in Cameroon. They are spread across all ten regions of the country. We notice that most of these facilities are located in the southwestern part of the country due to their superior population, notably the city of Douala. These locations are collected from HYSACAM (Hygiene and sanitary of Cameroon), the main company that collects waste products in the country, and it has branches in many regions. Other private companies collect vehicle parts through a house-to-house collection, which is quite effective with high returns. The most common method here is the “trade by barter method”, an ancient collection method whereby the collector either pays a certain amount or exchanges one EOL product for the other. These facilities are independent of each other because no remanufacturing facility enables them to remanufacture the products they collect.

4.2. CFLP Model Reformulation

The CFLP model is a more advanced model compared to the model proposed by Wu et al. [46]. The single product is the tractor, and they will be circulating between the 67 collecting facilities available and the new remanufacturing facilities to be opened. We reformulate the CFLP based on our illustrative case with more specific variables and values. Table 2 below defines the various variables.
For the calculation of UTCmn, we multiply the distance between remanufacturing facility m and collecting facility n (dmn), and we use the transportation cost for a single product as shown in formula (6). When computing the value for transportation cost, we consider the drop in the quantity of product at each stage since there is a decrease in the flow of material caused by RR1, RR2, and RR3; see Figure 3.
U T C m n = ( U T C ) d m n                               m R ,   n C
c m n ( D n ) = ( U T C m n ) [ D n [ 1 1 ( R R 2 ) + ( 1 R R 3 ) ] ] + ( U R C + U I C ) [ D n ] + U I C . D n [ 1 1 R R 2 ]            
Figure 3 above shows the material flow from the collecting facilities to the remanufacturing facilities and vice-versa. There are three inspection stages during which unwanted products are channeled for recycling. This value decreases along with the flowchart. The disassembling is conducted by the collecting facilities, which makes the remanufacturing process more accessible by reducing the steps and the number of machines needed for disassembling processes. The flowchart shows that every product is recovered, either remanufactured, repaired, or recycled.

4.3. Proposed Mathematical Model

The model used is similar to that proposed in the CFLP formulation above. We now consider the returns after the various inspections and the 67 collecting facilities already available. The mathematical model is shown below.
M i n   m n c m n ( D n ) x m n + m k f m k y m k                                                                  
m R x m n = ( 1 R R 1 ) ( 1 R R 2 )                         n C                                      
n C x m n ( D n ) k K s m k y m k                                       m R                              
x m n k K y m k                                                       m R , n C                        
0 k K y m k 1                                                         m R                            
y m k { 0 , 1 }                                                         m R ,   k K                          
The independent function (8) minimizes the following variables: transportation, reprocessing, and opening costs. Reducing unnecessary expenditures is very crucial at this stage because the entire process involves the construction of multiple facilities, and in the scenario where we neglect expenditures, the total cost will likely exceed the budget. We calculate the transportation cost in terms of the quantity of CO2 emitted into the environment rather than a monetary expense. By proceeding this way, we can achieve a positive impact on the environment. Equation (9) guarantees the satisfaction of every customer’s demands. Equation (10) makes sure that the remanufacturing facilities fulfill the demands of every customer and collecting facility. Moreover, Equation (11) ensures that customers can only be supplied from open facilities. In addition, the newly established remanufacturing facilities will have a fixed capacity upon opening, which is guaranteed by Equation (12). The fixed capacity will facilitate keeping track of various logistics and safeguards that demand is positive in all circumstances. Finally, Equation (13) confirms the availability of a facility to operate.
As mentioned earlier, the cost of moving the products from facility to facility is calculated in terms of the amount of CO2 emitted during the process and later converted to monetary value. In Cameroon, delivery vehicles mostly use diesel engines with an average consumption rate of 1 gallon per hour (gal/h). We then multiply the value by the number of hours needed to transport a product from one region to another to obtain the number of gallons used up. The price of diesel in Cameroon is 24.86 ¥ (Chinese renminbi) per gallon as of 4 October 2021, and the average speed of a delivery vehicle is 55 mph (89 km/h) [47]. The equation to obtain the unit transportation cost is shown in Equation (14).
UTC = Average   consumption   ( gal h ) × run   time   ( h ) × unit   price   ( ¥ gal )
We can obtain the monetary value for transporting products from one facility to another based on these data and the distance between the two facilities. There are 67 collection facilities spread across all ten regions of the country. We used the ten regions as base points rather than the facilities for simplicity. This implies that our calculations will be made regarding how much CO2 will be emitted when transporting a product from one region to the other. Table 3 below shows the ten regions available in Cameroon.
After following the procedures described above, we obtain the prices in Chinese Renminbi (CNY) for transporting products between cities. Table 4 below shows the unit cost of transportation between the country’s ten regions. Our calculations in the next section will be based on the values in the table.

5. Results and Discussion

We computed the mathematical model using Eclipse IDE and IBM ILOG CPLEX Optimization Studio [48]. We obtained the ideal solution by simulating different capacities based on the approximate number of tractors available (see Appendix A). We created different cases based on the capacity of each remanufacturing facility, and we assumed all facilities have the same capacity. Case 1 shows a capacity of remanufacturing 250 products annually. For the following cases, we use a step-up of 250 products for the capacity of each facility up to case 8. At the eighth simulation, we noticed a drop in the fluctuation of results, so we increased the step up to 500 products up to case 14, and for the rest of the cases, we used a step up of 1000 products. After a complete simulation of all 17 cases, we identified the best case as case 10, with the lowest total cost value. The production capacity of each remanufacturing center shows 3000 products annually, and it will require five facilities to be opened in five different regions to cover the whole country. To meet the annual product demand, each remanufacturing center will be equipped with four cleaning machines, four testing machines, three ovens, and three spraying machines.
The geographical locations of the collecting facilities and the remanufacturing centers are shown in Figure 4 below. The results obtained from the CFLP model propose opening five remanufacturing facilities from 67 possible locations in the optimal solution. The blue markers represent the collecting facilities in Cameroon, and the yellow markers represent the best locations for remanufacturing facilities. Table 4 above displays the results of the transportation cost, opening cost, and total cost based on the cases proposed. We observe an increase in transportation costs when there is an increase in the individual capacities of each facility. An increase in capacity reduces the total number of required facilities. This is because the EOL products are equally distributed between the remanufacturing centers. Transportation cost increases with a decrease in the number of remanufacturing centers because more vehicles are deployed to deliver products to the customers. The remanufacturing process per product costs an average of CNY 350,000 [49]. The amount is less expensive than manufacturing a new product, and it consumes a lot of raw material. So, installing a reverse logistics network is advantageous because it will reduce the consumption of raw materials. A significant drop in the use of raw materials will have a positive impact on the environment, hence, promoting environmental sustainability. Thus, the company carries out green production, with less material used and less material disposed of. Customers will benefit from this system because of the lower prices of remanufactured products.
As an observation from the results, we deduce that remanufacturing cost significantly affects the total budget and covers a more significant percentage of the total budget. Working out a proper production process plan that limits expenses will have a positive impact on the remanufacturing budget. This will enable the remanufacturing company to boost its productivity and profits.
From the results obtained above, the optimal solution shows that SEVALO needs to open five facilities in Cameroon, with each facility having the capacity to remanufacture 3000 products per year. The total cost for the year will be CNY 5,363,190,500 (Case 10 in Table 5 below. This amount includes the remanufacturing process cost, the opening of each facility, the running of each facility, and transportation costs. This amount will reduce from the second year onwards, given that the facilities will already be in place. The only variable costs will be the reprocessing cost, transportation cost, and keeping the company running (cost due to the company’s energy consumption). The values obtained are theoretical values and could be slightly different due to the remanufacturing process cost, which was assumed to be constant for each product. In a practical situation, the reprocessing cost is different for every product because the products are in different states upon arrival at the remanufacturing facilities.
We have obtained tangible results from our case study, which shows that opening five facilities at the various locations obtained will enable the full recovery of EOL construction machinery in Cameroon. It will also boost the subsequent sustainable development of the country, given that the entire process covers the three pillars of sustainability. The database of various locations of collection facilities is the determining factor in finding the subsequent location of remanufacturing facilities. This is to limit the cost of moving products between facilities, hence the application of the CFLP model in this research. From our case study, Cameroon will highly benefit from this research because it will attract more remanufacturing companies to open facilities in the country following the same pattern proposed in our study. The model used in this paper can be applied in any other underdeveloped country that seeks to eliminate EOL construction machinery from its environment. The model can be extended to other remanufacturable products such as electrical and electronic equipment (EEE), vehicles, processing machines, etc. The limitation of our research is the difficulty of having a database for collection facilities in underdeveloped countries. This is largely due to the lack of specific facilities for the collection of corresponding EOL products, which leads to the scattered disposal of EOL products. However, the establishment of remanufacturing facilities will be accompanied by consistent EOL collection facilities. Moreover, another limitation is the level of CO2 emissions during the remanufacturing processes at the facilities. Our model only takes into consideration the CO2 emission during the transportation process. This can be included in future work, which will ensure the sustainability of the remanufacturing processes.

6. Conclusions

Our objective in this paper was to determine the best geographical locations for newly established remanufacturing facilities in underdeveloped countries using a CFLP approach. We have conducted a literature review on previous work and identified gaps. We have proposed a model which can enable us to allocate optimal geographical locations for newly established remanufacturing facilities. The mathematical model aims at minimizing the expenses during the whole reverse logistic process, with transportation taken into consideration. The model also helps find the optimal capacity of each remanufacturing facility from the various possibilities. The CFLP model does not consider disassembly and testing processes at the collection facilities since these operations do not occur at the remanufacturing centers. They will not be at the expense of the remanufacturing company. Our research shows that opening remanufacturing facilities in underdeveloped countries will enhance sustainable development in underdeveloped countries, and it will create opportunities for other domains to develop in a sustainable manner. Underdeveloped countries will be able to eliminate the waste generated by EOL products; the remanufacturing facilities will boost the economy of the countries through the use of the remanufactured products, which are more affordable. Moreover, jobs will be created for the citizens. All of these factors combined will propel these countries towards absolute sustainability.
In future work, more research work could be conducted to extend the mathematical model such that the activities at the collection facilities can be taken into consideration since they are also reverse processes. Moreover, our model is not dynamic, and in real-life situations, the product flow is very unpredictable. A dynamic mathematical model that considers these uncertainties will be a step further in this research. At present, no database can be used to determine the allocation of return products to various collection facilities. Nevertheless, hopefully, the situation will change in the future and facilitate further studies. The paper will promote the opening of new facilities in underdeveloped countries, even foreign companies. In the long run, many companies will settle on promoting sustainable development.

Author Contributions

Conceptualization, R.F.F. and Z.J.; methodology, R.F.F.; software, R.F.F.; validation, Z.J., Q.G., and Y.Y.; formal analysis, Z.J. and Q.G.; investigation, R.F.F.; resources, Y.Y.; data curation, Y.Y.; writing—original draft preparation, R.F.F. and Z.J.; writing—review and editing, R.F.F.; supervision, Z.J. and Q.G.; project administration, Z.J. and Q.G.; funding acquisition, Z.J. All authors have read and agreed to the published version of the manuscript.

Funding

The research reported in this paper is supported by the Teaching Research Project of Wuhan University of Science and Technology (Yjg202006), The Scientific Research Project of the Education Department of Hubei Province (D20211803) and PhD Research Startup Foundation of Hubei University of Automotive Technology (BK202001).

Institutional Review Board Statement

Not applicable.

Informed Consent Statement

Not applicable.

Data Availability Statement

Not applicable.

Acknowledgments

We will like to thank SEVALO Construction Machinery Remanufacturing Co. Ltd, Wuhan, China for providing the necessary information to complete this research.

Conflicts of Interest

The authors declare that they have no known competing financial interests or personal relationships that could have appeared to influence the work reported in this paper.

Abbreviations

CFLPCapacitated-Facility Location Problem
TSCFLPTwo-stage Capacitated-Facility Location Problem
SLD heuristicSupervised Learning-driven heuristic
AHPAnalytic Heuristic Process
EOLEnd-of-life
MILP“Mixed-integer linear programming”
MINLP“Mixed-integer non-linear programming”
MIQP“Mixed-integer quadratic programming”
ARASAdditive Ratio Analysis
T2NN“Type-2 neutrosophic number”
CODAS“Combinative distance-based assessment”
SWOTStrength, weakness, opportunity, and threats
MIPMixed-integer programming
IT2FInterval Type-2 Fuzzy
BRKGABiased Random-key Genetic Algorithm

Appendix A

/*********************************************
  • * OPL 12.8.0.0 Model
  • * Author: Raoul Fonkoua Fofou
  • * Creation Date: Aug 27, 2021 at 8:22:25 PM
*********************************************/
//Capacitied Facility Location Problem (SEVALO Construction Machinery Remanufacturing Co. Ltd.)
 
//Indices
  • int rem_facility=...; range RF=1..rem_facility;
  • int coll_facility=...; range CF=1..coll_facility;
 
//Parameters
  • int fixcost[RF]=...;
  • int capacity[RF]=...;
  • int demand[CF]=...;
  • int transp_cost[RF][CF]=...;
 
//Decision Variables
  • dvar float+ Q[RF][CF];
  • dvar boolean y[RF];
 
dexpr float Totalcost=sum(i in RF, j in CF)Q[i][j]*transp_cost[i][j]+
                                             sum(i in RF)y[i]*fixcost[i];
minimize Totalcost;
subject to {
  •            forall(j in CF)
  •             sum(i in RF)Q[i][j]==demand[j];
 
  •            forall(i in RF)
  •             sum(j in CF)Q[i][j]<=capacity[i]*y[i];
}
/*********************************************
  • * OPL 12.8.0.0 Model
  • * Author: Raoul Fonkoua Fofou
  • * Creation Date: Aug 27, 2021 at 8:53:26 PM
*********************************************/
//Capacitied Facility Location Problem (SEVALO Construction Machinery Remanufacturing Co. Ltd.)
 
//Indices
  • int supp_region=...; range SR=1..supp_region;
  • int dem_region=...; range DR=1..dem_region;
 
//Parameters
  • int fixcost[SR]=...;
  • int capacity[SR]=...;
  • int demand[DR]=...;
  • int transp_cost[SR][DR]=...;
 
//Decision Variables
  • dvar float+ Q[SR][DR];
  • dvar boolean y[SR];
 
dexpr float Totalcost=sum(i in SR, j in DR)Q[i][j]*transp_cost[i][j]+
                                             sum(i in SR)y[i]*fixcost[i];
minimize Totalcost;
subject to{
  •            forall(j in DR)
  •             sum(i in SR)Q[i][j]==demand[j];
 
  •            forall(i in SR)
  •             sum(j in DR)Q[i][j]<=capacity[i]*y[i];
}

References

  1. Fofou, R.F.; Jiang, Z.; Wang, Y. A review on the lifecycle strategies enhancing remanufacturing. Appl. Sci. 2021, 11, 5937. [Google Scholar] [CrossRef]
  2. Ahmed, R.R.; Zhang, X. Multi-stage network-based two-type cost minimization for the reverse logistics management of inert construction waste. Waste Manag. 2021, 120, 805–819. [Google Scholar] [CrossRef] [PubMed]
  3. Hauschild, M.Z.; Kara, S.; Røpke, I. Absolute sustainability: Challenges to life cycle engineering. CIRP Ann. 2020, 69, 533–553. [Google Scholar] [CrossRef]
  4. Doni, F.; Corvino, A.; Bianchi Martini, S. Servitization and sustainability actions. Evidence from European manufacturing companies. J. Environ. Manag. 2019, 234, 367–378. [Google Scholar] [CrossRef]
  5. Ahmadi-Javid, A.; Seyedi, P.; Syam, S.S. A survey of healthcare facility location. Comput. Oper. Res. 2017, 79, 223–263. [Google Scholar] [CrossRef]
  6. Girma, Y.; Terefe, H.; Pauleit, S.; Kindu, M. Urban green infrastructure planning in Ethiopia: The case of emerging towns of Oromia special zone surrounding Finfinne. J. Urban Manag. 2019, 8, 75–88. [Google Scholar] [CrossRef]
  7. Romero-Duque, L.P.; Trilleras, J.M.; Castellarini, F.; Quijas, S. Ecosystem services in urban ecological infrastructure of Latin America and the Caribbean: How do they contribute to urban planning? Sci. Total Environ. 2020, 728, 138780. [Google Scholar] [CrossRef]
  8. Makvandi, M.; Li, B.; Elsadek, M.; Khodabakhshi, Z.; Ahmadi, M. The Interactive Impact of Building Diversity on the Thermal Balance and Micro-Climate Change under the Influence of Rapid Urbanization. Sustainability 2019, 11, 1662. [Google Scholar] [CrossRef] [Green Version]
  9. Ochola, E.M.; Fakharizadehshirazi, E.; Adimo, A.O.; Mukundi, J.B.; Wesonga, J.M.; Sodoudi, S. Inter-local climate zone differentiation of land surface temperatures for Management of Urban Heat in Nairobi City, Kenya. Urban Clim. 2020, 31, 100540. [Google Scholar] [CrossRef]
  10. Chen, W.Y. The role of urban green infrastructure in offsetting carbon emissions in 35 major Chinese cities: A nationwide estimate. Cities 2015, 44, 112–120. [Google Scholar] [CrossRef]
  11. Garcia Martin, P.C.; Schroeder, A.; Ziaee Bigdeli, A. The value architecture of servitization: Expanding the research scope. J. Bus. Res. 2019, 104, 438–449. [Google Scholar] [CrossRef]
  12. Xing, Y.; Liu, Y.; Tarba, S.; Cooper, S.C.L. Servitization in mergers and acquisitions: Manufacturing firms venturing from emerging markets into advanced economies. Int. J. Prod. Econ. 2017, 192, 9–18. [Google Scholar] [CrossRef] [Green Version]
  13. Liang, Z.; He, Y.; Wu, T.; Zhang, C. An informative column generation and decomposition method for a production planning and facility location problem. Int. J. Prod. Econ. 2015, 170, 88–96. [Google Scholar] [CrossRef]
  14. Wu, T.; Shi, Z.; Liang, Z.; Zhang, X.; Zhang, C. Dantzig-Wolfe decomposition for the facility location and production planning problem. Comput. Oper. Res. 2020, 124, 105068. [Google Scholar] [CrossRef]
  15. Sharkey, T.C.; Geunes, J.; Edwin Romeijn, H.; Shen, Z.J.M. Exact algorithms for integrated facility location and production planning problems. Nav. Res. Logist. 2011, 58, 419–436. [Google Scholar] [CrossRef] [Green Version]
  16. Romeijn, H.E.; Sharkey, T.C.; Shen, Z.J.M.; Zhang, J. Integrating facility location and production planning decisions. Networks 2010, 55, 78–89. [Google Scholar] [CrossRef] [Green Version]
  17. Kizilboga, G.; Mandil, G.; Genevois, M.E.; Zwolinski, P. Remanufacturing Network Design Modeling: A Case of Diesel Particulate Filter. Procedia CIRP 2013, 11, 163–168. [Google Scholar] [CrossRef]
  18. Fernández, E.; Landete, M. Fixed-Charge Facility Location Problems. Locat. Sci. 2015, 47–77. [Google Scholar] [CrossRef]
  19. Farahani, R.Z.; Hekmatfar, M.; Fahimnia, B.; Kazemzadeh, N. Hierarchical facility location problem: Models, classifications, techniques, and applications. Comput. Ind. Eng. 2014, 68, 104–117. [Google Scholar] [CrossRef]
  20. Weber, A.; Friedrich, C.J.; Cooke, F.B. Alfred Weber’s Theory of the Location of Industries. Geogr. J. 1930. Available online: https://agris.fao.org/agris-search/search.do?recordID=US201300608114 (accessed on 22 March 2022).
  21. Farahani, R.Z.; Fallah, S.; Ruiz, R.; Hosseini, S.; Asgari, N. OR models in urban service facility location: A critical review of applications and future developments. Eur. J. Oper. Res. 2019, 276, 1–27. [Google Scholar] [CrossRef]
  22. Lin, Y.H.; Tian, Q. Branch-and-cut approach based on generalized benders decomposition for facility location with limited choice rule. Eur. J. Oper. Res. 2021, 293, 109–119. [Google Scholar] [CrossRef]
  23. Silva, A.; Aloise, D.; Coelho, L.C.; Rocha, C. Heuristics for the dynamic facility location problem with modular capacities. Eur. J. Oper. Res. 2021, 290, 435–452. [Google Scholar] [CrossRef]
  24. Wei, M.; Qi, M.; Wu, T.; Zhang, C. Distance and matching-induced search algorithm for the multi-level lot-sizing problem with substitutable bill of materials. Eur. J. Oper. Res. 2019, 277, 521–541. [Google Scholar] [CrossRef]
  25. Silwal, S. A concentration inequality for the facility location problem. Oper. Res. Lett. 2022, 50, 213–217. [Google Scholar] [CrossRef]
  26. Wang, W.; Wu, S.; Wang, S.; Zhen, L.; Qu, X. Emergency facility location problems in logistics: Status and perspectives. Transp. Res. Part E Logist. Transp. Rev. 2021, 154, 102465. [Google Scholar] [CrossRef]
  27. Wu, T.; Huang, L.; Liang, Z.; Zhang, X.; Zhang, C. A supervised learning-driven heuristic for solving the facility location and production planning problem. Eur. J. Oper. Res. 2021, 301, 785–796. [Google Scholar] [CrossRef]
  28. Chouksey, A.; Agrawal, A.K.; Tanksale, A.N. A hierarchical capacitated facility location-allocation model for planning maternal healthcare facilities in India. Comput. Ind. Eng. 2022, 167, 107991. [Google Scholar] [CrossRef]
  29. Han, J.; Zhang, J.; Zeng, B.; Mao, M. Optimizing dynamic facility location-allocation for agricultural machinery maintenance using Benders decomposition. Omega 2021, 105, 102498. [Google Scholar] [CrossRef]
  30. Zhu, T.; Boyles, S.D.; Unnikrishnan, A. Two-stage robust facility location problem with drones. Transp. Res. Part C Emerg. Technol. 2022, 137, 103563. [Google Scholar] [CrossRef]
  31. Byrne, T.; Kalcsics, J. Conditional facility location problems with continuous demand and a polygonal barrier. Eur. J. Oper. Res. 2022, 296, 22–43. [Google Scholar] [CrossRef]
  32. Karagöz, S.; Deveci, M.; Simic, V.; Aydin, N. Interval type-2 Fuzzy ARAS method for recycling facility location problems. Appl. Soft Comput. 2021, 102, 107107. [Google Scholar] [CrossRef]
  33. Ryu, J.; Park, S. A branch-and-price algorithm for the robust single-source capacitated facility location problem under demand uncertainty. EURO J. Transp. Logist. 2022, 11, 100069. [Google Scholar] [CrossRef]
  34. Biajoli, F.L.; Chaves, A.A.; Lorena, L.A.N. A biased random-key genetic algorithm for the two-stage capacitated facility location problem. Expert Syst. Appl. 2019, 115, 418–426. [Google Scholar] [CrossRef]
  35. Gadegaard, S.L.; Klose, A.; Nielsen, L.R. An improved cut-and-solve algorithm for the single-source capacitated facility location problem. EURO J. Comput. Optim. 2018, 6, 1–27. [Google Scholar] [CrossRef] [Green Version]
  36. Souto, G.; Morais, I.; Mauri, G.R.; Ribeiro, G.M.; González, P.H. A hybrid matheuristic for the Two-Stage Capacitated Facility Location problem. Expert Syst. Appl. 2021, 185, 115501. [Google Scholar] [CrossRef]
  37. Liu, W.; Kong, N.; Wang, M.; Zhang, L. Sustainable multi-commodity capacitated facility location problem with complementarity demand functions. Transp. Res. Part E Logist. Transp. Rev. 2021, 145, 102165. [Google Scholar] [CrossRef]
  38. Saif, A.; Delage, E. Data-driven distributionally robust capacitated facility location problem. Eur. J. Oper. Res. 2021, 291, 995–1007. [Google Scholar] [CrossRef]
  39. Chandra, S.; Sarkhel, M.; Vatsa, A.K. Capacitated facility location–allocation problem for wastewater treatment in an industrial cluster. Comput. Oper. Res. 2021, 132, 105338. [Google Scholar] [CrossRef]
  40. Lu, Z.; Bostel, N. A facility location model for logistics systems including reverse flows: The case of remanufacturing activities. Comput. Oper. Res. 2007, 34, 299–323. [Google Scholar] [CrossRef]
  41. Abdulrahman, M.D.A.; Subramanian, N.; Liu, C.; Shu, C. Viability of remanufacturing practice: A strategic decision making framework for Chinese auto-parts companies. J. Clean. Prod. 2015, 105, 311–323. [Google Scholar] [CrossRef]
  42. D’Adamo, I.; Rosa, P. Remanufacturing in industry: Advices from the field. Int. J. Adv. Manuf. Technol. 2016, 86, 2575–2584. [Google Scholar] [CrossRef]
  43. Deveci, M.; Simic, V.; Torkayesh, A.E. Remanufacturing facility location for automotive Lithium-ion batteries: An integrated neutrosophic decision-making model. J. Clean. Prod. 2021, 317, 128438. [Google Scholar] [CrossRef]
  44. Du, Y.; Zheng, Y.; Wu, G.; Tang, Y. Decision-making method of heavy-duty machine tool remanufacturing based on AHP-entropy weight and extension theory. J. Clean. Prod. 2020, 252, 119607. [Google Scholar] [CrossRef]
  45. Duberg, J.V.; Johansson, G.; Sundin, E.; Tang, O. Economic evaluation of potential locations for remanufacturing in an extended supply chain—A case study on robotic lawn mowers. Procedia CIRP 2020, 90, 14–18. [Google Scholar] [CrossRef]
  46. Wu, L.Y.; Zhang, X.S.; Zhang, J.L. Capacitated facility location problem with general setup cost. Comput. Oper. Res. 2006, 33, 1226–1241. [Google Scholar] [CrossRef]
  47. GlobalPetrolPrices.com. Diesel Prices Around the World, 22 June 2015. 2015. Available online: http://www.globalpetrolprices.com/diesel_prices/ (accessed on 11 October 2021).
  48. ILOG CPLEX Optimization Studio | IBM. Available online: https://www.ibm.com/products/ilog-cplex-optimization-studio (accessed on 12 November 2022).
  49. Jiang, Z.; Ding, Z.; Liu, Y.; Wang, Y.; Hu, X.; Yang, Y. A data-driven based decomposition–integration method for remanufacturing cost prediction of end-of-life products. Robot. Comput. Integr. Manuf. 2020, 61, 101838. [Google Scholar] [CrossRef]
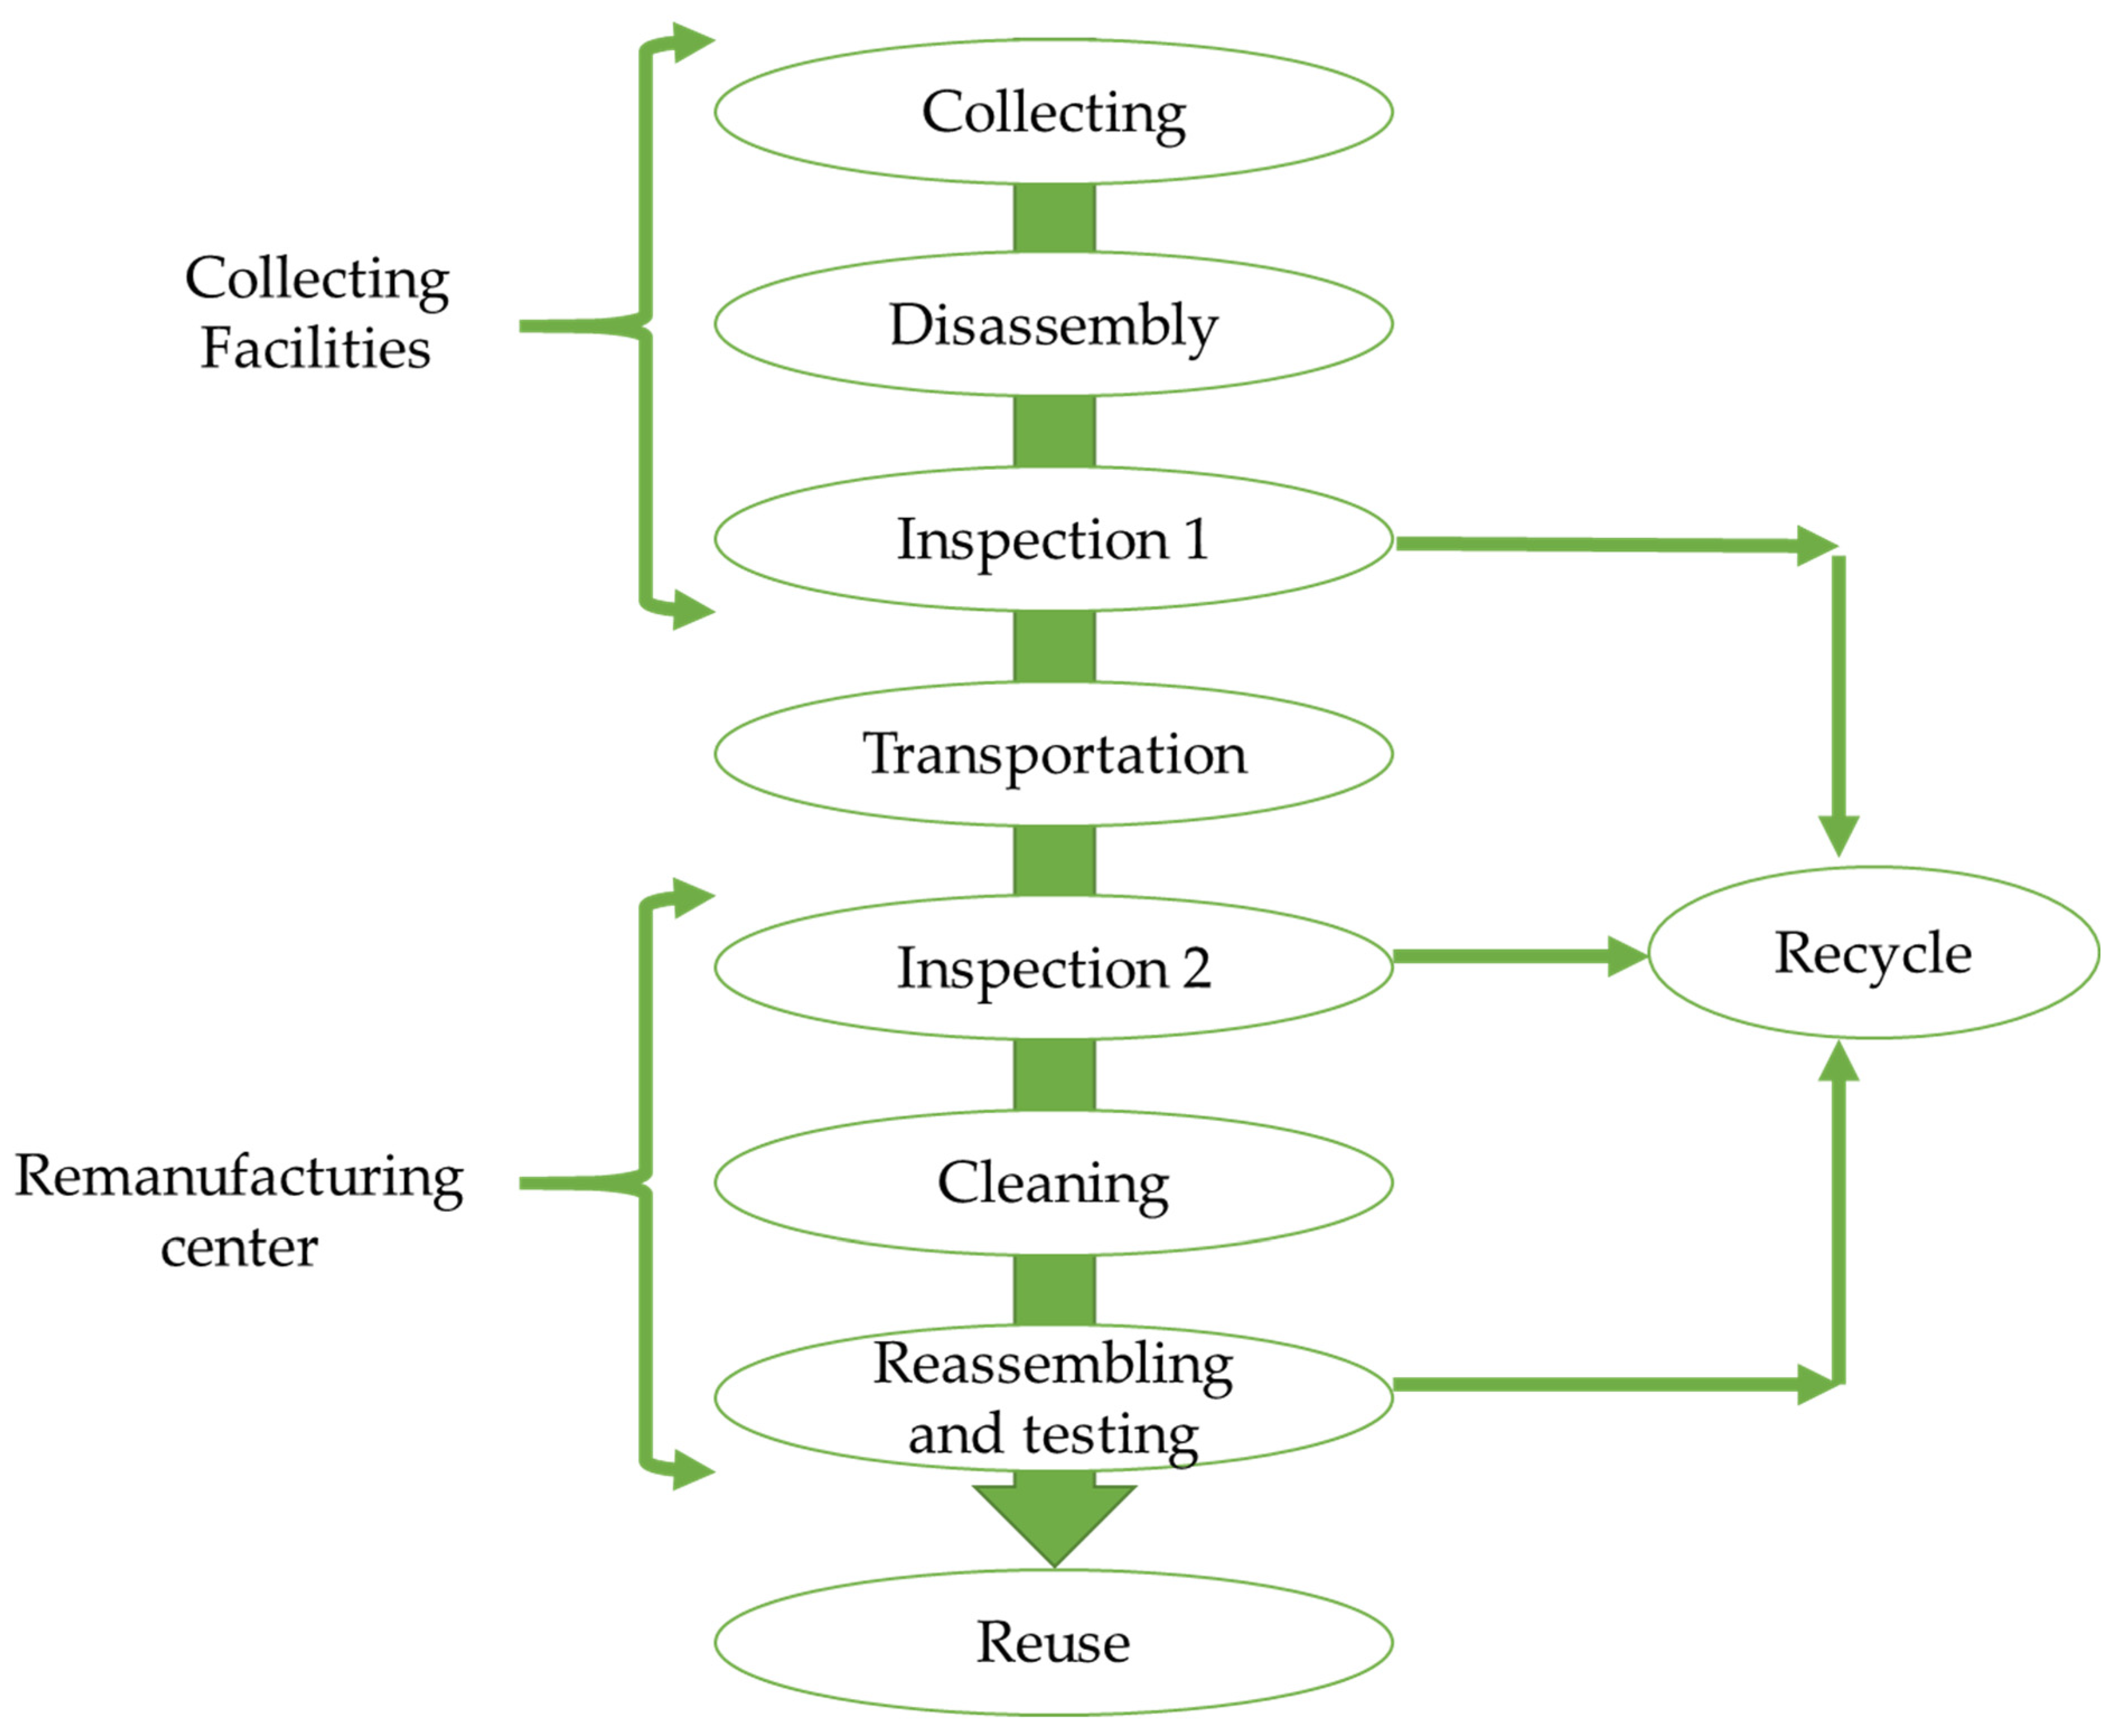
Figure 1. The framework of the Recovery System.
Sustainability 14 15204 g001
Figure 2. Collection facilities in Cameroon.
Sustainability 14 15204 g002
Figure 3. Material Flow Framework.
Sustainability 14 15204 g003
Figure 4. Geographical locations of collection and remanufacturing centers.
Sustainability 14 15204 g004
Table 1. Summary of reviewed papers.
ReferencesDecision Variables and ObjectivesPropertiesCase StudyApproach
Plant OpeningProductionTransportationInventoryMulti-PlantMulti-CustomerMulti-ProductsMulti-PeriodCapacity
[39] MINLP
[43] T2NN, CODAS
[37] MIQP
[33] Robust Optimization
[30] Robust Optimization
[34] TSCFLP, BRKGA
[35] Cut-and-solve algorithm
[36] TSCFLP
[27] SLD heuristic
[28] MILP
[29] MIP
[31] Voronoi diagrams
[32] IT2F ARAS
[44] AHP-entropy weight
[41] AHP, strategic decision-making
[42] SWOT analysis, AHP
[45] Economic Evaluation
Table 2. Variable definition.
VariableDefinition
R
C
The set of new remanufacturing facilities, denoted by m = {1, …, i}
The set of collecting facilities, denoted by n = {1, …, j}
XmnThe section of collecting facility n’s demand met by remanufacturing facility m
KThe set of capacities of remanufacturing centers, denoted by k = {1, …, k}
smkkth capacity of remanufacturing center m
ymkBinary variable assumed as 1 if the facility is opened at location m, otherwise 0
fmkCost of opening new remanufacturing center m depending on the change in capacity k
DmnDistance between collecting facility n and remanufacturing facility m
DnDemand at collection facility n
UICUnit testing and inspection cost
UTCTransportation cost of one remanufactured tractor per mile
UTCmnUnit transportation cost between collecting facility n and remanufacturing facility m
URCRemanufacturing cost for a single product
Cmn(Dn)General transportation cost
RR1First inspection return rate
RR2Second inspection return rate
RR3Third inspection return rate
Table 3. Regions in Cameroon.
WTLTCENWSWNTFNADSTET
West Region.Littoral regionCenter RegionNorthwest RegionSouthwest regionNorth RegionFar North RegionAdamawa RegionSouth RegionEast Region
Table 4. Transportation cost per product between regions.
RegionsWTLTCENWSWNTFNADSTET
WT50125140110120340410175190250
LT1255013519550390500240140260
CE14013080199190210430200150140
NW11019519960140405460225240310
SW1205019014050450510270200330
NT34039021040545070210150320290
FN41050043046051021060220620580
AD17524020022527015022080220100
ST19014015024020032062022080140
ET25026014031033029058010014090
NB: The values in Table 4 above are in Chinese Renminbi (CNY).
Table 5. Results for various facility capacities (Annual costs).
Case
Number
CapacityTotal Budget (CNY)Opening Budget (CNY)Transportation (CNY)Number of Facilities
12506,583,564,2501,333,300,000264,25060
25005,912,153,000661,677,750475,25030
37505,692,277,895441,677,750600,14520
410005,582,290,100331,644,750645,35015
512505,516,251,250265,471,000780,25012
615005,472,485,500221,677,750807,75010
717505,450,378,250199,452,250926,0009
820005,428,664,520177,541,0001,123,5208
925005,385,171,000133,610,5001,560,5006
1030005,363,190,500111,850,5001,340,0005
1135005,363,217,000111,566,0001,591,0005
1240005,365,215,00094,250,5202,247,0004
1345005,389,637,55091,550,5002,395,6504
1450005,432,201,36076,684,3603,121,0003
1560005,469,365,25071,986,7503,365,5003
1670005,498,751,00057,648,5003,525,5003
1780005,532,213,25049,448,4004,095,8502
Publisher’s Note: MDPI stays neutral with regard to jurisdictional claims in published maps and institutional affiliations.