Abstract
Scholars are interested in understanding human responses and perceptions concerning the configuration of streetscape environments that serve multiple functions. However, drivers’ visual attention to the streetscape has seldom been studied dynamically in multi-modal settings. By employing eye-tracking and semantic segmentation, visual attention partitions and objects and patterns are inspected in a per-second count along three typical roadways in Nanjing, China. In our study of 28 participants, it was found that people are likely to focus on the frame center (p-value < 0.005) in all methods of transportation. Roads and buildings are constantly observed along the roadway (p-value < 0.005), while smaller transportation objects across multi-modal conditions are noticed more in per-area counts (p-value < 0.025). Besides, vehicles are focused on more in a higher-speed driving lane (p-values < 0.005), while greenery and humans attract more attention in a slower lane (p-values < 0.005). The results indicate that the previous visual engagement results should be reconsidered on several points, and that the risk of distractions from non-traffic-related elements could be overestimated. The potential of the road surface in integrating safety and information-providing has been ignored in current studies. This study showed that greenery and other functional elements will not distract users in driving lanes; decreasing the calculation burden to two-ninth is possible in smart driving. These results could be helpful in future sustainable cities.
1. Introduction
Streetscape composition has slowly evolved from a single purpose setting (to facilitate vehicles from point A to point B) to a setting where a variety of environmental functions may be included. This may include the incorporation of abundant streetscape elements in the roadway corridor [1,2,3] to support ecological and social services under the perspective of “Sustainability” [4,5]. These transformations present a challenging platform for ecological diversity [6,7], pollution reduction, water preservation [8], carbon sequestration [9,10,11], runoff control [12], landscape scenery [13], economic viability [14] and social services and citizens’ satisfaction [15,16]. The visual habit of streetscape settings may keep evolving with the complexity increased by new functional elements, too. The essential question is whether these changes will conflict with the priority of roadway safety.
There is controversial evidence on both sides. Some kinds of road greenery were found to divert drivers’ attention or increase the accident rate [17,18]. The current Chinese road traffic regulations limit the scale of vegetation to achieve safety [19]. Meanwhile, other results affirm that additional vegetation is an aesthetic preference and has human cognitive advantages [20,21]. This position is backed with support from the following theories: clustering theory [22], attention restoration theory [23] and prospect and refuge theory [24] and their validations [25,26]. Moreover, many economic and social functions are dependent on signs along the roadway. These conflicts imply the necessity of studying roadway users’ visual habits beyond one functional use. Many methods and results of visual attention have been widely tested and implemented, such as direct observation [27,28], mechanical-recording [28], optical recording [29], electric current recording [30], magnetic induction [31,32], marketing [11,33,34,35], transportation [36], user experiences [37], neuroscience [38], human–computer interactions [39], education [40] and sports [41]. However, visual engagement research in urban roadway settings is more concerned with traffic safety, focusing on things such as pedestrians [42,43], parking [44] and driving safety [45,46]. Only a few scholars have focused on the general visual mode, and have tried to measure and predict the visual quality of transportation [47,48]. Neither the dynamic dwelling mode on multiple objects in complex street environments, nor the found general visual models have been widely discussed or verified with dynamic measures before. These deficiencies call for more dynamic visual engagement research for future planning and design challenges in roadway environment.
The research team is interested in investigating dynamic visual attention patterns in a streetscape environment which may be helpful in future streetscape composition by employing eye-tracking technology [49,50]. The tests were implemented with 28 participants and three roadways. The study team’s primary interest is, “What features for those on the roadway visually engage the respondent in dynamic process”.
2. Materials and Methods
2.1. Road Selection
Twelve roads of multiple streetscape conditions were selected from the Xuanwu, Qinhuai, and Gulou districts in Nanjing (Figure 1a). Three road sections of similar length and roadway corridor conditions were selected as representative samples (Figure 1b).
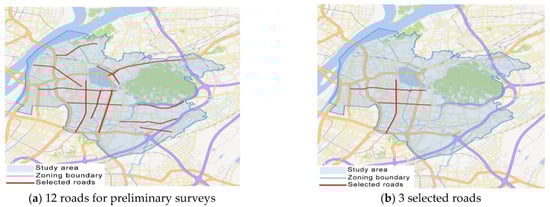
Figure 1.
Map of road samples. (Base map is from Tianditu Map. 12 roads were selected for preliminary surveys while 3 of them which have similar conditions were picked as samples).
2.2. Enviroment Simulatiing and Apparatus
For safety, an onsite test was abandoned. Videos recoded on each sample road were utilized as a simulation. A digital camera (PowerShot G7X Mark III, Canon, Tokyo, Japan) and a stabilizer (Crane M2, Zhiyun, Beijing, China) were deployed at the height of the human eye for stable, high-definition (1920 × 1080 HD) video recording. The duration of the videos was controlled under three minutes to prevent visual attention deviation [51]. The videos were replayed on a 27-inch (0.62 m × 0.37 m) screen in a separate room. The center of the display was set at the same height as the participants’ eyes, with a distance of 0.5 m between their eyes and the screen to ensure full-screen viewing. The monitor speakers played all the sounds while the volume was equalized to avoid excessive sound in Adobe Premiere. Each video can be divided into a closed and open section where the greenery coverage varied (see Table 1 and Figure 2). The visual engagement was measured by a wearable eye tracker (Tobii Pro, Stockholm, Sweden).

Table 1.
Road segments information.
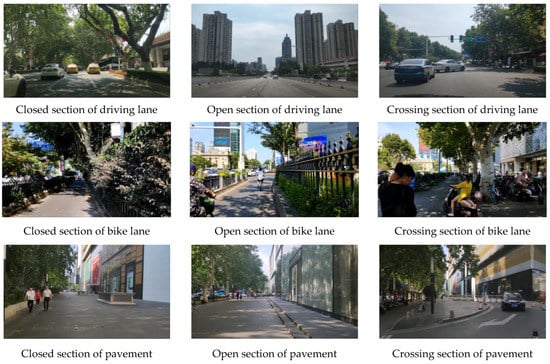
Figure 2.
Example of road segmentation.
2.3. Participants’ Adoption
Postgraduate students with self-reported normal eyesight were recruited due to accessibility, efficiency, and reduced cost. The majority of participants were not controlled because no association has been revealed between profession and eye movement. All participants were tested in two steps before the formal one. The first step was interpreting. The second entailed a device test. A total of 31 participants were employed and the results of 28 were accepted. Eight participants were male and twenty were female. Twenty-five participants were under 24, and the remaining three participants were under 30. The mean pupil capture rate was 94.7% (range = 87–99%; standard deviation = 2.73%).
All 28 participants were then informed that they would watch videos of three roads. The sequences of the three videos were randomized using Excel to ensure no statistical bias. No task was assigned in advance. The entire process took approximately 10 min, including preliminary instructions, equipment rectification and video watching.
2.4. Engagement Analysis
The engagement analysis was grounded in analyzing programs written in Python (www.python.org (accessed on 1 October 2022)) and output data from original software ErgoLAB (KINGFAR, Beijing, China). All details, including alterations in human physiological conditions, eye movements and visual focus were firstly maintained and synchronized. Then, they were converted into one-second intervals and dwelling habits were analyzed.
2.4.1. Data Conversion
The original visual engagement outputs were reduced to one-second intervals considering efficiency. The fifteenth frame of 30 frames in each second of the video was selected as the representative for the second. The twenty-fifth engagement output among fifty (0.02 s interval in original output) in the second was employed correspondingly.
2.4.2. Dwelling Zone and Object Recognition
The dwelling habit is studied in four dimensions: the dwelling zone, the dwelling period of each kind of object, the dwelling period of each kind of object in per-area count and the dwelling period of each kind of object in the most-dwelled zone.
A nine-section grid measure was applied in dwelling-zone analysis as outlined in Figure 3 [52,53]. The fixation coordinates of 28 participants were firstly coded into nine zones. Then, the most prominent zone of 28 respondents in one second was selected as the representative zone.
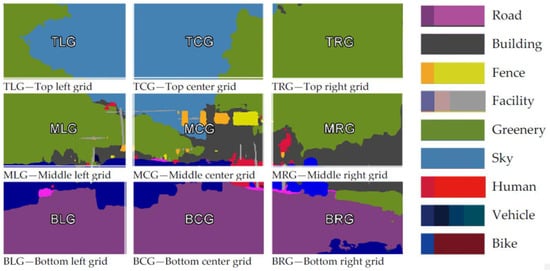
Figure 3.
Example of nine-rectangle grid of one-frame semantic segmentation. BLG—Bottom left grid; BCG—Bottom center grid; BRG—Bottom right grid; MLG—Middle left grid; MCG—Middle center grid; MRG—Middle right grid; TLG—Top left grid; TCG—Top center grid; TRG—Top right grid.
The analysis of the dwelling period of each kind of object is based on object segmentation in videos, which has long been a technical challenge in visual research and was highly labour-intensive. An object-semantic-segmentation program [54] grounded in neural networks was employed to handle massive frames from videos, which adopted a widely-tested and verified structure called Multipath to integrate coarse, high-level features with elaborate, low-level features more efficiently. Similar processing has been tested in other engagement studies [22,55]. Every pixel in the frame was segmented into nine types of objects [49,56], as presented in Figure 3. Afterwards, a 25-pixel square window around the fixation coordinate in output was adopted to detect the dwelling object and avoid boundary errors. The most prominent object in the pixels of 28 respondents was defined as the dwelling object of that frame. Then, the total dwelling-span was calculated. Ten percent of frames were manually checked to ensure accuracy.
The dwelling period of a kind of object was profoundly related to its proportion in a frame. However, we were interested in learning whether smaller occasional objects could also attract viewers’ attention. Dwelling time for objects per unit area was examined and then compared. This per-area dwelling time was defined as the dwelling time for an object divided by its own area [49], which eliminated the effect of area on the object.
Even when the above outcomes interpreted dynamic visual engagements in zone and element types, whether dwelling zones and objects were related remained unconfirmed. Thus, the most-focused-on object and zone of 28 candidates were plotted in two synchronized figures. The dwelled-on object in the focus zone is compared with the dwelled-on object in the whole frame to confirm consistency.
3. Results
3.1. Dwelling-Zone Analysis: A Focus on the Center
The accumulation of zonal dwelling time, as displayed in Table 2, demonstrates a clear focus zone at the frame center. There is strong evidence (p < 0.005) that each grid was not focused on equally (p < 0.005) in all settings. The average dwelling-time percentage for the central grid in all settings was the highest: 45.88%. Regarding the driving lane, the highest-dwelled grid was the one beneath the center, with a dwelling-time percentage of 48.86%. These two grids averagely accounted for 76.50% of total dwelling time in multi-modal transportation corridors. Moreover, their accumulated dwelling-time percentage was more than 70% (p-value < 0.005) in all settings.
Table 2.
Dwelling time percentage of nine zones in a frame.
Besides the major engagement, there are some less-significant differences amongst other zones. The average dwelling-time percentage for the right side was 13.48%, which was 5.92% higher than that of the left side. The upper zone was the least-noticed, as its dwelling time percentage was 2.45%.
The dwelling period for the central zone could be affected by visual openness alternation caused by different greenery coverage. Those in the bike lane and pavement dropped 7.01% from closed to open segments, and 13.61% from open to crossing segments. However, those in the driving lane remained constant.
In sum, over 70% of fixations are at the frame center and the grid below in each roadway environment (p-value < 0.005), despite some deviations caused by greenery coverage. Additionally, the right side is more focused than left or upper sides.
3.2. Total Dwelling on Objects: Car, Human and Greenery
As presented in the box plot Figure 4 and Table 3, there is strong evidence that objects were not focused on equally in all settings (p-value < 0.01). Four objects: buildings (28.03%), roads (27.18%), greenery (15.55%) and humans (15.22%) were focused on more than average. Considering roads and buildings were constant parts in the streetscape, the following attention-span comparisons were implemented without these two kinds of objects.
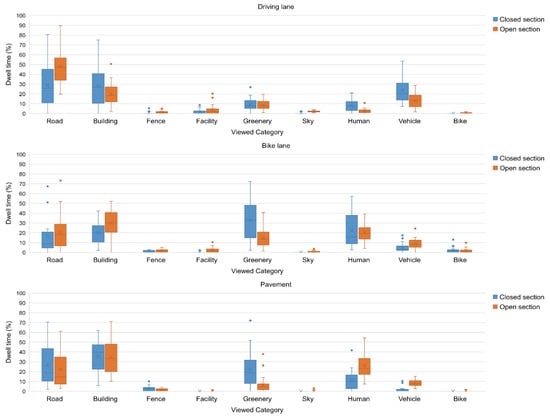
Figure 4.
Dwell-time percentage of nine objects. Dwell-time per-area percentage of nine objects. (The blue bullet is the dwelling period in closed section while the orange is that in open section).
Table 3.
Dwelling-time percentages of nine objects.
Besides two major concerns, three kinds of objects: greenery (33.66%), humans (32.56%) and vehicles (24.09%) were engaged with more than average, while the rest were engaged with significantly less. However, there is strong evidence that the attention given to these three objects that attracted the most focus was not consistent across different methods of transportation (p-value < 0.01). The dwelling-time percentage for the vehicle (47.76%) in the driving lane was 3.8 times that of the dwelling-time in slower lanes (12.44%). The dwelling-time percentage for humans (13.92%) in the driving lane was nearly one-fourth of that in slower lanes (41.87%). Greenery was dwelled on 1.6 times more in slower lanes (38.54%) than in the driving lane (23.91%).
Only the dwelling-time percentage for greenery displayed inconsistency between open and closed segments (p-value < 0.05). The average dwelling-time percentage for greenery was 43.64% in the closed section, while it was 23.69% in the open section.
In summary, roads and buildings were dwelled on constantly more in all environments. Aside from attention to these two objects, there are two different attention patterns. On the driving lane, vehicles attracted more attention; in other lanes, greenery and humans were dwelled on more. All other kinds of objects were dwelled on much less across all methods of transportation. Additionally, higher greenery coverage, especially canopy, which may make the streetscape feel more enclosed, enhanced the focus on greenery.
3.3. Dwelling Objects per Unit Area: Attention to Transportation Facilities and Moving Objects
The results per unit as shown in Figure 5 indicates a very different spread.
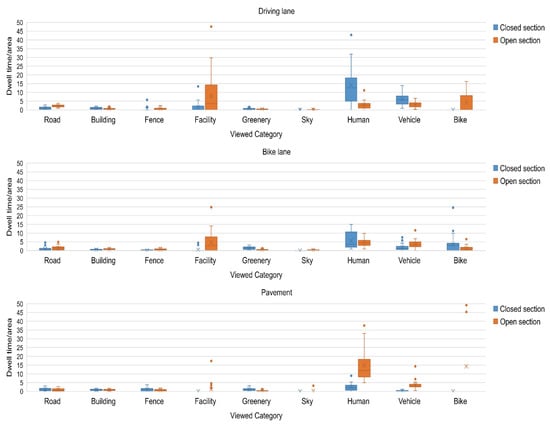
Figure 5.
Dwell time per-area percentage of nine objects. (The blue bullet is the dwelling period in closed section while the orange is that in open section).
As presented in box plot Figure 5 and Table 4, there is strong evidence that per-area dwelling time for objects was not equal in all settings (p-value < 0.01). Four objects: transportation facilities (such as signs and traffic lights, 12.36%), humans (35.48%), vehicles (14.20%) and bikes (14.80%) were focused on more than average. They are all transportation objects/subjects. The dwelling period of all other elements is only 23% of all dwelling time. Meanwhile, there is strong evidence that the attention to transportation facilities was not consistent across different traffic modes (p-value < 0.01). The average dwelling-time percentage in the driving lane and bike lane (17.78%) was 11.7 times of that on pavement (1.52%). The per-area dwelling-time percentage for transportation facilities and bikes displayed inconsistency between open and closed segments (p-value < 0.05). It was 3.00% in the closed section, compared with 21.7% in the open section. However, this implies that the distractions of buildings and fences will increase in open sections.
Table 4.
Dwelling time per-area percentages of nine objects.
Overall, these findings indicate that traffic-related objects/subjects remain essential in visual attention even though they are small and occasional in the streetscape. They are highly noticeable when they are in the viewshed. The traffic facilities are more-noticed in bike and car lanes while traffic facilities and bikes attract more attention without greenery coverage.
3.4. The Relationship between Dwelling Zones and Objects
The most-focused on objects and zones of the 28 candidates were plotted in two synchronized figures as displayed in Figure 6. The upper part was coded with the fixation of zone, while the lower part was coded with the object of attention. The consistency of combinations of dwelling zones and objects were listed in Table 5.
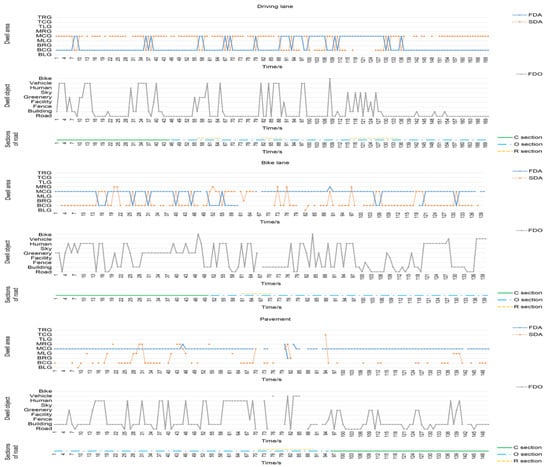
Figure 6.
The common first dwell-area, second dwell-area and first dwell-object of the subjects on the three roads. FDA—first dwell area; SDA—second dwell area; FDO—first dwell object; C section—closed section; O section—open section; R section—road crossing section.
Table 5.
Focus–behavior combinations. Six combinations were listed.
There is strong evidence that at least 90% of attention to objects was related to attention to the frame center (p-value < 0.05). Amongst these, in focusing time on the center, 72.8% was on bigger objects such as the road, buildings and greenery; 7.6% was on transportation facilities, moving bikes and vehicles and 13.9% was on humans. In total, 94.3% of dwelling time for the central area was on bigger or traffic-related objects/subjects. Moreover, there is no strong evidence that there were significant differences amongst different transportation modes and between open and closed segments. The accumulated percentages dwelled on in the above three major categories (the driving lane, the bike lane and the pavement) were 97.1%, 97.1% and 88.7%, respectively. The accumulated percentages in closed and open segments were 99.4% and 91.6%, respectively. Thus, greenery and buildings are the major potential distractions that are not traffic-related. It is still notable that in open segments of pavement, there is the highest chance that people will look outside the central area.
In summary, respondents focused more on the center zone to capture important figures. More than 90% of the bigger or traffic-related objects were focused on (p-value < 0.05) in this zone in all settings. Buildings and greenery are major distractions that are not traffic related.
4. Discussion
The research began with questions on dynamic visual attention in multi-modal complex streetscapes. It is found that when people do notice elements that are traffic related, most people are still gazing on the center and the center-below of the picture for bigger or traffic-related elements. The dwelling zone and objects are connected by major elements in the zone. The greenery coverage also affected the dwelling habits in slower lanes and in per-area counts while effects of other elements are unnoticeable. The implications of these patterns and possible alternations to current road layout planning and designs are discussed below.
4.1. Roadway Dynamic Engagement Patterns and Theory
There is evidence that the visual engagement of roadway users has patterns of dwelling more on traffic-related or bigger objects without the effect of greenery in driving lane. This is different from the earlier study which suggested that eye fixation during natural scene perception describes a random motion regardless of top-down or of bottom-up processes [57]. Our results are also different in comparison with earlier results, which showed that drivers’ attention could be diverted by greenery and advertisements. The difference between our current finding and the previous study can be caused by the deviations of measures and theories.
Much of existing traffic-safety-related research revealed that some elements may increase traffic risks such as disorderly landscapes [58] or high greenery coverage. However, many of these studies were based on classical, static observations or experts [18,19]. This study suggested different conclusions by using dynamic measures. The difference in results can be attributed to deviations between dynamic and static methods [59,60,61]. Meanwhile, many previous studies that support distractive elements are only based on studies of pedestrians. This study compares the results in driving, in bike lanes and on pavement, which may affect performance differently.
Meanwhile, theories behind the cases could be another reason. There are two major theories explaining visual behaviors, the information–cognition theory and the saliency theory. The information–cognition theory holds that cognition influences fixation [62,63,64], while the saliency theory explains visual attention due to contrast [65,66]. However, many traffic-safety-related studies use the saliency theory to predict potential risks. Considering that the objects that attracted the most attention are traffic-related or central objects, it may be inferred that they are more dwelled-upon because of the traffic-related information in these objects. It is possible that the lack of certain information acquisition expedites the random visual engagement mode in natural settings. Moreover, it can be inferred that only distraction from traffic-related objects is saliency related, which is around 23%. Further manual inspections displays that there is maximum 11% chance in all roadway settings that a user was neither looking at the bigger object, nor traffic related objects at the frame center, but doing visual exploration in open sections. For the driving lane, tall buildings in side zones attracted attention. In the bike lane, an electronic advertisement screen and commercial booths with distinct shapes and contrasting colors attracted attention. On the pavement, window shopping and attention to colorful sculptures were spotted. These discrete observations conform to the classic visual-dwelling-area judgment theory based on contrast [67,68], and are consistent with previous traffic distraction studies. However, these behaviors only occupy a maximum of 11% of the dwelling period in open sections in all methods of transportation, and is only 1–2% in driving lane. The current findings argue that the information–cognition theory is more applicable than the saliency theory to this dataset, and this causes the difference between current and previous results.
In conclusion, differences between current results and previous findings may be caused by differences in measures and theories. The traffic distractions found may be deduced from static observation and have not been widely compared with behaviors in other methods of transportation. The visual saliency is helpful in visual exploration with very limited application compared with that of information recognition. These differences in results should be explored more in future studies.
4.2. Tradeoff in Safety and Diversity
The streetscape should promote safety with multiple functions which can be utilized in future sustainable cities. However, the coexistence of the road with other facilities always presents an organizational challenge. There are tradeoffs that should be considered to balance safety and diversity along the roadway, which can be summed up in three concerns:
The first concern is the different safety requirements in various methods of transportation. There is an average 15% chance that people are looking at objects that are not traffic-related on the road in a per-area count. It is 7%, 11% and 24% in driving, bike lanes and on pavement, respectively. This implies that distracted moments decrease with the speed of transport, which increases safety, especially in the driving lane. Though the critical threshold of distraction has not been confirmed, these distractions should not be overestimated as in previous studies. On the other hand, visual exploration is more frequent in an open section of road. Distractions of greenery and buildings can be observed in all methods of transportation and have been verified in many early studies [69,70,71]. When excluding greenery and buildings in all segments is not necessary or possible, their configuration should be carefully examined in less-greenery-covered segments and crossings, especially when the moving speed is high. This difference between open and closed segments has seldom been examined before in studies and practices, which implies that an open viewshed for critical traffic-related objects in open sections is key, which could be underestimated. It is also a key tradeoff that should be considered between safety and multiple functions.
The second concern is positioning. The most important tradeoff when balancing traffic safety and its multiple functions in future cities is the position of all kinds of elements. There are four important positions that should be discussed. Since the middle and middle-below zones are more noticed, it can be inferred that elements in other zones will be less-noticed. During crossing, the right side is more gazed-at, which can be partially attributed to the right-side traffic rules in China. First, these features imply that the center part of the viewshed, including the top of pavement, is much more important and has great potential for information integration. However, it has been ignored in current streetscape configurations since the public and commercial signs are still placed along roadsides, while previous studies focused on the road edge more [21,55,72]. The base face in the streetscape is essential in dynamic visual engagement, and future planning should be more concerned with this. Second, since the central grid, the central-below grid and the right side are more noticed, the greenery and buildings in these zones at crossings should be replaced or redesigned in a less-contrasting style as a tradeoff for safety. Third, when greenery and signs are noticed in the central zone, they are in the midfield and background in terms of perspective and away from observer. However, a substantial amount has been invested in China, such as in Nanjing, to achieve beautiful greenery with flowers and details [73], while most of them are away from people when being gazed upon. The text size and colors are not designed for a distant view either. Thus, ecological and environmental aspects, rather than visual details of trees and grass should be prioritized in future roadway planning. The place of future smart signs and their style should be reconsidered. Fourth, since the left or upper sides are much less noticeable, those elements that are not beautiful can be placed in these zones to serve both functional and aesthetic requirements.
The third concern is the configuration of other elements that are not traffic-related, especially greenery. The relationship between natural outdoor environments, human cognitive functioning, and their mediators have been examined since the early 1930s [74]. The effects of varied walking environments have also been compared [75,76,77,78]. Some positive consequences of beautiful natural environments on memory and concentration have been explored or observed [79,80,81,82,83,84]. Meanwhile, the vegetation along the roadway is the primary element of the natural setting and is an important element to fulfill ecological services. However, whether greenery will distract from other elements should be investigated. Spearman’s correlation analysis was performed on the dwelling time for greenery and the area changes of all objects, as outlined in Table 6. In the driving lane, the dwelling time for greenery is positively correlated with mobile car area proportion (0.221, p-value < 0.05). In other lanes, it is positively correlated with its own area proportion (0.370, p-value < 0.05) and negatively correlated with area proportions of buildings (−0.326, p-value < 0.05), humans (−0.200, p-value < 0.05), transportation facilities (−0.347, p-value < 0.05) and bikes (−0.215, p < 0.05). These findings indicate that the greenery along the driving lane will not compete with, but will rather enhance visual attention to transportation objects, while greenery is gazed at more in slower lanes as a counterpart to artificial objects. Moreover, the enclosure caused by high greenery coverage in current road configurations increase this distraction. Whether these distractions should be considered as a potential risk in slower lanes requires more research in the future. It is possible that planting trees with smaller canopies or developing vertical greenery along the road can be helpful for both recognition recovery and traffic safety at the same time.
Table 6.
Spearman’s correlation coefficients between greenery dwelling time and the area of objects.
4.3. Inspiration of Smart Road and Driving
One import finding of this research is that it confirmed the central and central-below zones as the areas that attract the most attention on the road among all methods of transportation. Current smart road and automatic driving is heavily loaded in calculation and bandwidth to handle information from the whole frame. However, if the current result can be verified with more research, then critical resources can be focused on these two zones without further risks, which will reduce the calculation to two-ninths. This will result in a lighter and cheaper product.
4.4. Limitations
The investigation of Foulsham et al. implies that visual engagement could be very different between the outdoors and in videos [85]. Mehta stressed that Eastern and Western roads have significant cultural differences [86]. Meanwhile, current results, which are based on limited road samples and respondents, should be verified. These issues should be examined in future studies.
5. Conclusions
The study revealed some different visual engagement behaviors compared with previous findings in the natural environment and traffic safety aspects by using dynamic methods. People are likely to focus on the frame center (p-value < 0.005). Roads and buildings are constantly observed along the roadway (p-value < 0.005), while smaller transportation objects across multi-modal conditions are noticed more in per-area counts (p-value < 0.025). Additionally, vehicles attract more attention in a higher-speed driving lane (p-values < 0.005), while greenery and humans attract more attention in a slower lane (p-values < 0.005). Furthermore, there are more distractions in open and crossing segments, while greenery attracts more attention in a closed segment. These results can provide guidance in five aspects, as below:
- First, the previous visual engagement results should be verified since they may be based on static evaluation, single methods of transportation and the saliency theory. This study shows that information recognition is a more important factor in dynamic behaviors along the roadway.
- Second, the importance of distractions from elements that are not traffic-related should not be overestimated since dwelling time on them is low across all methods of transport, and even lower in driving lanes. However, the open viewshed to traffic-related objects in open sections of road may currently be underestimated since we have found that space enclosure also affects dynamic visual engagement.
- Third, the road surface has great potential in integrating essential information and traffic safety. However, spending resources to increase the details of greenery could be less effective since the greenery is distant from the observer when noticed.
- Fourth, there is strong evidence that greenery does not distract users in driving lanes, although its risk should be more carefully examined in slower lanes. Decreasing tree canopy and developing vertical greenery can be a better tradeoff for both safety and ecological services than the current configuration.
- Fifth, in smart driving applications, it is possible to decrease the calculation burden to two-ninths by emphasis on the central and central-below zones, although this needs more research. Further examinations of the dynamic properties of visual behavior in the outdoor environment should be encouraged. The method implemented in the study can be applied to other environments.
Author Contributions
Conceptualization, Z.Y.; methodology, Z.Y.; software, Z.C.; validation, Z.Y., Y.Z.; formal analysis, Z.Y., Y.Z.; investigation, Y.Z. and Z.C.; resources, Z.Y., Y.Z. and Z.C.; data curation, Z.Y. and Y.Z.; writing—original draft preparation, Z.Y. and Z.C.; writing—review and editing, Z.Y. and Y.Z.; visualization, Y.Z.; supervision, Z.Y.; project administration, Z.Y.; funding acquisition, Z.Y. All authors have read and agreed to the published version of the manuscript.
Funding
This research is funded by [Priority Academic Program Development of Jiangsu Higher Education Institutions (PAPD)] and [Youth Fund Program of National Natural Science Foundation of China (NSFC)] grant number [No.: 51908116]. The APC is funded by [Priority Academic Program Development of Jiangsu Higher Education Institutions (PAPD)].
Institutional Review Board Statement
Not applicable.
Informed Con sent Statement
Not applicable.
Data Availability Statement
Data available in a publicly accessible repository.
Acknowledgments
The research team would like to thank for Jon Burley from Michigan State University for providing advice concerning the contents of the paper.
Conflicts of Interest
The authors declared that there is no conflict of interest.
References
- China Area of Paved Road [WWW Document]. Available online: https://www.ceicdata.com/zh-hans/china/area-of-paved-road (accessed on 17 February 2021).
- Gu, C.; Hu, L.; Cook, I.G. China’s urbanization in 1949–2015: Processes and driving forces. Chin. Geogr. Sci. 2017, 27, 847–859. [Google Scholar] [CrossRef]
- Lu, Y.; Sarkar, C.; Xiao, Y. The effect of street-level greenery on walking behavior: Evidence from Hong Kong. Soc. Sci. Med. 2018, 208, 41–49. [Google Scholar] [CrossRef] [PubMed]
- Elsadek, M.; Liu, B.; Lian, Z.; Xie, J. The influence of urban roadside trees and their physical environment on stress relief measures: A field experiment in Shanghai. Urban For. Urban Green. 2019, 42, 51–60. [Google Scholar] [CrossRef]
- Li, C.-L. Quality of life: The perspective of urban park recreation in three Asian cities. J. Outdoor Recreat. Tour. 2020, 29, 100260. [Google Scholar] [CrossRef]
- Alexander, J.; Smith, D.A.E.; Smith, Y.C.E.; Downs, C.T. Eco-estates: Diversity hotspots or isolated developments? Connectivity of eco-estates in the Indian Ocean Coastal Belt, KwaZulu-Natal, South Africa. Ecol. Indic. 2019, 103, 425–433. [Google Scholar] [CrossRef]
- Gao, T.; Zhu, L.; Zhang, T.; Song, R.; Zhang, Y.; Qiu, L. Is an environment with high biodiversity the most attractive for human recreation? A case study in Baoji, China. Sustainability 2019, 11, 4086. [Google Scholar] [CrossRef]
- Cui, J.; Jiang, C. Building highway landscapes: Innovative directions for urban wastewater treatment in the face of new challenges in China. Procedia Eng. 2011, 21, 617–624. [Google Scholar] [CrossRef]
- Sheng, Q.; Zhang, Y.; Zhu, Z.; Li, W.; Xu, J.; Tang, R. An experimental study to quantify road greenbelts and their association with PM2. 5 concentration along city main roads in Nanjing, China. Sci. Total Environ. 2019, 667, 710–717. [Google Scholar] [CrossRef]
- Van Ryswyk, K.; Prince, N.; Ahmed, M.; Brisson, E.; Miller, J.D.; Villeneuve, P.J. Does urban vegetation reduce temperature and air pollution concentrations? Findings from an environmental monitoring study of the Central Experimental Farm in Ottawa, Canada. Atmos. Environ. 2019, 218, 116886. [Google Scholar] [CrossRef]
- Wang, Y. Study on the Infuence of Cartoon Modeling on the Color Visual Perception of Furniture for Children. Ph.D. Thesis, Nanjing Forestry University, Nanjing, China, 2018. [Google Scholar]
- Li, L.; Uyttenhove, P.; Van Eetvelde, V. Planning green infrastructure to mitigate urban surface water flooding risk–A methodology to identify priority areas applied in the city of Ghent. Landsc. Urban Plan 2020, 194, 103703. [Google Scholar] [CrossRef]
- Stojanovic, N.; Vasiljevic, N.; Radic, B.; Skocajic, D.; Galecic, N.; Tesic, M.; Lisica, A. Visual quality assessment of roadside green spaces in the urban landscape—A case study of belgrade city roads. Fresenius Environ. Bull. 2018, 27, 3521–3529. [Google Scholar]
- Säumel, I.; Weber, F.; Kowarik, I. Toward livable and healthy urban streets: Roadside vegetation provides ecosystem services where people live and move. Environ. Sci. Policy 2016, 62, 24–33. [Google Scholar] [CrossRef]
- Fruth, E.; Kvistad, M.; Marshall, J.; Pfeifer, L.; Rau, L.; Sagebiel, J.; Soto, D.; Tarpey, J.; Weir, J.; Winiarski, B. Economic valuation of street-level urban greening: A case study from an evolving mixed-use area in Berlin. Land Use Policy 2019, 89, 104237. [Google Scholar] [CrossRef]
- Gozalo, G.R.; Morillas, J.M.B.; González, D.M. Perceptions and use of urban green spaces on the basis of size. Urban For. Urban Green. 2019, 46, 126470. [Google Scholar] [CrossRef]
- Chen, H.; Fabregas, A.; Lin, P.-S. Landscaping of highway medians and roadway safety at unsignalized intersections. Accid. Anal. Prev. 2016, 90, 63–72. [Google Scholar] [CrossRef] [PubMed]
- Fitzpatrick, C.D.; Harrington, C.P.; Knodler, M.A., Jr.; Romoser, M.R. The influence of clear zone size and roadside vegetation on driver behavior. J. Saf. Res. 2014, 49, 97.e1-104. [Google Scholar] [CrossRef] [PubMed]
- CJJ 37-2012; Code for Design of Urban Road Engineering. China Architecture Press: Beijing, China, 2012.
- Liu, Y.; Hu, M.; Zhao, B. Audio-visual interactive evaluation of the forest landscape based on eye-tracking experiments. Urban For. Urban Green. 2019, 46, 126476. [Google Scholar] [CrossRef]
- Simpson, J.; Thwaites, K.; Freeth, M. Understanding visual engagement with urban street edges along non-pedestrianised and pedestrianised streets using mobile eye-tracking. Sustainability 2019, 11, 4251. [Google Scholar] [CrossRef]
- Buswell, G.T. How People Look at Pictures: A Study of the Psychology and Perception in Art; University of Chicago Press: Chicago, IL, USA, 1935. [Google Scholar]
- Kaplan, S. The restorative benefits of nature: Toward an integrative framework. J. Environ. Psychol. 1995, 15, 169–182. [Google Scholar] [CrossRef]
- Crawford, D.W. The Experience of Landscape; Wiley: Chichester, UK, 1976. [Google Scholar]
- Berto, R.; Massaccesi, S.; Pasini, M. Do eye movements measured across high and low fascination photographs differ? Addressing Kaplan’s fascination hypothesis. J. Environ. Psychol. 2008, 28, 185–191. [Google Scholar] [CrossRef]
- Weisel-Barth, J. An Integrationist Sensibility: A Review of Paul Renn’s “The Silent Past and the Invisible Present: Memory, Trauma and Representation in Psychotherapy”. Int. J. Psychoanal. Self Psychol. 2013, 8, 373–378. [Google Scholar] [CrossRef]
- Miles, W. The peep-hole method for observing eye movements in reading. J. Gen. Psychol. 1928, 1, 373–374. [Google Scholar] [CrossRef]
- Yarbus, A. Eye Movements and Vision; Springer: New York, NY, USA, 1967; pp. XIII, 222. [Google Scholar]
- Ditchburn, R.W. Eye-Movements and Visual Perception; Clarendon Press: London, UK, 1973. [Google Scholar]
- Yan, G.; Tian, H. A review of eye movement recording methods and techniques. Chin. J. Appl. Psychol. 2004, 10, 55–58. [Google Scholar]
- Collewijn, H.; Van der Mark, F.; Jansen, T. Precise recording of human eye movements. Vis. Res. 1975, 15, 447–450. [Google Scholar] [CrossRef]
- Robinson, D.A. A method of measuring eye movemnent using a scieral search coil in a magnetic field. IEEE Trans. Bio-Med. Electron. 1963, 10, 137–145. [Google Scholar]
- Koch, C.; Ullman, S. Shifts in selective visual attention: Towards the underlying neural circuitry. In Matters of Intelligence; Springer: Dordrecht, The Netherlands, 1987. [Google Scholar]
- Rutishauser, U.; Walther, D.; Koch, C.; Perona, P. Is bottom-up attention useful for object recognition? In Proceedings of the 2004 IEEE Computer Society Conference on Computer Vision and Pattern Recognition, Washington, DC, USA, 27 June–2 July 2004; p. II. [Google Scholar]
- James, W.; Burkhardt, F.; Bowers, F.; Skrupskelis, I.K. The Principles of Psychology; Macmillan: London, UK, 1890; Volume 1. [Google Scholar]
- Yiyong, P.; Yuan, D.; Lu, C. Difference of Eye Movement Characteristics of Drivers in the Environment of Scenic Area and Urban Road. Chongqing Jiaotong Univ. 2019, 38, 84. [Google Scholar]
- Bojko, A. Eye Tracking the User Experience: A Practical Guide to Research; Rosenfeld Media: New York, NY, USA, 2013. [Google Scholar]
- Chang, C.; Dwyer, T.; Marriott, K. An evaluation of perceptually complementary views for multivariate data. In Proceedings of the 2018 IEEE Pacific Visualization Symposium (PacificVis), Kobe, Japan, 10–13 April 2018; pp. 195–204. [Google Scholar]
- Kurzhals, K.; Burch, M.; Pfeiffer, T.; Weiskopf, D. Eye tracking in computer-based visualization. Comput. Sci. Eng. 2015, 17, 64–71. [Google Scholar] [CrossRef]
- Norqvist, M.; Jonsson, B.; Lithner, J. Eye-tracking data and mathematical tasks with focus on mathematical reasoning. Data Brief 2019, 25, 104216. [Google Scholar] [CrossRef]
- Moreno, F.J.; Luis, V.; Salgado, F.; García, J.A.; Reina, R. Visual behavior and perception of trajectories of moving objects with visual occlusion. Percept. Mot. Ski. 2005, 101, 13–20. [Google Scholar] [CrossRef]
- McIlroy, R.C.; Plant, K.L.; Jikyong, U.; Nam, V.H.; Bunyasi, B.; Kokwaro, G.O.; Wu, J.; Hoque, M.S.; Preston, J.M.; Stanton, N.A. Vulnerable road users in low-, middle-, and high-income countries: Validation of a pedestrian behaviour questionnaire. Accid. Anal. Prev. 2019, 131, 80–94. [Google Scholar] [CrossRef]
- Soathong, A.; Wilson, D.; Ranjitkar, P.; Chowdhury, S. A critical review of policies on pedestrian safety and a case study of New Zealand. Sustainability 2019, 11, 5274. [Google Scholar] [CrossRef]
- Heinen, E.; Buehler, R. Bicycle parking: A systematic review of scientific literature on parking behaviour, parking preferences, and their influence on cycling and travel behaviour. Transp. Rev. 2019, 39, 630–656. [Google Scholar] [CrossRef]
- Anstey, K.J.; Wood, J.; Lord, S.; Walker, J.G. Cognitive, sensory and physical factors enabling driving safety in older adults. Clin. Psychol. Rev. 2005, 25, 45–65. [Google Scholar] [CrossRef] [PubMed]
- Ranney, T.A. Models of driving behavior: A review of their evolution. Accid. Anal. Prev. 1994, 26, 733–750. [Google Scholar] [CrossRef]
- Burley, J.B. Visual and ecological environmental quality model for transportation planning and design. Transp. Res. Rec. 1996, 1549, 54–60. [Google Scholar] [CrossRef]
- Wolf, K.L. Assessing public response to freeway roadsides: Urban forestry and context-Sensitive solutions. Transp. Res. Rec. 2006, 1984, 102–111. [Google Scholar] [CrossRef]
- Amati, M.; Parmehr, E.G.; McCarthy, C.; Sita, J. How eye-catching are natural features when walking through a park? Eye-tracking responses to videos of walks. Urban For. Urban Green. 2018, 31, 67–78. [Google Scholar] [CrossRef]
- Cottet, M.; Vaudor, L.; Tronchère, H.; Roux-Michollet, D.; Augendre, M.; Brault, V. Using gaze behavior to gain insights into the impacts of naturalness on city dwellers’ perceptions and valuation of a landscape. J. Environ. Psychol. 2018, 60, 9–20. [Google Scholar] [CrossRef]
- Guoqing, N.; Shi, L. Identification and determination of the mental fatigue status through the eye lid movement frequencies. J. Saf. Environ. 2019, 19, 88–93. [Google Scholar]
- Antrop, M. Perspectieven op Het Landschap: Achtergronden om Landschappen te Lezen en te Begrijpen; Academia Press: Cambridge, MA, USA, 2007. [Google Scholar]
- Tatler, B. The central fixation bias in scene viewing: Selecting an optimal viewing position independently. J. Version 2007, 7, 4. [Google Scholar]
- Lin, G.; Milan, A.; Shen, C.; Reid, I. Refinenet: Multi-path refinement networks for high-resolution semantic segmentation. In Proceedings of the IEEE Conference on Computer Vision and Pattern Recognition, Honolulu, HI, USA, 21–26 July 2017; pp. 1925–1934. [Google Scholar]
- Freeth, M.; Simpson, K.; Thwaites, K. Visual engagement with urban street edge. J. Urban. Int. 2018, 12, 259–278. [Google Scholar]
- Fotios, S.; Uttley, J.; Cheal, C.; Hara, N. Using eye-tracking to identify pedestrians’ critical visual tasks, Part 1. Dual task approach. Lighting Res. Technol. 2015, 47, 133–148. [Google Scholar] [CrossRef]
- Duchesne, J.; Bouvier, V.; Guillemé, J.; Coubard, O.A. Maxwellian eye fixation during natural scene perception. Sci. World J. 2012, 2012, 956340. [Google Scholar] [CrossRef]
- Mok, J.; Landphair, H.C. Parkways and freeways: Safety performance linked to corridor landscape type. In Proceedings of the Transportation Research Board 82nd Annual Meeting, Washington, DC, USA, 12–16 January 2003. [Google Scholar]
- Stamps, A.E., III. Use of static and dynamic media to simulate environments: A meta-analysis. Percept. Mot. Ski. 2010, 111, 355–364. [Google Scholar] [CrossRef] [PubMed]
- Stamps, A.E., III. Evaluating spaciousness in static and dynamic media. Des. Stud. 2007, 28, 535–557. [Google Scholar] [CrossRef]
- Orland, B.; Vining, J. The video advantage: A comparison of two environmental representation techniques. J. Environ. Manag. 1989, 29, 275–283. [Google Scholar]
- Henderson, J.M. Human gaze control during real-world scene perception. Trends Cogn. Sci. 2003, 7, 498–504. [Google Scholar] [CrossRef]
- Peters, R.J.; Iyer, A.; Itti, L.; Koch, C. Components of bottom-up gaze allocation in natural images. Vis. Res. 2005, 45, 2397–2416. [Google Scholar] [CrossRef] [PubMed]
- Siebold, A.; Van Zoest, W.; Donk, M. Oculomotor evidence for top-down control following the initial saccade. PLoS ONE 2011, 6, e23552. [Google Scholar] [CrossRef] [PubMed]
- Anderson, G.M.; Humphreys, G.W. Top-down expectancy versus bottom-up guidance in search for known color-form conjunctions. Atten. Percept. Psychophys. 2015, 77, 2622–2639. [Google Scholar] [CrossRef][Green Version]
- Itti, L.; Koch, C.; Niebur, E. A model of saliency-based visual attention for rapid scene analysis. IEEE Trans. Pattern Anal. Mach. Intell. 1998, 20, 1254–1259. [Google Scholar] [CrossRef]
- De Lucio, J.; Mohamadian, M.; Ruiz, J.; Banayas, J.; Bernaldez, F. Visual landscape exploration as revealed by eye movement tracking. Landsc. Urban Plan 1996, 34, 135–142. [Google Scholar] [CrossRef]
- Dupont, L.; Ooms, K.; Antrop, M.; Van Eetvelde, V. Comparing saliency maps and eye-tracking focus maps: The potential use in visual impact assessment based on landscape photographs. Landsc. Urban Plan 2016, 148, 17–26. [Google Scholar] [CrossRef]
- Tapiro, H.; Oron-Gilad, T.; Parmet, Y. Pedestrian distraction: The effects of road environment complexity and age on pedestrian’s visual attention and crossing behavior. J. Saf. Res. 2020, 72, 101–109. [Google Scholar] [CrossRef] [PubMed]
- Anani, P.W.; Appiah, E. Impact of Driver Distraction and Its Effect. J Public Health 2019, 3, 37. [Google Scholar] [CrossRef]
- Misokefalou, E.; Papadimitriou, F.; Kopelias, P.; Eliou, N. Evaluating driver distraction factors in urban motorways. A naturalistic study conducted in Attica Tollway, Greece. Transp. Res. Procedia 2016, 15, 771–782. [Google Scholar] [CrossRef]
- Gehl, J. Cities for People; Island Press: Washington, DC, USA, 2013. [Google Scholar]
- Xie, H.; Xu, W.; Miao, G. A Study on Urban Road Greening from the Perspective of Ecological Civilization. J. Beijing Jiaotong Univ. 2014, 13, 99–108. [Google Scholar] [CrossRef]
- Zijlema, W.L.; Triguero-Mas, M.; Smith, G.; Cirach, M.; Martinez, D.; Dadvand, P.; Gascon, M.; Jones, M.; Gidlow, C.; Hurst, G. The relationship between natural outdoor environments and cognitive functioning and its mediators. Environ. Res. 2017, 155, 268–275. [Google Scholar] [CrossRef]
- Berman, M.G.; Kross, E.; Krpan, K.M.; Askren, M.K.; Burson, A.; Deldin, P.J.; Kaplan, S.; Sherdell, L.; Gotlib, I.H.; Jonides, J. Interacting with nature improves cognition and affect for individuals with depression. J. Affect. Disord. 2012, 140, 300–305. [Google Scholar] [CrossRef]
- Berman, M.G.; Jonides, J.; Kaplan, S. The cognitive benefits of interacting with nature. Psychol. Sci. 2008, 19, 1207–1212. [Google Scholar] [CrossRef]
- Bratman, G.N.; Daily, G.C.; Levy, B.J.; Gross, J.J. The benefits of nature experience: Improved affect and cognition. Landsc. Urban Plan 2015, 138, 41–50. [Google Scholar] [CrossRef]
- Gidlow, C.J.; Jones, M.V.; Hurst, G.; Masterson, D.; Clark-Carter, D.; Tarvainen, M.P.; Smith, G.; Nieuwenhuijsen, M. Where to put your best foot forward: Psycho-physiological responses to walking in natural and urban environments. J. Environ. Psychol. 2016, 45, 22–29. [Google Scholar] [CrossRef]
- Bodin, T.; Björk, J.; Ardö, J.; Albin, M. Annoyance, sleep and concentration problems due to combined traffic noise and the benefit of quiet side. Int. J. Environ. Res. Pub. Health 2015, 12, 1612–1628. [Google Scholar] [CrossRef] [PubMed]
- Dadvand, P.; Bartoll, X.; Basagaña, X.; Dalmau-Bueno, A.; Martinez, D.; Ambros, A.; Cirach, M.; Triguero-Mas, M.; Gascon, M.; Borrell, C. Green spaces and general health: Roles of mental health status, social support, and physical activity. Environ. Int. 2016, 91, 161–167. [Google Scholar] [CrossRef] [PubMed]
- Dadvand, P.; Nieuwenhuijsen, M.J.; Esnaola, M.; Forns, J.; Basagaña, X.; Alvarez-Pedrerol, M.; Rivas, I.; López-Vicente, M.; De Castro Pascual, M.; Su, J. Green spaces and cognitive development in primary schoolchildren. Proc. Natl. Acad. Sci. USA 2015, 112, 7937–7942. [Google Scholar] [CrossRef]
- De, V.S.; Van Dillen, S.; Groenewegen, P. Streetacape greenery and health: Street, social cohension and physical activity as mediator. Soc. Sci. Med. 2013, 94, 26–33. [Google Scholar]
- Kaplan, R. The nature of the view from home: Psychological benefits. Environ. Behav. 2001, 33, 507–542. [Google Scholar] [CrossRef]
- Tennessen, C.M.; Cimprich, B. Views to nature: Effects on attention. J. Environ. Psychol. 1995, 15, 77–85. [Google Scholar] [CrossRef]
- Foulsham, T.; Walker, E.; Kingstone, A. The where, what and when of gaze allocation in the lab and the natural environment. Vis. Res. 2011, 51, 1920–1931. [Google Scholar] [CrossRef]
- Mehta, V. A tale of two streets: Comparative experiences on streets in the East and West. Des. Princ. Pract. Int. J. 2009, 3, 231–242. [Google Scholar] [CrossRef]


Publisher’s Note: MDPI stays neutral with regard to jurisdictional claims in published maps and institutional affiliations. |
© 2022 by the authors. Licensee MDPI, Basel, Switzerland. This article is an open access article distributed under the terms and conditions of the Creative Commons Attribution (CC BY) license (https://creativecommons.org/licenses/by/4.0/).