Article

Productive and Sustainable H2 Production from Waste Aluminum Using Copper Oxides-Based Graphene Nanocatalysts: A Techno-Economic Analysis

1
Department of Renewable Energy Engineering, Faculty of Engineering and Technology, Philadelphia University, Amman 19392, Jordan
2
Faculty of Engineering and Information Technology, Taiz University, Taiz 6803, Yemen
3
Department of Alternative Energy Technology, Faculty of Engineering and Technology, Philadelphia University, Amman 19392, Jordan
4
Department of Industrial Engineering, College of Engineering, Alfaisal University, Riyadh 11533, Saudi Arabia
5
Faculty of Medical Sciences, Aljanad University for Science and Technology, Taiz 6803, Yemen
6
Department of Chemistry, Faculty of Applied Sciences, Taiz University, Taiz 6803, Yemen
*
Authors to whom correspondence should be addressed.
Sustainability 2022, 14(22), 15256; https://doi.org/10.3390/su142215256
Submission received: 25 October 2022 / Revised: 11 November 2022 / Accepted: 15 November 2022 / Published: 17 November 2022
(This article belongs to the Special Issue Smart Grid Technologies and Renewable Energy Applications)

Abstract

:
Hydrogen has universally been considered a reliable source of future clean energy. Its energy conversion, processing, transportation, and storage are techno-economically promising for sustainable energy. This study attempts to maximize the production of H2 energy using nanocatalysts from waste aluminum chips, an abundant metal that is considered a potential storage tank of H2 energy with high energy density. The present study indicates that the use of waste aluminum chips in the production of H2 gas will be free of cost since the reaction by-product, Al2O3, is denser and can be sold at a higher price than the raw materials, which makes the production cost more efficient and feasible. The current framework investigates seven different copper oxide-based graphene nanocomposites that are synthesized by utilizing green methods and that are well-characterized in terms of their structural, morphological, and surface properties. Reduced graphene oxide (rGO) and multi-layer graphene (MLG) are used as graphene substrates for CuO and Cu2O NPs, respectively. These graphene materials exhibited extraordinary catalytic activity, while their copper oxide composites exhibited a complete reaction with feasible techno-economic production. The results revealed that the H2 production yield and rates increased twofold with the use of these nanocatalysts. The present study recommends the optimum reactor design considerations and reaction parameters that minimize water vaporization in the reaction and suggests practical solutions to quantify and separate it. Furthermore, the present study affords an economic feasibility approach to producing H2 gas that is competitive and efficient. The cost of producing 1 kg of H2 gas from waste aluminum chips is USD 6.70, which is both economically feasible and technically applicable. The unit cost of H2 gas can be steeply reduced by building large-scale plants offering mass production. Finally, the predicted approach is applicable in large, medium, and small cities that can collect industrial waste aluminum in bulk to generate large-scale energy units.

1. Introduction

Hydrogen has universally been considered a source of future clean energy that could replace environmentally hazardous fossil fuels [1,2]. Its energy conversion, processing, transporting, and storage are techno-economically promising for future sustainable energy [3,4,5]. It is the simplest known element and is a universally abundant gas, with the highest heating value among other conventional fuels, being three to four times higher than natural gas and gasoline. It is considered an ideal energy carrier that can be stored in all matter phases (gaseous, liquid, and solid) [5,6].
Although the current processing methods commonly use fossil fuels, there are sustainable methodologies suggesting high-potential H2 storage systems, such as water, biomass, and hydrated metals, which are still at the research stage and require more investigation and manipulation [3,4,5,6,7,8,9]. Water-splitting, based on solar systems, using photocatalysts for H2 production is widely investigated in the literature [10,11,12,13,14]. However, such approaches are still economically unfeasible and are prone to reversible reactions [12,13,14]. Therefore, efforts are being directed toward other sustainable technologies for efficient production. In this regard, the use of solid waste materials for H2 generation paves the way for the advantages of producing sustainable energy and saving the environment [15,16].
Aluminum is the most abundant metal on earth, with facile and low-cost processing. It has the densest potential H2 storage capacity among all other metals, with a theoretical capacity of ~1350 mL H2 per g of Al, under atmospheric conditions [17,18]. Furthermore, based on the theoretical calculations, 1 kg of low-cost waste aluminum can generate 4 kWh of electricity. It can be used as a safe, clean, and carbon-free energy carrier. Furthermore, the byproducts of the aluminum-water reaction are aluminum oxide, which is a recyclable product used to produce metal aluminum. Its industrial processing leads to large quantities of waste by-products. This process could be considered a sustainable starting material for the bulk energy production of H2 [19]. Consequently, extensive research studies and industrial developments have been attempted for efficient and feasible H2 production from Al precursors [17,18,19]. The continuous synthesis of H2 from Al-H2O is a straightforward and sustainable reaction, especially in base and acid environments [20,21,22,23]. From a scientific point of view, studies to generate H2 gas from artificially synthesized aluminum and its alloys and composites are progressing, in terms of ultimate conversion efficiencies. However, the economic feasibility, process complexity, and product quality are still questionable [24,25]. The common features of all methods in previous studies are: (1) the use of Al and Al-based composites of pure phases, (2) the need for energy-intensive and time-consuming processing prior to their use for releasing hydrogen, such as ball milling, (3) the use of high-cost additives in excessive amounts to produce H2 gas, and (4) performing the H2 production reactions in strong acidic or alkaline mediums, which readily increase the reactor corrosion and reduce their life. Based on the above criteria, the use of industrial waste aluminum chips without any prior treatments and with the help of nanocatalysts could be an efficient and feasible methodology for the continuous production of H2 gas.
Today’s energy research and technology rely mainly on hybrid nanocatalysts and their novel properties. Copper and copper-based nanocomposites are one of the most studied metal oxides in catalysis science and engineering [26]. The wide availability, chemical stability, ease of processing, and extraordinary optical, electrical, thermal, and electronic properties mean that copper-based nanocomposites are well-matched with almost all modern industries and technologies [26,27,28,29,30,31,32]. Accordingly, systems based on the copper NPs of engineered surfaces and well-dispersed particles are of great significance for diverse applications [26].
On the other hand, graphene is an exceptional material with a 2D hexagonal structure. It has an extremely large surface area, high chemical stability, and excellent conductivity, is rich in hydroxyl and carboxyl groups with oxygen atoms on their surfaces, and has the ability to stabilize and disperse nanoparticles [33,34,35]. As a result, graphene in copper matrices is among the few additives that can improve the physicochemical properties of copper composites without interrupting their electrical, thermal, and electronic properties [36,37,38,39,40,41]. In addition, graphene provides stronger attractive forces with nanoparticles than those of the particles themselves [33,34,35]. This explains why particles on graphene sheets show good dispersion and have a larger surface area. To this end, CuO and Cu2O NP-decorated graphene nanosheets possess extraordinary properties that enable them to meet the needs of rapid technological developments and attain high-stability particles [36,37,38,39,40,41,42,43,44,45,46,47,48,49,50,51,52,53]. The aforementioned properties make copper–graphene composites ideal candidates for heterogeneous catalytic applications [26].
The most effective and widely used approach to the synthesis of CuO-G and Cu2O-G composites is the in situ reduction of G/GO and the Cu precursor in a molecular form, in the presence of strong reducing agents [36,37,38,39,40,41]. Compared to other synthetic approaches, the green synthesis of CuO-G or Cu2O-G has the additional merit of producing coated particles with several valuable natural agents for enhancing the particle’s catalytic activity [29,30,31]. Furthermore, Cu2O NPs have shown high stability in water-based systems [54,55,56,57].
The use of graphene nanocomposites based on copper to produce hydrogen is not a new idea. There have been several studies on this subject, as we have indicated in the literature, but to the knowledge of the researchers, they were not sufficiently detailed and were not extensive; instead, these studies had some shortcomings that we will address in our current work. The present study provides a comprehensive understanding of the behavior of copper-based graphene nanocomposites when they are introduced for the purposes of activating the H2 released from waste aluminum. Specifically, the influence of nanocatalysts such as rGO vs. MLG, of CuO vs. Cu2O NPs, and of CuO-rGO vs. Cu2O-MLG as catalysts is well-studied in the present paper, and the mechanisms of reactions are also elucidated. The current framework is distinct from previously published works in that it deals with seven different copper oxide-based graphene nanocomposites that are synthesized using green methods and are well-characterized in terms of their structural, morphological, and surface properties; they are then used as nanocatalysts for H2 production from waste aluminum, which is considered an abundant metal and can be regarded as a potential H2 energy storage tank with high energy density (1400 L H2/1 kg Al). The optimum reaction conditions, such as temperature, pressure, and reaction speed, are also manipulated and controlled, and, finally, an economic feasibility analysis is also conducted.

2. Methodology

To investigate the catalytic activity of copper-graphene nanocomposites for the production of hydrogen from waste aluminum, seven different samples of copper-graphene nanocomposites were synthesized and studied. Figure 1 presents a schematic diagram that summarizes all experimental procedures and the total number of powder samples of copper-based nanocomposites that are utilized in the production of H2 gas from waste aluminum in the current framework.

2.1. Synthesis of CuO NPs

CuO NPs were synthesized using a green method that uses the extract of Catha edulis L. as a promoter, reducer, and capping agent. The procedure for preparing the extract solution of Catha edulis L. was detailed in our previous works [46,47]. Briefly, a few grams of the dry leaves were extracted in a water solvent at ~100 °C until it was transformed into a reddish homogenous color. After filtering and backing the solution of the plant extract, it was used as a reducing and stabilizing agent to synthesize CuO NPs. The reaction starts by dissolving 3.42 g of copper (II) chloride dihydrate in 200 mL of distilled water and putting it in a magnetic stirrer at 50 °C. In the next step, a NaOH solution (0.1 M) was carefully added to the previous solution until the pH became ~12. At the same time, 50 mL of the prepared Catha edulis L. extract solution was added to the aforementioned solution with vigorous stirring for 1 h and then set aside to precipitate. Posteriorly, the obtained solution was filtered, washed several times with water and alcoholic solvents, and dehydrated at 100 °C for 2 h. Finally, a total mass of 2.55 g of dark powder was obtained for further use.

2.2. Synthesis of Cu2O NPs

The synthesis of the Cu2O powder has been detailed in our related works [42,43,44]. In short, a glass beaker was filled with 200 mL of distilled water, 3.4 g of copper chloride dihydrate (Merck, Burlington, MA, USA, purity 99%), and a NaOH solution (pH 12). The obtained solution was vigorously agitated with a magnetic stirrer at 50 °C. Immediately after that, 0.4 g of artificially synthesized glucose was dissolved in 40 mL distilled water and then added to the previous solution, with vigorous stirring at 50 °C for 1 h, until the solution shifted to a yellowish-red color, indicating the formation of the Cu2O phase. In the next step, the obtained precipitates were filtered by a vacuum filtration procedure, washed using distilled water and ethanol solvent, and then dried at 100 °C for 2 h. Finally, the obtained reddish-colored powder was weighed to be 1.81 g and backed for further characterization and testing.

2.3. Synthesis of rGO and MLG

In the first step, GO was synthesized from natural graphite flakes by exfoliating the graphite, followed by a modified Hummers method [40]. In the next step, the obtained GO was thoroughly ultra-sonicated in a water solution for good dispersion. Simultaneously, the glucose was extracted from palm dates in a water solution at 100 °C and was used as a reducing agent. After that, both solutions were mixed together, and the obtained solution was adjusted to pH 12 by adding 0.1 M of NaOH solution, with rapid stirring at 50 °C for 2 h. Finally, the obtained solution was allowed to precipitate, then washed and dried at 120 °C for 2 h. The obtained powder was kept for further experiments. For the synthesis of multi-layer graphene (MLG), GO was thermally reduced at 400 °C for 1 h according to the procedure described in [48,49].

2.4. Synthesis of CuO-rGO Composites

In the first step, 0.25 g (10% of CuO powder) of ready-prepared rGO was dispersed well by the ultra-sonication device in a water-ethanol solvent system and was then added to the precursor solution described in Section 2.1. The remaining procedure of preparing CuO using the plant extract was strictly followed and the obtained powder was marked as CuO-10% rGO. The experiment was also repeated with 0.5 g (20% CuO powder) of rGO, and the obtained powder was marked as CuO-20% rGO.

2.5. Synthesis of Cu2O-MLG Composite

In the first step, 0.36 g (20% of Cu2O powder) of already prepared MLG was dispersed well by an ultra-sonication device and then added to the precursor solution described in Section 2.2. The remaining procedure of preparing Cu2O using glucose was strictly followed and the obtained powder was marked as Cu2O-MLG, which contains about 20% of MLG by mass.

2.6. Catalytic Experiments

A schematic diagram of copper oxide-based graphene nanocatalysts is illustrated in Figure 2. A total of 7 glass beakers were prepared, with 40 mL of distilled water and 10 mL of ethanol in each. Ethanol was added to enhance the particle’s suspension and dispersion, especially for graphene samples. After that, 5 mg of the rGO, MLG, CuO, Cu2O, CuO–10%rGO, CuO-20% rGO, and Cu2O-MLG powder samples were added to each beaker and uniformly shaken, using an ultrasonic device, until they became well-dispersed and homogenous solutions.
The aluminum precursor was collected as ready-made waste chips from industrial workshops, washed with water, and used without any other prior pretreatment. In the next step, a 1-L glass conical flask (reactor) was put in a magnetic stirrer at 750 rpm speed and 50 °C temperature. The system was connected by a rubber tube to another inverted tube in water dust, as portrayed in Figure 1. Subsequently, 100 mg of waste aluminum chips, 25 mL of distilled water, 15 mL of 0.4 M NaOH solution, and 15 mL of well-dispersed nanocatalyst solution were all vigorously mixed in the conical reactor at a speed of 750 rpm and 50 °C temperature. After that, H2 gas was generated from the reaction and transformed into the inverted tube, which was supplied with a volumetric meter to record the released H2 gas every 2 min until we observed no extra H2 release, indicating the completion of the reaction. Different variables were tested, such as reaction temperature (T = 30, 50, and 70 °C), pH (7, 9, and 12), reaction time (2–60 min), and catalyst amounts (2.0 and 3.0%). Finally, the released H2 amount was recorded for further analysis and interpretation. Control experiments were also performed with only distilled water (no aluminum addition) at different temperatures and pH, with and without nanocatalysts, to obtain the amount of water vapor released in each experiment.

3. Characterization and Measurement Tools

Field emission scanning electron microscope (FESEM, Ultra 55, from Carl Zeiss, Germany; 5 kV accelerative voltage) and a transmission electron microscope (TEM; FEI Technai G2 S-Twin; 200 kV accelerating voltage) were utilized for morphological studies of nanocomposite materials. X-ray diffraction (XRD; Bruker’s AXS Model D8, Germany; λ = 1.54 A) was utilized for identifying the phase structure of nanostructured materials in the 2θ range of (10–80°). Fourier transform infrared (FTIR) spectroscopy (Nicolet 380, Thermo Scientific, Waltham, MA, USA) was implemented to identify the functional groups and further surface properties of the particles. To confirm the structure of graphene materials and their presence in the composites, Raman spectroscopy (532 nm Nd-YAG laser; spectral resolution of 3 cm−1) was used. An ultrasonic device (capacity 5 L; 120-watt power; frequency 40 Hz) was employed to disperse the nanostructured materials before use in the Al-H2O experiments. A pH meter (PHSG-3F) was employed to measure the pH of the solution while performing the reactions. Distilled water was purchased from an identified local company and was used in the laboratory.

4. Results and Discussions

4.1. Hydrogen Production

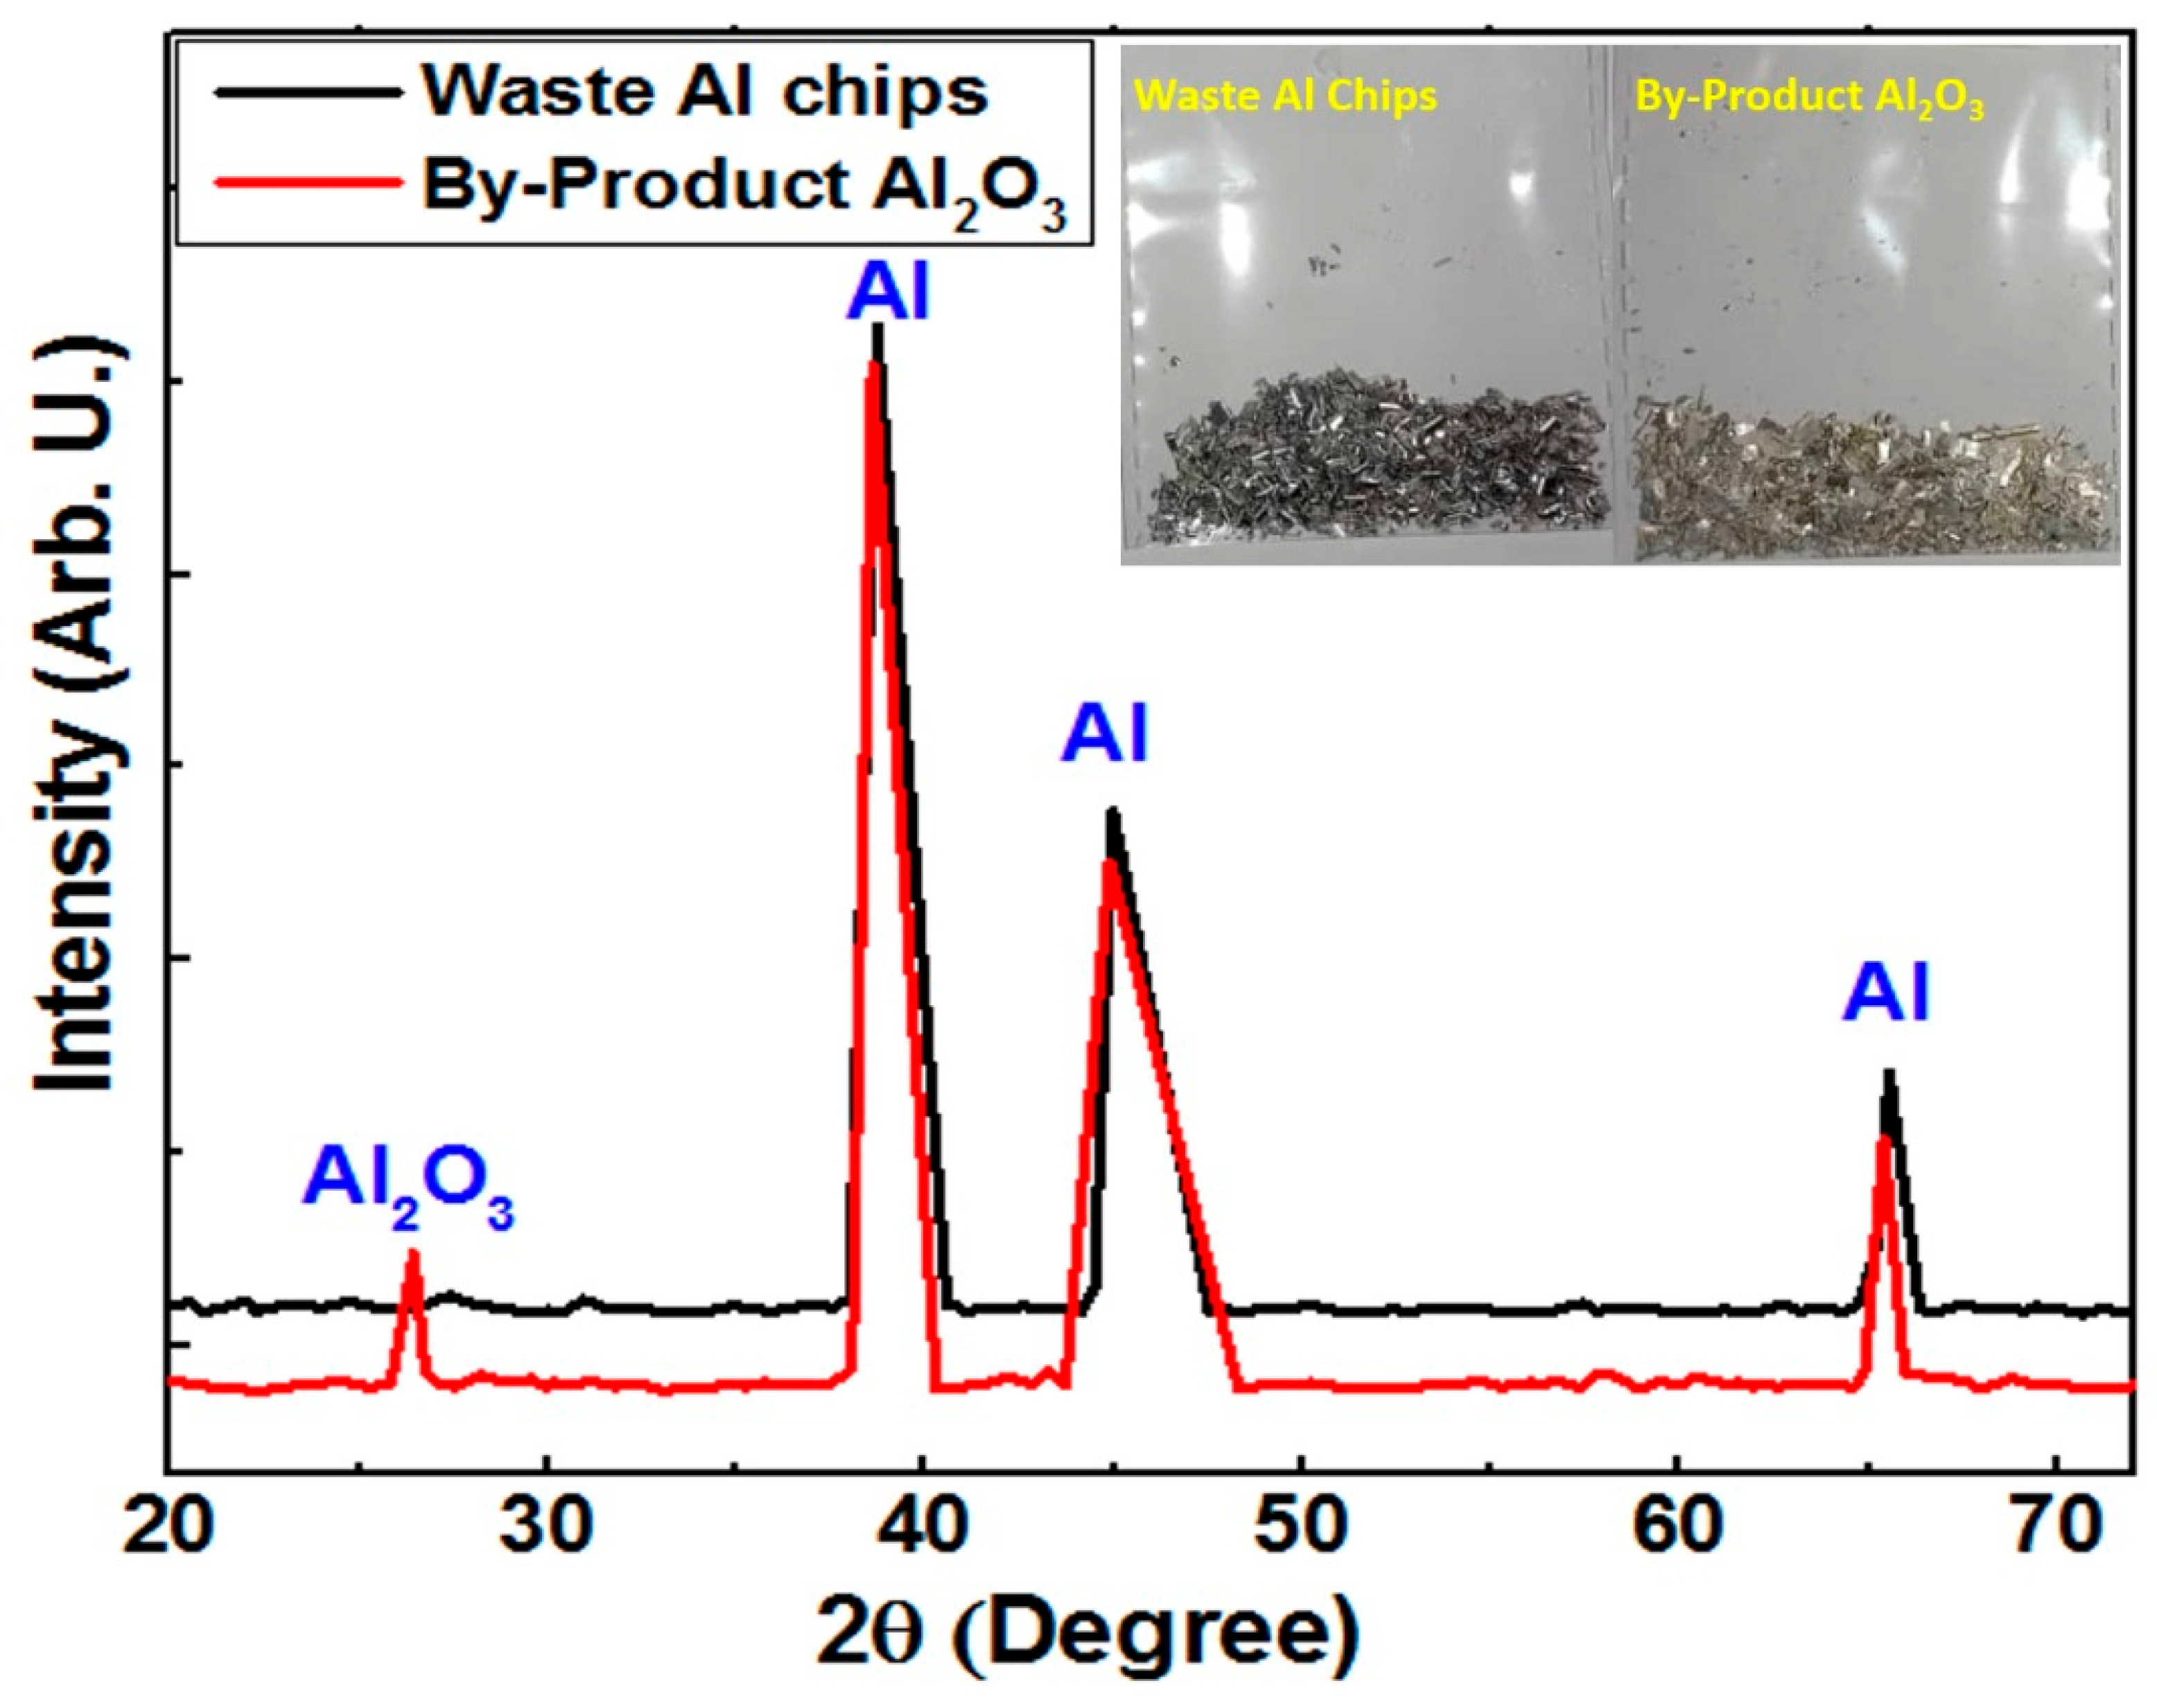
Figure 3 elucidates the phase structure and the purity of the waste Al chips and of the by-product Al2O3 chips that were identified using X-ray diffraction technology (XRD), without any prior treatment. The XRD results of the waste Al chips (black curve) showed three broad peaks that correspond to the pure Al phase. In addition, the XRD results of the by-product sample after completing the H2 production reaction indicate the presence of a small peak at 2θ = ~26°, which corresponds to the Al2O3 phase, as the reaction suggests. Compared to the pure phase of the waste Al chips sample, the second diffractogram (red color curve) shows a small uniform shift toward the lower angle for all peaks, which is plausibly due to the diffusion of O2 atoms to the lattice parameter of the Al structure.
There are many other indications that confirm that the reaction is proceeding in the correct way. The color change of the waste Al chips from black to white-gray is a sign of the formation of Al2O3 as a by-product (see inset of Figure 3). The ~50% Al2O3 mass increase, compared to that of the reactant starting materials in Figure 3, indicates the formation of Al2O3 as a by-product.
The reaction of Al-H2O proceeds along different pathways, producing different forms and providing different byproducts, based on the reaction’s conditions. The favored reaction, from the thermodynamic point of view, at temperatures below the boiling temperature of the water is presented in Equation (1):
2Al + 6H2O → 2Al(OH)3 + 3H2
The above reaction could not proceed unless a moderate heat is provided to the reaction, which assists in destroying the protective layer of aluminum oxide (Al2O3). This thin protective layer can also be attacked if the reaction is taking place in an acidic or alkaline solution, despite its corrosive nature. The plausible reactions of Al-H2O in the alkaline medium are given in Equations (2) and (3):
2Al + 2NaOH + 2H2O → Na2Al2O4 + 3H2
2Al + 2NaOH + 6H2O → 2NaAl(OH)4 + 3H2
Most importantly, all the proposed Al-H2O reactions, either in neutral or basic conditions and with nanocatalysts, could result in an identical number of H2 moles, whatever the reaction conditions are [46,50]. In other words, for every 2 moles of aluminum, there will be 3 moles of hydrogen gas that are released during the reaction. This theoretical amount of H2 from the Al-H2O reaction at room air conditions (pressure, P = 101.3 kPa, temperature, T = 25 °C) will be 1346 mL. In this regard, as the reaction temperature increases, the theoretical amount also increases, according to the general law of gases, to be 1459 mL and 1549 mL at 50 °C and 70 °C, respectively, assuming no change to the pressure during the reaction. Of course, a small increase in the pressure above atmospheric pressure will be preferable, to minimize water vaporization during the H2 reaction at moderate temperatures, since the reaction itself is exothermic and releases heat. Furthermore, introducing NaOH or nanocatalysts to the reaction does not increase the theoretical amount but does contribute well to destroying the thin protective layer of aluminum oxide at a rapid rate.
The exothermic nature of the reaction suggests the release of heat energy into the Al-H2O system, causing its temperature to increase slightly. The enthalpy of the Al-H2O reaction is in the range of 277–284 kJ/mol H2 at reaction temperatures in the range of 0–100 °C [50]. This potential heat energy will increase the temperature of water in the reaction if it is in the range of 25–50 mL/liter with a temperature of about (6–10 °C) above the temperature provided in the reaction conditions. However, this heat is released at the atomic level at the contact points between the activated aluminum atoms and H2O molecules, which causes these few in-contact H2O molecules to evaporate faster and then to transfer their heat to the surrounding H2O molecules. This explains why the released H2 gas is accompanied by water vapor, even at a reaction temperature below that of the water evaporating point (T = 100 °C).
To this end, all the aforementioned calculations suggest that there is no change to the reactor’s pressure. However, to some extent, this is not correct. The design of the reactor with a 1-meter-height inverted tube that is filled with water at the beginning of the reaction suggests that the pressure at its downside will be more than atmospheric pressure by ~10%, according to the hydrostatic law. The pressure at the top of the conical flask should be greater than that at the inverted tube, to allow the released H2 gas to flood into the inverted tube and replace the water that fills it (the fluid flows from higher-pressure tanks to lower-pressure tanks). However, according to Bernoulli’s principle, the reaction is performed at a rapid speed of up to 750 rpm using a magnetic stirrer, which may create a vacuum pressure that is plausibly a major source of water vaporization in the reaction, below its normal evaporating point (100 °C). Releasing more of the H2–steam mixture in the reactor room increases the pressure at its upper side, which drives the flow of the H2–steam gas mixture to the other side of the reactor for separation and storage.
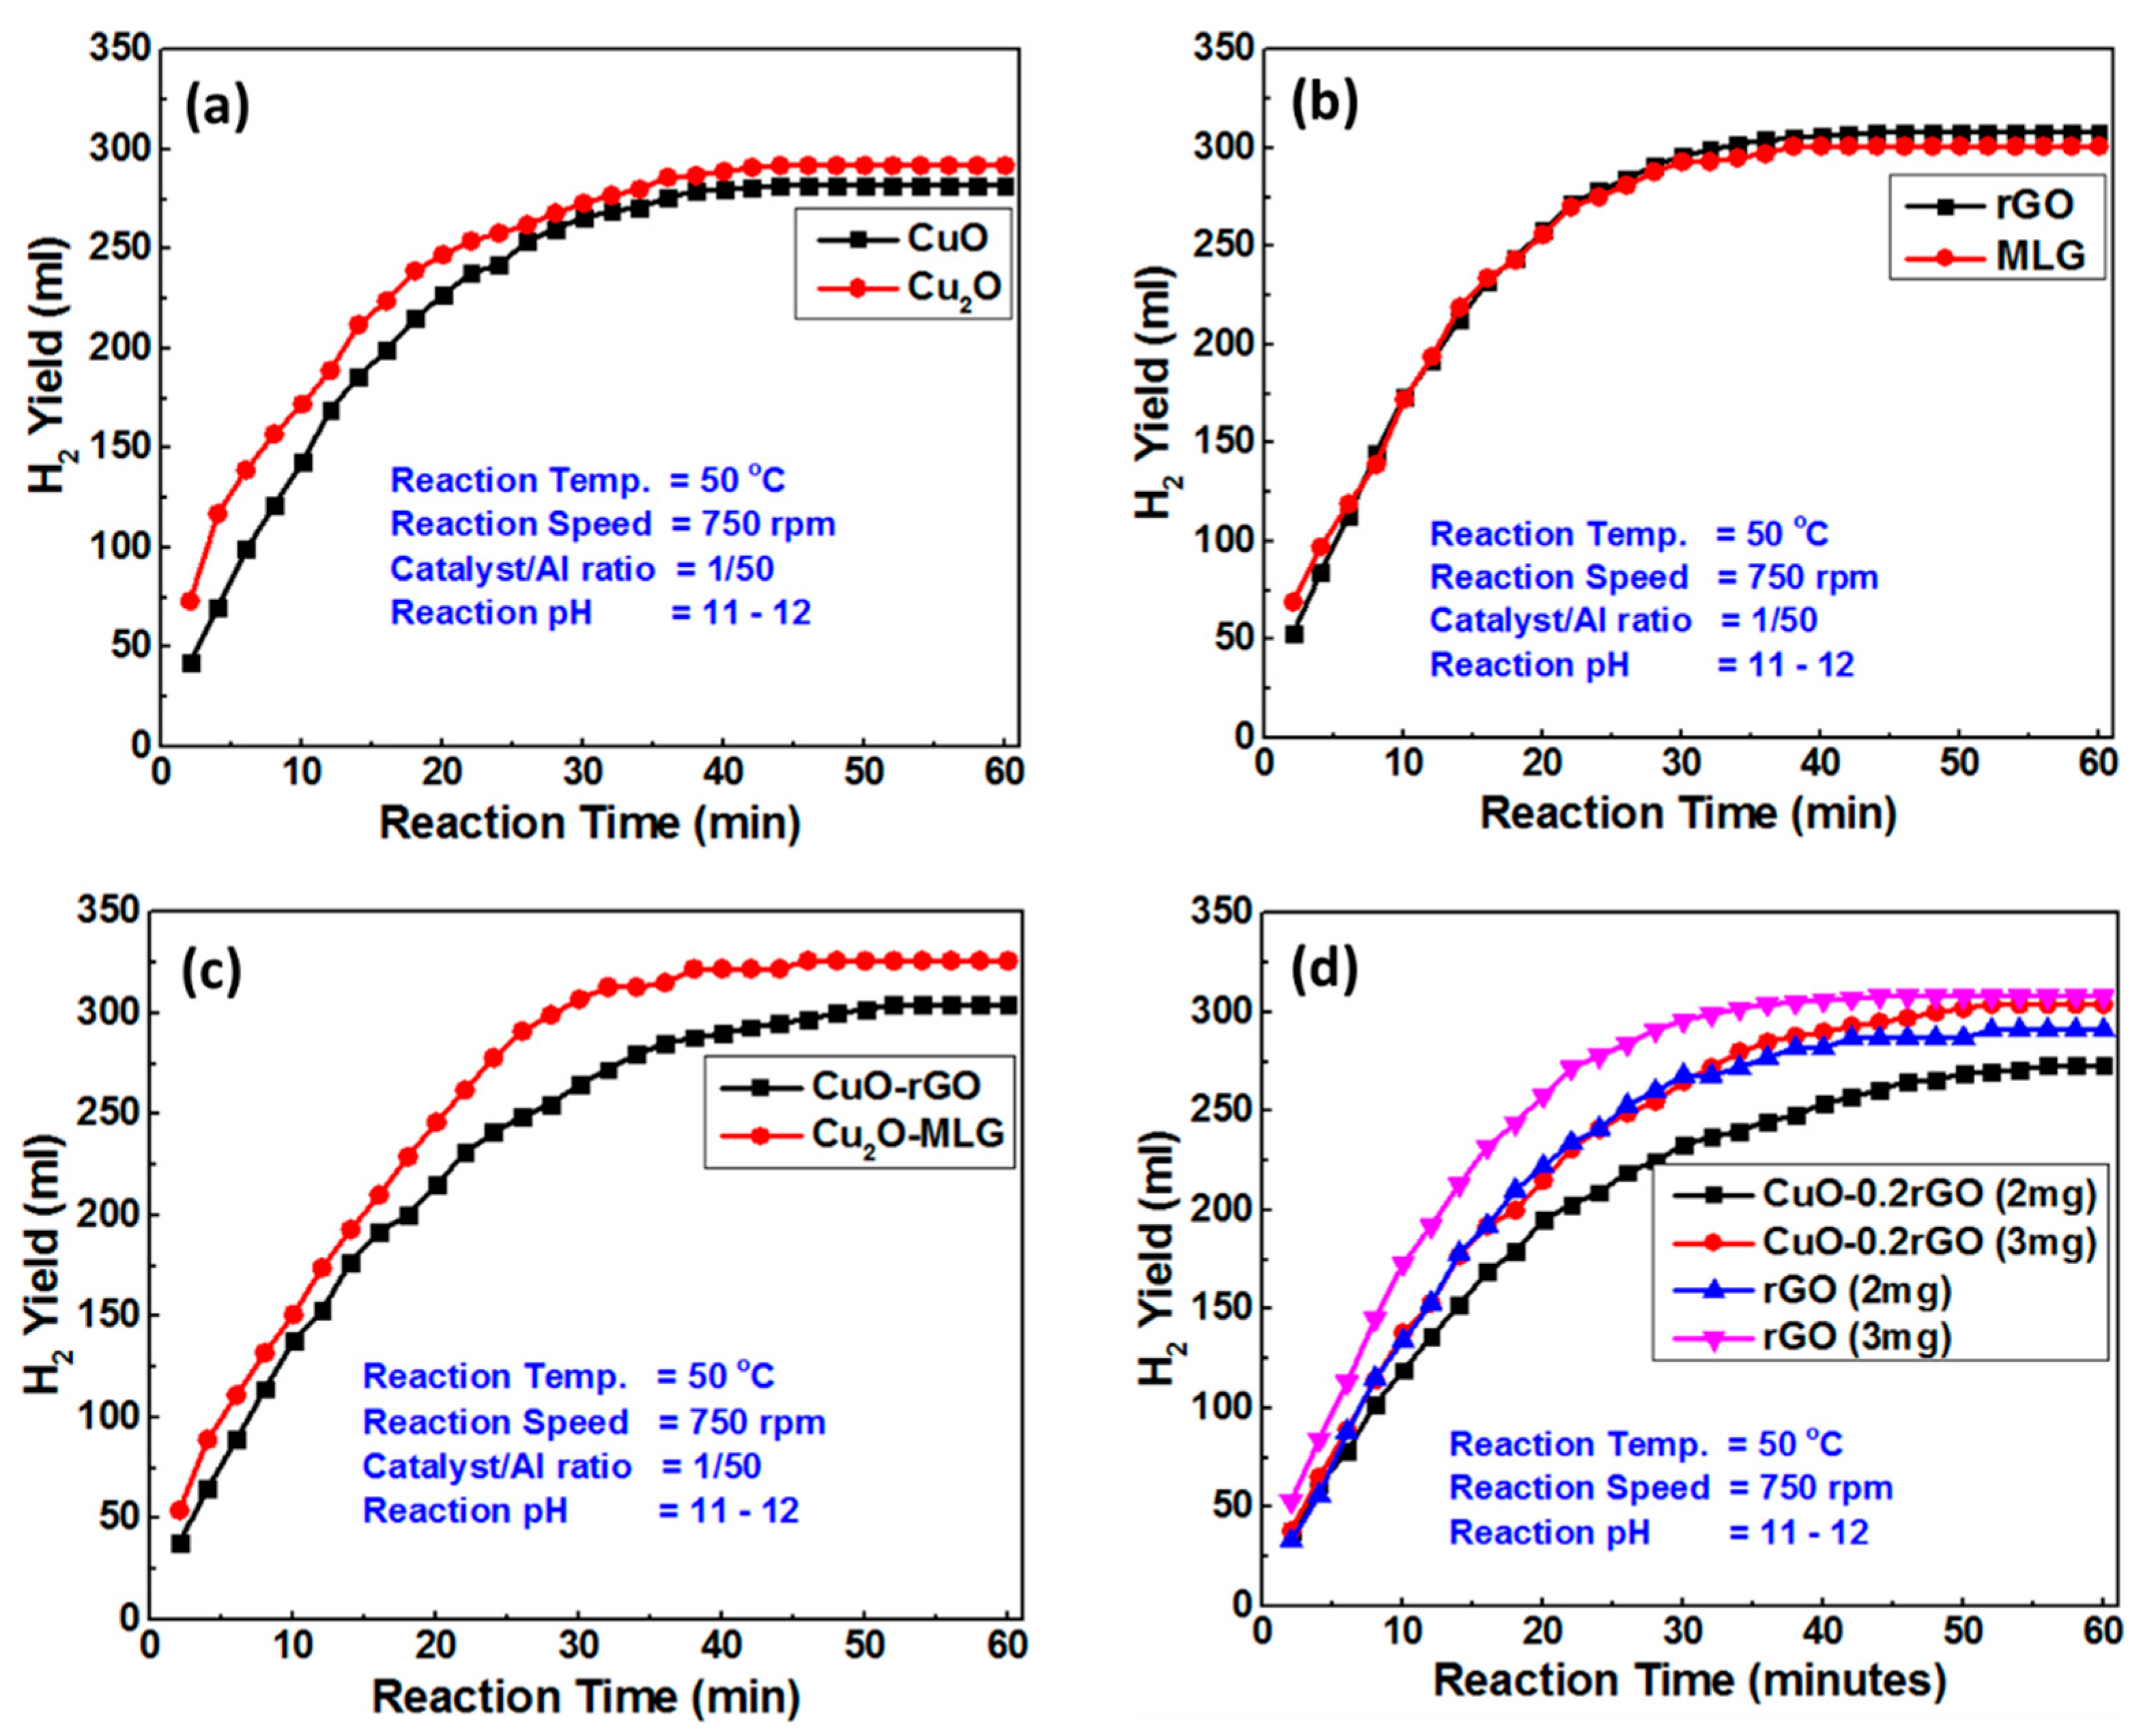
Figure 4 shows the catalytic activity of different copper oxide-based graphene nanocomposites. It compares the catalytic activities of CuO vs. Cu2O, rGO vs. MLG, and CuO-rGO vs. Cu2O-MLG. Figure 4a investigates the catalytic activity of cuprous and cupric oxide nanocatalysts in activating H2 production from waste aluminum. The reaction was executed at many constant parameters, as shown in the figure. The results displayed the high catalytic activity of both types of copper oxides (Cu2O and CuO), with higher priority given to Cu2O nanoparticles. This is possibly due to its high stability, high surface area, and higher band gap. It was reported that Cu2O nanoparticles with faceted sharp faces (as in the present study) showed better catalytic activity than those with spherical or irregular shapes [51,52,53]. Furthermore, the reaction of CuO with H2 reduces its oxidation state to Cu2O and pure Cu [54]. The reduction reaction generates “O” vacancies due to the penetrating of H2 into the unit cell of CuO, causing it to expand and release oxygen atoms. Those free oxygen atoms participate in weakening the aluminum oxide protective layer. As the reaction is initiated, the released H2 is consumed in the reduction of CuO rather than being transformed into an inverted tube. This explains why the catalytic activity of Cu2O seems faster than that of CuO at the beginning of the Al-H2O reaction. The activation energy of CuO reduction is almost half that of the corresponding Cu2O phase [54,55]. Additionally, this was observed in the convergence of curves after ~20 min of the reaction. This is enough time to reduce most of the CuO structure to metallic copper, which is always more active than its oxide phases, as shown in Figure 4a.
Correspondingly, Figure 4b compares the catalytic activities of rGO and MLG. The results indicated that graphene materials (rGO and MLG) presented the highest H2 yield among other composites. The results indicated almost similar extraordinary activity for both rGO and MLG, except for the fact that MLG is faster in destroying the aluminum oxide protective layer, plausibly due to its higher surface area. On the other hand, rGO indicated the highest yield of all the studied graphene materials, plausibly due to a functionalized surface with oxygen and hydroxide groups, more than MLG [30,31]. Of course, graphene materials (MLG and rGO) have been proven to be good H2 storage material, with low capacity and low-energy binding forces [32]. This explains why, at the beginning of the reaction, the H2 production rate was slow and then increased after a couple of minutes. Because graphene materials are expensive and have the ability to physisorb, we recommend using them as catalysts for H2 storage reactions and not as a way to increase the production yield.
Figure 4c compares the results of the catalytic activity of the CuO-rGO and Cu2O-MLG samples, which yield 20% graphene by weight. The results demonstrated that Cu2O-MLG exhibited the highest H2 yield, compared to CuO-rGO. Both Cu-based graphene materials showed higher values than the corresponding samples without graphene. The extremely high surface area and the well-engineered surface of the graphene materials improved the dispersion of the particles and then inhibited their aggregation.
Figure 4d represents the effects of nanocatalyst concentrations, in terms of the H2 yield and production rate. At the constant parameters in the figure, an increase in the CuO-0.2rGO from 2 mg/100 mg Al to 3 mg/100 mg Al could increase the production yield and rate profoundly. Similarly, an increase in the amount of rGO by 50% showed an obvious increase in the H2 yield and the production kinetics. Further experimental investigation is required to establish the best concentration value for improving the H2 production rate and yield, which will be considered in future works.
Figure 5a,b describes the effect of using CuO and Cu2O-based graphene nanocomposites as catalysts for H2 elaboration from waste aluminum chips. This removes doubts and emphasizes the substantial effect of implementing copper oxide-based graphene as a nanocatalyst. It reveals that H2 generation could be doubled using Cu-based nanocatalysts, compared to H2 production without catalysts. Not only that, but the H2 production rate also increased profoundly, especially with Cu2O-based graphene composites, as shown in Figure 5b. Furthermore, the results of Figure 5b indicated that Cu2O-0.2MLG nanocatalysts displayed the best production yield of all the catalysts studied in the present work. In addition, rGO and MLG exhibited outstanding behavior for both production yield and rate, despite their economic issues. Interestingly, as a comparison between the Cu2O sample (red color curve) and Cu2O-0.2MLG (brown color curve) in Figure 5b, the H2 production rate is the highest for the Cu2O sample for the first 20 min of the reaction. After that, the production rate slows, in contrast to the Cu2O-0.2MLG sample, which is also a common event for the MLG sample.
To conclude, CuO-rGO and Cu2O-MLG nanocatalysts are the best candidates for the feasible production of H2 from waste aluminum. The above experimental results investigated the H2 yield per 100 mg of Al, whereas the H2 yield should be multiplied by 10 to be measured in ml/g. These values are much greater than the optimum theoretical values mentioned earlier in this paper of 1346 mL, 1459 mL, and 1549 mL at 30 °C, 50 °C, and 70 °C, respectively. The amount of H2 released in the experiments carried out by this study is more than two times that of the corresponding theoretical values. This undoubtedly implies that the H2 produced by this method is accompanied by large amounts of steam and requires studying their quantities and making attempts to separate the two.
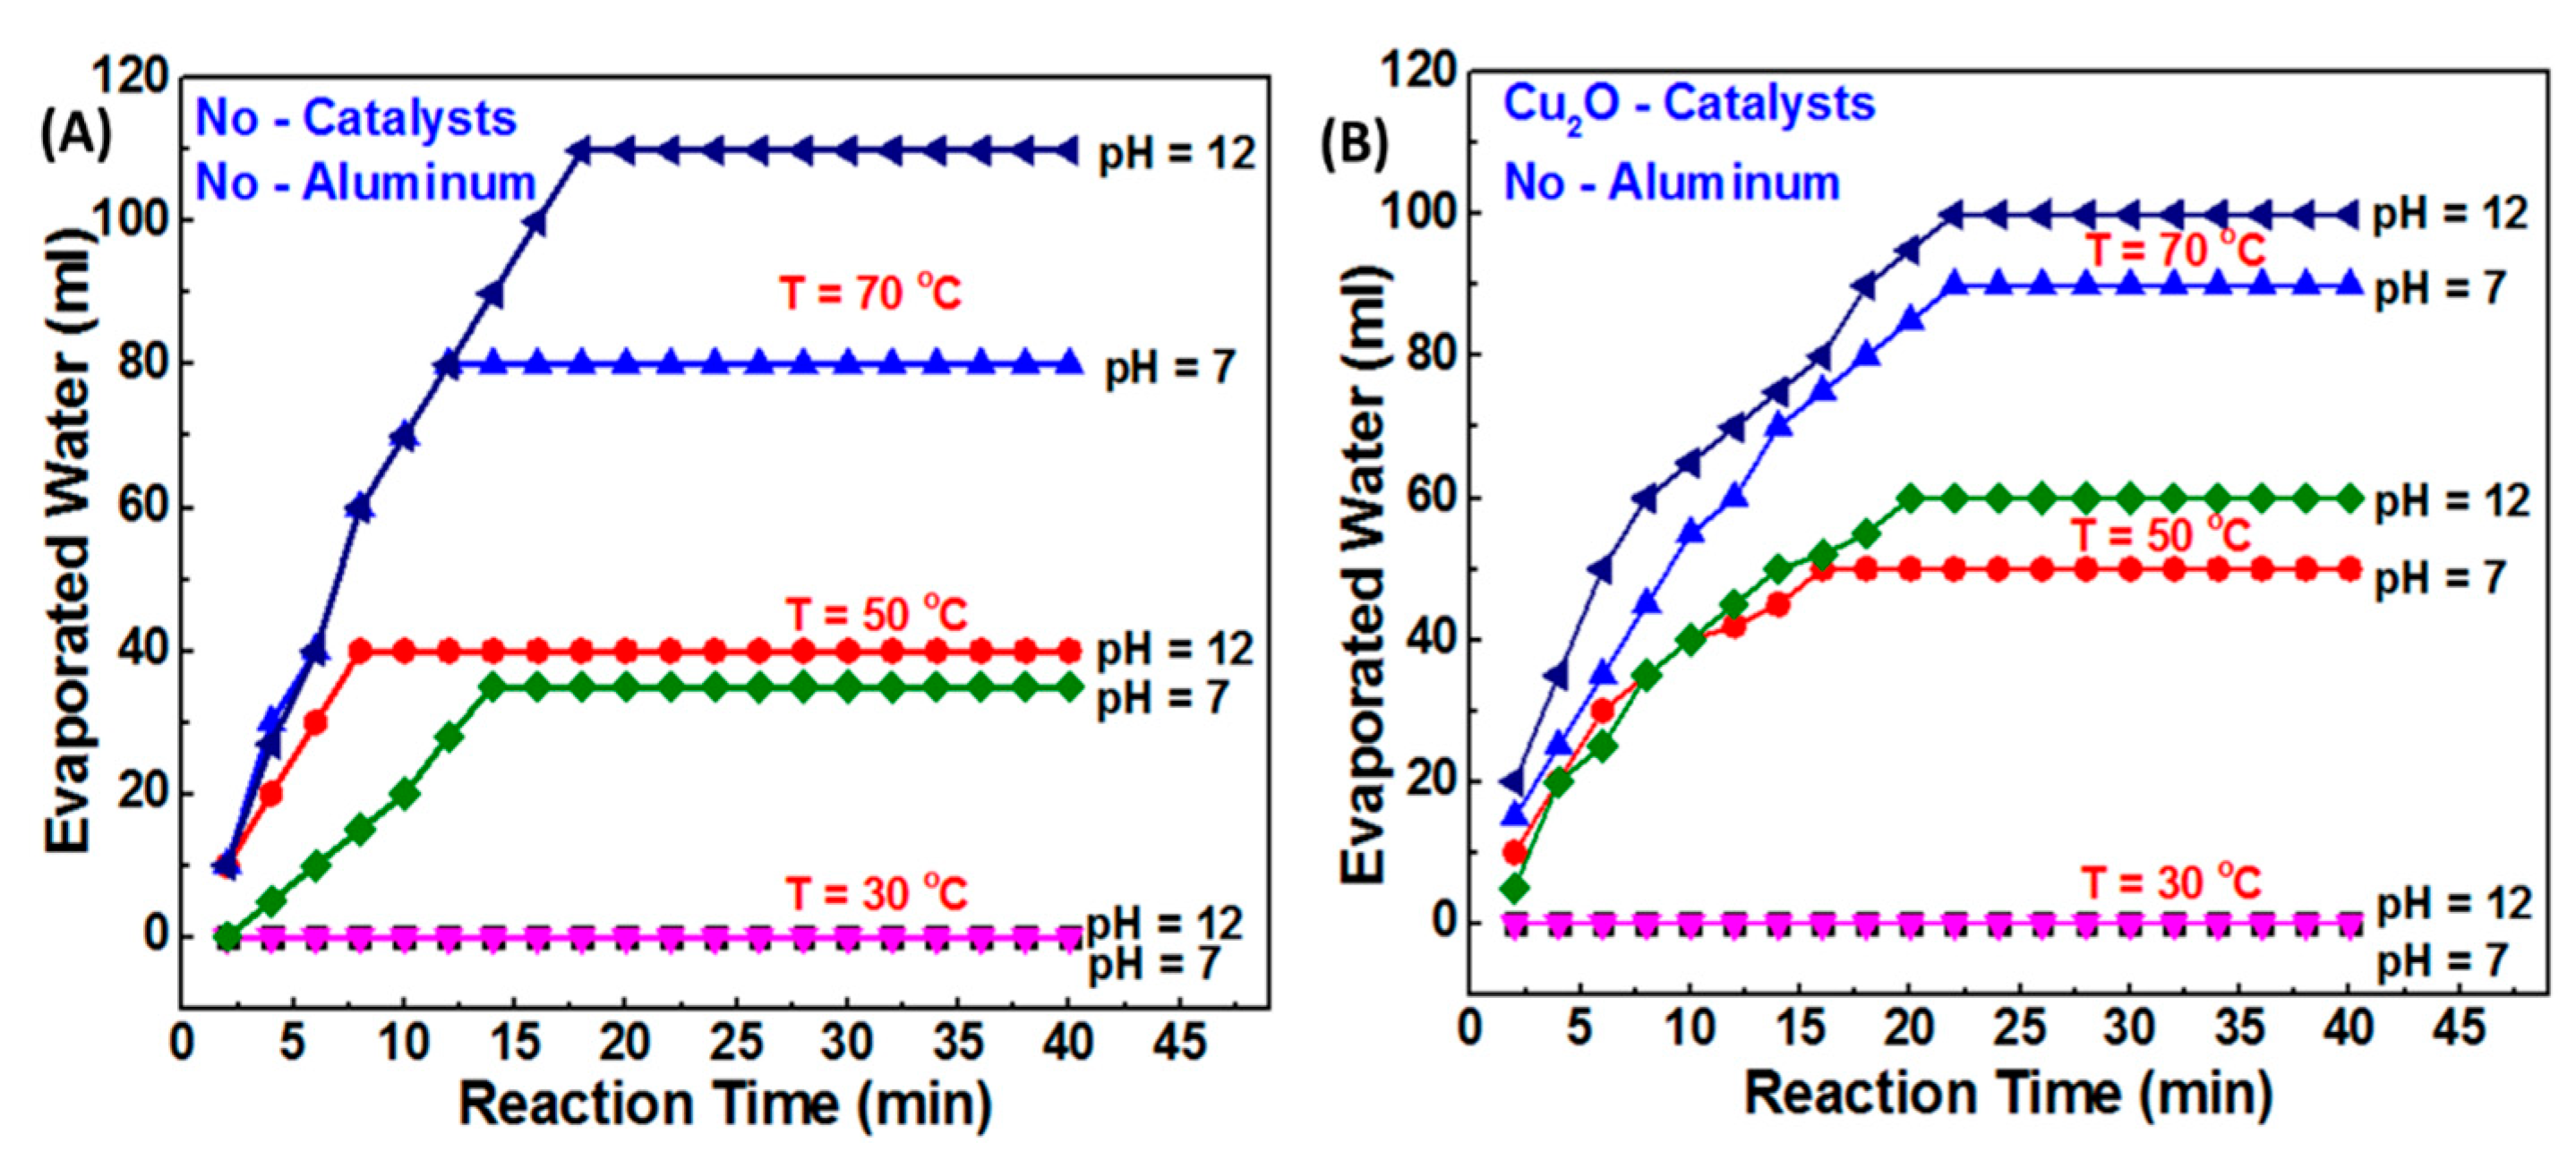
To verify whether water is vaporized along with H2 gas in this reactor design or not, a series of experiments using distilled water only (without adding aluminum) at different catalyst concentrations, pH, and temperatures were performed. Figure 6 exhibits the findings of the water vapor in ml per 50 mL of water that is released at different reaction temperatures and pH, without nanocatalysts. The results confirmed that the rapid stirring of 50 mL of water at T = 30 °C releases zero water vapor, whatever its pH value may be. The amount is slightly increased with the increase in temperature. It reaches up to 40 mL and 100 mL at T = 50 °C and T = 70 °C, respectively. The results suggested that both the pH and temperature of the reaction influence the water vaporization rate, but the role of the reaction temperature is more pronounced. These experiments undoubtedly suggest that the reaction of Al-H2O could release a mixture of (H2-H2O(g)) and provide an estimation of its constituents at different levels of pH and temperatures.
Of course, our investigation at the laboratory stage (Figure 6B) indicated that even when adding nanocatalysts to the distilled water, there is a negligible change in the amount of steam released. However, the exact amount of the released steam might be more than the given quantities, due to the exothermic nature of the reaction during the Al-H2O reaction, which generates extra heat for the reaction. To underline, the presence of water vapor along with H2 gas is not an insurmountable problem if their concentrations are identified. Steam can be easily separated by implementing a heat exchanger to cool the (H2-H2O(g)) gas mixture, condense water vapor molecules, and separate them from the H2 gas prior to its storage and use. In the future, similar designs should be implemented when designing the H2 reactor in a similar setup.
To conclude, the most efficient and feasible elaboration of H2 gas from waste aluminum requires various design and operational considerations: (1) the reaction temperature should be up to 50 °C to avoid water vaporization, (2) the speed of the magnetic stirrer should be minimized to avoid first vacuum pressures and then water vaporization, (3) the reactor should be supplied with a heat exchanger to condense the water vapor and separate it from H2 gas, (4) strong basic/acidic medium reactions should be avoided due to their corrosive nature, (5) research-based nanocatalysts to enhance the reaction rate offer an optimal option, especially in the case of cost-effective and hybrid nanocatalysts, and (6) recycling the byproducts of the Al-H2O reaction by reducing Al2O3 to aluminum will enhance the efficiency and economy of production.

4.2. Economic Feasibility Study

In many aspects, the production of H2 from waste aluminum is analogous to water splitting by electrolysis methods. In the case of the electrolysis process, each 9 kg of water produces 1 kg of H2. Similarly, in the production of H2 from waste aluminum, 9.33 kg of waste aluminum produces 1 kg of H2.
On the one hand, the price of raw materials is completely different, the price of water is much less than that of waste aluminum. On the other hand, for each 1 kg of aluminum, there will be 1.86 kg of Al2O3 as a byproduct. The latter product is denser and more expensive than waste aluminum. Assuming the cost of Al2O3 is similar to the cost of waste aluminum, and assuming 80% conversion efficiency, there will be a gain of USD 0.244 for each kg of aluminum that produces H2. This demonstrates that when transferring 1 ton of aluminum to H2, a gain of USD 244 is made as an additional amount to be obtained from the raw materials. One more important parameter is that the specific density of aluminum is 2.7 and that of Al2O3 is 4.0, indicating that the volume of both waste products before and after the hydrogenation experiments will be almost similar, but their masses are different.
Based on the theoretical calculations of producing 1kg of H2 using 9 kg of water for producing 1.4 L H2 from 1g aluminum, an amount of ~0.1 mL H2O would be consumed for the generation of the H2 gas, with ~1.5g of Al2O3 as a byproduct. Accordingly, if 100 mL of H2O is used in a single reaction, it will be sufficient for ~1000 cycles to consume the whole volume of water. This suggests that the water used for the reaction in the experiments can be efficiently recycled dozens of times, without the need for any additions.
Table 1 elucidates the predictable quantities in kilograms per production cycle for all raw materials (aluminum (chips and block), sodium hydroxide, copper chloride, and distilled water). In addition, the production cycle time and the expected costs in USD per kg and per cycle of these materials are also recorded in Table 1. The production yield of nanocatalysts and their costs (here, only Cu2O NPs were considered for the feasibility study analysis) were based on the obtained CuCl2/Cu2O ratio, as indicated in the methodology section. The critical path of the lead time (the amount of time it takes to go from the raw materials to the finished product) was set at 60 min because all H2 production experiments that are supported by nanocatalysts do not require longer than this time.
The capital cost of the established system was estimated using the CAP COST software [56]. In addition, the operation costs of raw materials, utilities, and labor costs were included and estimated, based on the present market price in Yemen. The daily processed quantity of Al in the production line is 432 kg at 90% efficiency, which produced about 581,500 L of H2 (theoretically, 1 g of Al produced 1346 mL of H2 [56]). Furthermore, the cost analysis in Table 2 exhibits the production cost of H2 in this system, which is USD 0.0017/liter for waste aluminum chips and USD 0.0027/liter for waste aluminum blocks. In other words, the cost of H2 is USD 6.71/kg and USD 11.66/kg for both chips and blocks waste, respectively (1 L of H2 = 0.081 g at 25 °C and atm. pressure) [56,57].
Table 3 summarizes the cost per kg of H2 produced from the different waste resources and compared it to the results of the present study. It demonstrates that the current study provides a competitive price for the produced H2 gas. To conclude, the production of H2 from waste aluminum is a competitive alternative to water-splitting methods and the cost is almost similar. Therefore, this technique requires more investigation for designing a reactor that is able to elaborate upon the mass production of H2 gas for each batch. The reduction in cost can be optimized by increasing the daily production rate and the use of efficient conversion technologies.

4.3. The Phase Structure and Surface Properties of Nanocomposites

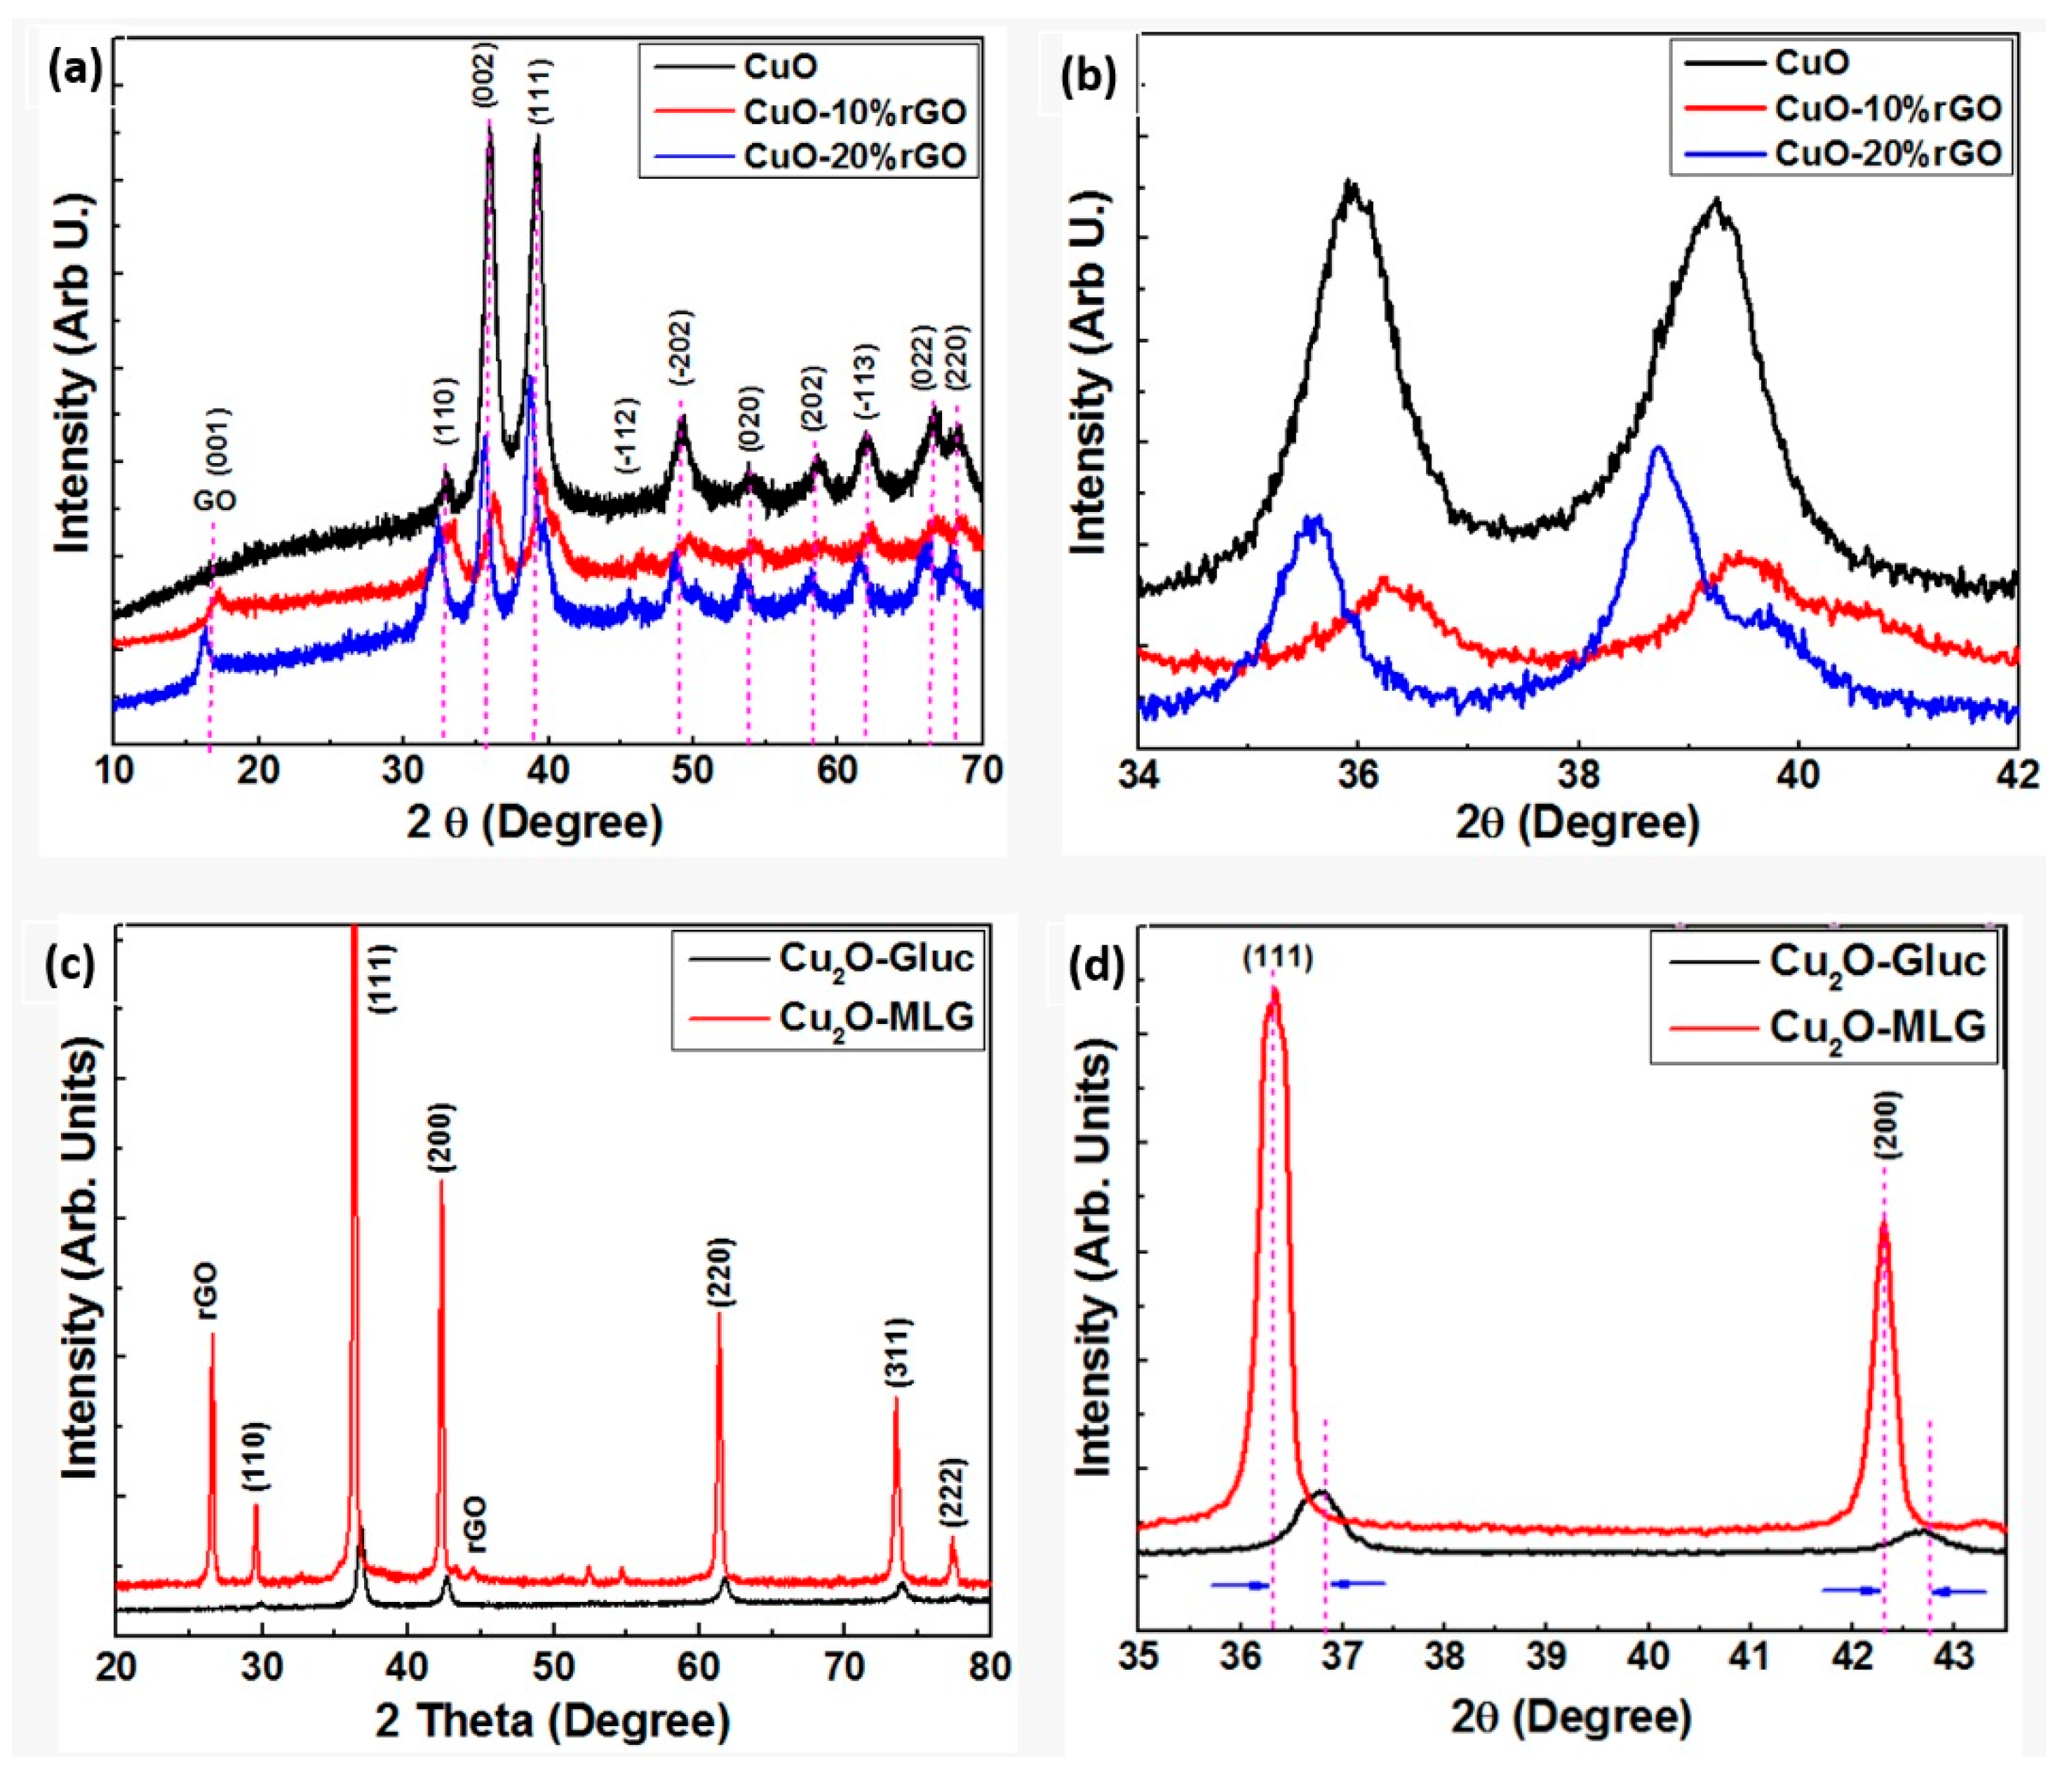
XRD analysis was carried out to obtain the phase structure of copper-based graphene nanocomposites, as portrayed in Figure 7. The results in Figure 7a demonstrate the structure of the samples. In fact, the identification of the graphene phase is easily achieved by XRD analysis. The presence of graphene in the samples is indicated by the broad peak at 2θ = 16.5° for those CuO samples that have graphene. The graphene peak in this 2θ range is strongly based on the level of oxygen moieties, interrupted by the graphene sheets due to the reduction process. A confirmation of the formation of GO by XRD analysis could be obtained by shifting the (002) diffraction peak at around 26° of graphene to ~16° of GO [63,64,65]. This change in position is due to the absorption of water molecules during the oxidation process.
The pattern of all studied samples is identical and corresponds to the crystal planes of the monoclinic CuO structure. The results showed high-intensity peaks in the CuO-Extract sample, as compared to CuO-rGO samples (Figure 7a,b), indicating the high crystallinity of this CuO sample. It is notable that adding graphene materials to the CuO-Extract sample exhibits no change in the structure of the CuO NPs but shows various differences in terms of crystallinity, agglomeration, particle size, and atomic disorder. The intense peaks of the CuO-rGO samples are lower than those without graphene, indicating low crystallinity, plausibly due to the composition change of the unit cell. In addition, all XRD peaks show a shift toward lower/higher angles due to graphene, plausibly as a result of the local residual stresses at the grain boundaries from a composition change, due to the presence of ultimately large surface-area graphene sheets in the powder [66,67,68]. In fact, doping atoms of different structures will definitely shift the XRD peaks in either direction [69,70]. This could be evidence of the small shift of peaks towards higher/lower angles. The broadness of the XRD peaks of the CuO samples containing graphene indicates the fine crystallites in the samples.
Figure 7c,d depicts the XRD pattern of the Cu2O and Cu2O-rGO powder samples. The pattern indicates the pure structure of cupric oxide in both samples. For the Cu2O-rGO sample (red graph in Figure 7c), an intense peak at 2θ = 26.5° is related to the (002) diffraction of the graphene structure in the samples. There are few non-indexed peaks in the Cu2O-rGO sample, which corresponds to a pure copper structure, indicating that the presence of graphene reduces the oxidation of the nanomaterials [69]. The width of Cu2O peaks is not broadened, which is another indication of the large particle sizes of Cu2O (black graph in Figure 7c,d). Unlike in the case of the CuO peaks, the intensity of the Cu2O-rGO peaks is significantly higher than those of Cu2O without graphene, plausibly due to the graphite structure of the graphene, which shows a higher order of crystallinity than the graphene oxides. There are large and uniform shifts toward the lower angle for Cu2O-rGO Bragg peaks, as compared to the Cu2O peaks. This is plausibly due to divergence in the incident beam, due to the effect of the large-area graphene sheet, causing structure disorder, and the reduction of defects, such as grain sizes and grain boundaries [70]. The uniform shift and broadening of the peaks indicate that the uniform strain induced in the Cu2O-rGO sample is due to the expansion from residual stress developed in the matrix material.
The structure of copper oxide-based graphene nanocomposites was also characterized using Raman spectroscopy (an ideal characterization tool for carbon-based nanomaterials [71,72]), as shown in Figure 8. In this regard, Figure 8a describes the Raman spectrum analysis of CuO-decked rGO samples. There are identical peaks in both CuO-rGO samples at a Raman shift of 270, 360, and 598 cm−1 [73,74]. These peaks confirm the reduction capability of the plant extract to reduce the copper precursor to a pure phase of CuO [75]. The presence of a broad peak at wavenumber 780 cm−1 is an indication of the fine nanoparticles of CuO prepared by the extract [46,76]. Furthermore, Figure 8a shows two broad and intense peaks at 1350 and 1550 cm−1 as an indication of the presence of graphene in the samples [73,76]. The spectra demonstrate that the intensity of D, G, and D+G bands increases as the amount of rGO is increased in the sample. The broadness and low intensity of the D+G band in the wavenumber range of (2700–3200 cm−1) is an indication of the rGO but not of multi-layer graphene. In contrast, the Raman spectra in Figure 8b display the different characteristics of graphene materials, which are of MLG. The intensity of peaks and their positions correspond to multi-layer graphene (MLG). The extremely high IG/ID ratio is an indication of the MLG. Finally, there is a clear band at a Raman shift of 490 cm−1, which is an indication of the oxidation state of cuprite oxide (Cu2O) [39,48].
The surface functionality of copper–graphene nanocomposites was verified using FTIR spectroscopy and is illustrated in Figure 9. The spectrum indicates clearly that the addition of rGO to the CuO matrix illustrates a dramatic change in the surface functional groups of particles. This, in turn, was clearly observed through varied peak intensities, shifts through positive or negative angles, and the appearance of new peaks. An intense peak at 596 cm−1 for the three CuO samples can be attributed to the oxidation state of the Cu–O stretching state [77]. The stretching mode of C–O at 1366, 1490, and 1622 cm−1 is also an obvious sign of the incomplete decomposition of the carbonyl functional groups under the reaction conditions. In addition, the aromatic C=C peak at 1622 cm−1 was also attributed to the skeletal pulses of the graphitic domains. The absence of stretching peaks in the range of (1000–1300 cm−1) indicated that oxygen-containing carboxyl groups have been removed during the reduction of graphene oxide. The presence of an intense band at 3442 cm−1 of the C-OH of graphene oxide is a strong signal regarding the incomplete reduction of graphene oxide [76]. Another broad peak at 3332 cm−1 could be assigned to the O-H stretching vibration of graphene oxide [78].
Figure 9b exhibits the FTIR spectra results of Cu2O samples without and with graphene. The results showed many bands of various intensities, indicating rich biomolecules in the particles. Both samples show identical peaks. The results indicated that MLG has caused almost all peaks to shift toward a higher wavenumber. This similarity of peaks could plausibly be due to the implementation of the same reducing agent (glucose) while synthesizing both samples.

4.4. Morphology of the Nanocatalysts

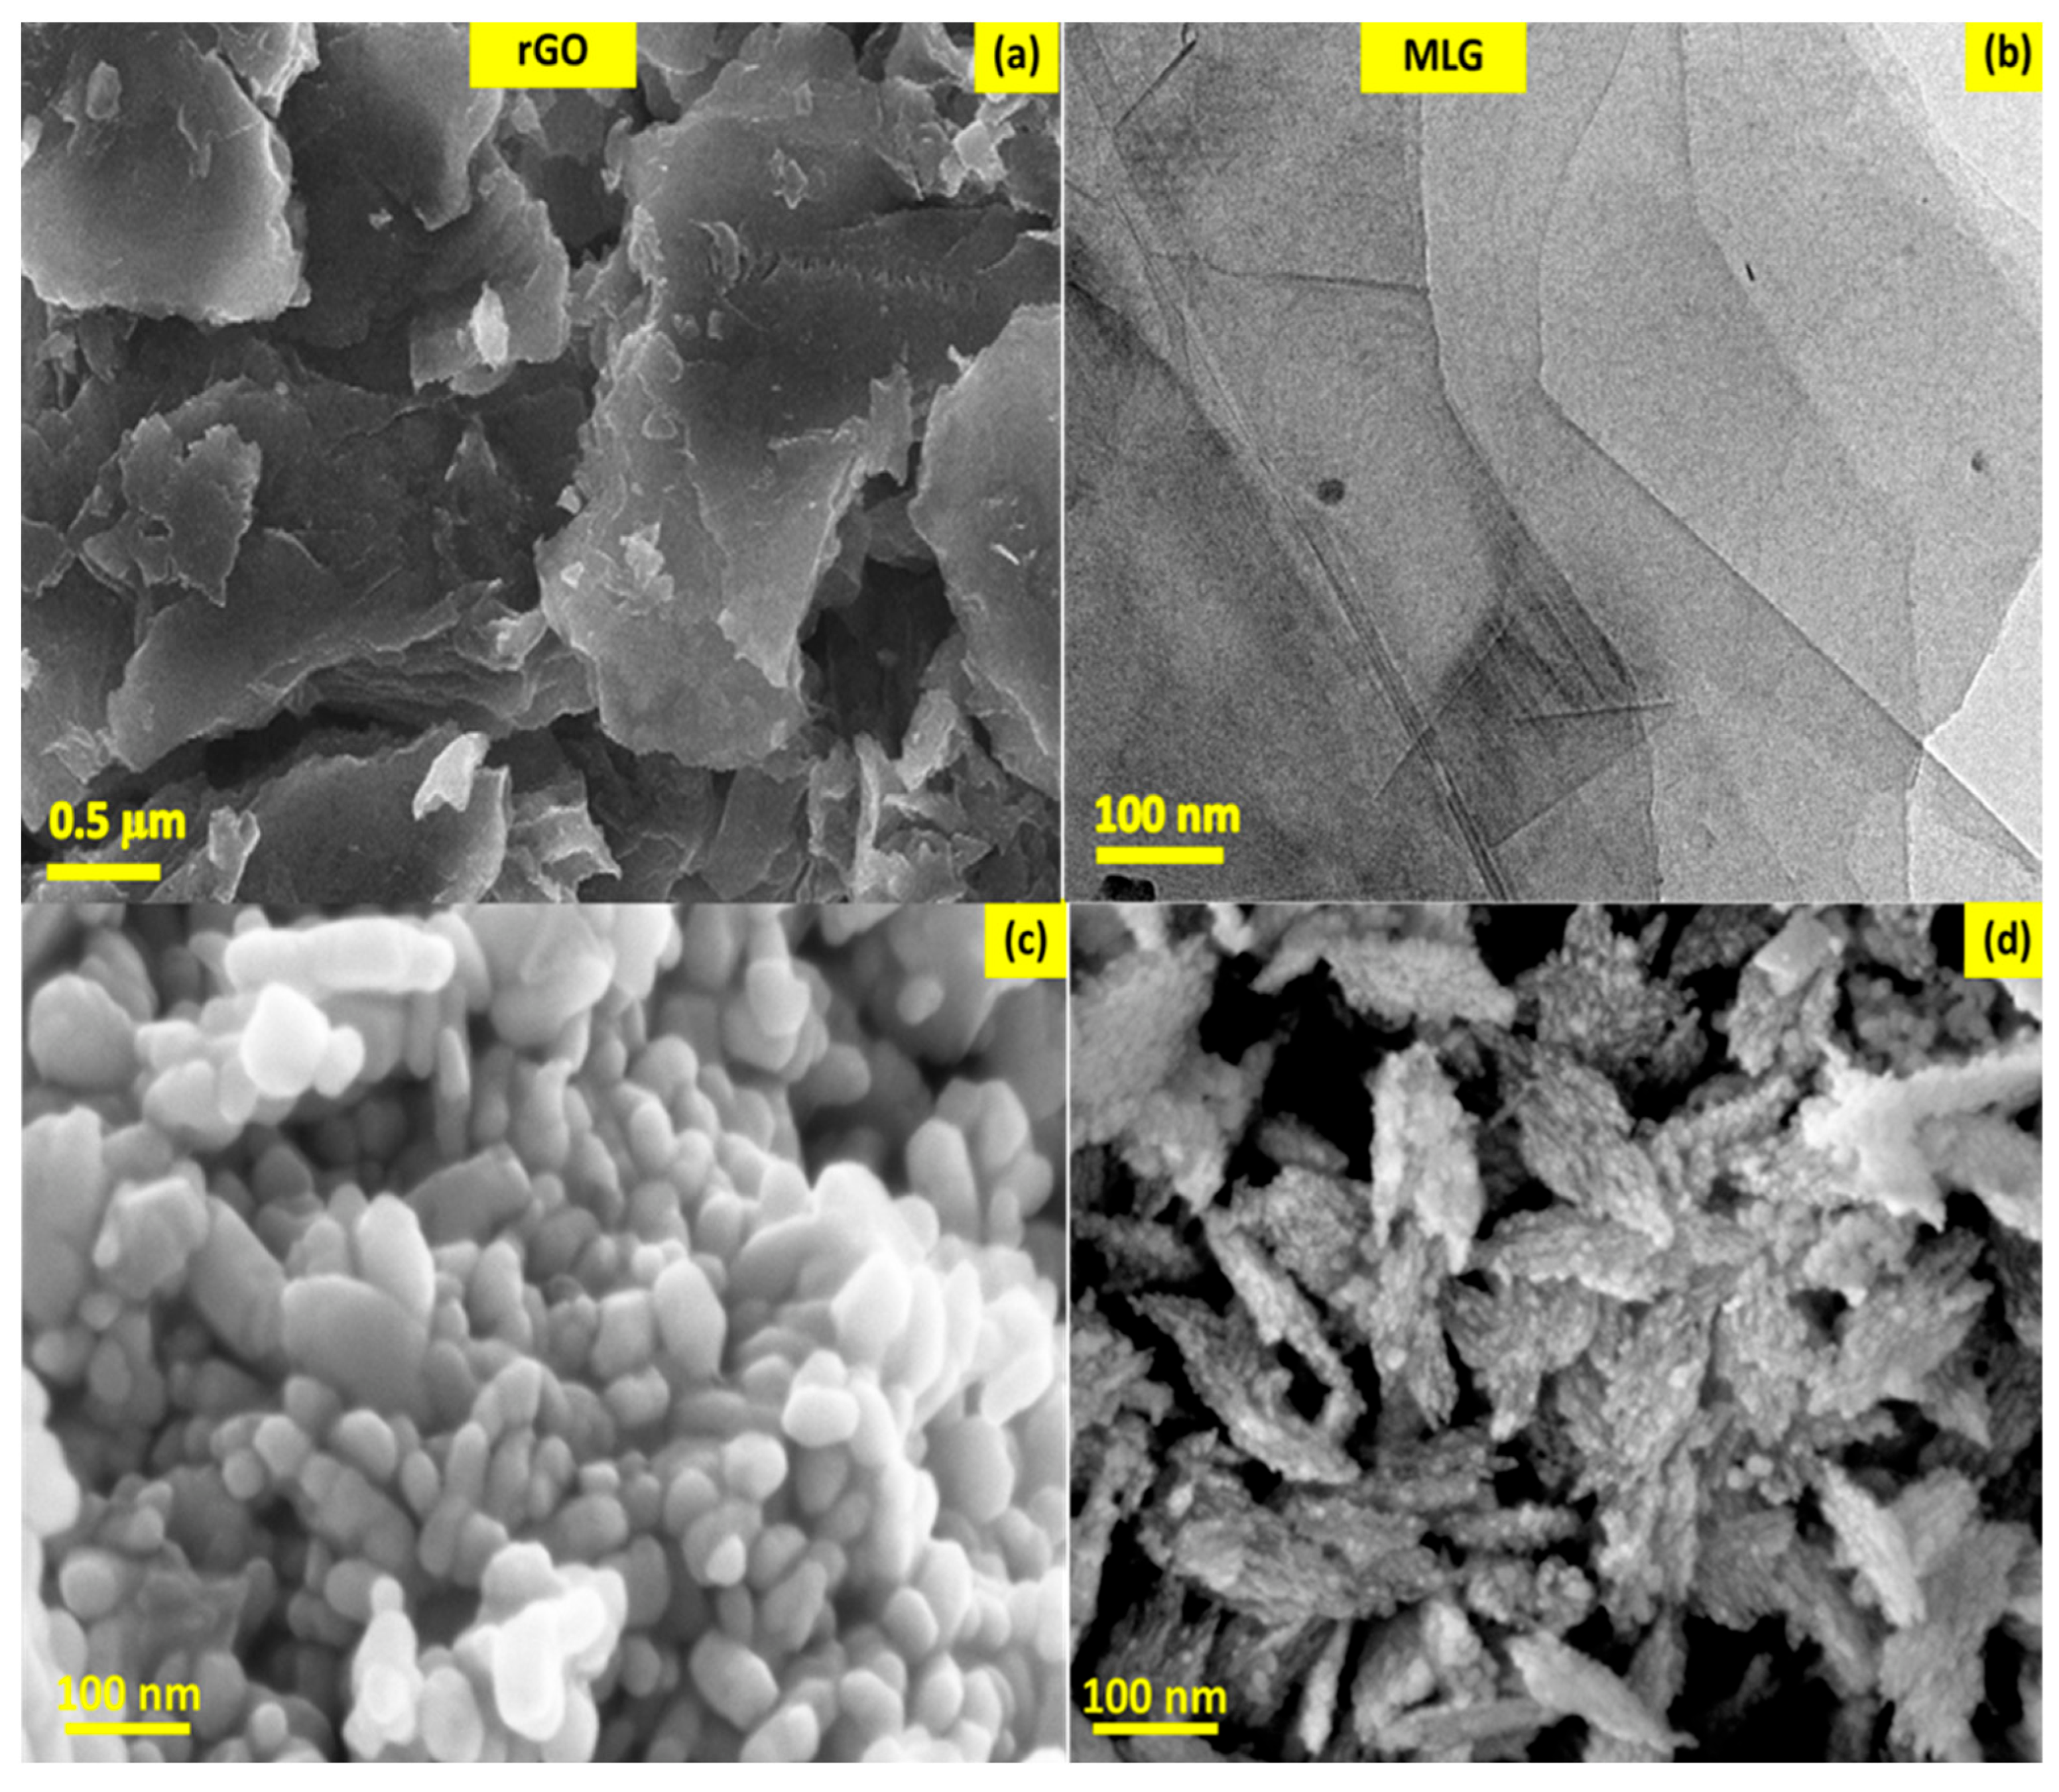
The morphology of the powder samples was investigated, utilizing the FESEM and TEM techniques. Figure 10 displays electron microscope micrographs of the rGO, MLG, CuO, and CuO-rGO samples. The image of the rGO sample (Figure 10a) shows thin and long flake-like nanosheets that are uniform and dense. Similarly, the TEM image of the MLG powder (Figure 10b) exhibits few-nanometer thin layers of graphene sheets that have extremely large surface areas.
The images in Figure 10c,d correspond to CuO NPs without and with rGO, respectively. The morphology of CuO NPs is synthesized using Catha edulis L. extract without rGO, resembling capsule-like shapes of an average size of 40 nm diameter and narrow distribution. In contrast, the CuO NPs decked with rGO (Figure 10d) exhibit fine particles with diameters less than 5 nm, which have aggregated together to form large flakes but with fewer attraction forces. This indicates that the decoration of graphene in CuO particles speeds the nucleation process, allows for the growth of small nanoparticles, and likely inhibits the aggregation forces between the particles themselves. This phenomenon is in line with the broadness of the XRD peaks for CuO samples decked with graphene oxide sheets (Figure 7a,b).
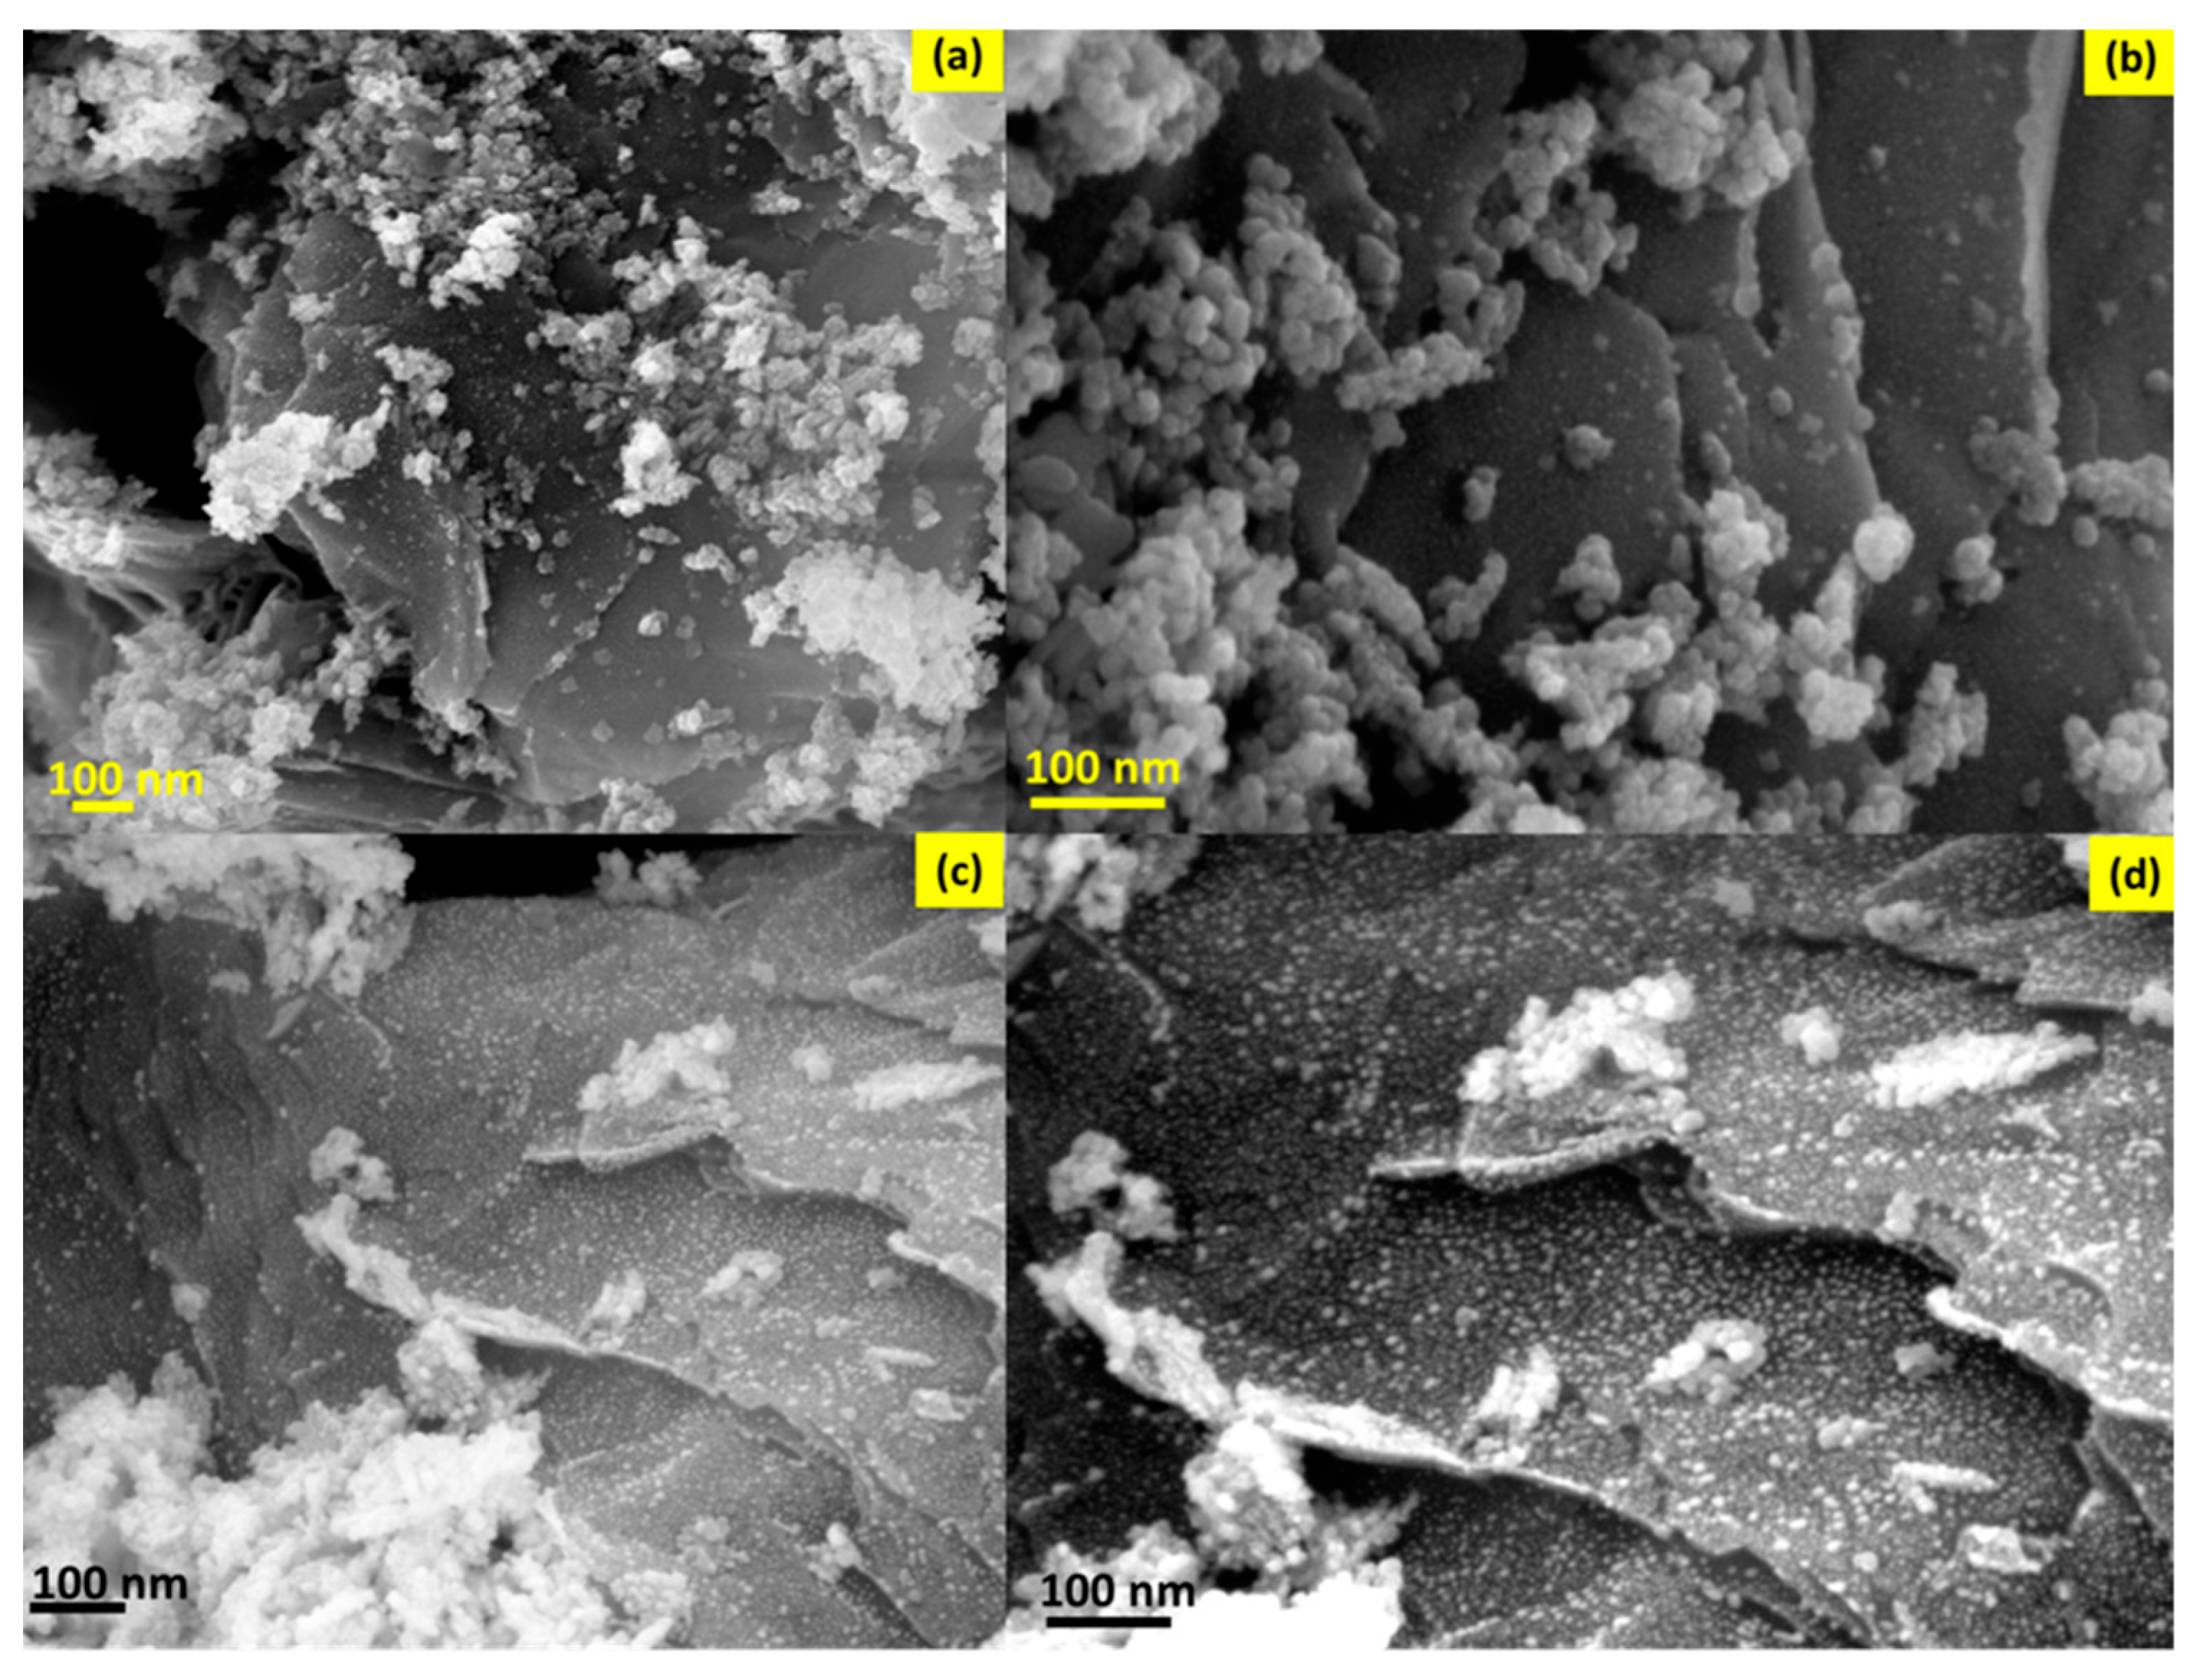
Figure 11 offers wonderful micrographs of CuO NPs, decorated on rGO sheets. The results indicated that the dispersion of the particles is directly proportional to the amount of graphene that should be added to the composition. For CuO-10%rGO composites (Figure 11a,b), the images show the graphene layers clearly, along with the particles distributed on them. However, due to the lower percentage of rGO in the composites, there are bands of particles that are aggregated together in large masses and are distributed along with the graphene sheets. Furthermore, the images show that the fine particles (≤5 nm in size) are well distributed over the graphene surfaces. This is because of the strong interaction forces and functional groups of the rGO. The attraction forces of the rGO and the CuO NPs are much greater than the forces between the particles themselves.
As the proportion of rGO is increased to 20% by the weight in the composites (Figure 11c, d), uniform and well-distributed CuO NPs are clearly shown in the micrographs. The images suggest that the surface of rGO works as a sort of sticker that adheres to individual CuO NPS and prevents particle agglomeration. In addition, the particles’ aggregation phenomenon is less intense, as the amount of rGO is higher in the composites. The well-distributed CuO NPs on the graphene sheets and the small thickness of the graphene layers could provide a large surface area, which is a key property for the catalytic activity of nanoparticles [79]. A brief comparison with the CuO NPs with or without graphene could reveal the phenomenal influence of the graphene on the kinetics of the reaction and on their catalytic properties.
Similarly, the morphology of Cu2O NPs and Cu2O-MLG samples are also depicted by FESEM micrographs, as shown in Figure 12. The images in Figure 12a,b show few-micron particles that are uniform and well-dispersed. The particles resemble pyramidal faceted shapes. This pyramid morphology is common in Cu2O particles that are prepared using glucose as a reducing and stabilizing agent and with water as a solvent [42,43,44]. Furthermore, remarkable images of Cu2O particles scattered on multi-layer graphene sheets are clearly observed in Figure 12c,d. The results revealed that the graphene layers are thin and transparent, in such a way that the particles can clearly be seen behind the graphene sheet. The Cu2O particle is also pyramidal in its geometry, with overall average sizes of ~ 1 µm. The size of the Cu2O particles is less than that of the corresponding Cu2O particles without graphene, plausibly due to the graphene’s attractive forces, which reduce the time of particle growth, making them smaller in size, but the shape of the particles is related to the type of the solvent, wherein alcoholic solvents aid in the formation of sphere-like particles.

5. Conclusions

In summary, this study spotlighted the possibility of producing H2 gas from waste aluminum chips/blocks that are thrown away daily in tons across the globe, with a projected energy capacity of 4 kWh/Kg of waste aluminum using nanocatalysts. The following are the conclusions drawn from this manuscript:
(1)
For the first time, the present study investigated the critical design considerations that are important for performing the H2 elaboration efficiently, and recommended the optimum conditions (temperatures, pressure, and speed) for high yield and quality of H2 gas.
(2)
The present work introduces a technology to indirectly measure the amount of water vapor in the produced H2.
(3)
The current study proposes a feasible method for separating the H2–steam mixture before storage by using a water basin to condense the evaporated water molecules.
(4)
For the first time, the phase structure of waste aluminum chips and the by-product of Al2O3 are investigated using the XRD technique and color variations.
(5)
An economic feasibility study was performed for a small town, Taiz, in Yemen, with a daily collection of waste aluminum of up to 432 kg/day.
(6)
The cost of H2 produced by this method is competitive with water-splitting technologies, and the reaction was completed in 20 min. Furthermore, an increase in the production capacity can steeply reduce the production cost of H2 gas.
In addition, this work investigated the synthesis of seven types of CuO, Cu2O NPs, and their graphene nanocomposites, used as catalysts to speed up the reactions in water systems that release H2 from used aluminum chips.
(a)
Images from electron microscopes showed how CuO and Cu2O NPs were well-distributed on the graphene sheet, while the XRD and Raman spectroscopy analysis proved their phase structure.
(b)
The surface functionality of the particles represents a constant source for destroying the aluminum laminar oxide layer, without needing an external basic/acidic medium.
(c)
A comparison of rGO and MLG indicated prompt catalytic activity for the H2 production yield and kinetics.
(d)
A comparison of CuO and Cu2O NPs showed that both samples were good enough for the efficient and feasible production of H2, with better performance for Cu2O NPs than CuO NPs.
All in all, the production of H2 gas from the waste aluminum chips/blocks is a techno-economically feasible system that requires more investigation for continuous and large-scale production. The construction of H2 plants, based on waste aluminum in large cities, is recommended for the production of clean H2 energy.

Author Contributions

Conceptualization, M.A.A., Y.H., A.M.G. and M.S.A.G.; methodology, M.A.A., A.M.G., S.M., I.R., M.S. and A.S.; software, F.O., I.R. and M.S.; validation, M.A.A., A.M.G., M.S.A.G., M.S., A.A.A. and A.S.; formal analysis, M.A.A., Y.H. and A.M.G.; investigation, M.A.A., S.M., I.R. and M.S.; resources, F.O., A.M.G., M.S.A.G., A.A.A. and A.S.; data curation, M.A.A., S.M., M.S., A.A.A. and A.S.; writing—original draft preparation, M.A.A. and A.M.G.; writing—review and editing, M.A.A., A.M.G. and S.M.; visualization, M.A.A., Y.H., F.O. and I.R.; supervision, M.A.A. and A.M.G.; project administration, M.A.A. and A.M.G.; funding acquisition, A.M.G. and S.M. All authors have read and agreed to the published version of the manuscript.

Funding

This work is funded and supported by Alfaisal University.

Institutional Review Board Statement

Not applicable.

Informed Consent Statement

Not applicable.

Data Availability Statement

The data that support the findings of this study are available from the corresponding author upon reasonable request.

Acknowledgments

The first author thanks the Institute of International Education—Scholar Rescue Fund (IIE-SRF) program for their support during the performing and writing of this research work.

Conflicts of Interest

The authors declare no conflict of interest.

References

  1. Das, A.; Peu, S.D. A Comprehensive Review on Recent Advancements in Thermochemical Processes for Clean Hydrogen Production to Decarbonize the Energy Sector. Sustainability 2022, 14, 11206. [Google Scholar] [CrossRef]
  2. Acar, C.; Dincer, I. Review and evaluation of hydrogen production options for better environment. J. Clean. Prod. 2019, 218, 835–849. [Google Scholar] [CrossRef]
  3. Dincer, I. Green methods for hydrogen production. Int. J. Hydrogen Energy 2012, 37, 1954–1971. [Google Scholar] [CrossRef]
  4. Oliveira, M.C.; Iten, M.; Matos, H.A. Review of Thermochemical Technologies for Water and Energy Integration Systems: Energy Storage and Recovery. Sustainability 2022, 14, 7506. [Google Scholar] [CrossRef]
  5. Chau, K.; Djire, A.; Khan, F. Review and analysis of the hydrogen production technologies from a safety perspective. Int. J. Hydrogen Energy 2022, 47, 13990–14007. [Google Scholar] [CrossRef]
  6. Shi, R.; Chen, X.; Qin, J.; Wu, P.; Jia, L. The State-of-the-Art Progress on the Forms and Modes of Hydrogen and Ammonia Energy Utilization in Road Transportation. Sustainability 2022, 14, 11904. [Google Scholar] [CrossRef]
  7. El-Emam, R.S.; Özcan, H. Comprehensive review on the techno-economics of sustainable large-scale clean hydrogen production. J. Clean. Prod. 2019, 220, 593–609. [Google Scholar] [CrossRef]
  8. Ishaq, H.; Dincer, I.; Crawford, C. A review on hydrogen production and utilization: Challenges and opportunities. Int. J. Hydrogen Energy 2022, 47, 26238–26264. [Google Scholar] [CrossRef]
  9. Aziz, M.; Darmawan, A.; Juangsa, F.B. Hydrogen production from biomasses and wastes: A technological review. Int. J. Hydrogen Energy 2021, 46, 33756–33781. [Google Scholar] [CrossRef]
  10. Fajrina, N.; Tahir, M. A critical review in strategies to improve photocatalytic water splitting towards hydrogen production. Int. J. Hydrogen Energy 2019, 44, 540–577. [Google Scholar] [CrossRef]
  11. Acar, C.; Dincer, I.; Naterer, G. Review of photocatalytic water-splitting methods for sustainable hydrogen production. Int. J. Energy Res. 2016, 40, 1449–1473. [Google Scholar] [CrossRef]
  12. Shapovalov, Y.; Tokpayev, R.; Khavaza, T.; Nauryzbayev, M. Generation of Hydrogen and Oxygen from Water by Solar Energy Conversion. Sustainability 2021, 13, 13941. [Google Scholar] [CrossRef]
  13. Shah, N.R.A.M.; Yunus, R.M.; Rosman, N.N.; Wong, W.Y.; Arifin, K.; Minggu, L.J. Current progress on 3D graphene-based photocatalysts: From synthesis to photocatalytic hydrogen production. Int. J. Hydrogen Energy 2021, 46, 9324–9340. [Google Scholar] [CrossRef]
  14. Singla, S.; Sharma, S.; Basu, S.; Shetti, N.P.; Aminabhavi, T.M. Photocatalytic water splitting hydrogen production via environmental benign carbon based nanomaterials. Int. J. Hydrogen Energy 2021, 46, 33696–33717. [Google Scholar] [CrossRef]
  15. Epelle, E.I.; Desongu, K.S.; Obande, W.; Adeleke, A.A.; Ikubanni, P.P.; Okolie, J.A.; Gunes, B. A comprehensive review of hydrogen production and storage: A focus on the role of nanomaterials. Int. J. Hydrogen Energy 2022, 47, 20398–20431. [Google Scholar] [CrossRef]
  16. Dalapati, G.K.; Masudy-Panah, S.; Moakhar, R.S.; Chakrabortty, S.; Ghosh, S.; Kushwaha, A.; Katal, R.; Chua, C.S.; Xiao, G.; Tripathy, S.; et al. Nanoengineered Advanced Materials for Enabling Hydrogen Economy: Functionalized Graphene–Incorporated Cupric Oxide Catalyst for Efficient Solar Hydrogen Production. Glob. Chall. 2020, 4, 1900087. [Google Scholar] [CrossRef]
  17. Wang, H.; Leung, D.; Leung, M.; Ni, M. A review on hydrogen production using aluminum and aluminum alloys. Renew. Sustain. Energy Rev. 2009, 13, 845–853. [Google Scholar] [CrossRef]
  18. Buryakovskaya, O.A.; Kurbatova, A.I.; Vlaskin, M.S.; Valyano, G.E.; Grigorenko, A.V.; Ambaryan, G.N.; Dudoladov, A.O. Waste to Hydrogen: Elaboration of Hydroreactive Materials from Magnesium-Aluminum Scrap. Sustainability 2022, 14, 4496. [Google Scholar] [CrossRef]
  19. Trowell, K.; Goroshin, S.; Frost, D.; Bergthorson, J. Hydrogen production rates of aluminum reacting with varying densities of supercritical water. RSC Adv. 2022, 12, 12335–12343. [Google Scholar] [CrossRef]
  20. Kumar, D.; Muthukumar, K. An overview on activation of aluminium-water reaction for enhanced hydrogen production. J. Alloys Compd. 2020, 835, 155189. [Google Scholar] [CrossRef]
  21. Setiani, P.; Watanabe, N.; Sondari, R.R.; Tsuchiya, N. Mechanisms and kinetic model of hydrogen production in the hydrothermal treatment of waste aluminum. Mater. Renew. Sustain. Energy 2018, 7, 10. [Google Scholar] [CrossRef]
  22. Salueña-Berna, X.; Marín-Genescà, M.; Massagués Vidal, L.; Dagà-Monmany, J.M. Waste Aluminum Application as Energy Valorization for Hydrogen Fuel Cells for Mobile Low Power Machines Applications. Materials 2021, 14, 7323. [Google Scholar] [CrossRef] [PubMed]
  23. Ercoli, R.; Orlando, A.; Borrini, D.; Tassi, F.; Bicocchi, G.; Renzulli, A. Hydrogen-Rich Gas Produced by the Chemical Neutralization of Reactive By-Products from the Screening Processes of the Secondary Aluminum Industry. Sustainability 2021, 13, 12261. [Google Scholar] [CrossRef]
  24. Ho, C.-Y.; Huang, C.-H. Enhancement of hydrogen generation using waste aluminum cans hydrolysis in low alkaline de-ionized water. Int. J. Hydrogen Energy 2016, 41, 3741–3747. [Google Scholar] [CrossRef]
  25. Aylikci, N.K.; Mert, S.O.; Aylikci, V.; Bahceci, E.; Depci, T.; Oruç, Ö. Microhydrogen production with water splitting from daily used waste aluminum. Int. J. Hydrogen Energy 2021, 46, 28912–28924. [Google Scholar] [CrossRef]
  26. Gawande, M.B.; Goswami, A.; Felpin, F.-X.; Asefa, T.; Huang, X.; Silva, R.; Zou, X.; Zboril, R.; Varma, R.S. Cu and Cu-Based Nanoparticles: Synthesis and Applications in Catalysis. Chem. Rev. 2016, 116, 3722–3811. [Google Scholar] [CrossRef] [Green Version]
  27. Suleiman, M.; Mousa, M.; Hussein, A.; Hammouti, B.; Hadda, T.B.; Warad, I. Copper(II)-Oxide Nanostructures: Synthesis, Characterizations and their Applications–Review. J. Mater. Environ. Sci. 2013, 4, 792–797. [Google Scholar]
  28. Bhanushali, S.; Ghosh, P.; Ganesh, A.; Cheng, W. 1D Copper Nanostructures: Progress, Challenges and Opportunities. Small 2014, 11, 1232–1252. [Google Scholar] [CrossRef]
  29. Cuong, H.N.; Pansambal, S.; Ghotekar, S.; Oza, R.; Hai, N.T.T.; Viet, N.M.; Nguyen, V.-H. New frontiers in the plant extract mediated biosynthesis of copper oxide (CuO) nanoparticles and their potential applications: A review. Environ. Res. 2021, 203, 111858. [Google Scholar] [CrossRef]
  30. Yam, K.; Guo, N.; Jiang, Z.; Li, S.; Zhang, C. Graphene-Based Heterogeneous Catalysis: Role of Graphene. Catalysts 2020, 10, 53. [Google Scholar] [CrossRef] [Green Version]
  31. Hu, M.; Yao, Z.; Wang, X. Graphene-Based Nanomaterials for Catalysis. Ind. Eng. Chem. Res. 2017, 56, 3477–3502. [Google Scholar] [CrossRef]
  32. Jain, V.; Kandasubramanian, B. Functionalized graphene materials for hydrogen storage. J. Mater. Sci. 2020, 55, 1865–1903. [Google Scholar] [CrossRef]
  33. Wang, S.; Huang, X.; He, Y.; Huang, H.; Wu, Y.; Hou, L.; Liu, X.; Yang, T.; Zou, J.; Huang, B. Synthesis, growth mechanism and thermal stability of copper nanoparticles encapsulated by multi-layer graphene. Carbon 2012, 50, 2119–2125. [Google Scholar] [CrossRef]
  34. Hidalgo-Manrique, P.; Lei, X.; Xu, R.; Zhou, M.; Kinloch, I.A.; Young, R.J. Copper/graphene composites: A review. J. Mater. Sci. 2019, 54, 12236–12289. [Google Scholar] [CrossRef] [Green Version]
  35. Sehar, S.; Sher, F.; Zhang, S.; Khalid, U.; Sulejmanović, J.; Lima, E.C. Thermodynamic and kinetic study of synthesised graphene oxide-CuO nanocomposites: A way forward to fuel additive and photocatalytic potentials. J. Mol. Liq. 2020, 313, 113494. [Google Scholar] [CrossRef]
  36. Mondal, P.; Sinha, A.; Salam, N.; Roy, A.S.; Jana, N.R.; Islam, S.M. Enhanced catalytic performance by copper nanoparticle–graphene based composite. RSC Adv. 2013, 3, 5615–5623. [Google Scholar] [CrossRef]
  37. Xin, S.; Shen, J.; Liu, G.; Chen, Q.; Xiao, Z.; Zhang, G.; Xin, Y. High electricity generation and COD removal from cattle wastewater in microbial fuel cells with 3D air cathode employed non-precious Cu2O/reduced graphene oxide as cathode catalyst. Energy 2020, 196, 117123. [Google Scholar] [CrossRef]
  38. Xin, S.; Shen, J.; Liu, G.; Chen, Q.; Xiao, Z.; Zhang, G.; Xin, Y. Electricity generation and microbial community of single-chamber microbial fuel cells in response to Cu2O nanoparticles/reduced graphene oxide as cathode catalyst. Chem. Eng. J. 2020, 380, 122446. [Google Scholar] [CrossRef]
  39. Li, F.; Zhang, L.; Tong, J.; Liu, Y.; Xu, S.; Cao, Y.; Cao, S. Photocatalytic CO2 conversion to methanol by Cu2O/graphene/TNA heterostructure catalyst in a visible-light-driven dual-chamber reactor. Nano Energy 2016, 27, 320–329. [Google Scholar] [CrossRef]
  40. Wang, Y.; Lei, H.; Lu, S.; Yang, Z.; Bin Xu, B.; Xing, L.; Liu, T.X. Cu2O nano-flowers/graphene enabled scaffolding structure catalyst layer for enhanced CO2 electrochemical reduction. Appl. Catal. B Environ. 2022, 305, 121022. [Google Scholar] [CrossRef]
  41. Moghanlou, A.O.; Bezaatpour, A.; Sadr, M.H.; Yosefi, M.; Salimi, F. Cu2O/rGO as an efficient photocatalyst for transferring of nitro group to amine group under visible light irradiation. Mater. Sci. Semicond. Process. 2021, 130, 105838. [Google Scholar] [CrossRef]
  42. Ali, M.; Remalli, N.; Yehya, F.; Chaudhary, A.K.; Srikanth, V.V. Picosecond laser induced fragmentation of coarse Cu2O particles into nanoparticles in liquid media. Appl. Surf. Sci. 2015, 357, 1601–1605. [Google Scholar] [CrossRef]
  43. Ali, M.; Rotte, N.K.; Srikanth, V.V. Honey aided solution synthesis of polycrystalline Cu2O particles. Mater. Lett. 2014, 128, 253–255. [Google Scholar] [CrossRef]
  44. Amrani, A.M.; Srikanth, V.V.S.S.; Labhsetwar, N.K.; Al-Fatesh, A.S.; Shaikh, H. Phoenix dactylifera F. mediated green synthesis of Cu2O particles for Arsenite uptake from water. Sci. Technol. Adv. Mater. 2016, 17, 760–768. [Google Scholar] [CrossRef] [PubMed] [Green Version]
  45. Ali, M.; Yehya, F.; Chaudhary, A.K.; Srikanth, V.V.S.S. A novel top-down reduction approach for Cu2O nanoparticles using nanosecond and picosecond lasers. AIP Conf. Proc. 2014, 1620, 327–330. [Google Scholar]
  46. Amrani, M.A.; Alrafai, H.A.; Al-Nami, S.Y.; Obeidat, F.; Alwahbani, F.; Alhammadi, M.A.; Qasem, A. Green synthesis of Size-Controlled copper oxide nanoparticles as catalysts for H2 production from industrial waste aluminum. Int. J. Energy Res. 2022, 46, 14023–14035. [Google Scholar] [CrossRef]
  47. Amrani, M.A.; Bagash, M.; Yehya, F. An Efficient Green Synthesis Method for the Synthesis of Silver Nanoparticles Using the Extraction of Catha Edulis Leaves. Albaydha Univ. J. 2019, 1, 214–223. [Google Scholar] [CrossRef]
  48. Jammula, R.K.; Tumuluri, A.; Rotte, N.K.; James Raju, K.C.; Srikanth, V.V.S.S. Cupric oxide decked few-layered graphene: Synthesis and dielectric. Carbon 2014, 78, 374–383. [Google Scholar] [CrossRef]
  49. Ali, M.; Abu-Taleb, A.; Remalli, N.; Abdullah, M.; Vadali, S.V.S.S.; Labhsetwar, N. Dragon’s blood aided synthesis of Ag/Ag2O core/shell nanostructures and Ag/Ag2O decked multi-layered graphene for efficient As(III) uptake from water and antibacterial activity. RSC Adv. 2016, 6, 44145–44153. [Google Scholar]
  50. Bolt, A.; Dincer, I.; Agelin-Chaab, M. A Review of Unique Aluminum–Water Based Hydrogen Production Options. Energy Fuels 2021, 35, 1024–1040. [Google Scholar] [CrossRef]
  51. Huang, W.-C.; Lyu, L.-M.; Yang, Y.-C.; Huang, M.H. Synthesis of Cu2O Nanocrystals from Cubic to Rhombic Dodecahedral Structures and Their Comparative Photocatalytic Activity. J. Am. Chem. Soc. 2012, 134, 1261–1267. [Google Scholar] [CrossRef]
  52. Ho, J.-Y.; Huang, M.H. Synthesis of Submicrometer-Sized Cu2O Crystals with Morphological Evolution from Cubic to Hexapod Structures and Their Comparative Photocatalytic Activity. J. Phys. Chem. C 2009, 113, 14159–14164. [Google Scholar] [CrossRef]
  53. Zhang, Y.; Deng, B.; Zhang, T.; Gao, D.; Xu, A.-W. Shape Effects of Cu2O Polyhedral Microcrystals on Photocatalytic Activity. J. Phys. Chem. C 2010, 114, 5073–5079. [Google Scholar] [CrossRef]
  54. Kim, J.Y.; Rodriguez, J.A.; Hanson, J.C.; Frenkel, A.I.; Lee, P.L. Reduction of CuO and Cu2O with H2: H Embedding and Kinetic Effects in the Formation of Suboxides. J. Am. Chem. Soc. 2003, 125, 10684–10692. [Google Scholar] [CrossRef]
  55. Yamukyan, M.; Manukyan, K.; Kharatyan, S. Copper oxide reduction by hydrogen under the self-propagation reaction mode. J. Alloy. Compd. 2009, 473, 546–549. [Google Scholar] [CrossRef]
  56. Turton, R.; Bailie, R.C.; Whiting, W.B.; Shaeiwitz, J.A. Analysis, Synthesis, and Design of Chemical Process; Pearson Education: London, UK, 2012. [Google Scholar]
  57. Dinesh, G.K.; Chauhan, R.; Chakma, S. Influence and strategies for enhanced biohydrogen production from food waste. Renew. Sustain. Energy Rev. 2018, 92, 807–822. [Google Scholar] [CrossRef]
  58. Han, W.; Fang, J.; Liu, Z.; Tang, J. Techno-economic evaluation of a combined bioprocess for fermentative hydrogen production from food waste. Bioresour. Technol. 2016, 202, 107–112. [Google Scholar] [CrossRef]
  59. Han, W.; Hu, Y.Y.; Li, S.Y.; Li, F.F.; Tang, J.H. Biohydrogen production from waste bread in a continuous stirred tank reactor: A techno-economic analysis. Bioresour. Technol. 2016, 221, 318–323. [Google Scholar] [CrossRef] [Green Version]
  60. Han, W.; Liu, Z.; Fang, J.; Huang, J.; Zhao, H.; Li, Y. Techno-economic analysis of dark fermentative hydrogen production from molasses in a continuous mixed immobilized sludge reactor. J. Clean. Prod. 2016, 127, 567–572. [Google Scholar] [CrossRef]
  61. Han, W.; Yan, Y.; Gu, J.; Shi, Y.; Tang, J.; Li, Y. Techno-economic analysis of a novel bioprocess combining solid state fermentation and dark fermentation for H2 production from food waste. Int. J. Hydrogen Energy 2016, 41, 22619–22625. [Google Scholar] [CrossRef] [Green Version]
  62. Li, Y.-C.; Liu, Y.-F.; Chu, C.-Y.; Chang, P.-L.; Hsu, C.-W.; Lin, P.-J.; Wu, S.-Y. Techno-economic evaluation of biohydrogen production from wastewater and agricultural waste. Int. J. Hydrogen Energy 2012, 37, 15704–15710. [Google Scholar] [CrossRef]
  63. Yogesh, G.K.; Shuaib, E.; Roopmani, P.; Gumpu, M.B.; Krishnan, U.M.; Sastikumar, D. Synthesis, characterization and bioimaging application of laser-ablated graphene-oxide nanoparticles (nGOs). Diam. Relat. Mater. 2020, 104, 107733. [Google Scholar] [CrossRef]
  64. Ganesan, K.; Jothi, V.K.; Natarajan, A.; Rajaram, A.; Ravichandran, S.; Ramalingam, S. Green synthesis of Copper oxide nanoparticles decorated with graphene oxide for anticancer activity and catalytic applications. Arab. J. Chem. 2020, 13, 6802–6814. [Google Scholar] [CrossRef]
  65. Kottappara, R.; Palantavida, S.; Pillai, S.C.; Vijayan, B.K. Composition tuning in copper-oxide decorated reduced graphene oxide yields efficient photo- and reduction catalysts. Surf. Interfaces 2020, 22, 100792. [Google Scholar] [CrossRef]
  66. Wang, Y.; Wen, Z.; Zhang, H.; Cao, G.; Sun, Q.; Cao, J. CuO Nanorods-Decorated Reduced Graphene Oxide Nanocatalysts for Catalytic Oxidation of CO. Catalysts 2016, 6, 214. [Google Scholar] [CrossRef] [Green Version]
  67. Wang, B.; Wu, X.-L.; Shu, C.-Y.; Guo, Y.-G.; Wang, C.-R. Synthesis of CuO/graphene nanocomposite as a high-performance anode material for lithium-ion batteries. J. Mater. Chem. 2010, 20, 10661–10664. [Google Scholar] [CrossRef]
  68. Bu, I.Y.Y.; Huang, R. Fabrication of CuO-decorated reduced graphene oxide nanosheets for supercapacitor applications. Ceram. Int. 2017, 34, 45–50. [Google Scholar] [CrossRef]
  69. Solorzano-Ojeda, E.D.; Sánchez-Valdes, S.; Ramos-Devalle, L.F.; Betancourt-Galindo, R.; da Silva, L.; Fernández-Tavizón, S.; Hernández-Gámez, J.F.; Pérez-Camacho, O.; Ramírez-Vargas, E.; Morales-Acosta, D.; et al. Effect of ionic liquid on graphene decorated with copper nanostructure dispersion towards silicon/graphene/copper composites with enhanced thermal, electrical and antimicrobial properties. Iran. Polym. J. 2021, 30, 1339–1349. [Google Scholar] [CrossRef]
  70. Cullity, B.D.; Stock, S.R. Elements of X-ray Diffraction, 3rd ed.; Prentice-Hall: Hoboken, NJ, USA, 2001. [Google Scholar]
  71. Skakalova, V.; Kaiser, A.B. Graphene: Properties, Preparation, Characterization and Devices, 2nd ed.; Woodhead Publishing Series in Electronic and Optical Materials; Woodhead Publishing: Cambridge, UK, 2021. [Google Scholar]
  72. Bokobza, L.; Bruneel, J.L.; Couzi, M. Raman spectra of carbon-based materials (from graphite to carbon black) and of some silicone composites. J. Carbon Res. C 2015, 1, 77–94. [Google Scholar] [CrossRef] [Green Version]
  73. Yadav, A.; Hunge, Y.; Kang, S.-W. Spongy ball-like copper oxide nanostructure modified by reduced graphene oxide for enhanced photocatalytic hydrogen production. Mater. Res. Bull. 2020, 133, 111026. [Google Scholar] [CrossRef]
  74. Li, X.; Guo, W.; Huang, H.; Chen, T.; Zhang, M.; Wang, Y. Synthesis and photocatalytic properties of CuO nanostructures. J. Nanosci. Nanotechnol. 2014, 14, 3428–3432. [Google Scholar] [CrossRef]
  75. Wang, J.; Zhu, L.; Ji, L.; Chen, Z. Preparation of nanostructured Cu(OH)2 and CuO electrocatalysts for water oxidation by electrophoresis deposition. J. Mater. Res. 2018, 33, 581–589. [Google Scholar] [CrossRef] [Green Version]
  76. Zhao, Y.; Song, X.; Song, Q.; Yin, Z. A facile route to the synthesis copper oxide/reduced graphene oxide nanocomposites and electrochemical detection of catechol organic pollutant. CrystEngComm 2012, 14, 6710–6719. [Google Scholar] [CrossRef]
  77. Zhao, B.; Liu, P.; Zhuang, H.; Jiao, Z.; Fang, T.; Xu, W.; Lu, B.; Jiang, Y. Hierarchical self-assembly of microscale leaf-like CuO on graphene sheets for high-performance electrochemical capacitors. J. Mater. Chem. A 2013, 1, 367–373. [Google Scholar] [CrossRef]
  78. Gulati, U.; Rajesh, U.C.; Rawat, D.S. RGO@CuO Nanocomposites from a Renewable Copper Mineral Precursor: A Green Approach for Decarboxylative C(sp3)-H Activation of Proli ne Amino Acid To Afford Value-Added Synthons. ACS Sustain. Chem. Eng. 2018, 6, 10039–10051. [Google Scholar] [CrossRef]
  79. Yang, S.T.; Chang, Y.; Wang, H.; Liu, G.; Chen, S.; Wang, Y.; Liu, Y.; Cao, A. Folding/aggregation of graphene oxide and its application in Cu2+ removal. J. Colloid Interface Sci. 2010, 351, 122–127. [Google Scholar] [CrossRef]
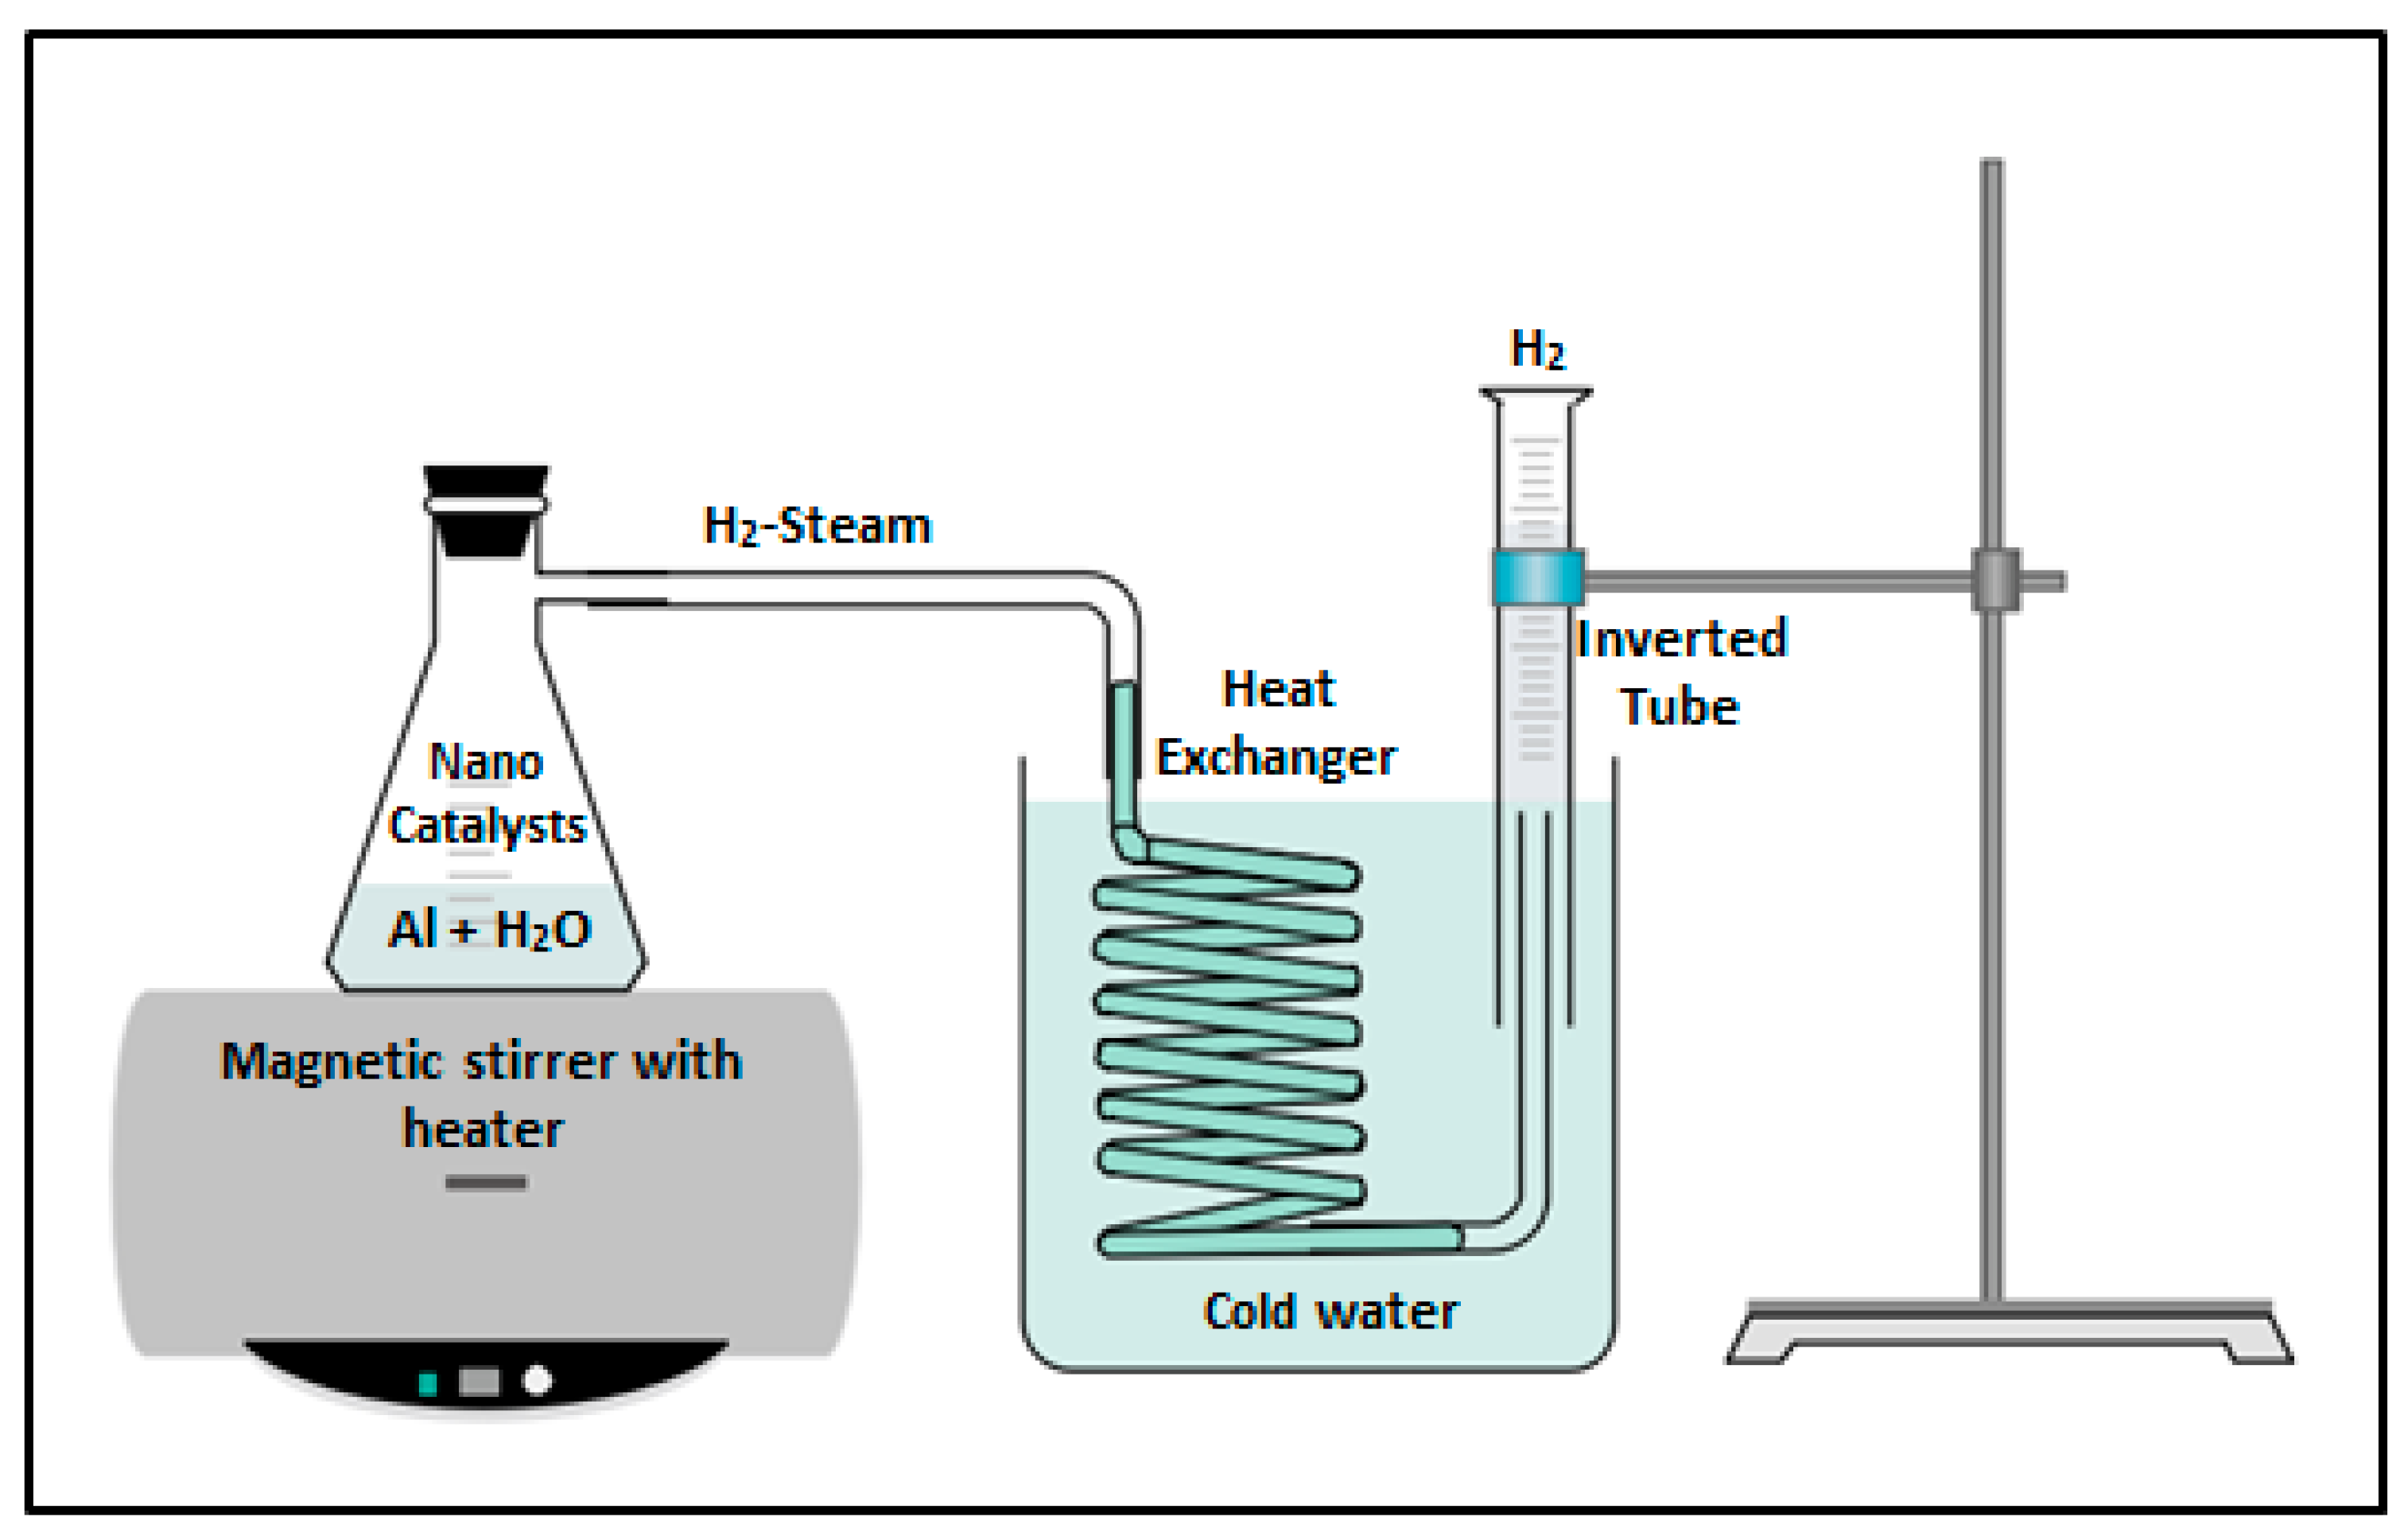
Figure 1. A diagram of the experimental setup for the Al-H2O reactions. A cold water tank was used to condense the steam and separate it from the H2 gas.
Sustainability 14 15256 g001
Figure 2. A diagram of the experimental procedures for the syntheses of CuO, Cu2O, CuO-rGO, and Cu2O-MLG powder samples as catalysts for the generation of H2 gas from waste aluminum.
Sustainability 14 15256 g002
Figure 3. XRD diffractograms of waste Al chips and the by-product, Al2O3, with photographic images of both samples.
Sustainability 14 15256 g003
Figure 4. Hydrogen production results comparing (a) CuO vs. Cu2O NPs, (b) rGO vs. MLG, (c) CuO-rGO vs. Cu2O-MLG samples, and (d) the effect of catalyst concentration on H2 production.
Sustainability 14 15256 g004
Figure 5. Comparison graphs of H2 production yield versus reaction time, with the help of various nanocatalysts: (a) CuO-based rGO and (b) Cu2O-based MLG.
Sustainability 14 15256 g005
Figure 6. Experimental values of the amount of evaporated steam under distilled water conditions, under the same conditions that were applied for the Al-H2O reaction: (A) with no catalysts; (B) with Cu2O catalysts.
Sustainability 14 15256 g006
Figure 7. X-ray diffraction patterns of (a) CuO, CuO-rGO, (b) Cu2O, Cu2O-MLG; (c,d) are high-magnification XRD patterns.
Sustainability 14 15256 g007
Figure 8. (a) The Raman spectrum of (a) CuO-rGO, prepared using plant extract, and (b) Cu2O-MLG, prepared using glucose as a reducing agent.
Sustainability 14 15256 g008
Figure 9. FTIR spectroscopy of (a) CuO and CuO-rGO composites, and (b) Cu2O and Cu2O-MLG samples.
Sustainability 14 15256 g009
Figure 10. (a) FESEM micrograph of rGO, (b) TEM micrograph of MLG, (c) FESEM micrograph of CuO NPs, and (d) FESEM micrograph of CuO-rGO NPs, prepared using the plant extract.
Sustainability 14 15256 g010
Figure 11. FESEM micrographs of (a,b) CuO-10% rGO, and (c,d) CuO-20% rGO.
Sustainability 14 15256 g011
Figure 12. FESEM micrographs of (a,b) Cu2O NPs, and (c,d) Cu2O-MLG NPs, prepared using glucose.
Sustainability 14 15256 g012
Table 1. Quantities of the raw materials and their costs (USD) per kg for one production cycle of H2 (2021–2022).
Raw MaterialCost (USD/kg)Quantity (Kg/Cycle)Cost (USD/Cycle)Cost (USD/Cycle)Cycle Time (h)
Aluminum (Chips)0.52010----1 h
Aluminum (Blocks)1.020----20
Al2O3 byproduct0.530−15−15
Sodium hydroxide22.555
Copper chloride5155
Distilled water0.0110011
Total cost (USD/cycle)---------0616
Table 2. Basis data for cost analysis of H2 production from waste aluminum.
ItemDataWaste Aluminum ChipsWaste Aluminum BlocksNote
CostCost
CapitalTotal fixed costUSD 120,000USD 150,000Depreciation period: 10 years
OperationRaw material
Utilities *
Labor cost
USD 42,000/y
USD 12,000/y
USD 39,200/y **
USD 112,000/y
USD 18,000/y
USD 39,200/y
Year = 360 days
* Electricity
** 2800 (USD/employer year) (14 employers, 2 batches)
Interest
Maintenance
Other
10% of capital cost
5% of utilities
1% of capital cost
USD 12,000/y
USD 1515/y
USD 1200/y
USD 15,000/y
USD 2000/y
USD 1500/y
H2 product costUSD 108/day
(USD 0.000516 /liter)
USD 521.4/day
(USD 0.0009 /liter)
Table 3. A comparative cost evaluation data from different H2 production feedstock in the literature.
FeedstockCost of H2 ProductionReference
Food waste3.20 USD/kg[57]
Food waste11.35 USD/kg *[58]
Food waste14.91 USD/kg *[59]
Molasses30.04 USD/kg *[60]
Food waste25.48 USD/kg *[61]
Wastewater30.04 USD/kg *[62]
Agricultural waste30.04 USD/kg *[62]
Aluminum waste (chips)6.71 USD/kgThis study
Aluminum waste (blocks)11.66 USD/kg
* USD/m3 was converted to USD/kg to make units comparable (m3 of H2 = 0.081 kg).
Publisher’s Note: MDPI stays neutral with regard to jurisdictional claims in published maps and institutional affiliations.