Abstract
The pharmaceutical industry is a regulatory-based high-tech industry that requires long-term R&D investments from product development to market entry. This study investigates how pharmaceutical firms in Korea have grown their production size, changed their morphological structure, and identified the internal factors for sustainable growth in recent decades. First, with time series production data of pharmaceutical firms collected based on the production records of finished drugs, we studied the morphological change of the firms to adapt to environmental change by using general morphological analysis. Second, the pharmaceutical firms were divided into above-average growth firms and non-above-average growth firms, high growth firms, and non-high growth firms, using the decision tree technique to analyze and visualize the determining factors of sustainable growth firms. The general morphological analysis result showed that during the past two decades, in response to undergoing policy and environmental changes, the types of products by pharmaceutical firms have significantly changed from over-the-counter to ethical drugs and have shifted from generic drugs to more R&D-intensive ones. Furthermore, the decision tree technique identified the internal factors of growth and non-growth firms for sustainable growth during the past three decades. The decision tree analysis showed the determining factors for above-average and high-growth firms, such as the firm’s size, age, R&D investment, the over-the-counter drug to ethical drug production ratio, and the choice between chemical and bio drugs. The research findings imply that pharmaceutical firms must combine their strategy-side internal factors with the organization-side internal factors to achieve above-average or high-growth firms over the long term. Some detailed business and policy implications and future research topics are also presented.
1. Introduction
Much literature on industrial organization (IO) economics and technology and innovation management (TIM) studies industries’ growth and the firms’ growth dynamics. Early research on the growth of firms focused on the IO economics framework and considered that firms in an industry should be alike in all economically important dimensions, except for their size, because competition will eventually eliminate intra-industry heterogeneity [1,2]. However, each firm’s resources and strategies contribute to its growth and, eventually, the industry’s growth, accompanied by strategic changes and adaptation to a volatile and competitive environment. Meanwhile, the literature in TIM focuses on firms’ qualitative change and identifying factors for the firm’s growth. Schumpeter defines economic development as a dynamic evolutionary process that is characterized by introducing new creative systems, destroying existing industries by innovation, and subsequent qualitative change in industries [1,3]. A firm’s sustainable growth involves a successful transformation by maintaining a sustainable competitive position and reorienting its strategy as it grows [4]. The ability of a firm in an industry to exploit its internal competence and explore new opportunities in business is widely recognized as a critical factor of the firm’s competitive advantage and sustainable growth. This maxim is even more true when competition is extensive and tightly regulated by government, and the business environment changes rapidly [1,2,3]. Therefore, this study aims to explain the change in firms’ morphologies and identify the internal factors of growing firms in a rapidly changing and regulated industry over a long period based on the TIM theory by synthesizing qualitative and quantitative analysis. The pharmaceutical industry is an archetypical example of intense competition and a fast-changing sector with strong government regulation. The pharmaceutical industry is also innovation-intensive, wherein a strategic decision is the fundamental source of competitiveness of the firms, largely shaping the dynamics of sustainable growth of the industry. Additionally, effective strategic product portfolio management for the firm to achieve sustainable growth continues to be a focal concern for managers and researchers in this industry. Furthermore, this study selected Korea as a case country for the following reasons. First, Korea has established itself as a country that has made a decisive contribution to global healthcare innovation. In other words, Korea is one of the emerging countries with new drug R&D capabilities and plays a leading role in the contract development and manufacturing organization (CDMO) areas. In addition, the Korean pharmaceutical industry has characteristics that are hard to find in other countries: a high proportion of domestic finished products, active high-tech startups, extensive government technology support, and fierce competition where leading companies change shortly [5].
The first objective of this study is to investigate the quantitative growth of firms by tracking down the yearly production data from 1988 to 2017; and qualitative change in the Korean pharmaceutical firms between 1998 and 2017 by comparison of the firm’s data in two cross-sectional time frame forms. The second objective of this study is to identify the internal factors of pharmaceutical firms that caused the difference between sustainable growth and non-growth between 1988 and 2017. In summary, this study addresses the following research questions:
- Research Question 1-1. Did Korean pharmaceutical companies achieve meaningful quantitative growth in response to environmental changes from 1997 to 2017?
- Research Question 1-2. How have Korean pharmaceutical firms changed qualitatively in the firms’ morphologies between 1998 to 2017 to adapt to environmental change and for the firm’s growth?
- Research Question 2-1. Which internal factors have existed in the Korean pharmaceutical industry’s above-average growth firms (AGFs)?
- Research Question 2-2. Which internal factors have existed in the Korean pharmaceutical industry’s high-growth firms (HGFs)?
To answer Research Questions 1-1 and 1-2, first, we analyzed the pharmaceutical industry’s production growth over 30 years using descriptive statistics. Next, we categorized the morphologies of pharmaceutical firms into seven dimensions and compared all pharmaceutical firms’ morphological shapes in two comparison years, 1998 and 2017, using a qualitative analysis technique, general morphological analysis (GMA). Finally, to answer Research Questions 2-1 and 2-2, we proposed two classification models to identify internal factors affecting sustainable growth through a quantitative analysis technique, the decision tree (DT), to identify each firm’s internal factors. In addition, to derive the sustainable growth strategies of pharmaceutical companies, we focused on the strategy-side factors, among the internal factors of the DT, which are divided into organization-side factors and strategy-side factors.
We identify the following facts in the existing firms’ quantitative growth and qualitative change studies. First, despite extensive studies, IO economics scholars have not yet reached a consensus on the underlying mechanisms linking the firm’s innovation activities, R&D investments, and growth from a comprehensive perspective [2]. Therefore, this study is based not on IO theory but mainly on TIM. Second, extant research in TIM literature usually adopts only microscopic data analysis, such as surveys, interviews, and case studies, which is unsuitable for the entire pharmaceutical industry over a long period. Therefore, two non-traditional TIM methodologies were adopted in this study: a qualitative analysis (GMA) and quantitative analysis (DT), which are more suitable for the research questions and available data for the pharmaceutical industry in Korea over the recent 30 years.
The rest of this study is structured as follows: Section 2 reviews extant studies on the growth of the firms and related research. Section 3 describes the drug production data of pharmaceutical firms in Korea and the detailed methodology used for GMA and DT. Section 4 analyzes the quantitative growth trend of the pharmaceutical industry based on drug production data from 1988 to 2017 in Korea. In addition, using GMA, we analyze the qualitative changes in the composition of pharmaceutical firms in 1998 and 2017. We also present the results of analyzing organization-side and strategy-side internal factors that significantly affect the sustainable growth of pharmaceutical firms according to two growth-firm classification models based on DT. Finally, Section 5 presents the contributions of this study, business and policy implications for sustainable growth strategies in the competitive environment of pharmaceutical firms, and the study’s limitations.
2. Literature Review
Theoretical and empirical research on the growth of firms has focused on the economics framework, dealing with the firm size distribution and relationships between a firm’s size and growth [3]. Early economic studies, especially industrial economics literature, have been conducted on the relationship between firms’ growth and other factors, such as Gibrat’s Law, the Jovanovic hypothesis, and the life cycle hypothesis [3,6]. The main content of Gibrat’s Law was that regardless of their initial size, the probability of a proportionate change in a firm’s size during a specified period is the same for all firms in a given industry. Jovanovic’s hypothesis relates to a firm’s growth and age, claiming an inverse relationship between corporate growth and business history. Finally, the life cycle hypothesis is a theory that holds that a firm goes through birth, growth, maturation, and death, just like living things [7]. After this classical literature, the subsequent empirical studies can be divided into two main groups: static studies that focus on determining factors for a firm’s growth and dynamic studies that analyze the persistence of a firm’s growth. Many empirical investigations using data sets of firms in many industries have been carried out to validate these theories. However, these size-oriented studies into the growth of firms can best be described as yielding ‘conflicting results’ [7].
The following theoretical and empirical studies have been conducted on the growth of firms and multiple factors other than firm size [8]. Some studies have included each firm’s growth rate, size, and age [9,10]. Furthermore, the correlation between firm growth and other factors, such as location, innovation strategies, and the firm’s position in the industry, become important factors, along with the structural change of the industry and innovation dynamics [11,12]. The multiple factor-related studies classified growth factors into three categories: firm-specific factors, such as the firm’s age, growth stage, and other financial factors; industry-specific factors, such as innovation regimes and the technology level of the industry; and macro-economic factors, such as business cycle, regional factors, and the country’s economic development stage [7,13]. These studies allow more sophisticated and detailed knowledge to be gained about the factors that influence the growth of firms. For example, R&D positively affected the growth of large firms and accelerated the growth of small firms, especially those with product-related patents [3,14]. Additionally, a few large companies sustained their growth through the concentration of innovative capabilities, particularly in the high-tech industry [15]. Chung explored the impact of R&D on sales growth rate with firm-specific factors and showed that R&D intensity positively affects a firm’s growth rate, while the R&D scale negatively affects the firm’s growth rate at the upper quantile [2]. These studies also focused both on external growth, such as employee size or the sales growth of a firm, and on the business circumstances of the firm [2,16].
Among these growth-related factors, innovation and competence-based resources play essential roles in a firm’s growth in recent studies [2,13,17]. Traditional IO economics assumed that heterogeneity among firms could not be sustained for long, as industrial competition would eventually destroy them [1]. Thus, in this context, firm-specific strategic considerations are unimportant, as industry choices and entry barriers can be key to competition and a firm’s growth. However, fundamentally different visions of firms emerged and held that a firm’s growth is led by an internal momentum generated by the firm’s learning-by-doing [18,19]. This claim leads to the resource-based view (RBV), a critical theory in strategic management and TIM studies. IO economists explored the impact of R&D on a firm’s growth with firm-specific factors, such as R&D intensity and investment under a specific industry structure [13]. On the other hand, RBV theory asserts that a firm’s short-term competitive advantage and long-term growth depend on its unique combination of physical, human, intellectual and organizational resources and managerial process [17,20,21,22,23]. Furthermore, the effects of internal factors on the firm performance show considerable heterogeneity in various firms with different characteristics, such as R&D intensity, innovation persistence, knowledge source, and entrepreneurship [2,24,25]. The literature has also shown that the dynamic innovation capability of high-tech firms has the necessary conditions for sustainable growth [26,27].
The impact of R&D, a most important resource and competence for growth, depends on the industry to which it belongs [3]. Since specific industries, such as pharmaceuticals and electronics, are different from general industries, research on the growth or firm’s change in specific industries has attracted the attention of IO economists and RBV researchers. There are many studies on a firm’s long-term growth and the change of shapes and strategies for growth in a particular industry in a country, using various theories and methodologies [1,24,26,27,28,29,30,31,32,33,34]. Therefore, the next literature review focused on the pharmaceutical industry by narrowing down these industry-specific growth studies.
First, there are historical and evolutionary studies regarding the pharmaceutical industry in particular countries [10,15,30,35]. These studies can identify and evaluate growth or structural changes in the pharmaceutical industry using empirical and historical evidence, such as FDA approval data and qualitative document analysis. For example, in a study on the strategic change of the pharmaceutical industry for ten years, Langley (2005) explained that pharmaceutical firms change from the past organizational structure to the current structure in response to environmental changes through coevolution theory and strategic development theory [10]. Munos (2009) investigated the relationship between regulation, firm size, mergers and acquisitions, and innovation longitudinally, using US pharmaceutical firms’ new drug development and approvals [28].
Second, there are RBV-based studies using empirical data on a firm’s growth and structural change in the pharmaceutical industry. In these studies, research topics are the classification of the firms’ growth and structural change for growth, identification of the determining factor for success over a long period, and difference analysis between the growing and non-growing firms. For example, Lee’s study [1] empirically analyzed the US pharmaceutical industry over 40 years and classified pharmaceutical firms into innovator and imitator groups using successive difference regression and Poisson regression with firm-level data from survey reports and patent documents. Bigliardi et al. reported the classified patterns of Italian biopharmaceutical firms and the firms’ growth strategies by the statistical cluster analysis of firm-level questionnaires [36]. In addition, Han reported that the key growth factors for Israeli pharmaceutical and biotech firms were funding and cooperation with various participants in the early stage, using a case study of a venturing program and venture capital firm with interview and mailing survey [37]. In terms of methodologies and data for RBV-based studies, extant studies have used quantitative methods, such as regression and cluster analysis with a survey or interview data, and qualitative methods, such as case studies with extensive literature reviews and surveys [36,37], unstructured interviews [37], and document analysis and growth models [34,38,39,40,41].
Finally, empirical studies combining firm-specific data from IO economics literature with RBV-based data investigate the impacts of its resource and strategic activities, such as open innovation, patenting, and funding strategies, on a firm’s growth. For example, Bianchi et al. (2011) studied how open innovation as an organizational strategy in the biopharmaceutical industry affects the growth of startups [24]. In addition, Demirel and Mazzucato (2012) showed that the positive impact of R&D on firm growth is highly conditional upon a combination of firm characteristics, such as firm size, patenting, and persistence in patenting, by exploring US pharmaceutical firms between 1950 and 2008 [17].
3. Data & Methods
3.1. Data
Existing studies have defined a firm’s growth indices as sales, the number of employees, profits, and market share. However, this approach has the drawback that most data for these indices can be obtained only from publicly listed firms [32]. Therefore, this study used a production amount measured by a monetary unit per year of the growth index for pharmaceutical firms and industry in Korea. Furthermore, unlike other industries, the Korean government collects data for pharmaceutical products since they significantly affect the health and life of people. Therefore, this production data reflected the accurate firm’s production since every Korean pharmaceutical firm must officially submit to The Ministry of Food and Drug Safety (MFDS) on the same basis.
On the other hand, because of confidential business information issues, reliable sales data for Korean pharmaceutical firms that are not publicly listed cannot be obtained for 30 years. Therefore, this study establishes a primary dataset of the production amount of every Korean pharmaceutical firm that produced finished pharmaceutical products from 1988 to 2017. The MFDS report includes the manufacturing plant name, product code, approval date, ethical drug or over-the-counter drug (OTC), classification number, finished drug or Active Pharmaceutical Ingredient (API), standard code, product name, packaging unit, packaging type, production amount, and final use of the products. This study excludes raw materials of drugs, quasi-drugs, medical gases, radioactive materials, and blood products since they are not finished pharmaceutical products. In addition, the finished pharmaceutical products manufactured in laboratories and hospitals are also excluded from pharmaceutical product data.
From 1988 to 2017, 910 firms reported their production performance in Korea. If a firm has changed its name due to M&A or other reasons, we regard it as the same. The final number of firms organized was 483 by tracking the affiliates of the same firm (186), multiple factories of the same firm (58), M&A (89), and firm name changes (94) over 30 years.
3.2. Methods
In order to study the qualitative changes in Korean pharmaceutical firms, this study adopts GMA, a qualitative analytic method for rigorously structuring and investigating the internal properties of non-quantifiable problem complexes containing some disparate dimensions [42]. GMA was proposed to classify complex problems in various fields of study, such as biology, geography, linguistics, and policy sciences. GMA has been successfully applied for policy analysis, scenario development, and strategy management. This study uses a morphology box suggested by [42] as an analysis tool for GMA. A common way to work with the morphology box is to define primary parameters as dimensions in the problem complex and assign each parameter a range of relevant values or conditions for each dimension as morphological shapes [42].
We suggested the following morphological box for pharmaceutical firms (Table 1), with the firm’s internal factors classified into seven dimensions and fourteen morphological shapes. The seven dimensions used were the firm’s country of origin, firm age, stock exchange listing, firm size, R&D intensity, and two production types (Ethical vs. OTC and Chemical vs. Bio).

Table 1.
The morphological box of a pharmaceutical firm.
The seven dimensions of the morphological box can be classified into two classes: the organization-side and the strategy-side dimensions. On the organization side, four dimensions of GMA were used; the firm’s origin (Domestic vs. Foreign), the firm’s age (Old vs. Young), the firm’s size (Large vs. Small and medium-sized enterprises (SME)), and listing on the stock exchange (Listed vs. Unlisted). On the strategy side, three dimensions of GMA were used; the production of chemical compounds only or biological products included (Chemical vs. Bio), the proportion of ethical drugs to the total drug’s production (Ethical vs. OTC), and experience of R&D-intensive products, or not. We operationally defined R&D-intensive products as New Molecular Entities (NME) or Incrementally Modified Drugs (IMD). These strategy-side dimensions depend on the firm’s strategy according to the business environment or policy change, while the organization-side dimensions are difficult to change for a firm.
The origin criteria were decided by the location of the firm’s headquarters. If a firm was established as a foreign-funded firm and then changed to a domestic one, it was classified as domestic. The firm was listed on two representative Korean public stock market indices, Korea Composite Stock Price Index (KOSPI) and Korea Securities Dealers Automated Quotations (KOSDAQ). The firm age refers to the firm’s duration based not on the date of foundation but the permission date of the pharmaceutical manufacturing from MFDS. We classified the firm’s average age into two categories: old firm (21.2 years old and older in the study year) and young firm (below 21.2 years old) since the average production year for Korean pharmaceutical firms is 21.2. The firm size is the number of employees in the last production year, decided by the Organization for Economic Cooperation and Development (OECD) criterion. SMEs were firms with 249 employees or less and large firms otherwise. Product definition was classified based on production ratio by two product types: Ethical or OTC and Chemical or Bio in the final year of production. After calculating the ratio of the production of ethical drugs, an ethical drug-focused firm was defined as the firm with a higher ratio of ethical drug production than the average ratio of the industry (71.5%), and an OTC drug-focused firm otherwise. Biopharmaceutical firms were classified into the experienced manufacturer of biological drugs: vaccines, cell culture medicines, cell therapy products, gene therapy products, and gene recombination products. We classified chemical-only firms otherwise. Since unlisted firms’ R&D information, such as R&D investment ratio to revenue, is publicly unknown, this study operationally defined the firms of R&D intensive products as firms that have experience in NME drug or IMD development.
DT can be used to explore, find, and classify the relationships between target and independent variables [43,44]. This study used the method of classifying target variables against independent variables using DT, which exploits quantitative and qualitative decision rules [45]. Based on the numeric or categorical data entered, DT labels an independent variable as the point of divergence to classify it into sub-groups and repeats the classification of the derived sub-groups via the divergence standard. DT is materialized as algorithms, such as Classification Additionally, Regression Trees (CART), Iterative Dichotomiser 3 (ID3), C4.5, and Chi-squared Automatic Interaction Detector (CHAID), based on the standards of divergence. For the presentation purpose of the DT, the analytic processes are expressed as graphs of the tree structure, enabling researchers to understand more efficiently than other classification models, such as discriminant analysis, regression analysis, and neural network analysis. Moreover, the strengths of DT are that the model explanation becomes easy, and the derivation of implications becomes available [46].
In this study, DT is not a machine learning method but a classical statistical classification method, which identifies a binary class label of the target variable for a given set of independent variables [47]. Therefore, the DT of this study does not use a learning process since this study does not have sufficiently large data for training for machine learning. Additionally, we do not want to forecast which firms will sustainably grow in the future. Instead, we want to identify which independent variables (i.e., internal factors in this study) are valid to classify the binary target variable, which tells if the firm has been a sustainable growth firm or not in the recent 30 years in this study.
The CART algorithm is one of the most well-known DT techniques. Since its introduction by Brieman et al., the CART algorithm has been one of the essential techniques in classification [47]. If an independent variable is a continuous variable, a regression tree is generated; if it is a category variable in a CART algorithm, a classification tree is generated [48,49]. For the CART algorithm, an entire dataset and repetition generate two child nodes to diverge a parent node.
The CART algorithm generates a tree structure: First, all the possible divergence points are studied for all independent variables. Then, the optimum divergence standards are selected to increase purity among the derived divergence points. Variance reduction is used for the continuous independent variable, while the Gini index is used for the category variable. If the divergence standards where data were selected in parent nodes are satisfied, it is classified as a left child node; if not satisfied, it is classified as a right child node. Then, each newly generated child node is repeatedly diverged by applying the same technique. In this process, divergence stops if the number of materials about the lowest node reaches the designated minimum.
4. Research Findings
4.1. Growth and Changing Analysis
4.1.1. The Growth Analysis of the Korean Pharmaceutical Industry in 30 Years (Research Question 1-1)
Figure 1 plots each year’s production data that we collected for the original 910 firms, which reported their product records in one year and more from 1988 to 2017 to MFDS. As a result, the total amount of pharmaceutical products produced by the adjusted 483 pharmaceutical firms, explained in Section 3 of this paper, has grown about eight times from Korean Won (KRW) 2.2 trillion in 1988 to KRW 17.3 trillion in 2017, as shown in Figure 1.
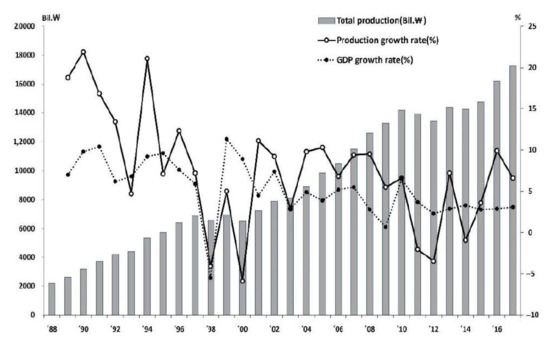
Figure 1.
The performance of production and growth rate for 30 years.
Figure 1 shows that the average annual growth rate of pharmaceutical products for 30 years was 7.59%, higher than 5.26%, Korea’s gross domestic product (GDP) growth rate, representing one of the fast-growing economies in the world, from 1988 to 2017. However, the annual growth rate of pharmaceutical products has a wider deviation than the GDP growth rate. This is because the first 10 out of the 30 years grew steeply (average growth rate of 13.7%), then gradually slowed down.
From 1988 to 2017, pharmaceutical production in Korea experienced three significant declines during a very high overall growth period. The first negative growth was experienced when the Korean International Monetary Fund (IMF) crisis was −4.1% in 1998. The production growth rate in 2000, when the separation of prescribing and dispensing, was −5.9%, while the growth rate in 2012, when the policy to cut the insurance drug price was implemented, was −3.5%. As the literature points out, the Korean government’s policy to separate prescription and dispensing from prescription drugs in 2000 profoundly affected the reorganization of the Korean medical system and pharmaceutical industry [41,50]. Finally, in 2012, when the production amount in monetary value decreased by 3.5% compared to the previous year, the insurance premium cut of the drug directly impacted the decrease in sales, leading to a decline in production rather than a reduction of actual production. This policy’s institutional impact has been mainly on consuming medicines and the qualitative and quantitative evaluation of health insurance finances [14,15]. This radical change in growth over 30 years was linked to the timing of the implementation of major regulations and policies. From the arguments of this section, we can conclude that the Korean pharmaceutical industry has grown continuously over the last 30 years, except for one national economic crisis and two major policy changes, which answered Research Question 1-1.
4.1.2. The Morphological Change of Korean Pharmaceutical Firms in 20 Years (Research Question 1-2)
Since 1988 was too early in the industry’s growth stage compared to 2017, this study established a momentous early year among 30 years for comparative analysis. Between 1988 and 2017, we concluded that 1998 was a cornerstone year for the Korean pharmaceutical industry since it was an economic inflection point resulting from the Korean IMF crisis. Furthermore, 1998 was two years before the significant pharmaceutical policy change, when the separation policy of prescribing and dispensing drugs was implemented. Therefore, we chose 1998 as the comparison year to 2017 for the qualitative change study of pharmaceutical firms.
The first part of this study compared firms’ morphologies by analyzing 180 firms that produced pharmaceutical products in 1998 and 225 in 2017 concerning the seven dimensions of the morphological box. Since not all 180 firms existed in 2017 and 225 in 1998, this dataset is unbalanced panel data. Table 2 shows the pattern of shape changes from 1998 to 2017. This table shows the firms’ morphological shapes change in the long-term view. The proportion of foreign and unlisted firms decreased, the proportion of large firms increased, and the number of startups increased. In 2017, the proportion of OTC was significantly reduced, bioproducts expanded, and the development of NME/IMD increased compared to 1998. OTC decreased dramatically from 71.1 to 16.9%, indicating a significant shapeshifting to Ethical.
Table 2.
Characteristics of Korean pharmaceutical firms in 1998 and 2017.
Based on the seven dimensions above, a maximum of (128) firm types could be possible. However, Korean pharmaceutical firms were classified into only 31 firm types in 1998 and 33 in 2017. Table 3 shows that the most common firm types were DUSOTCG (36.7%) and DUSYTCG (13.3%) in 1998, where each capital letter stands for the abbreviation for the morphological shape in Table 2. For example, DUSOTCG stands for Domestic, Unlisted, SME, and Old firms that manufacture OTC and Chemical only products with a Generic-oriented product portfolio. Hence, Korean pharmaceutical firms’ dominant shape in 1998 was DUS*TCG: Domestic, Unlisted firm, SME, OTC oriented, with a high proportion of Chemical product and Generic product types. Half of the 180 firms had these two morphological shapes in 1998. On the other hand, in Table 3, the most common forms were DUSYECG (21.8%) and DUSOECG (17.8%) in 2017. Therefore, the dominant shapes in 2017 changed to DUS*ECG: Domestic, Unlisted firm, SME, Ethical drug-oriented, with a high proportion of Chemical and Generic product types. Some 89 (39.6%) of 225 firms had these two morphological shapes in 2017.
Table 3.
The result of the morphological classification of pharmaceutical firms into increased and deceased types.
As shown in Table 4, 13 types of 35 firms did not exist in 1998 but newly appeared in 2017, where 20 firms were biopharmaceutical, and 17 were young. Double counting is possible since a firm can be both a biopharmaceutical and a young firm. Some 11 types of 22 firms in 1998 disappeared in 2017 (Table 4).
Table 4.
The morphological classification of pharmaceutical firms—newly emerged and deceased types.
Among 180 firms in 1998, 133 firms in 2017 survived and still produced pharmaceutical products. There were 22 firms with no morphological shape change; among these 133 firms, two merged into foreign countries. Of the remaining firms, seven firms changed four shapes, 11 firms changed three shapes, 31 firms changed two shapes, and the remaining firms changed only one shape. Table 5 shows the number of firms that change each shape. Most changed shapes are four types: from OTC drug production to ethical drug, from listed to unlisted, from SMEs to large enterprises, and from generic drugs to NME/IMD.
Table 5.
The comparison of morphological shapes of pharmaceutical firms between 1998 and 2017.
The result of this section is an answer to Research Question 1-2 showing that Korean pharmaceutical firms changed qualitatively in the firms’ morphologies between 1998 to 2017 to adapt to environmental change and for the firm’s growth.
4.2. Internal Factor Identification Analysis
4.2.1. Development of Classification Model
This section aims to identify the internal factors that explain the growth and non-growth of a firm over 30 years by developing a classification model based on the CART algorithm. We need some preprocessing for the firms’ production data to analyze the growth classification by a classification model. From the 483 firms obtained in Section 3.1, we excluded 147 firms with less than 5-year production history, as they had too little data for our analysis, leaving 336 firms. We controlled the missing data during the firm’s production history. For example, if the production data for one year is missed, we used the mean value before and after the year. In the case of missing 2 or 3 years of data, we interpolated using values before and after the year only if the missing years were less than 30% of the firm’s entire production year. This preprocessing of the data revised 42 firms. Even with this preprocessing process, we had to exclude 19 firms from the 336 firms with high missing data since they could harm the robustness of the analysis. After the data preprocessing process, 317 firms were finally obtained. Therefore, 317 firms’ data were used for the Internal Factor Identification Analysis by the CART algorithm. Table 6 presents the classification for the final 317 firms.
Table 6.
The classification of the internal factors of 317 pharmaceutical firms.
The classification dimensions in Table 6 were regarded as independent variables for the CART algorithm, and each variable value was measured and summarized as presented in Table 7. Table 7 divides all the independent variables into two types, binary and real variables. To use internal factors properly as independent variables of the CART algorithm, we applied three variables, production history, size, and ethical drug production rate, as not binary variables but real variables since the classification power in the CART algorithm is improved.
Table 7.
The variable value used in morphological classification.
This study considers whether a firm’s production capacity over different periods (minimum five years, maximum 30 years) sustainably outgrows those of other firms. We do not use the average growth rate over a production history of a specific firm as the definition of outgrowth. If the average growth rate is used, it is impossible to reflect the industry’s sustainable growth trend that changes over three decades. Additionally, it cannot reflect the life cycles of a firm’s startup, growth, and maturity stages, where the growth rate can differ. Therefore, this study analyzed two classification models, the AGF and the HGF models. These two models classified the firms as sustainable growing ones if their growth is recognizable using the average yearly growth rate and its standard deviation of 317 firms. We operationally defined AGF and HGF as follows. First, a firm achieves an AGF period in a specific year if the growth rate of the firm is more than the average growth rate of all firms plus 0.1 × (standard deviation of the growth rate) in that year. The firm is AGF if the AGF period is more than 40% of the production history of the firm. As a result, 167 firms out of 317 (52.6%) were designated AGFs. Second, a firm achieves an HGF in a specific year if the growth rate of the firm in the year is more than the average growth rate of all firms plus 0.3 × (standard deviation of the growth rate) in that year. The firm is HGF if the HGF period is more than 40% of the production history of the firm. As a result, 62 firms out of 317 (19.5%) were designated as HGFs.
We compared three representative DT algorithms in the R program package: ‘rpart package’, ‘Tree package’, and ‘Party package’. Some performance measures to compare the classification algorithms include accuracy, sensitivity, specificity, precision, and negative predictive value. This study used accuracy, the most balanced measure, to compare three DT algorithms in the R program package. The total classification accuracy for the rpart package, including over-fitting, was 70.6% (224/317) for AGF and 88.6% (281/317) for HGF. The total classification accuracy for the Tree package, including over-fitting, was 64.9% (206/317) for AGF and 82.9% (263/317) for HGF. For the Party package, the total classification accuracy was 66.9% (212/317) for AGF and 82.0% (260/317) for HGF. The rpart package classification tests showed the most accuracy for AGF and HGF among the three packages. Based on this comparison, the rpart package was selected as the algorithm for CART techniques to classify the sustainable growth of Korean pharmaceutical firms.
4.2.2. CART Analytic Results for AGF (Research Question 2-1)
Table 8 shows the classification results between AGF and Non-AGF when the AGF classification model is used.
Table 8.
The result of the classification of AGF and Non-AGF.
The classification sensitivity of the AGF model was 73.6% (123/167), and the specificity was 67.3% (101/150) for AGF. The total classification accuracy for AGF was 70.6% (224/317). A combination of three independent variables, size, production history, and ethical drug production rate (ETC rate), created the final CART tree for the AGF classification shown in Figure 2. This result justified our interpretation that AGFs are affected by internal factors, such as size, production history, and ETC rate.
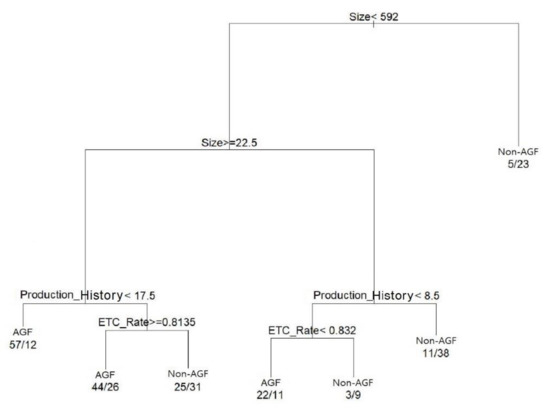
Figure 2.
The result of DT for the classification of AGFs.
Figure 2 depicts a detailed interpretation of the pharmaceutical firms’ internal growth factors. DT classifies candidates of AGF as left nodes if the divergence conditions are met. In Figure 2, the left node corresponds to the subset of the firms classified as AGFs. If the conditions are not met, candidates of Non-AGF are classified as right nodes. In Figure 2, the right node corresponding to the firms’ subset is classified as Non-AGF. For example, if the size, a condition of divergence on top, is lower than 592, it is classified as a left node. If it is 592 or higher, it is classified as a right node. The end of the leaf node expresses the condition where classification has been completed and shows the frequencies of AGF and Non-AGF. For example, for the first left leaf node, if the firm size is between 22.5 and 592 people and the production history is shorter than 17.5 years, 57 AGFs appear, and 12 Non-AGFs appear. If the conditions for AGF are classified from the left node based on Figure 2, AGFs are identified in three types, as shown in Table 9.
Table 9.
The characteristics of AGFs based on the type of internal factors.
The internal factors affecting AGFs are size, production history, and ETC rate, presented in Table 9, and we derived the following conditions for AGFs, which answered Research Question 2-1:
- (1)
- The size is medium (22.5 or more and below 592 people) or greater and young (the production history below 17.5 years)
- (2)
- The size is medium (22.5 or more and below 592 people) and old (the production history 17.5 years or more), with ethical drug intensive production (ETC rate 81.4% or more)
- (3)
- The size is small (below 22.5 people) and very young (the production history below 8.5 years), with OTC intensive production (ETC rate below 83.2%).
4.2.3. CART Analytic Results for HGF (Research Question 2-2)
Table 10 shows the classification results between HGF and Non-HGF when the HGF classification model is used:
Table 10.
Result of the classification of HGF and Non-HGF.
The classification sensitivity of the HGF model was 62.9% (39/62), and the specificity was 94.9% (242/255) for HGF. The total classification accuracy for HGF was 88.6% (281/317). The accuracy of the HGF model is better than that of the AGF model, which means that the HGFs have stronger classification factors than the AGFs. A combination of six independent variables, size, production history, R&D investment, origin, listed on the stock market, and ethical drug production rate (ETC rate), created the final CART tree for the HGF classification shown in Figure 3. Based on Figure 3, the final CART tree for HGF, we can interpret that HGF is affected by internal factors, such as production history, size, listing, origin, R&D investment, and ETC rates.
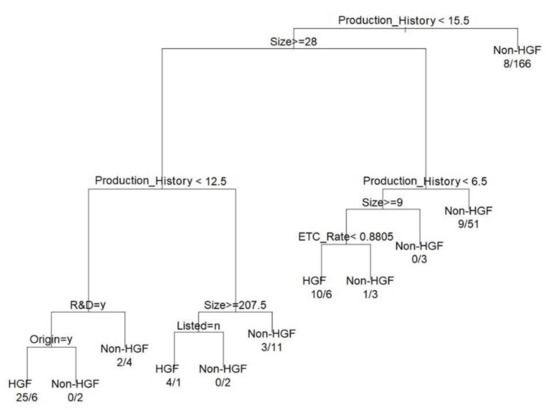
Figure 3.
The result of DT for the classification of HGFs.
Table 11.
The characteristics of HGFs based on the type of internal factors.
The internal factors of HGF are production history, size, R&D, origin and listing, and ETC rate (Table 11), and we derived the following conditions for HGFs, which answered Research Question 2-2.
- (1)
- Domestic firms sized middle and large (28 people or more) with young (the production history below 12.5) and emphasizing investment in R&D through NME/IMD production
- (2)
- Unlisted firms sized large (207.5 people or more) with young (the production history below 12.5 years)
- (3)
- The size is above the minimum to small (9 people or more and below 28) with very young (the production history below 6.5), with OTC intensive production (ETC rate below 88.1%).
4.3. Discussions
Various studies have been conducted on the pharmaceutical industry’s quantitative growth in various countries [29,51] or industry-level changes over a long period [12,51]. However, the main themes of these studies are the impact analysis of specific environmental changes, such as licensed new drugs, the effectiveness of the regulatory policies, or how top pharmaceutical firms, rather than most pharmaceutical firms, have grown using valuable resources [10,52]. On the other hand, this study identified the domestic pharmaceutical industry’s overall growth and short-term stagnation from 1988 to 2017. Factors that explain these stagnations are the national economic situations or pharmaceutical policies such as the Korea IMF crisis, insurance premium reduction policy, and the separation policy of prescribing and dispensing [53].
The biggest change in the morphological shapes of Korean pharmaceutical companies after 20 years, which is a result of this study, is the change in the types of pharmaceutical products. As Das (1995) argued, a firm’s growth pattern is unusual in a fast-growing industry, and the rate of small firms to large enterprises and the rate of young companies to old ones are different [54]. However, in Korea, the types of companies became more diversified from 1998 to 2017, and the dominant type of companies changed significantly before and after the major policies changed. For example, in 1998, large pharmaceutical companies dominated the production of generic chemical OTC. However, in 2017, startups and mid-sized companies changed to a form in which companies producing chemical generic ethical drugs dominated.
The extant research has not focused on the internal factors of pharmaceutical firms [2,16,43,52,55] or did not use quantitative data over a long period for the firm’s growth research [32,46,56,57]. Therefore, we studied the internal characteristics of firms that showed AGF and HGF for 30 years. Various theories have been proposed for firm-size distributions in firm growth [58]. According to this theory, small firms grew quickly, but large companies did not. However, in our AGF or HGF models, it was found that the growth patterns of small and large companies were different. Comparing the factor in AGF and HGF models, the HGF model has more innovation-related factors, which was expressed as “domestic firms, sized middle and larger, with young firms, with high investment in R&D through NME/IMD production”. Since some of these factors were not discovered in the AGF model, as Coad and Rao (2006) argued, the innovation of average-growth firms may not be an important factor for high growth. However, innovation is the most important factor for sustainable high-growing firms, according to our HGF model, which was observed in [58].
5. Conclusions
In this study, we derived the following theoretical contributions. First, we investigated Korea’s pharmaceutical industry’s production growth from 1988 to 2017 through the actual production data of almost all pharmaceutical firms in Korea between 1988 and 2017. Compared to using firm-specific factors, such as the firm’s size, age, and other financial factors, this study has the advantage of empirical analysis of the growth of firms and industrial growth using actual drug production data. As a result, it was possible to explain the continuous growth and three short-term growth stagnation experienced by the Korean pharmaceutical industry over the past 30 years. In particular, the three major downturns could be explained by the impact of the IMF crisis and two regulatory policies: prescription and preparation separation and drug insurance cost reduction. Second, we investigated qualitative changes by measuring seven dimensions of the morphological shapes, and the results could be interpreted through environmental changes in the Korean pharmaceutical industry. As a result, Korean pharmaceutical companies have changed from OTC to ETC, have switched from generic products to new drug products (NME or IMD), and new companies have expanded their roles. Lastly, this study explicitly identifies the internal factors of pharmaceutical firms that caused the difference between sustainable growth and non-growth for 30 years from 1988 to 2017. In detail, we identified internal factors that contributed to the continued growth of AGF and HGF using state-of-the-art data science, two classification models based on DT using organization-side and strategy-side data from each company.
Our research has the following business implications. First, this study shows that pharmaceutical firms’ patterns have significantly changed in Korea since 1998. The most notable changes were that ethical drug producers increased by 54.2%, and the number of firms developing new drugs increased. In addition, the number of foreign-invested firms decreased significantly as multinational corporations began importing medicines after removing their manufacturing facilities and abolishing the system for registering insurance drugs only for domestic manufacturing. These facts imply that the pharmaceutical firms that strategically adapt business fitness to the change in environment, such as the separation of prescription and dispensing systems and the Korean IMF crisis, can survive and sustainably grow long-term. Second, this study identifies which internal factors of sustainable firms matter for sustainable growth. Since the internal factors are divided by strategy-side and organization-side factors, our analysis results identify those combinations of strategy-side factors depending on given organization-side factors are crucial for sustainable growth. For example, the AGF model confirmed that a suitable combination of the size of pharmaceutical firms, production history, and ethical drug production ratio significantly affects a firm’s sustainable above-average growth. On the other hand, the HGF model requires a more sophisticated combination of internal factors, such as origin, listing status, size, age, and product strategies (R&D intensive and Ethical oriented) for sustainable high growth. Note that the organization-side internal factors, such as nationality, firm size, stock market listing status, and production history, are more inherent or difficult to control for a firm’s growth than the strategy-side internal factors. Therefore, a pharmaceutical firm can expand its growth opportunities by using its strategy-side internal factors with its given organization-side internal factors.
This research has the following policy implications. First, policy authorities need to establish policies for the growth of pharmaceutical companies in consideration of the size of pharmaceutical companies and the production history and form of the companies. For example, the government can develop a policy to support an OTC-oriented growth strategy for small and very young firms by considering the growth conditions of the AGF model. Additionally, for middle and large-size startups, NME/IMD support policy seems to be suitable by considering the growth conditions of the HGF model. Second, policymakers must recognize that successful pharmaceutical companies can strategically respond to environmental and regulatory changes and, as a result, survive and sustainably grow over the long term. Therefore, it is necessary to establish and implement policies to establish a desirable pharmaceutical industry ecosystem to effectively support pharmaceutical companies’ response to environmental and regulatory changes.
This study has the following limitations and suggestions for future research. First, this study analyzed only those firms producing drugs in Korea and omitted the imported drugs, which account for about 40% of the Korean pharmaceutical industry. Hence, it may not represent the entire Korean pharmaceutical market. Future studies can give more valuable information if they include imported NME and IMD drugs since domestic new drugs were a few until recent years. Second, this study did not use sales data. However, production data are used since production data is the only alternative for firms that engage in meaningful production activities but are not publicly listed. Therefore, a more realistic result would have been obtained if sales data could be obtained rather than production data. Third, although the computer DB for the drug production data has been used since 1990, there are some missing data, so our study had data collection and preprocessing challenges. In the future, reducing missing data by improving the system for collecting and managing pharmaceutical-related data will also be helpful for data-based research, which has recently been emphasized in many scientific domains. Finally, although the morphological changes of firms existing in 1998 and 2017 were analyzed using GMA, it was impossible to track the effects of each firm’s specific factors on the firms in detail. Therefore, in future research, it is necessary to trace the relationship between morphological change and the internal factors of individual firms.
Author Contributions
Conceptualization, S.I.U.; methodology, C.K.; software, J.K. and T.H.; validation, J.K. and T.H.; formal analysis, S.I.U.; investigation, S.I.U.; resources, H.L.; data curation, J.K. and H.L.; writing—original draft preparation, C.K. and S.I.U.; writing—review and editing, C.K. and H.L.; visualization, J.K. and T.H.; supervision, H.L.; project administration, C.K.; funding acquisition, H.L. All authors have read and agreed to the published version of the manuscript.
Funding
This research was supported by National Research Foundation Korea (NRF) grants funded by the Ministry of Science and ICT (MSIT) of Korea, grant numbers 2021R1F1A1063690.
Institutional Review Board Statement
Not applicable.
Informed Consent Statement
Not applicable.
Data Availability Statement
The data presented in this study are available on request from the corresponding author.
Conflicts of Interest
The authors declare no conflict of interest.
References
- Lee, J. Innovation and Strategic Divergence: An Empirical Study of the U.S. Pharmaceutical Industry from 1920 to 1960. Manag. Sci. 2003, 49, 143–159. [Google Scholar] [CrossRef]
- Ahn, S.G.; Yoon, J.; Kim, Y.J. The Innovation Activities of Small and Medium-Sized Enterprises and Their Growth: Quantile Regression Analysis and Structural Equation Modeling. J. Technol. Transf. 2018, 43, 316–342. [Google Scholar] [CrossRef]
- Pyka, A.; Bogner, K.; Urmetzer, S. Productivity Slowdown, Exhausted Opportunities and the Power of Human Ingenuity—Schumpeter Meets Georgescu-Roegen. J. Open Innov. Technol. Mark. Complex. 2019, 5, 39. [Google Scholar] [CrossRef]
- Yeo, Y.; Park, C. Managing Growing Pains for the Sustainable Growth of Organizations: Evidence from the Growth Pathways and Strategic Choices of Korean Firms. Sustainability 2018, 10, 3824. [Google Scholar] [CrossRef]
- 2020 Pharmaceutical Industry Analysis Report; Korea Health Industry Development Institute: Seoul, Republic of Korea, 2021.
- Lieberson, S.; O’Connor, J.F. Leadership and Organizational Performance: A Study of Large Corporations. Am. Sociol. Rev. 1972, 37, 117–130. Available online: https://www.Jstor.Org/Stable/2094020 (accessed on 1 May 2022). [CrossRef]
- Coad, A. Firm Growth: A Survey. 2007, p. 6. Available online: https://halshs.archives-ouvertes.fr/halshs-00155762/document (accessed on 1 May 2022).
- Tushman, M.L.; Anderson, P. Technological Discontinuities and Organizational Environments. Adm. Sci. Q. 1986, 31, 439–465. Available online: http://www.Jstor.Org/Stable/ (accessed on 1 May 2022). [CrossRef]
- Castrogiovanni, G.J. Environmental Munificence: A Theoretical Assessment. Acad. Manag. Rev. 1991, 16, 542–565. Available online: http://www.Jstor.Org/S (accessed on 1 May 2022). [CrossRef]
- Langley, A. Strategic Change in the Pharmaceutical Industry 1992–2002: Evolution and Coevolution of Firms’ Grand Strategies. Ph.D. Thesis, University of Northampton, Northampton, UK, 2005. [Google Scholar]
- Segarra, A.; Teruel, M. High-Growth Firms and Innovation: An Empirical Analysis for Spanish Firms. Small Bus. Econ. 2014, 43, 805–821. [Google Scholar] [CrossRef]
- Seul, M. Influences of Patent and Drug Safety Regulation Agency and Korea’s Direction in Pharmaceutical Industry’s Innovation—Focusing on Features of Korea’s Pharmaceutical Industry and Biologics. J. Intellect. Prop. 2016, 11, 75–113. [Google Scholar] [CrossRef]
- Chung, H.; Eum, S.; Lee, C. Firm Growth and R & D in the Korean Pharmaceutical Industry. Sustainability 2019, 11, 2865. [Google Scholar] [CrossRef]
- Scherer, F.M.; Ross, D. Industrial Market Structure and Economic Performance; Academy for Entrepreneurial Leadership Historical Research Reference in Entrepreneurship, University of Illinois: Champaign, IL, USA, 1990. [Google Scholar]
- Achilladelis, B.; Antonakis, N. The Dynamics of Technological Innovation: The Case of the Pharmaceutical Industry. Res. Policy 2001, 30, 535–588. [Google Scholar] [CrossRef]
- Coad, A. Testing the Principle of “Growth of the Fitter”: The Relationship between Profits and Firm Growth. Struct. Chang. Econ. Dyn. 2007, 18, 370–386. [Google Scholar] [CrossRef]
- Choi, Y.R.; Ha, S.; Kim, Y. Innovation Ambidexterity, Resource Configuration and Firm Growth: Is Smallness a Liability or an Asset? Small Bus. Econ. 2021, 58, 2183–2209. [Google Scholar] [CrossRef]
- Penrose, E. The Theory of the Growth of the Firms; John Wiley & Sons: New York, NY, USA, 1959. [Google Scholar]
- Yasemin, Y.K.; Penrose’s, M.J.T.E. Contributions to the Resource-Based View of Strategic Management. J. Manag. Stud. 2004, 41, 183–191. [Google Scholar] [CrossRef]
- Barbosa, N. Portuguese Farming Firms’ Growth: Do Human Capital and Managerial Capabilities Matter? New Medit 2020, 19, 101–116. [Google Scholar] [CrossRef]
- Assensoh-Kodua, A. The Resource-Based View: A Tool of Key Competency for Competitive Advantage. Probl. Perspect. Manag. 2019, 17, 143–152. [Google Scholar] [CrossRef]
- Collins, C.J. Expanding the Resource Based View Model of Strategic Human Resource Management. Int. J. Hum. Resour. Manag. 2021, 32, 331–358. [Google Scholar] [CrossRef]
- Hou, H. Ecosystem Orchestration for Firm Growth: A Longitudinal Case Study. Ph.D. Thesis, University of Cambridge, Cambridge, UK, 2021. [Google Scholar]
- Grillitsch, M.; Schubert, T.; Srholec, M. Knowledge Base Combinations and Firm Growth. Res. Policy 2019, 48, 234–247. [Google Scholar] [CrossRef]
- Zahra, S.A. The Resource-Based View, Resourcefulness, and Resource Management in Startup Firms: A Proposed Research Agenda. J. Manag. 2021, 47, 1841–1860. [Google Scholar] [CrossRef]
- Demirel, P.; Mazzucato, M. Innovation and Firm Growth: Is R&D Worth It? Ind. Innov. 2012, 19, 45–62. [Google Scholar] [CrossRef]
- Mazzucato, M.; Parris, S. High-Growth Firms in Changing Competitive Environments: The US Pharmaceutical Industry (1963 to 2002). Small Bus. Econ. 2015, 44, 145–170. [Google Scholar] [CrossRef]
- Oliveira, B.; Fortunato, A. Firm Growth and R&D: Evidence from the Portuguese Manufacturing Industry. J. Evol. Econ. 2017, 27, 613–627. [Google Scholar] [CrossRef]
- Munos, B. Lessons from 60 Years of Pharmaceutical Innovation. Nat. Rev. Drug Discov. 2009, 8, 959–968. [Google Scholar] [CrossRef] [PubMed]
- Artz, K.W.; Norman, P.M.; Hatfield, D.E.; Cardinal, L.B. A Longitudinal Study of the Impact of R&D, Patents, and Product Innovation on Firm Performance. J. Prod. Innov. Manag. 2010, 27, 725–740. [Google Scholar] [CrossRef]
- Leitner, K.-H.; Güldenberg, S. Generic Strategies and Firm Performance in SMEs: A Longitudinal Study of Austrian SMEs. Small Bus. Econ. 2010, 35, 169–189. [Google Scholar] [CrossRef]
- Deligianni, I.; Voudouris, I.; Lioukas, S. Growth Paths of Small Technology Firms: The Effects of Different Knowledge Types over Time. J. World Bus. 2015, 50, 491–504. [Google Scholar] [CrossRef]
- Teramae, F.; Makino, T.; Lim, Y.; Sengoku, S.; Kodama, K. Impact of Research and Development Strategy on Sustainable Growth in Multinational Pharmaceutical Companies. Sustainability 2020, 12, 5358. [Google Scholar] [CrossRef]
- Bianchi, M.; Cavaliere, A.; Chiaroni, D.; Frattini, F.; Chiesa, V. Organisational Modes for Open Innovation in the Bio-Pharmaceutical Industry: An Exploratory Analysis. Technovation 2011, 31, 22–33. [Google Scholar] [CrossRef]
- Malerba, F.; Orsenigo, L. The Evolution of the Pharmaceutical Industry. Bus. Hist. 2015, 57, 664–687. [Google Scholar] [CrossRef]
- Bigliardi, B.; Nosella, A.; Verbano, C. Business Models in Italian Biotechnology Industry: A Quantitative Analysis. Technovation 2005, 25, 1299–1306. [Google Scholar] [CrossRef]
- Han, J. The Characteristics of Pharmaceutical Firm’s Fast Growth in Israel—Case Study of Venturing Firm, BioLineRX and Venture Capital. J. Korean Inst. Innov. 2011, 6, 117–148. (In Korean) [Google Scholar]
- McKelvie, A.; Wiklund, J. Advancing Firm Growth Research: A Focus on Growth Mode Instead of Growth Rate. Entrep. Theory Pract. 2010, 34, 261–288. [Google Scholar] [CrossRef]
- Almus, M.; Nerlinger, E.A. Growth of New Technology-Based Firms: Which Factors Matter? Small Bus. Econ. 1999, 13, 141–154. [Google Scholar] [CrossRef]
- Buldyrev, S.V.; Growiec, J.; Pammolli, F.; Riccaboni, M.; Stanley, H.E. The Growth of Business Firms: Facts and Theory. J. Eur. Econ. Assoc. 2007, 5, 574–584. [Google Scholar] [CrossRef][Green Version]
- Day, G.S. An Outside-in Approach to Resource-Based Theories. J. Acad. Mark. Sci. 2014, 42, 27–28. [Google Scholar] [CrossRef]
- Ritchey, T. Fritz Zwicky, Morphologie and Policy Analysis. In Proceedings of the 16th EURO Conference on Operational Analysis, Brussels, Belgium, 12–15 July 1998; p. 11. [Google Scholar]
- Quinlan, J.R. Induction of Decision Trees. Mach. Learn. 1986, 1, 81–106. [Google Scholar] [CrossRef]
- You, H.J. Prediction Model Using Decision Tree Analysis on Revisiting of Japanese Tourists in Korea. J. Prod. Res. 2019, 37, 21–30. (In Korean) [Google Scholar]
- Nichter, S.; Goldmark, L. Small Firm Growth in Developing Countries. World Dev. 2009, 37, 1453–1464. [Google Scholar] [CrossRef]
- Choi, J.H.; Seo, D.S. Application of Decision Tree in Datamining. (KOSTAT Stat. Korea) Stat. Anal. Study 1999, 4, 61–83. [Google Scholar]
- Breiman, L.; Friedman, J.H.; Olshen, R.A.; Stone, C. Classification and Regression Trees; Chapman & Hall: London, UK, 2017. [Google Scholar]
- Choi, C.H. Data Mining Technology and Use. Han Na-rae Acad. 2012, 263–290. [Google Scholar]
- Ripley, B. Tree: Classification and Regression Trees. R Package Version 1.0. 2022. Available online: https://cran.r-project.org/web/packages/tree/index.html (accessed on 1 May 2022).
- Hinterhuber, A. Can Competitive Advantage Be Predicted?: Towards a Predictive Definition of Competitive Advantage in the Resource-Based View of the Firm. Manag. Decis. 2013, 51, 795–812. [Google Scholar] [CrossRef]
- Lewis, V.; Churchill, N. The Five Stages of Small Business Growt; Academy for Entrepreneurial Leadership Historical Research Reference in Entrepreneurship, University of Illinois: Champaign, IL, USA, 2009. [Google Scholar]
- Evans, D.S. The Relationship between Firm Growth, Size, and Age: Estimates for 100 Manufacturing Industries. J. Ind. Econ. 1987, 35, 567–581. [Google Scholar] [CrossRef]
- Kim, H.J.; Chung, W.; Lee, S.G. Lessons from Korea’s Pharmaceutical Policy Reform: The Separation of Medical Institutions and Pharmacies for Outpatient Care. Health Policy 2004, 68, 267–275. [Google Scholar] [CrossRef]
- Das, S. Size, Age and Firm Growth in an Infant Industry: The Computer Hardware Industry in India. Int. J. Ind. Organ. 1995, 13, 111–126. [Google Scholar] [CrossRef]
- Nunes, P.M.; Serrasqueiro, Z.S.; Leitão, J. Are There Nonlinear Relationships between the Profitability of Portuguese Service SME and Its Specific Determinants? Serv. Ind. J. 2010, 30, 1313–1341. [Google Scholar] [CrossRef]
- Traù, F. The Organisational Factor and the Growth of Firms. Camb. J. Econ. 2017, 41, 749–774. [Google Scholar] [CrossRef]
- Hansen, B.; Hamilton, R.T. Factors Distinguishing Small Firm Growers and Non-Growers. Int. Small Bus. J. 2011, 29, 278–294. [Google Scholar] [CrossRef]
- Coad, A.; Rao, R. Innovation and Market Value: A Quantile Regression Analysis. Econ. Bull. 2006, 15, 1–10. [Google Scholar]


Publisher’s Note: MDPI stays neutral with regard to jurisdictional claims in published maps and institutional affiliations. |
© 2022 by the authors. Licensee MDPI, Basel, Switzerland. This article is an open access article distributed under the terms and conditions of the Creative Commons Attribution (CC BY) license (https://creativecommons.org/licenses/by/4.0/).