Long-Term Strategies for Multimodal Transportation of Block Rubber in Thailand
Abstract
:1. Introduction
2. Materials and Methods
2.1. Multimodal Transportation of Block Rubber in Thailand
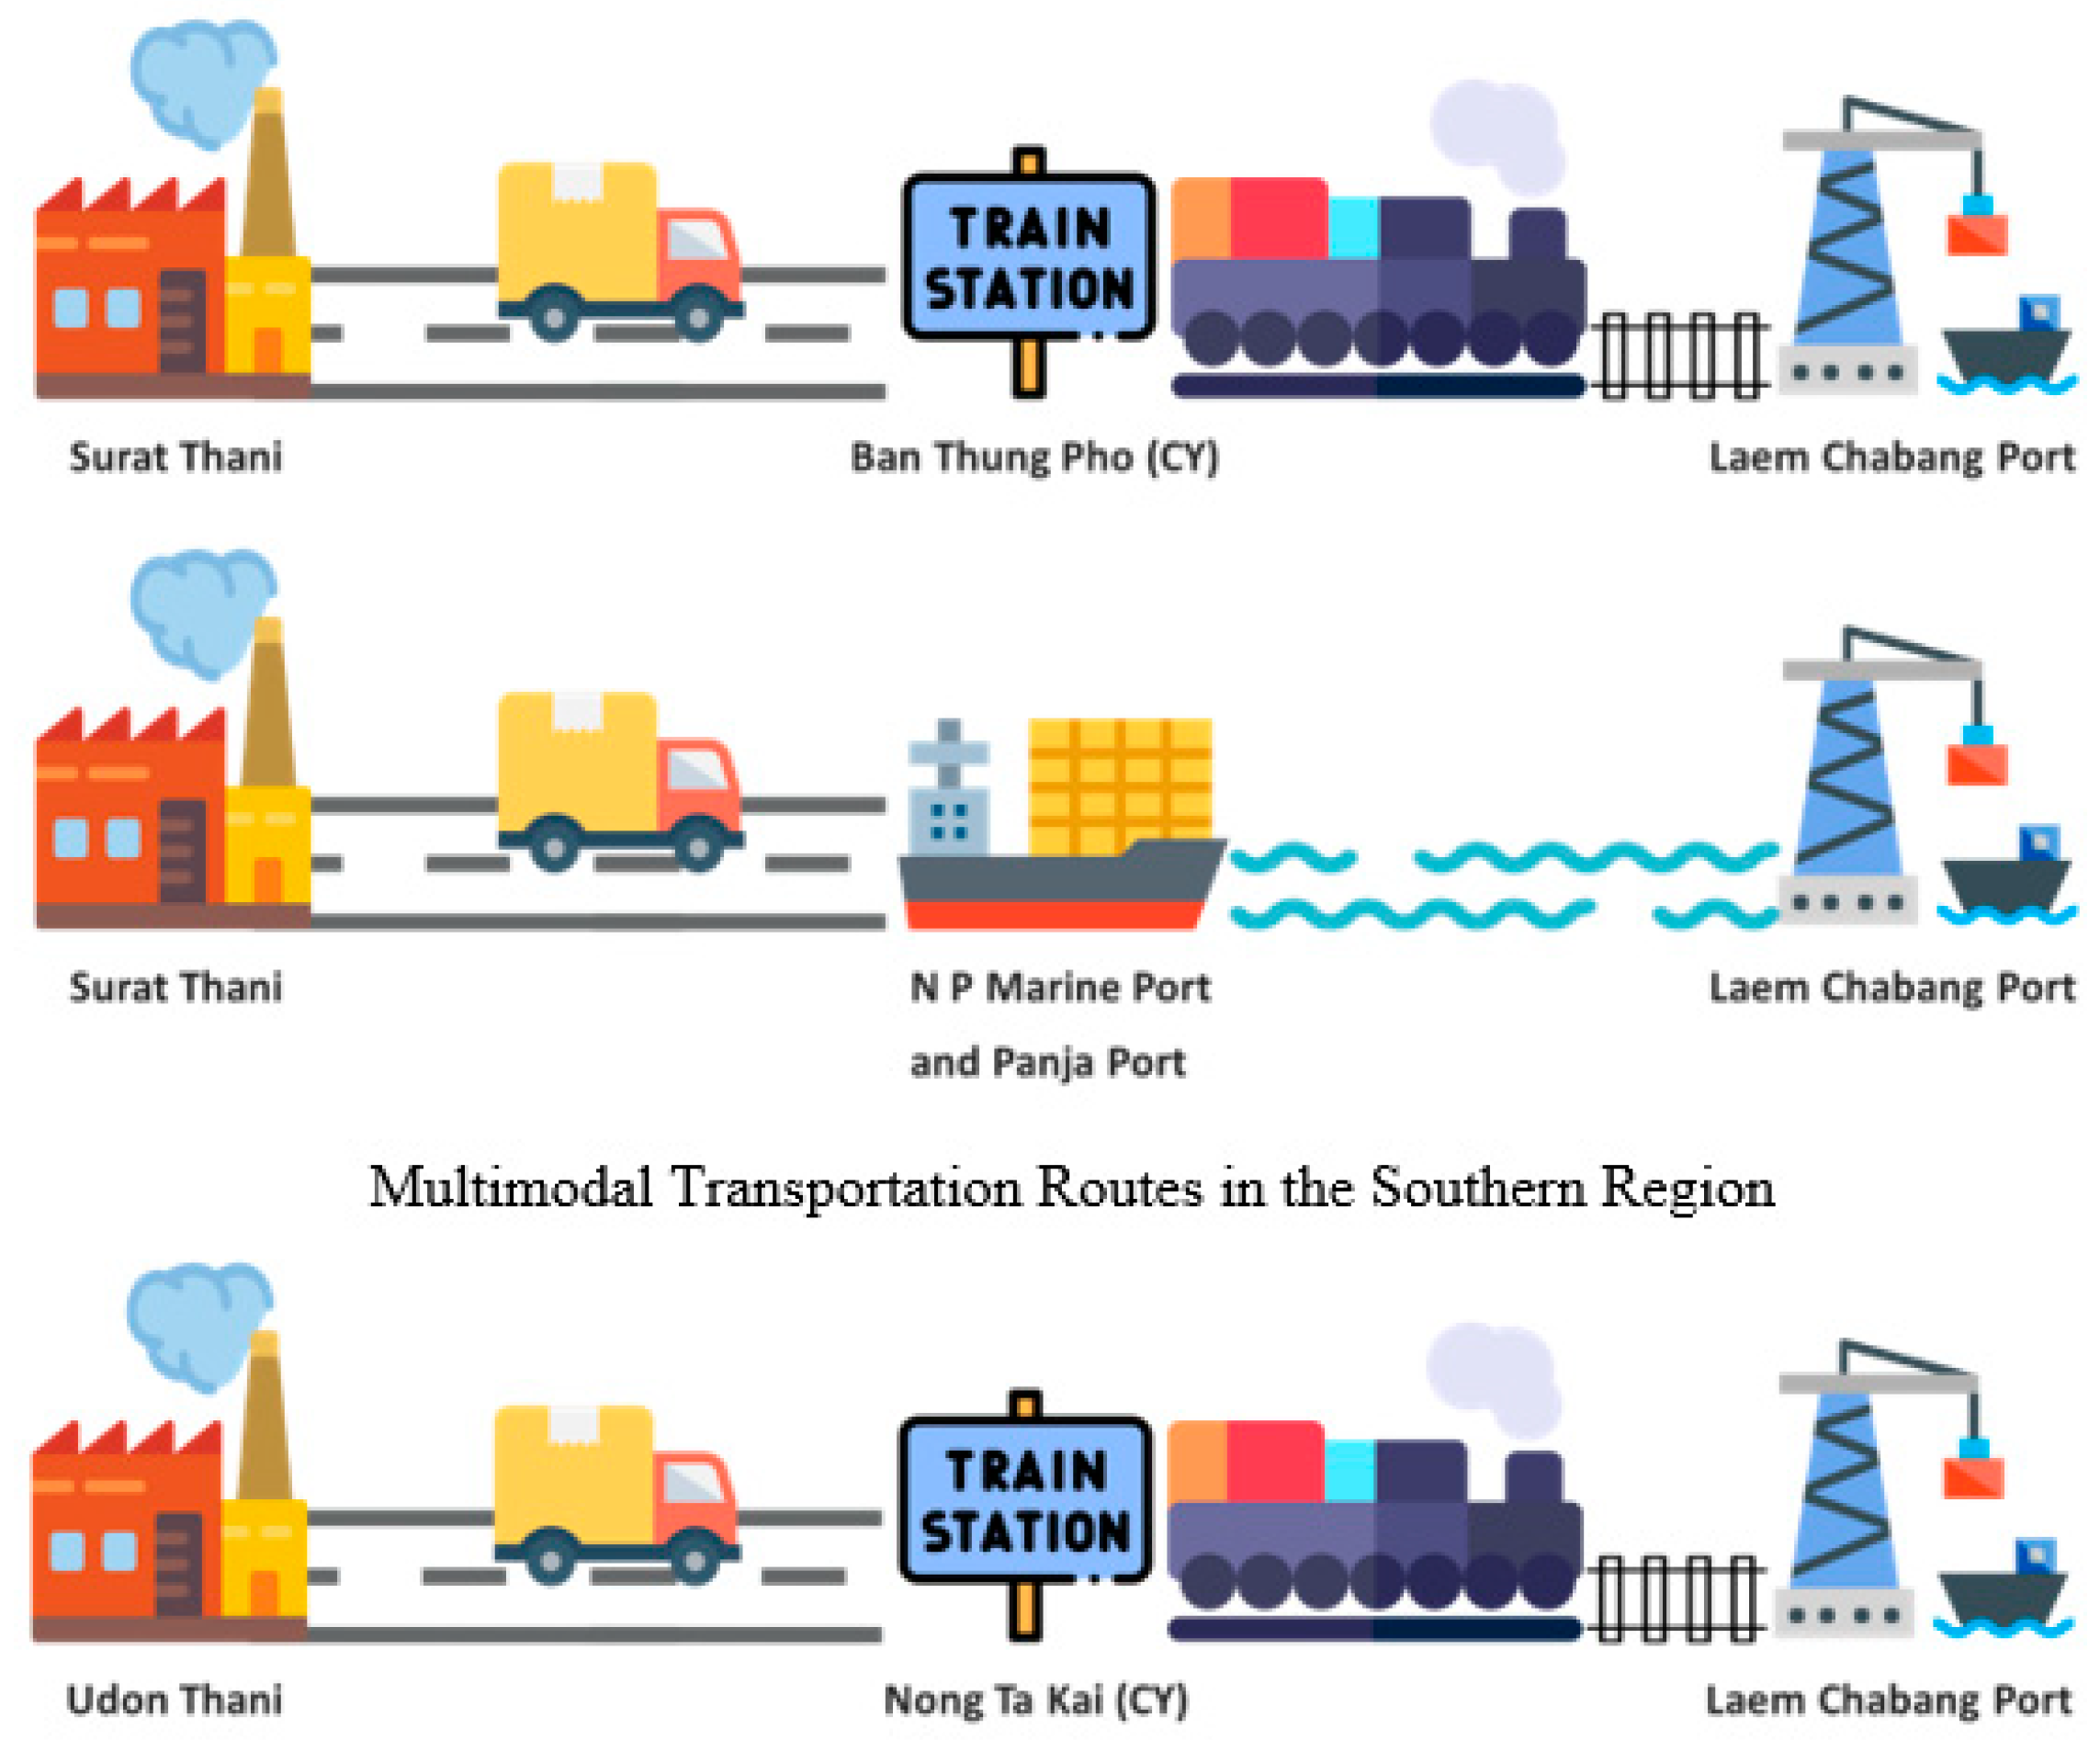
- Truck-train mode combination: block rubber is transported by trucks from the rubber production companies in Surat Thani province to Ban Thung Pho Junction Railway Station (located in Surat Thani province). Then, the block rubber is transferred onto trains and transported to Laem Chabang port.
- Truck-ship mode combination: block rubber is transported by trucks from the rubber production companies in Surat Thani province to NP Marine and Panja ports in Surat Thani province. Then, the block rubber is transferred onto ships and transported to Laem Chabang port.
- Truck-only mode: block rubber is transported by trucks from the rubber production companies in Surat Thani province to Laem Chabang port.
- Truck-train mode combination: block rubber is transported by trucks from the rubber production companies in Udon Thani province to Nong Takai Railway Station in Udon Thani province. Then, the block rubber is transferred onto trains and transported to Laem Chabang port.
- Truck-only mode: block rubber is transported by trucks from the rubber production companies in Udon Thani province to Laem Chabang port.
2.2. System Dynamics Modeling Approach
2.3. Data Used in the Development of a SD Model of Multimodal Transportation
- The circumstance inputs are the baseline data of block rubber production and transportation in Thailand, such as the current fuel prices, block rubber demand and supply, CY capacity, and port capacity. The data provides the overall logistics costs of the current condition and situation, which will be a foundation for projecting the cost in the next 20 years.
- The scenario inputs are the trends of the circumstance inputs, which are defined by the historical data, such as the increasing rates of fuel prices and block rubber demand and supply.
- The policy inputs are the government policies supporting multimodal transportation, such as the double-track railway project that aims to increase the efficiency of rail transportation, which, in turn, will increase the train capacity and train rounds per day. These will enable the assessment of the impacts of policies over time.
- Interrelationship inputs reflect the relationships among critical multimodal transportation factors, which in this study are retrieved and adjusted from Pongsayaporn et al. [25]. For instance, the correlations of the road constraints factor to the market and multimodal transportation infrastructure factors, are used as an incentive for multimodal transportation usage.
2.4. SD Model of Multimodal Transportation of the Block Rubber in Thailand
- The SD model is simulated for 20 years to examine the use of multimodal transportation, and overall logistics costs, following the government’s infrastructure plans in the next 20 years.
- Data used in the SD model are achieved from the secondary data, such as international journals, companies’ reports, statistical records, and personal communications.
- Mode combinations used in the SD model development are based on current operations, i.e., truck, train, and ship modes. Air transportation is not considered for agricultural product transportation in the study.
- The selected mode of transportation is based on the lowest logistics costs. Other factors, such as social and environmental impacts, are not considered.
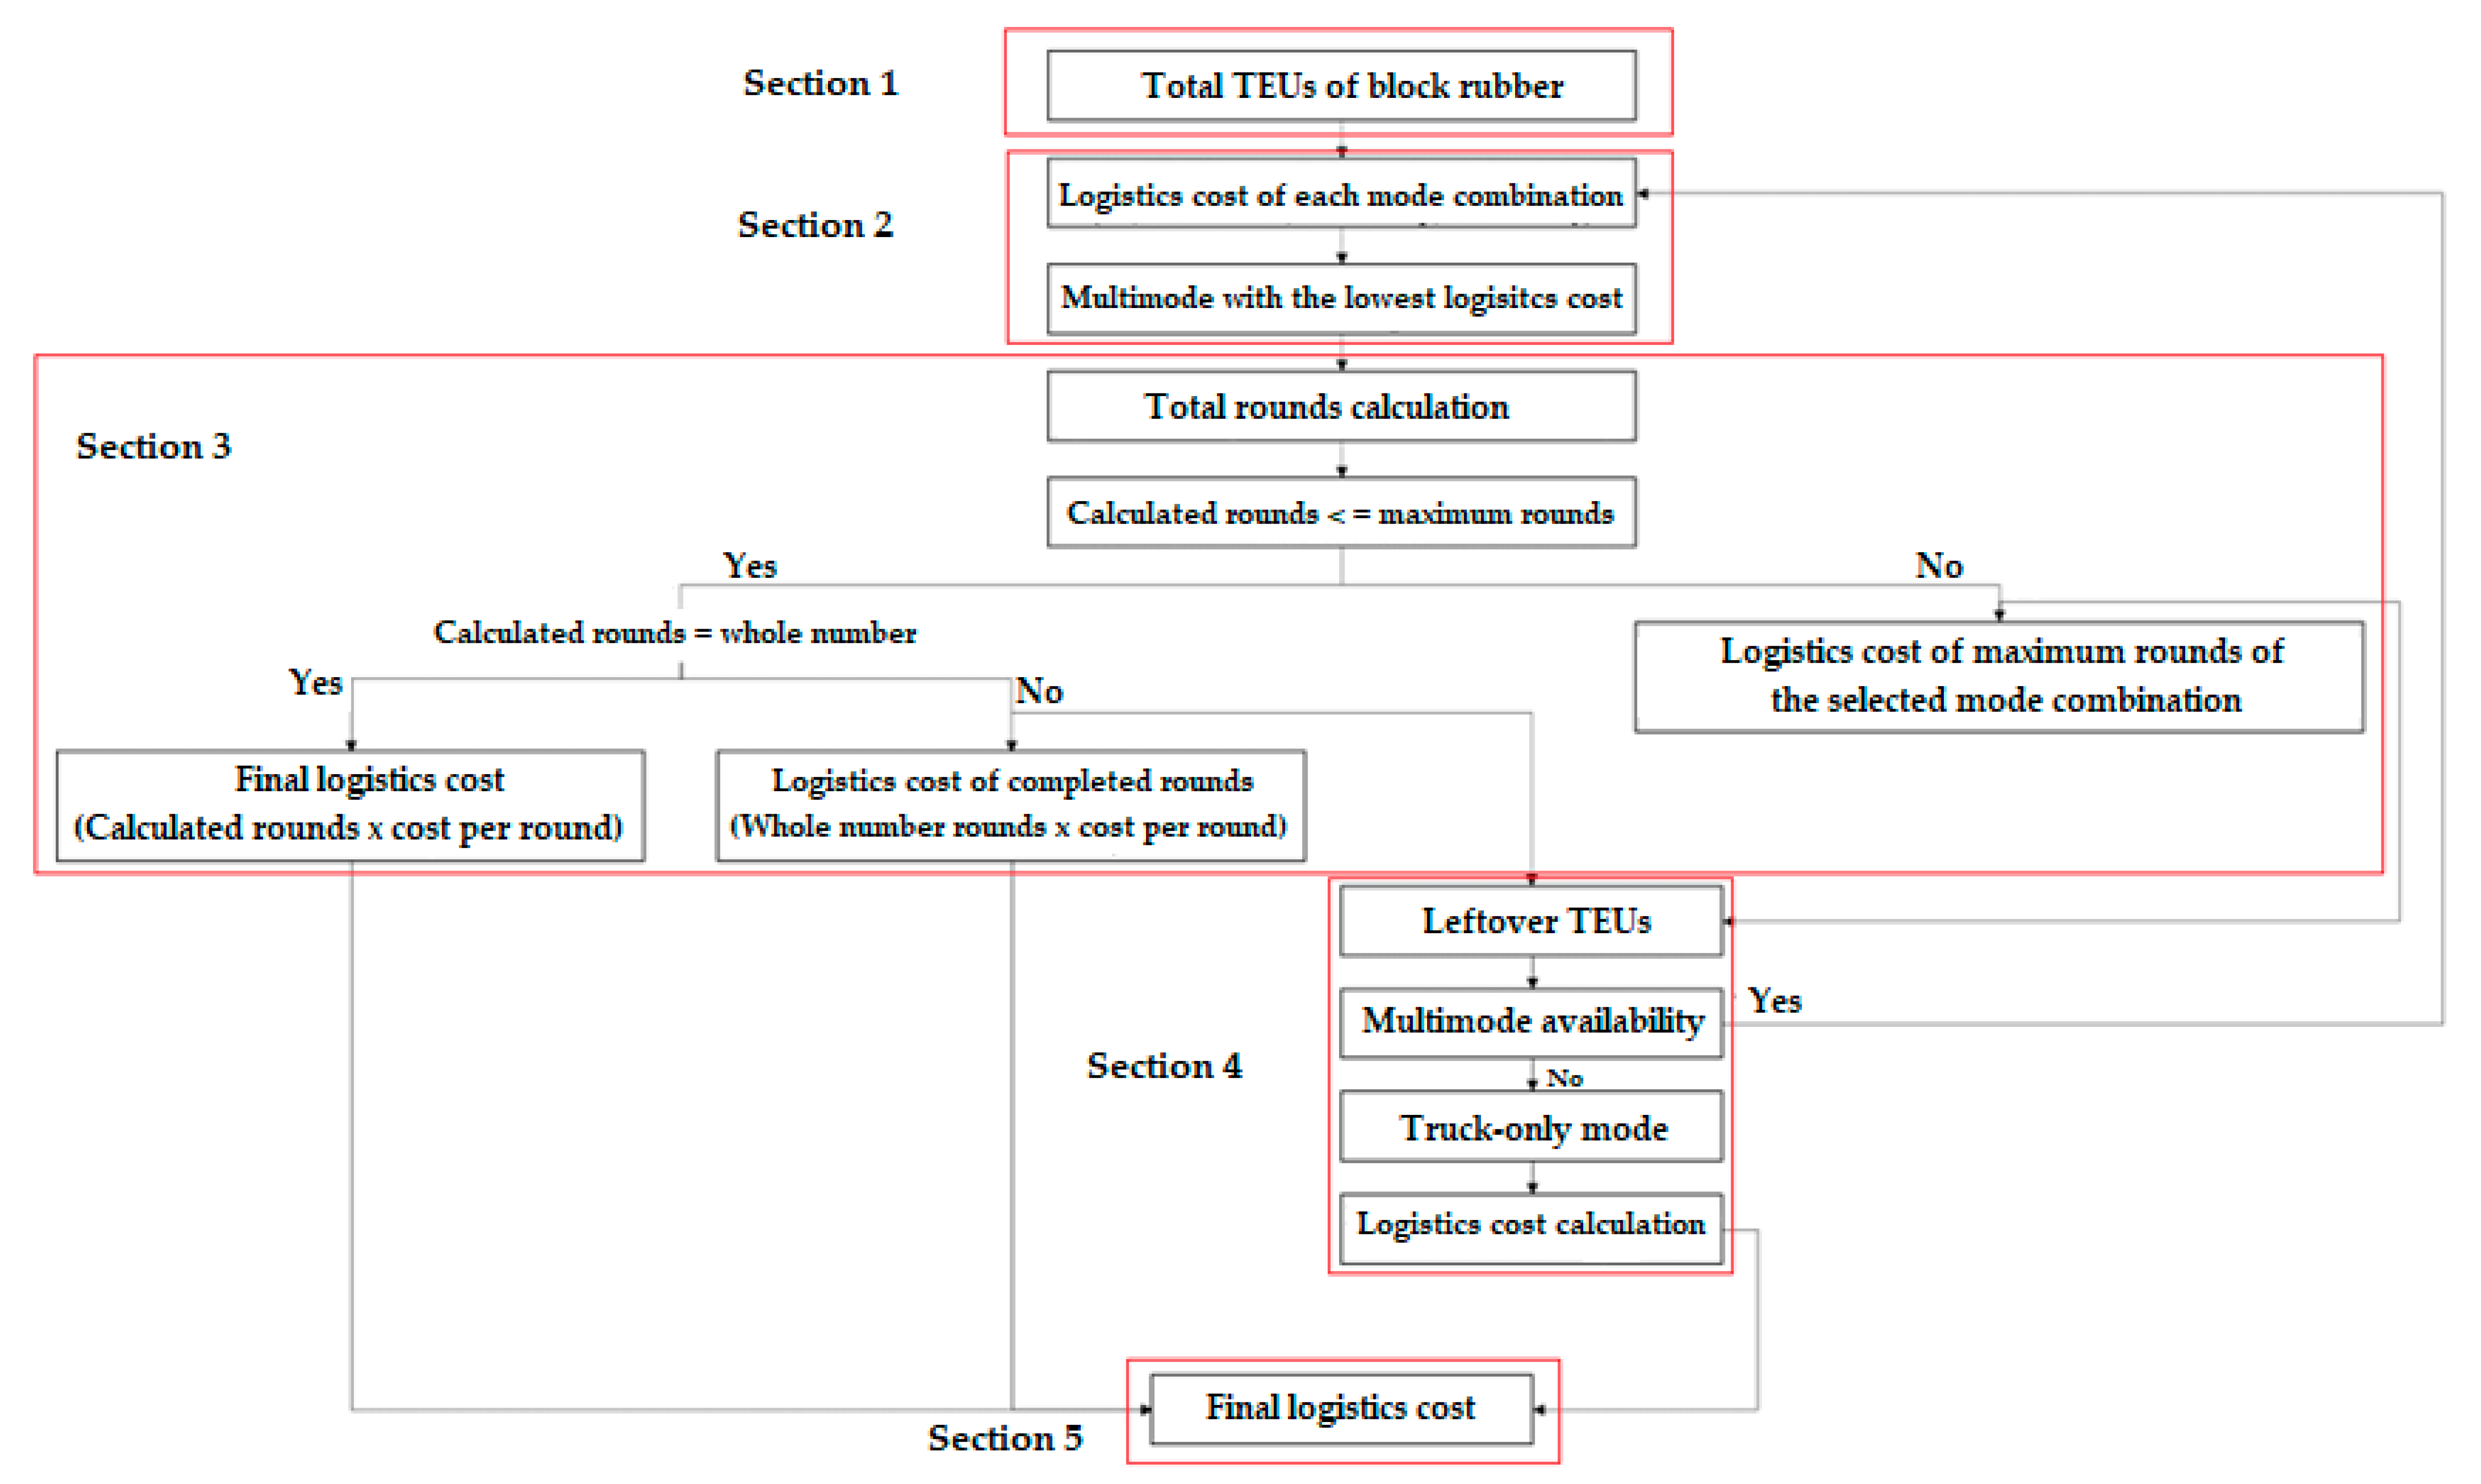
2.4.1. Section 1: Amount of Block Rubber Transportation
2.4.2. Section 2: Multimode Selection
2.4.3. Section 3: Amount of Block Rubber Served by the First Selected Multimode
- TNTEUD = Required TEUs transported by trains per day (TEUs/day)
- TRD = Train operating days (days/year)
- TNRD = Train rounds per day (rounds/day)
- CENTER = TEUs transported by trains per round (TEUs/round)
- AND = Actual train rounds per day (rounds/day)
- MAXTNRD = Maximum train rounds per day (rounds/day)
- LTNRD = Leftover amount of the truck-train mode for the next available mode combinations (rounds/day)
- LTNRDY = Used leftover amount of the truck-train mode for the next available mode combinations (rounds/day)
- LC1TKTN = Logistics costs of the truck-train as the first selected mode (THB/year)
- LC1TKTNY = Used logistics costs of the truck-train as the first selected mode (THB/year)
- SHTEUD = Required TEUs transported by ships per day (TEUs/day)
- SHD = Ship operating days (days/year)
- SHRD = Ship rounds per day (rounds/day)
- SHTEUR = TEUs transported by ships per round (TEUs/round)
- ASHRD = Actual ship rounds per day (rounds/day)
- MAXSHRD = Maximum ship rounds per day (rounds/day)
- LSHRD = Leftover amount of the truck-ship mode for the next available mode combinations (rounds/day)
- LSHRDY = Used leftover amount of the truck-ship mode for the next available mode combinations (rounds/day)
- LC1TKSH = Logistics costs of the truck-ship as the first selected mode (THB/year)
- LC1TKSHY = Used logistics costs of the truck-ship as the first selected mode (THB/year)
- ATKR = Actual truck rounds per year (rounds/year)
- LTKR = Leftover amount of the truck-only mode for the next available mode combinations (rounds/year)
- LTKRY = Used leftover amount of the truck-only mode for the next available mode combinations (rounds/year)
- LC1TK = Logistics costs of the truck-only as the first selected mode (THB/year)
- LC1TKY = Used logistics costs of the truck-only as the first selected mode (THB/year)
- L1BR = Actual leftover amount of the block rubber (rounds/day or rounds/year)
- LC1 = Actual logistics costs of the first selected mode (THB/year)
2.4.4. Section 4: The Next Available Multimode Selection for the Leftover Amount
- TKTNAV = Available capacity of the truck-train mode (rounds/day)
- TKSHAV = Available capacity of the truck-ship mode (rounds/day)
2.4.5. Section 5: Final Logistics Cost
- N = number of mode combinations in the calculation
- FLC = Final logistics costs of the block rubber transportation (THB/year)
- LCS = Final logistics costs of the block rubber transportation in the southern region (THB/year)
- LCNE = Final logistics costs of the block rubber transportation in the northeastern region (THB/year)
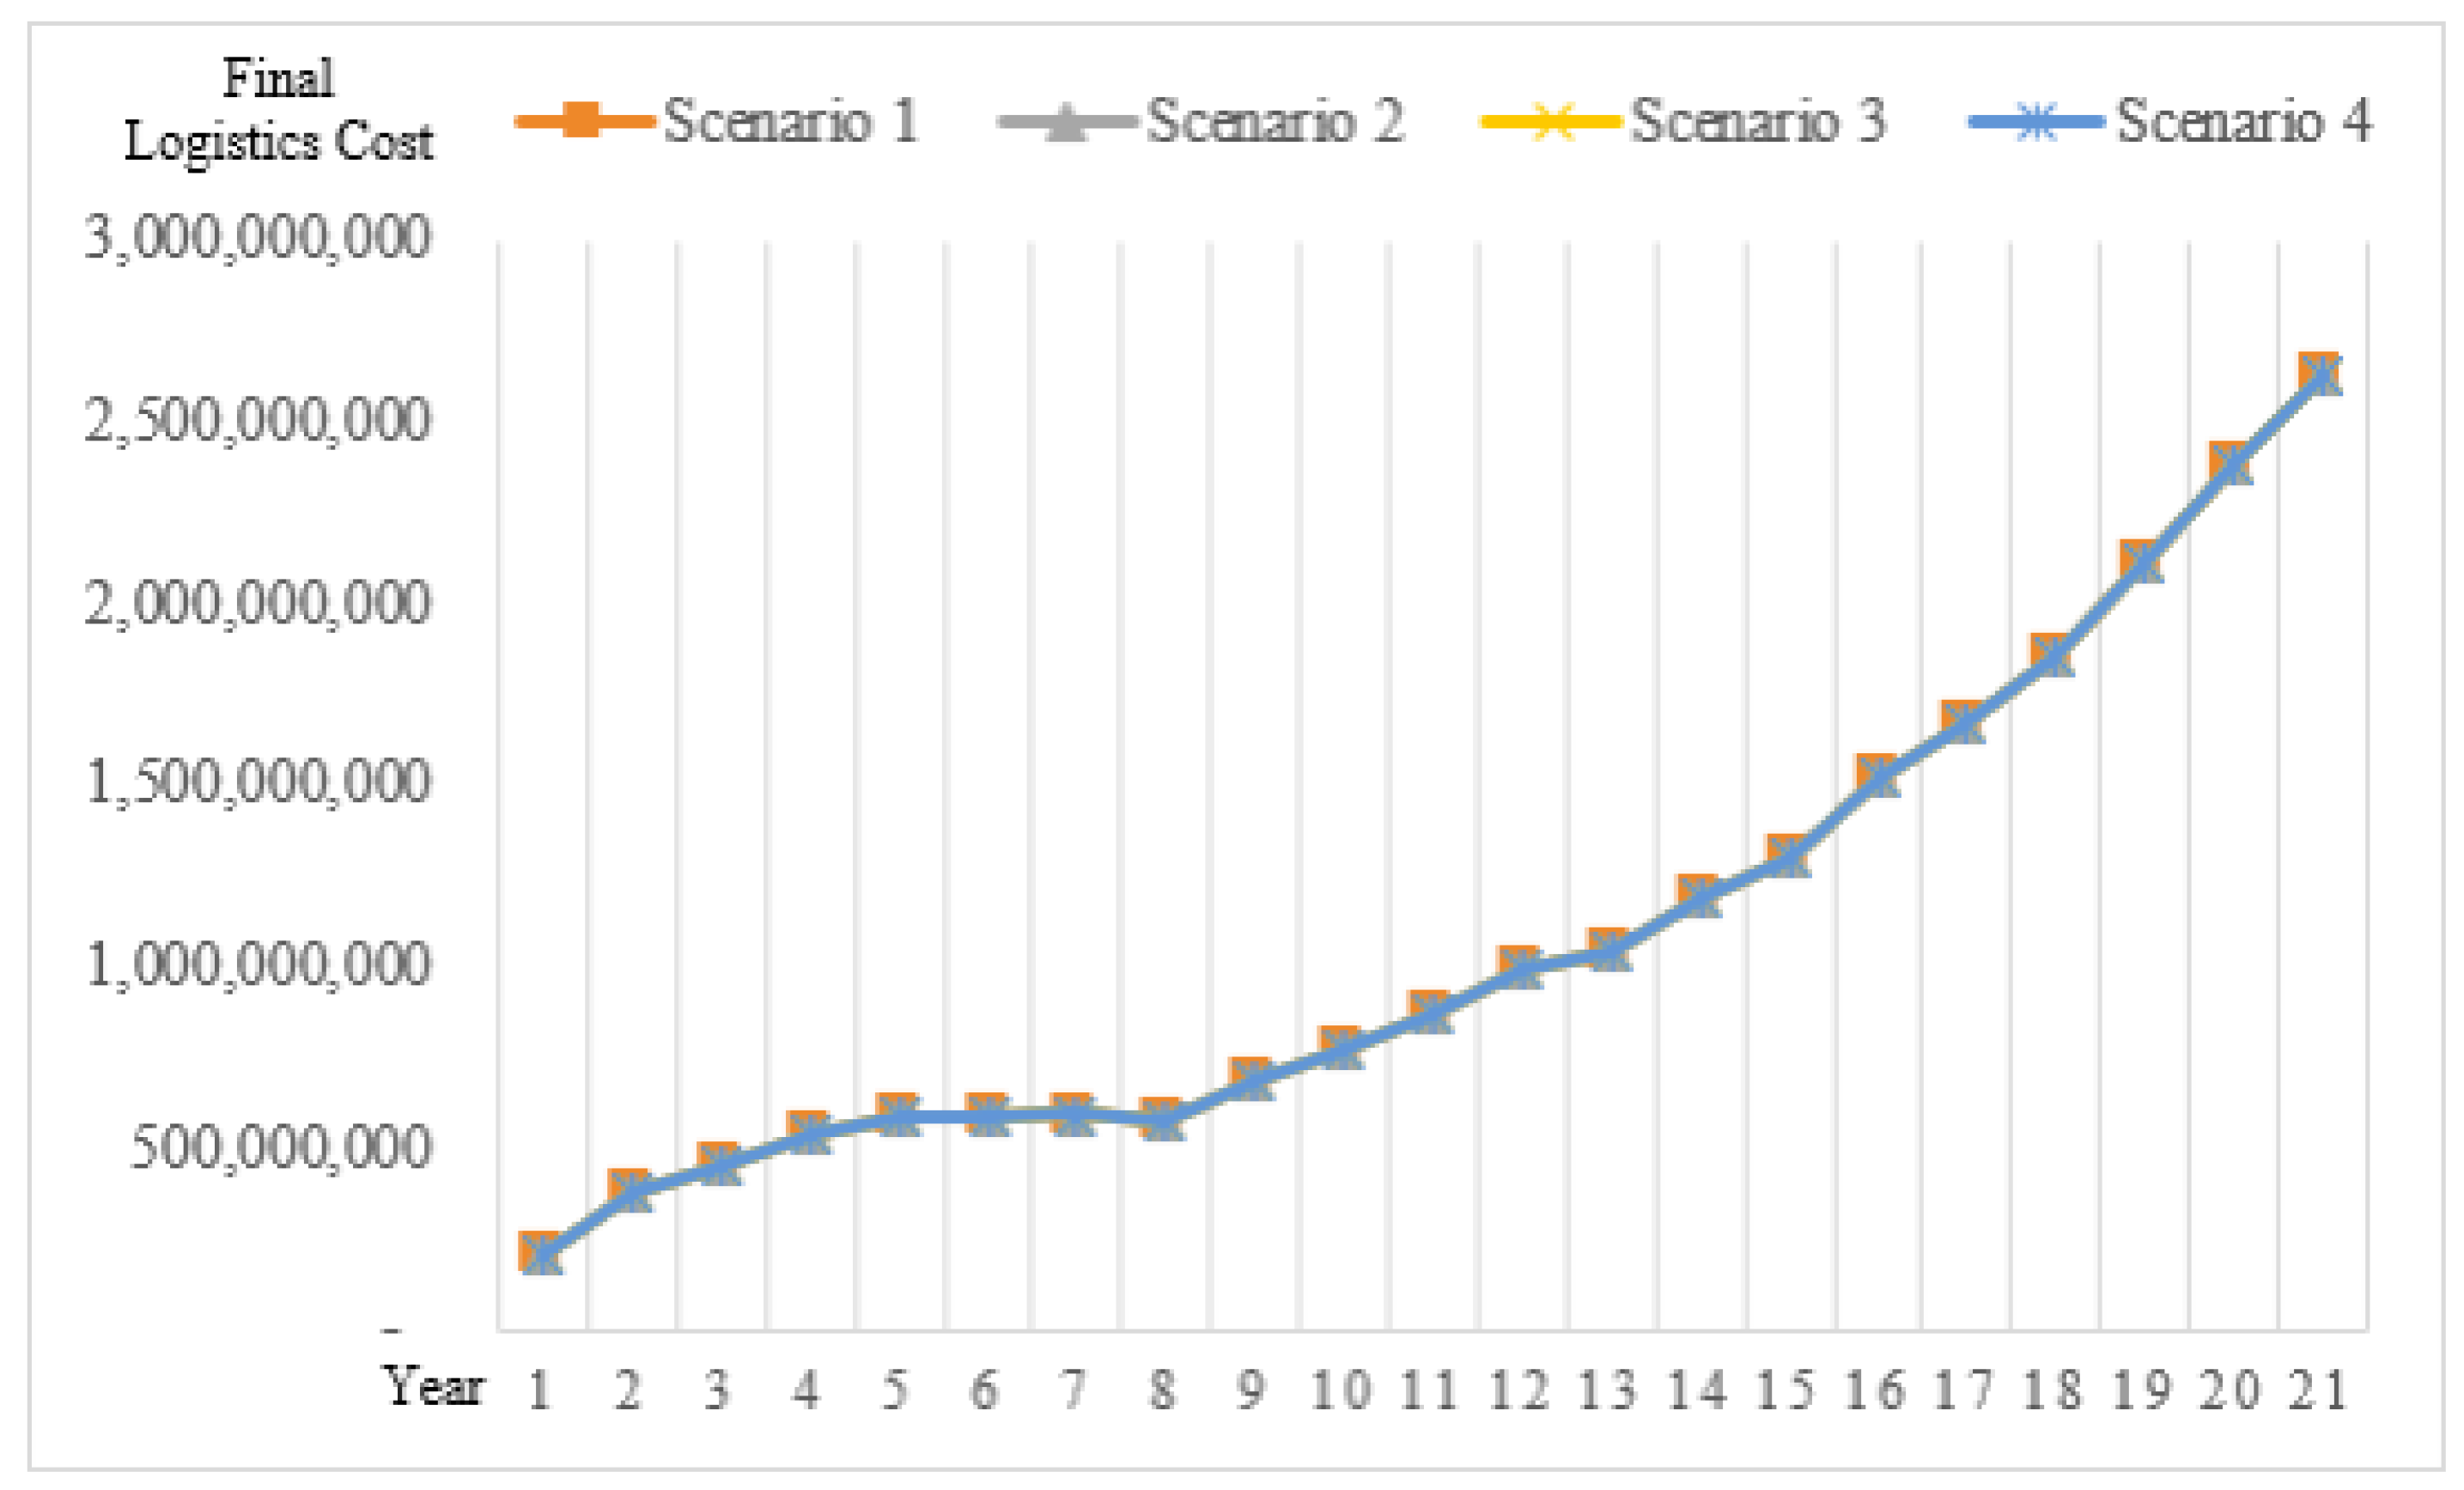
3. Results
3.1. Simulation Results
3.2. SD Model Validation
4. Conclusions
Author Contributions
Funding
Institutional Review Board Statement
Informed Consent Statement
Data Availability Statement
Conflicts of Interest
References
- Thailand Board of Investment. Thailand’s Rubber Industry. Available online: https://www.boi.go.th/index.php?page=business_opportunities_detail&topic_id=117529 (accessed on 4 October 2022).
- Office of Agricultural Economics. Rubber’s Plant Area in Thailand [in Thai]. Available online: https://www.oae.go.th/assets/portals/1/fileups/prcaidata/files/para%20rubber63.pdf (accessed on 4 October 2022).
- Chanchaichujit, J. Green Supply Chain Management Model for the Thai Rubber Industry. Ph.D. Thesis, Curtin University, Perth, Australia, August 2014. [Google Scholar]
- Doner, R.; Abonyi, G. Upgrading Thailand’s rubber industry: Opportunities and challenges. Thammasat Econ. J. 2013, 31, 44–66. [Google Scholar]
- Krungsri Research. 2022–2024 Thailand Industry Outlook. Available online: https://www.krungsri.com/en/research/industry/summary-outlook/outlook-2022-2024 (accessed on 4 October 2022).
- Workman, D. Thailand’s Top 10 Exports. Available online: https://www.worldstopexports.com/thailands-top-10-exports/ (accessed on 10 January 2022).
- The Thai Rubber Association. Thai Rubber Statistics. Available online: http://www.thainr.com/th/?detail=stat-thai (accessed on 10 January 2022).
- Ministry of Transport. Thailand’s Transport Infrastructure Development Strategy 2015–2022. Available online: http://www.thaitransport.org/news/2558.07.01%20proceeding/presentation%20TSTS%2015%20.......02%2004%202015/panel%2001.pdf (accessed on 15 January 2022).
- Chanchaichujit, J.; Saavedra-Rosas, J.F. The elements of the natural rubber industry supply chain. In Using Simulation Tools to Model Renewable Resources; Palgrave Macmillan: Cham, Switzerland, 2017. [Google Scholar] [CrossRef]
- Amornvivat, S.; Homchampa, T.; Kantaumong, I.; Ratanapinyowong, T.; Srisamran, S. Insight Thai Transport Mega-Projects Pave Way for Countless Business Opportunities; SCB Economic Intelligence Center: Bangkok, Thailand, 2022; pp. 1–90. [Google Scholar]
- Hanssen, T.E.S.; Mathisen, T.A. Factors facilitating intermodal transport of perishable goods-transport purchasers viewpoint. Eur. Trans. Res. Rev. 2011, 49, 75–89. [Google Scholar]
- Rantasila, K.; Ojala, L. Measurement of National-Level Logistics Costs and Performance; Discussion Paper No. 2012-4; Turku School of Economics at the University of Turku: Turku, Finland, 2012. [Google Scholar]
- Choi, B.; Chung, K.; Lee, K. The impact of policy measures on promoting the modal shift from road to rail. Pers. Ubiquitous Comput. 2014, 18, 1423–1429. [Google Scholar] [CrossRef]
- Papaioannoua, D.; Martinez, L.M. The role of accessibility and connectivity in mode choice: A structural equation modeling approach. Trans. Res. Procedia 2015, 10, 831–839. [Google Scholar] [CrossRef] [Green Version]
- Jiang, X.; He, X.; Zhang, L.; Qin, H.; Shao, F. Multimodal transportation infrastructure investment and regional economic development: A structural equation modeling empirical analysis in China from 1986 to 2011. Trans. Pol. 2017, 54, 43–52. [Google Scholar] [CrossRef]
- Charoennapharat, T.; Chaopaisarn, P. Factors affecting multimodal transportation during COVID-19: A Thai service provider perspective. Sustainability 2022, 14, 4838. [Google Scholar] [CrossRef]
- Li, M.; Sun, X. Path optimization of low-carbon container multimodal transport under uncertain conditions. Sustainability 2022, 14, 14098. [Google Scholar] [CrossRef]
- Ko, S.; Choi, K.; Yu, S.; Lee, J. A stochastic optimization model for sustainable multimodal transportation for bioenergy production. Sustainability 2022, 14, 1889. [Google Scholar] [CrossRef]
- Kilani, M.; Diop, N.; De Wolf, D. A multimodal transport model to evaluate transport policies in the north of France. Sustainability 2022, 14, 1535. [Google Scholar] [CrossRef]
- PAT. Laem Chabang Phase 3 Market Sounding#1. Port Authority of Thailand. Available online: https://www.eeco.or.th/th/filedownload/1504/49bee2c4c0db25f03defbf3e5f85f15d.pdf (accessed on 4 October 2022).
- Kaew-ngarm, S.; Kao-ian, S.; Suchato, R. Supply Chain of Rubber Transportation in Northeastern Region to People’s Republic of China; Bangkok University Research Conference: Bangkok, Thailand, 2016. [Google Scholar]
- Monga, P. A System Dynamics Model of the Development of New Technologies for Ship Systems; Virginia Polytechnic Institute and State University: Blacksburg, VA, USA, 2001. [Google Scholar]
- Azhaginiyal, A.; Umadevi, G. System dynamics simulation modeling of transport, energy and emissions interactions. Civ. Eng. Archit. 2014, 2, 149–165. [Google Scholar] [CrossRef]
- Nesterova, N.; Anisimov, V. Effective strategies for multimodal transportation network. IOP Conf. Ser. Earth Environ. Sci. 2019, 403, 012204. [Google Scholar] [CrossRef]
- Pongsayaporn, P.; Chinda, T.; Ammarapala, V. Interrelationships among factors influencing multimodal transportation of agricultural products in Thailand: Structural equation modeling approach. Eng. Manag. J. 2021, 1–18. [Google Scholar] [CrossRef]
- Cansiz, O.F.; Unsalan, K. Cost analysis of multimodal freight transportation: A case of Iskenderun. Int. J. Adv. Eng. Res. Sci. 2018, 5, 315–319. [Google Scholar] [CrossRef]
- Kaewkak, K.; Ammarapala, V.; Charoensiriwath, C. Fuzzy AHP approach for route selection in multimodal transportation: The case of coal industry in Thailand. Sci. Technol. Asia 2021, 26, 84–95. [Google Scholar]
- China, T. Feasibility study of multimodal transportation of cassava products in Thailand: System dynamics modeling. ASEAN Eng. J. 2022, 12, 79–88. [Google Scholar] [CrossRef]
- Perez-Lespier, L. Examining the Efficiency of Multimodal Transportation Systems: A Systems Dynamics Approach. Master’s Thesis, Missouri University of Science and Technology, Rolla, MO, USA, 2013. [Google Scholar]
- NESDC. Thailand’s Logistics Report 2019. Office of the National Economic and Social Development Council. Available online: https://www.nesdc.go.th/nesdb_en/download/article/article_20201112144736.pdf (accessed on 4 October 2022).
- Ministry of Transport. 4-Year Performance. Available online: https://complain.mot.go.th/prproject/files_upload/publishonweb/4years-performance-mot.pdf (accessed on 25 September 2022).
- Merk, O. Container Ship Size and Port Relocation. Discussion Paper, International Transport Forum. Available online: https://www.itf-oecd.org/sites/default/files/docs/container-ship-size-and-port-relocation.pdf (accessed on 25 September 2022).
- BOT. Foreign Exchange Rates. Bank of Thailand. Available online: https://www.bot.or.th/english/_layouts/application/exchangerate/exchangerate.aspx (accessed on 29 September 2022).
- Strategic Transformation Office. The National Strategy: The Future of Thailand. Available online: https://sto.go.th/en/about/policy/20-year-strategic-plan (accessed on 25 September 2022).
- Chen, X.; Liu, Z. The choice of multimodal transport mode of agricultural by-product logistics in land-sea new corridor in western China based on big data. Wirel. Commu. Mobile Comput. 2021, 2021, 1880689. [Google Scholar] [CrossRef]
- Hanssen, T.E.S.; Mathisen, T.A.; Jørgensen, F. Generalized transport costs in intermodal freight transport. Procedia Soc. Behav. Sci. 2012, 54, 189–200. [Google Scholar] [CrossRef] [Green Version]
- Boonsuya, S. Songkhla Port Development to Increase Export Efficiency [in Thai]. Master’s Thesis, University of the Thai Chamber of Commerce, Bangkok, Thailand, 2010. [Google Scholar]
- Ambrosino, D.; Sciomachen, A. Impact of externalities on the design and management of multimodal logistics network. Sustainability 2021, 13, 5080. [Google Scholar] [CrossRef]
- Timaboot, W.; Suthikarnnarunai, N. Designing the Multimodal Network in An Agriculture Supply in Thailand. 2016. Available online: https://eng.utcc.ac.th/upload/staffs/publication/nanthi_sut/320_1516939236_65443017.pdf (accessed on 13 June 2022).
- Forrester, J.W.; Senge, P.M. Tests for building confidence in system dynamic models. TIMS Studies Manag. Sci. 1980, 14, 209–228. [Google Scholar]
- Mohapatra, H. Socio-technical challenges in the implementation of smart city. In Proceedings of the 2021 International Conference on Innovation and Intelligence for Informatics, Computing, and Technologies (3ICT), Zallaq, Bahrain, 29–30 September 2021; pp. 57–62. [Google Scholar] [CrossRef]
- Mohapatra., H.; Rath, A.K. An IoT based efficient multi-objective real-time smart parking system. Int. J. Sens. Netw. 2021, 37, 219–232. [Google Scholar] [CrossRef]


| Input | Data | Value | Reference |
|---|---|---|---|
| Circumstance | Rubber production capacity (RP) |
| [2,5,20,30,31] |
| Block rubber export amount |
| ||
| China’s block rubber requirements (BREX) |
| ||
| The ratio of the southern exported block rubber to the northeastern exported block rubber |
| ||
| Laem Chabang port capacity (MAXLCB) |
| ||
| CY capacity |
| ||
| Train capacity |
| ||
| Ship capacity |
| ||
| Fuel price |
| ||
| Scenario | Increase amount of the rubber production capacity |
| [2,20,30] |
| An increasing rate of the block rubber export amount |
| ||
| An increasing rate of China’s block rubber requirements (INCH) |
| ||
| Increased fuel price |
| ||
| Policy | Expansion of Laem Chabang port |
| [20,31] |
| Expansion of the double-track rail |
| ||
| Interrelationship | The incentive of multimodal transportation |
| [25] |
| Road accident |
|
| Year | The 1st Selected Mode | The 2nd Selected Mode | The 3rd Selected Mode | Final Logistics Cost (THB) |
|---|---|---|---|---|
| 0 | Truck-ship | Truck-train | − | 111,981,279 |
| 1 | Truck-ship | Truck-only | − | 269,308,150 |
| 2 | Truck-ship | Truck-only | − | 318,568,473 |
| 3 | Truck-ship | Truck-only | − | 376,305,762 |
| 4 | Truck-ship | Truck-train | − | 419,922,995 |
| 5 | Truck-ship | Truck-train | − | 415,557,863 |
| 6 | Truck-ship | Truck-train | − | 400,300,404 |
| 7 | Truck-ship | Truck-train | − | 363,013,449 |
| 8 | Truck-ship | Truck-only | − | 458,202,668 |
| 9 | Truck-train | − | − | 507,552,810 |
| 10 | Truck-train | Truck-only | − | 576,485,736 |
| 11 | Truck-train | − | − | 658,136,015 |
| 12 | Truck-train | Truck-only | − | 703,263,601 |
| 13 | Truck-train | − | − | 821,844,417 |
| 14 | Truck-train | Truck-only | − | 887,024,652 |
| 15 | Truck-train | Truck-only | − | 1,049,905,035 |
| 16 | Truck-train | Truck-ship | − | 1,137,093,207 |
| 17 | Truck-train | Truck-ship | Truck-only | 1,298,910,958 |
| 18 | Truck-train | Truck-ship | − | 1,470,991,992 |
| 19 | Truck-train | Truck-ship | Truck-only | 1,654,426,445 |
| 20 | Truck-train | Truck-ship | − | 1,844,678,821 |
| Year | The 1st Selected Mode | The 2nd Selected Mode | Final Logistics Cost (THB) |
|---|---|---|---|
| 0 | Truck-train | Truck-only | 90,166,020 |
| 1 | Truck-train | Truck-only | 111,962,994 |
| 2 | Truck-train | Truck-only | 133,471,835 |
| 3 | Truck-train | Truck-only | 164,073,632 |
| 4 | Truck-train | Truck-only | 170,516,942 |
| 5 | Truck-train | Truck-only | 174,676,648 |
| 6 | Truck-train | Truck-only | 193,656,342 |
| 7 | Truck-train | Truck-only | 211,198,070 |
| 8 | Truck-train | Truck-only | 231,915,236 |
| 9 | Truck-train | Truck-only | 264,072,238 |
| 10 | Truck-train | Truck-only | 299,364,265 |
| 11 | Truck-train | Truck-only | 333,224,344 |
| 12 | Truck-train | Truck-only | 337,718,526 |
| 13 | Truck-train | Truck-only | 363,111,446 |
| 14 | Truck-train | Truck-only | 416,731,291 |
| 15 | Truck-train | Truck-only | 475,448,931 |
| 16 | Truck-train | Truck-only | 538,004,973 |
| 17 | Truck-train | Truck-only | 557,449,524 |
| 18 | Truck-train | Truck-only | 637,907,450 |
| 19 | Truck-train | Truck-only | 725,964,817 |
| 20 | Truck-train | Truck-only | 779,815,578 |
| Year | Final Logistics Costs of Multimodal Transportation (THB) | Final Logistics Costs of the Traditional (Truck-Only) Mode (THB) | Cost-Saving (%) |
|---|---|---|---|
| 0 | 202,147,299 | 426,802,400 | 111 |
| 1 | 381,271,144 | 512,693,561 | 34 |
| 2 | 452,040,308 | 598,433,169 | 32 |
| 3 | 540,379,394 | 690,965,182 | 28 |
| 4 | 590,439,937 | 778,512,000 | 32 |
| 5 | 590,234,511 | 855,481,200 | 45 |
| 6 | 593,956,746 | 940,035,600 | 58 |
| 7 | 574,211,519 | 1,032,998,400 | 80 |
| 8 | 690,117,904 | 1,135,094,800 | 64 |
| 9 | 771,625,048 | 1,247,324,400 | 62 |
| 10 | 875,850,001 | 1,370,608,400 | 56 |
| 11 | 991,360,359 | 1,506,122,800 | 52 |
| 12 | 1,040,982,127 | 1,655,024,000 | 59 |
| 13 | 1,184,955,863 | 1,818,605,600 | 53 |
| 14 | 1,303,755,943 | 1,998,396,400 | 53 |
| 15 | 1,525,353,966 | 2,195,964,400 | 44 |
| 16 | 1,675,098,180 | 2,413,034,400 | 44 |
| 17 | 1,856,360,482 | 2,651,586,000 | 43 |
| 18 | 2,108,899,442 | 2,913,736,000 | 38 |
| 19 | 2,380,391,262 | 3,201,758,000 | 35 |
| 20 | 2,624,494,399 | 3,518,278,400 | 34 |
Publisher’s Note: MDPI stays neutral with regard to jurisdictional claims in published maps and institutional affiliations. |
© 2022 by the authors. Licensee MDPI, Basel, Switzerland. This article is an open access article distributed under the terms and conditions of the Creative Commons Attribution (CC BY) license (https://creativecommons.org/licenses/by/4.0/).
Share and Cite
Pongsayaporn, P.; Chinda, T. Long-Term Strategies for Multimodal Transportation of Block Rubber in Thailand. Sustainability 2022, 14, 15350. https://doi.org/10.3390/su142215350
Pongsayaporn P, Chinda T. Long-Term Strategies for Multimodal Transportation of Block Rubber in Thailand. Sustainability. 2022; 14(22):15350. https://doi.org/10.3390/su142215350
Chicago/Turabian StylePongsayaporn, Pimnapa, and Thanwadee Chinda. 2022. "Long-Term Strategies for Multimodal Transportation of Block Rubber in Thailand" Sustainability 14, no. 22: 15350. https://doi.org/10.3390/su142215350
APA StylePongsayaporn, P., & Chinda, T. (2022). Long-Term Strategies for Multimodal Transportation of Block Rubber in Thailand. Sustainability, 14(22), 15350. https://doi.org/10.3390/su142215350


