Article

Long-Term Strategies for Multimodal Transportation of Block Rubber in Thailand

by
Pimnapa Pongsayaporn
and
Thanwadee Chinda
*
Sirindhorn International Institute of Technology, Thammasat University, Muang 12000, Pathum Thani, Thailand
*
Author to whom correspondence should be addressed.
Sustainability 2022, 14(22), 15350; https://doi.org/10.3390/su142215350
Submission received: 4 October 2022 / Revised: 7 November 2022 / Accepted: 16 November 2022 / Published: 18 November 2022
(This article belongs to the Section Sustainable Transportation)

Abstract

:
Thailand is one of the world’s leading exporters of block rubbers, mainly used in the automobile industry. The country strives to produce a better quality of block rubber and deliver the products to the industry, at competitive prices, to maintain its competitiveness and move ahead with sustainable growth. The government promotes a multimodal transportation to reduce logistics costs and increase the transportation network efficiency. This study develops a system dynamics (SD) model of the multimodal transportation of block rubber transportation in Thailand, to examine the different mode combinations of block rubber transportation in the long term. The results confirm using multimodal transportation (i.e., truck-ship and truck-train modes) to minimize the final logistics cost of the block rubber transportation from the growing areas to the export point, in the long term. Multimodal transportation can save up to half the final logistics costs, compared to the truck-only mode. The truck-ship and truck-train mode combinations are preferred in the southern and northeastern regions, respectively, as they provide the lowest logistics costs, in the long term. With government supports in port expansion, double-track enlargement, and access roads to ports and railway stations, multimodal transportation is expected to reduce the final logistics cost by half each year. All of these raise the country’s competitiveness on a global scale and achieve a sustainable growth and development of block rubber products in the long term. The developed SD model provides a guideline for the multimode selection of block rubber and other agricultural products with bulk transportation, to achieve the lowest logistics cost and enhance the transport efficiency, in the long term.

1. Introduction

Thailand is the world’s largest natural rubber producer, representing 33.4% of the global production, because of its geographical advantages, tropical climate, soil fertility, and effective cultivation methods [1]. Southern and northeastern regions are two significant locations of rubber plantations with a total of 36 billion square meters and a total production of five million tonnes per year [2]. Rubber can be harvested as fresh latex, using tree tapping. The fresh latex is then processed into primary rubbers, including field latex, unsmoked sheets, and cup lumps [3]. These primary rubbers are considered an upstream industry (see Figure 1). They are consequently processed into semi-finished products or natural rubbers, considered a midstream industry [4]. The three main types of natural rubbers include concentrated latex, ripped-smoked sheets, and block rubber. They are used as raw materials in various rubber products in the downstream industry [4]. Concentrated latex, for example, is used for dipped products, such as surgical gloves, condoms, elastic thread, and adhesives. Moreover, a ripped-smoked sheet is used in shoe sole and automobile parts production. Block rubber is mainly used in automobile tire production [3]. Figure 1 shows that, due to the limited rubber manufacturing investment, most Thai natural rubber is exported as semi-finished products (concentrated latex, ripped-smoked sheets, and block rubber) [5]. The export amount covers almost 80% of total production, accounting for 70.3% of the gross domestic product in the country [6].
Major partners of Thai natural rubber include China, Malaysia, Japan, the USA, and South Korea, respectively [7]. China, especially, has a high trend of natural rubber requirement to be used in its automotive industry, that has been developing and growing steadily in the past decades [3,4,5]. While the global automotive industry grew at an annual rate of 2.4% from 2006 to 2018, China experienced an average growth of 11.2% per year [5]. As block rubber is mainly used in tire production in the automotive industry, it is expected that the export amount of block rubber will grow by an additional 4% in 2021 [5].
The Thai government initiates several supporting strategies from the upstream to downstream, to achieve a sustainable block rubber production and export. Such programs include new planting areas, yield enhancement, effective production, and block rubber transportation. A significant focus is given to developing the transportation infrastructure, as it helps reduce the logistics costs and compete in the world market. The government proposes “Thailand’s Transport Infrastructure Development Strategy 2015–2022” to develop an efficient transportation network and serve as a regional hub of transportation [8]. One of the strategies is the promotion of multimodal transportation through various projects, such as the double-track railway project and the development of ports, to improve the transportation network and support the increasing amount of export products [8].
Thailand’s block rubber supply chain consists of four main contributors: rubber farmers, intermediaries and cooperatives, rubber production companies, and inland logistics for domestic stock, domestic consumption, and export [3]. Most Thai block rubber is exported through the Laem Chabang port, located in the eastern region of Thailand. Transportation from the rubber farmer to the middleman and cooperative, as well as from the middleman and cooperative to the block rubber production company, is mainly undertaken by road because the travel distance is relatively short, at the provincial level [9]. Inland transportation from the block rubber production company to Laem Chabang port can be transported using different transportation modes, including road, rail, and water [9]. However, most of the block rubber transportation from the block rubber production company to Laem Chabang port is currently transported by truck because of the convenience and the extensive network of roads [10]. Road transportation from the block rubber production company to Laem Chabang port contributes to high logistics costs, due to long distances, high fuel costs, and limited truck capacity. In general, block rubber has low selling prices per unit and low values, so their most effective transportation modes should be a combination of road, rail, and water transportation, to gain the benefits of heavy bulk shipment and reduced logistics costs. It is, therefore, expected that the use of multimodal transportation enhances the transport efficiency and reduces the overall logistics costs.
Several studies have examined key factors influencing the multimodal transportation usage and logistics-related costs. For example, Hanssen and Mathisen [11] mentioned that pollution, accident rates, and congestion on the road network raise concerns about the modal shift from road to rail and water modes. Rantasila and Ojala [12] stated that the use of multimodal transportation helps encourage sales and increase trade and the company’s competitiveness. Choi et al. [13] examined the impacts of policy measures on modal shifts in South Korea. They concluded that road pricing and multimodal transportation services could encourage strategic planning and operation, which positively affects the transportation infrastructure development policies, and eventually results in multimodal transportation development. Papaioannou and Martinez [14] commented that a good accessibility and connectivity are the most important criteria when considering mode choices, as they affect travel time. Jiang et al. [15] examined the relationships between multimodal transportation investment and economic development. They indicated that investment in transportation infrastructure influences economic development by promoting connectivity and encouraging travel demand. Charoennapharat and Chaopaisarn [16] mentioned that the costs related to multimodal transportation, include the seasonal fluctuation of tariffs, operating, transportation, maintenance, insurance, tariff, labor, storage, communication, and load and unload costs, empty vehicle return rates, and the condition of the road surface. Li and Sun [17] stated that multimodal transportation significantly impacted China’s transportation industry. Multimodal carriers may reduce transportation costs and carbon emissions and improve the transportation efficiency by comprehensively weighing the randomness of the carbon trading prices, the non-determinism of demand, and the relationship between the selection of the maximum regret values and transportation costs. Ko et al. [18] suggested a multi-objective stochastic model for a sustainable biomass transportation, to identify the impacts of the model selection on various transportation modes. Kilani et al. [19] developed an agent-based model of multimodal transportation to examine the impacts of the policies focusing on the limitations of polluting gas emissions and congestion in the North of France.
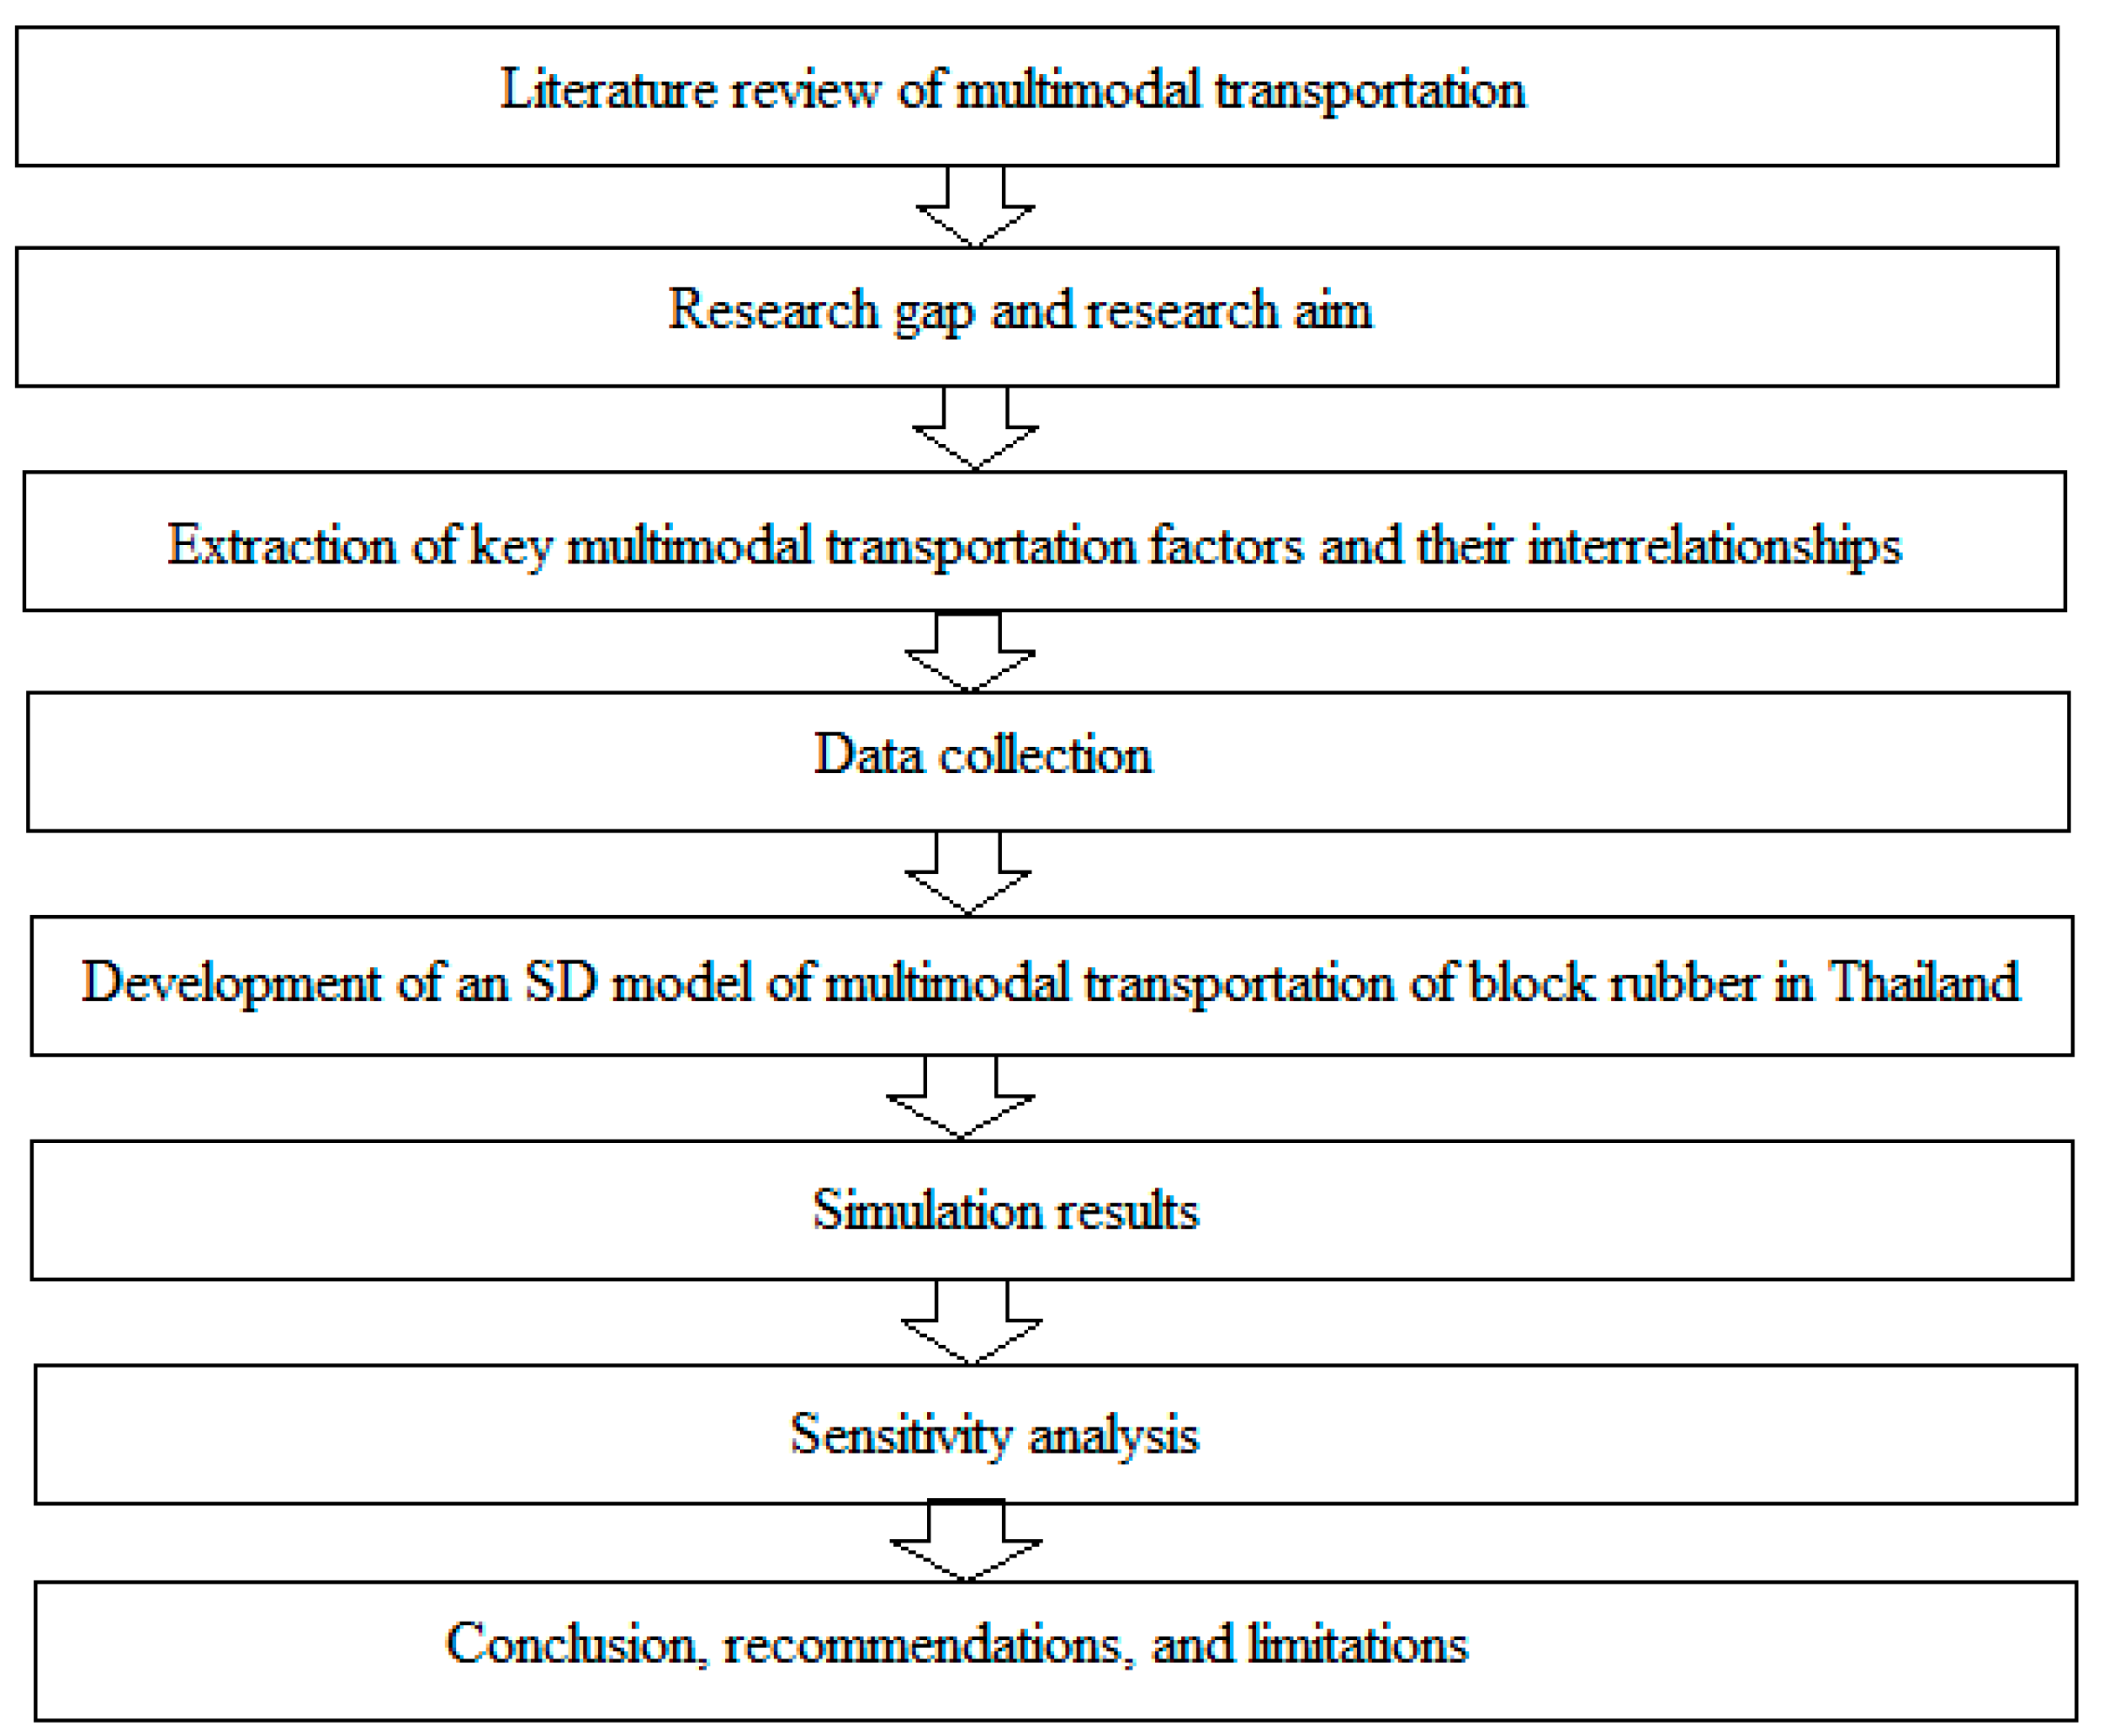
The above literature provides insights into multimodal transportation. However, the relationships among the critical multimodal transportation factors and their effects on multimodal transportation decisions are rarely explored. The causal relationships among crucial multimodal transportation factors are complex and influence each other, creating dynamic relationships that change over time and may have a long-term effect on the logistics cost. For example, a change in the production capacity may affect the export amount and the load capacity of the selected transport modes. These may, in turn, increase or decrease the overall logistics costs. An increase in fuel price, tariff costs, and storage costs may affect the decision of the modes used in transportation and may result in higher logistics costs. Therefore, this study aims to develop a system dynamics (SD) model utilizing a SD modeling approach to examine the complex and dynamic relationships among the key multimodal transportation factors, and suggest the best mode combinations of block rubber transportation, to minimize the overall logistics costs, in the long term. The study results are expected to provide a guideline for the multimodal transportation selection to achieve the highest transportation efficiency and minimize logistics costs, in the long term. The research steps of this study are shown in Figure 2. The literature on block rubber and multimodal transportation are reviewed, to define this study’s research gaps and aims. Key multimodal transportation factors are extracted for the data collection and model development. The SD model of the multimodal transportation of block rubber is then developed and simulated, to examine the best mode combinations for transportation, to achieve the lowest logistics cost, in the long term. The developed SD model is validated through a sensitivity analysis because it is recommended to be used in real practice.

2. Materials and Methods

2.1. Multimodal Transportation of Block Rubber in Thailand

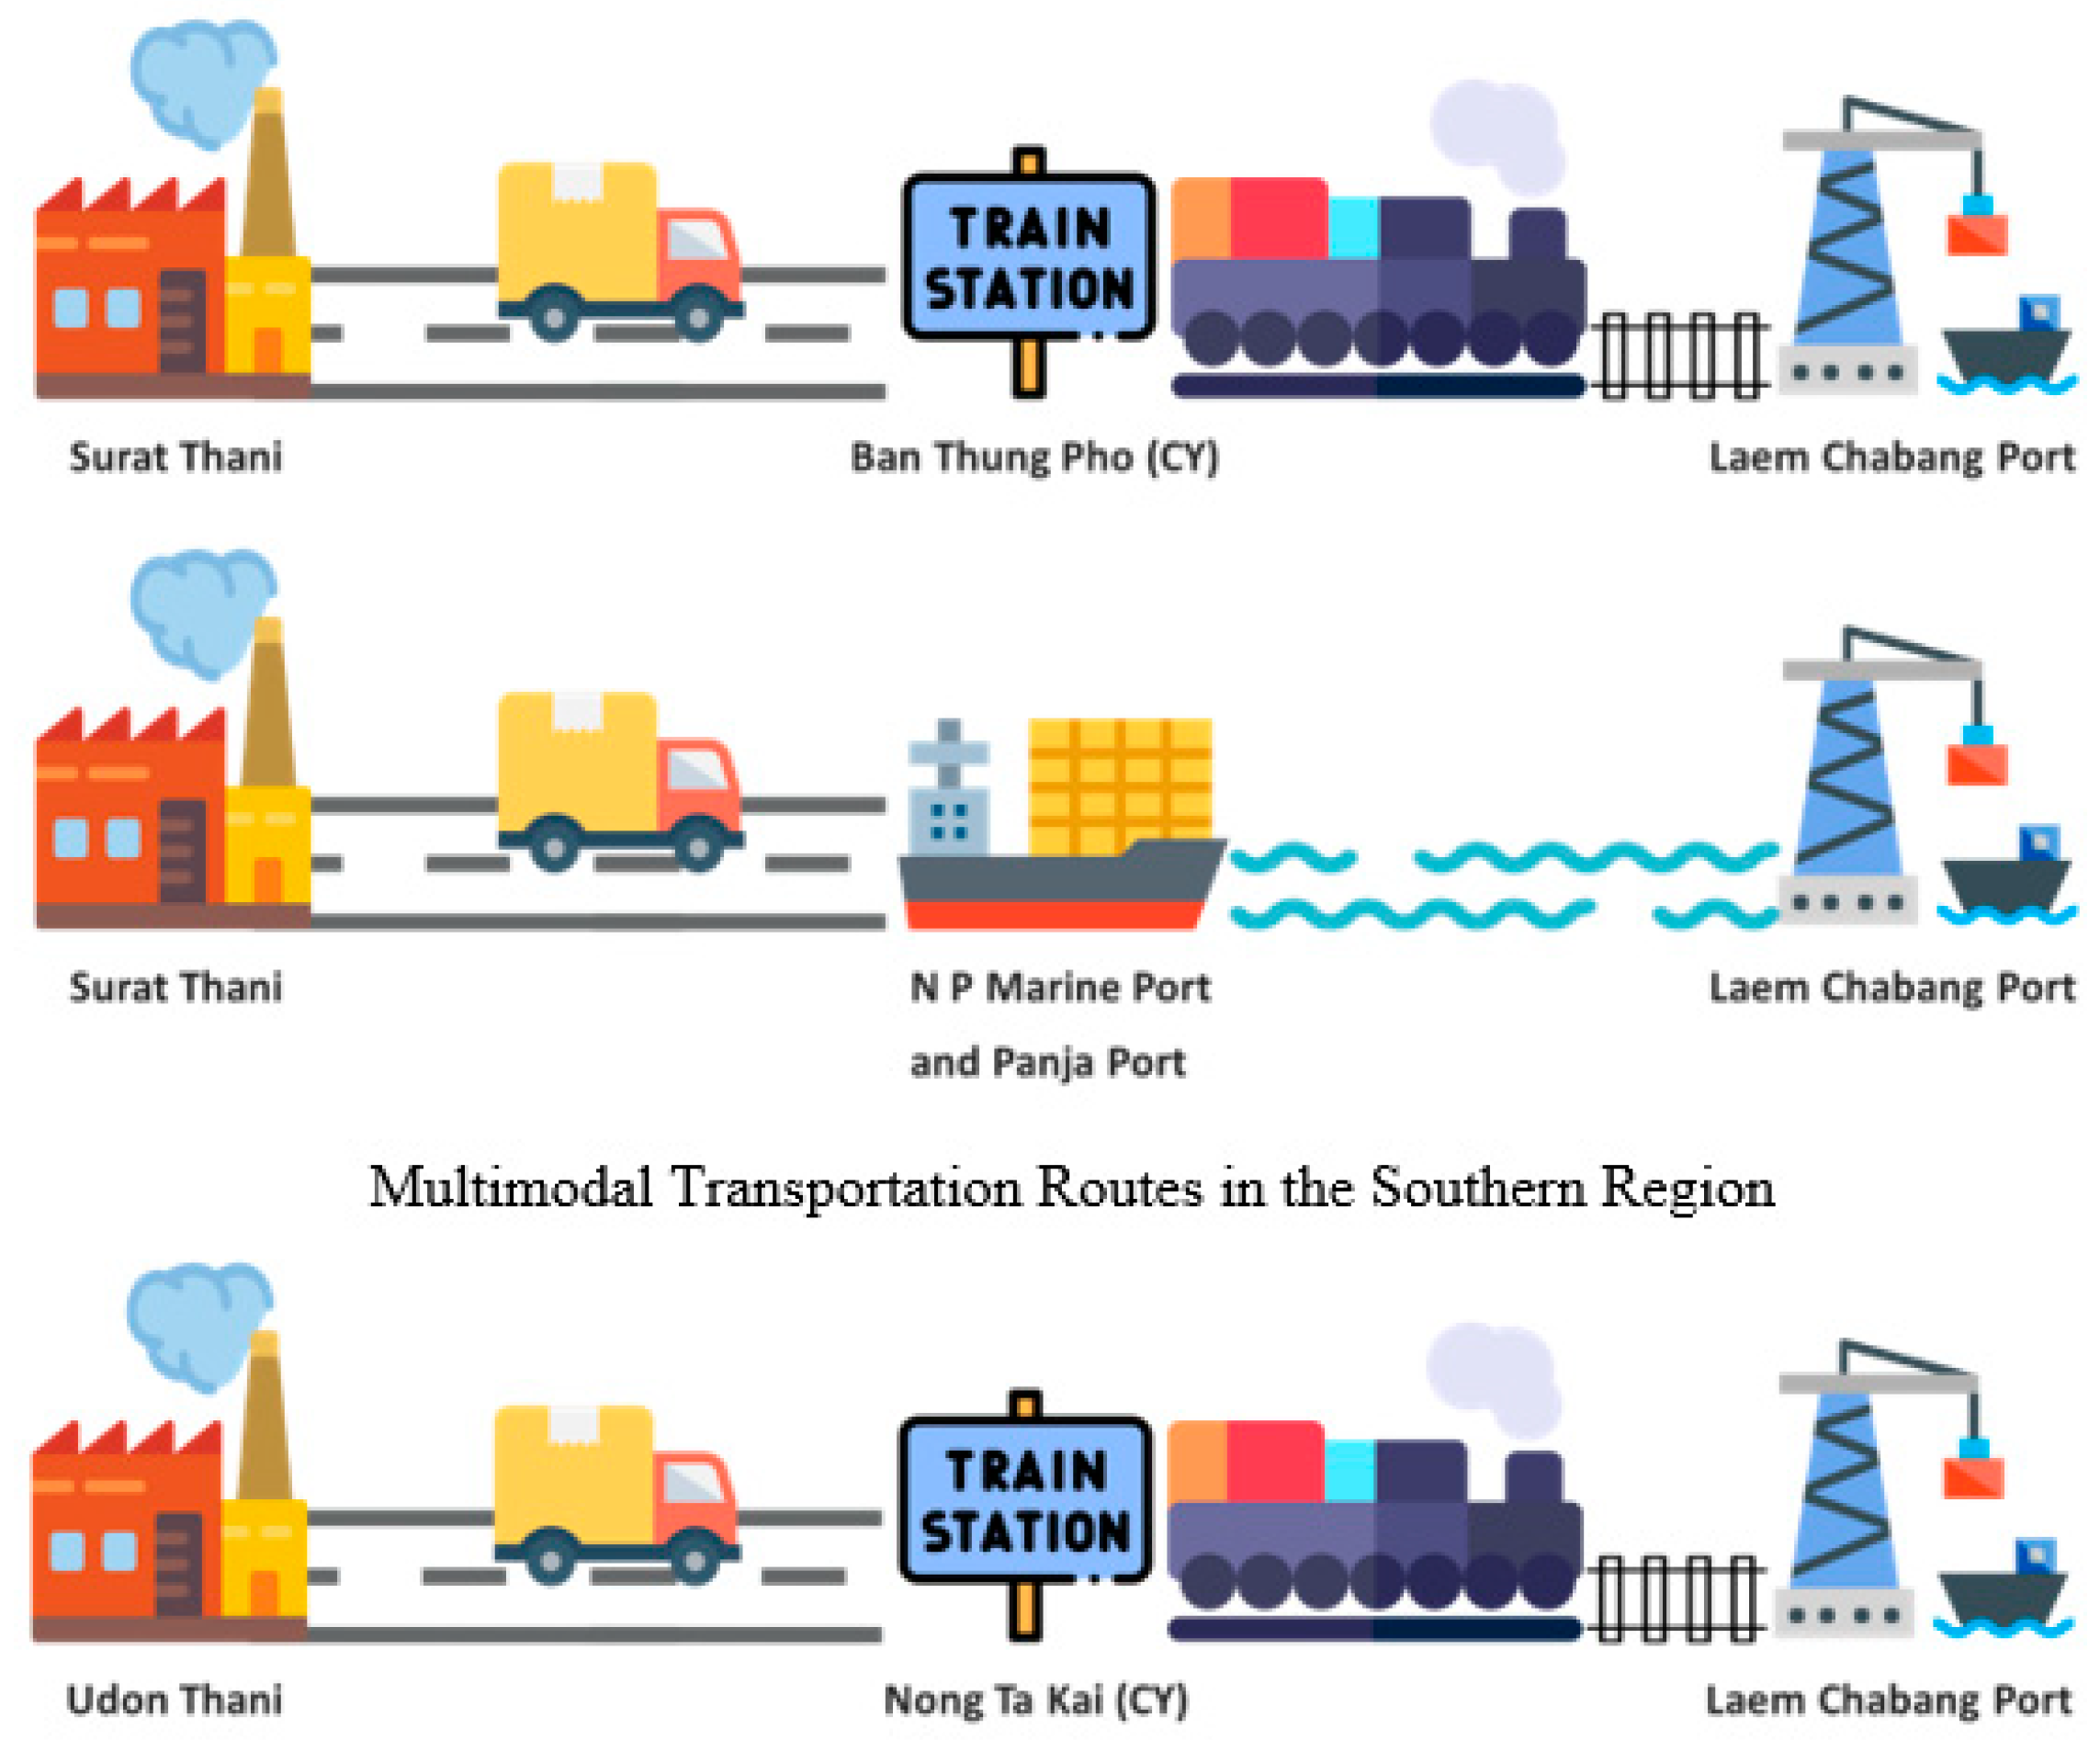
Block rubber is transported via two major routes: the southern and northeastern regions to Laem Chabang port (located in the eastern region of Thailand). Block rubber transportation from the southern region can be exported using three different mode combinations [20] (see Figure 3).
  • Truck-train mode combination: block rubber is transported by trucks from the rubber production companies in Surat Thani province to Ban Thung Pho Junction Railway Station (located in Surat Thani province). Then, the block rubber is transferred onto trains and transported to Laem Chabang port.
  • Truck-ship mode combination: block rubber is transported by trucks from the rubber production companies in Surat Thani province to NP Marine and Panja ports in Surat Thani province. Then, the block rubber is transferred onto ships and transported to Laem Chabang port.
  • Truck-only mode: block rubber is transported by trucks from the rubber production companies in Surat Thani province to Laem Chabang port.
Block rubber transported from the northeastern region is mainly from Udon Thani province, using two-mode combinations [21].
  • Truck-train mode combination: block rubber is transported by trucks from the rubber production companies in Udon Thani province to Nong Takai Railway Station in Udon Thani province. Then, the block rubber is transferred onto trains and transported to Laem Chabang port.
  • Truck-only mode: block rubber is transported by trucks from the rubber production companies in Udon Thani province to Laem Chabang port.

2.2. System Dynamics Modeling Approach

The system dynamics (SD) modeling method is a policy modeling, based on the foundations of decision-making, feedback mechanisms, and simulations. Decision-making focuses on how actions are to be executed by the decision-makers. Feedback deals with the way information affects the decision-making currently and in the future. Simulations provide decision-makers with a tool to work in a virtual environment where they can view and analyze the effects of their decisions in the future [22].
In the SD model development, the first phase is recognizing and defining the problems that lead to identifying the problem boundaries and the model purpose. The system conceptualization is then conducted to identify the key factors that affect the system. Next, the SD model is constructed to describe the behaviors of the key factors. When the SD model development is completed, the sensitivity analysis is performed to ensure that the uncertainties will not significantly affect the overall behavior of the model. If the sensitivity analysis shows that the uncertainties significantly affect the SD model, a model adjustment must be performed until the model replicates the system behavior. Finally, the policy analysis examines the government or company’s options to achieve the best solutions [23]. The steps of the SD model development are summarized in Figure 4.
Several methods are conducted in the areas of multimodal transportation. Nesterova and Anisimov [24], for example, utilized a system analysis, mathematical logic, and the mathematical modeling of processes and systems, to decide on the effective strategies for the multimodal transportation network development in Russia. Pongsayaporn et al. [25] extracted the key factors influencing the multimodal transportation efficiency of agricultural products in Thailand. They concluded that with better multimodal transportation-related operations, the multimodal transportation market is improved through less use of road transportation and more multimodal service providers. Moreover, policymakers should focus on improving the multimodal transportation-related infrastructures, such as container yards (CDs), access roads to train stations and ports, and transshipment equipment, to increase the multimodal transportation efficiency and encourage multimodal transportation. Cansiz and Unsalan [26] conducted a cost analysis of the multimodal freight transportation in Iskenderun, and concluded the key logistics costs, including fuel consumption, handling charges, terminal service, port entry, and exit fees. Kaewfak et al. [27] utilized a fuzzy analytic hierarchy process to select the multimodal transportation routes for the coal transport companies in Thailand. China [28] examined the feasibility of the multimodal transportation of cassava products, in the long term, utilizing the SD modeling approach. Perez-Lespier [29] developed a SD model of a multimodal transportation system to understand the disruption factors that affect the multimodal transportation system efficiency.
This study uses the SD modeling approach to look at the policies and processes, it provokes severe systems thinking, and includes the qualitative and quantitative data. Some uncertainties, however, may occur during the SD model development, such as the difficulty setting the boundaries of the system, as all factors that significantly affect the problem must be represented, and the accuracy of converting the qualitative data into the quantitative data.
This study focuses on designing a SD model of the block rubber transportation in Thailand, from the production areas in the southern and northeastern regions to the export point, i.e., Laem Chabang port. Transportation problems generally involve many factors, decision variables, and constraints which are generally large-scale and complex. Therefore, an appropriate mathematical model simulation method is essential to contribute to the effective model design and formulation, which will address the current issues and provide future recommendations for both government and business sectors. The simulation model is developed with a SD model, to establish the appropriate long-term multimodal transportation development strategies, by incorporating the government policies, demand, supply, economic factors, and transportation-related factors of block rubber in current and potential modes, to analyze the total transportation costs and introduce the alternative routes with various modes of transportation, for the next 20 years.

2.3. Data Used in the Development of a SD Model of Multimodal Transportation

In this study, the government policies supporting multimodal transportation in Thailand are used as input in developing a SD model with the demand and supply of block rubber, block rubber production capacity, transportation costs, and capacity of each mode of transportation. The model includes four main data input types: circumstance, scenario, policy, and interrelationship input.
  • The circumstance inputs are the baseline data of block rubber production and transportation in Thailand, such as the current fuel prices, block rubber demand and supply, CY capacity, and port capacity. The data provides the overall logistics costs of the current condition and situation, which will be a foundation for projecting the cost in the next 20 years.
  • The scenario inputs are the trends of the circumstance inputs, which are defined by the historical data, such as the increasing rates of fuel prices and block rubber demand and supply.
  • The policy inputs are the government policies supporting multimodal transportation, such as the double-track railway project that aims to increase the efficiency of rail transportation, which, in turn, will increase the train capacity and train rounds per day. These will enable the assessment of the impacts of policies over time.
  • Interrelationship inputs reflect the relationships among critical multimodal transportation factors, which in this study are retrieved and adjusted from Pongsayaporn et al. [25]. For instance, the correlations of the road constraints factor to the market and multimodal transportation infrastructure factors, are used as an incentive for multimodal transportation usage.
A summary of data used in developing a SD model of the multimodal transportation of block rubber in Thailand is listed in Table 1. It is noted that some data used in the SD model development are from international literature and are adjusted to suit with the Thai context. The required amount of block rubber from China is assumed not to be affected by the COVID-19 pandemic in this study.

2.4. SD Model of Multimodal Transportation of the Block Rubber in Thailand

An SD model of the multimodal transportation of block rubber in Thailand is developed, based on the following assumptions.
  • The SD model is simulated for 20 years to examine the use of multimodal transportation, and overall logistics costs, following the government’s infrastructure plans in the next 20 years.
  • Data used in the SD model are achieved from the secondary data, such as international journals, companies’ reports, statistical records, and personal communications.
  • Mode combinations used in the SD model development are based on current operations, i.e., truck, train, and ship modes. Air transportation is not considered for agricultural product transportation in the study.
  • The selected mode of transportation is based on the lowest logistics costs. Other factors, such as social and environmental impacts, are not considered.
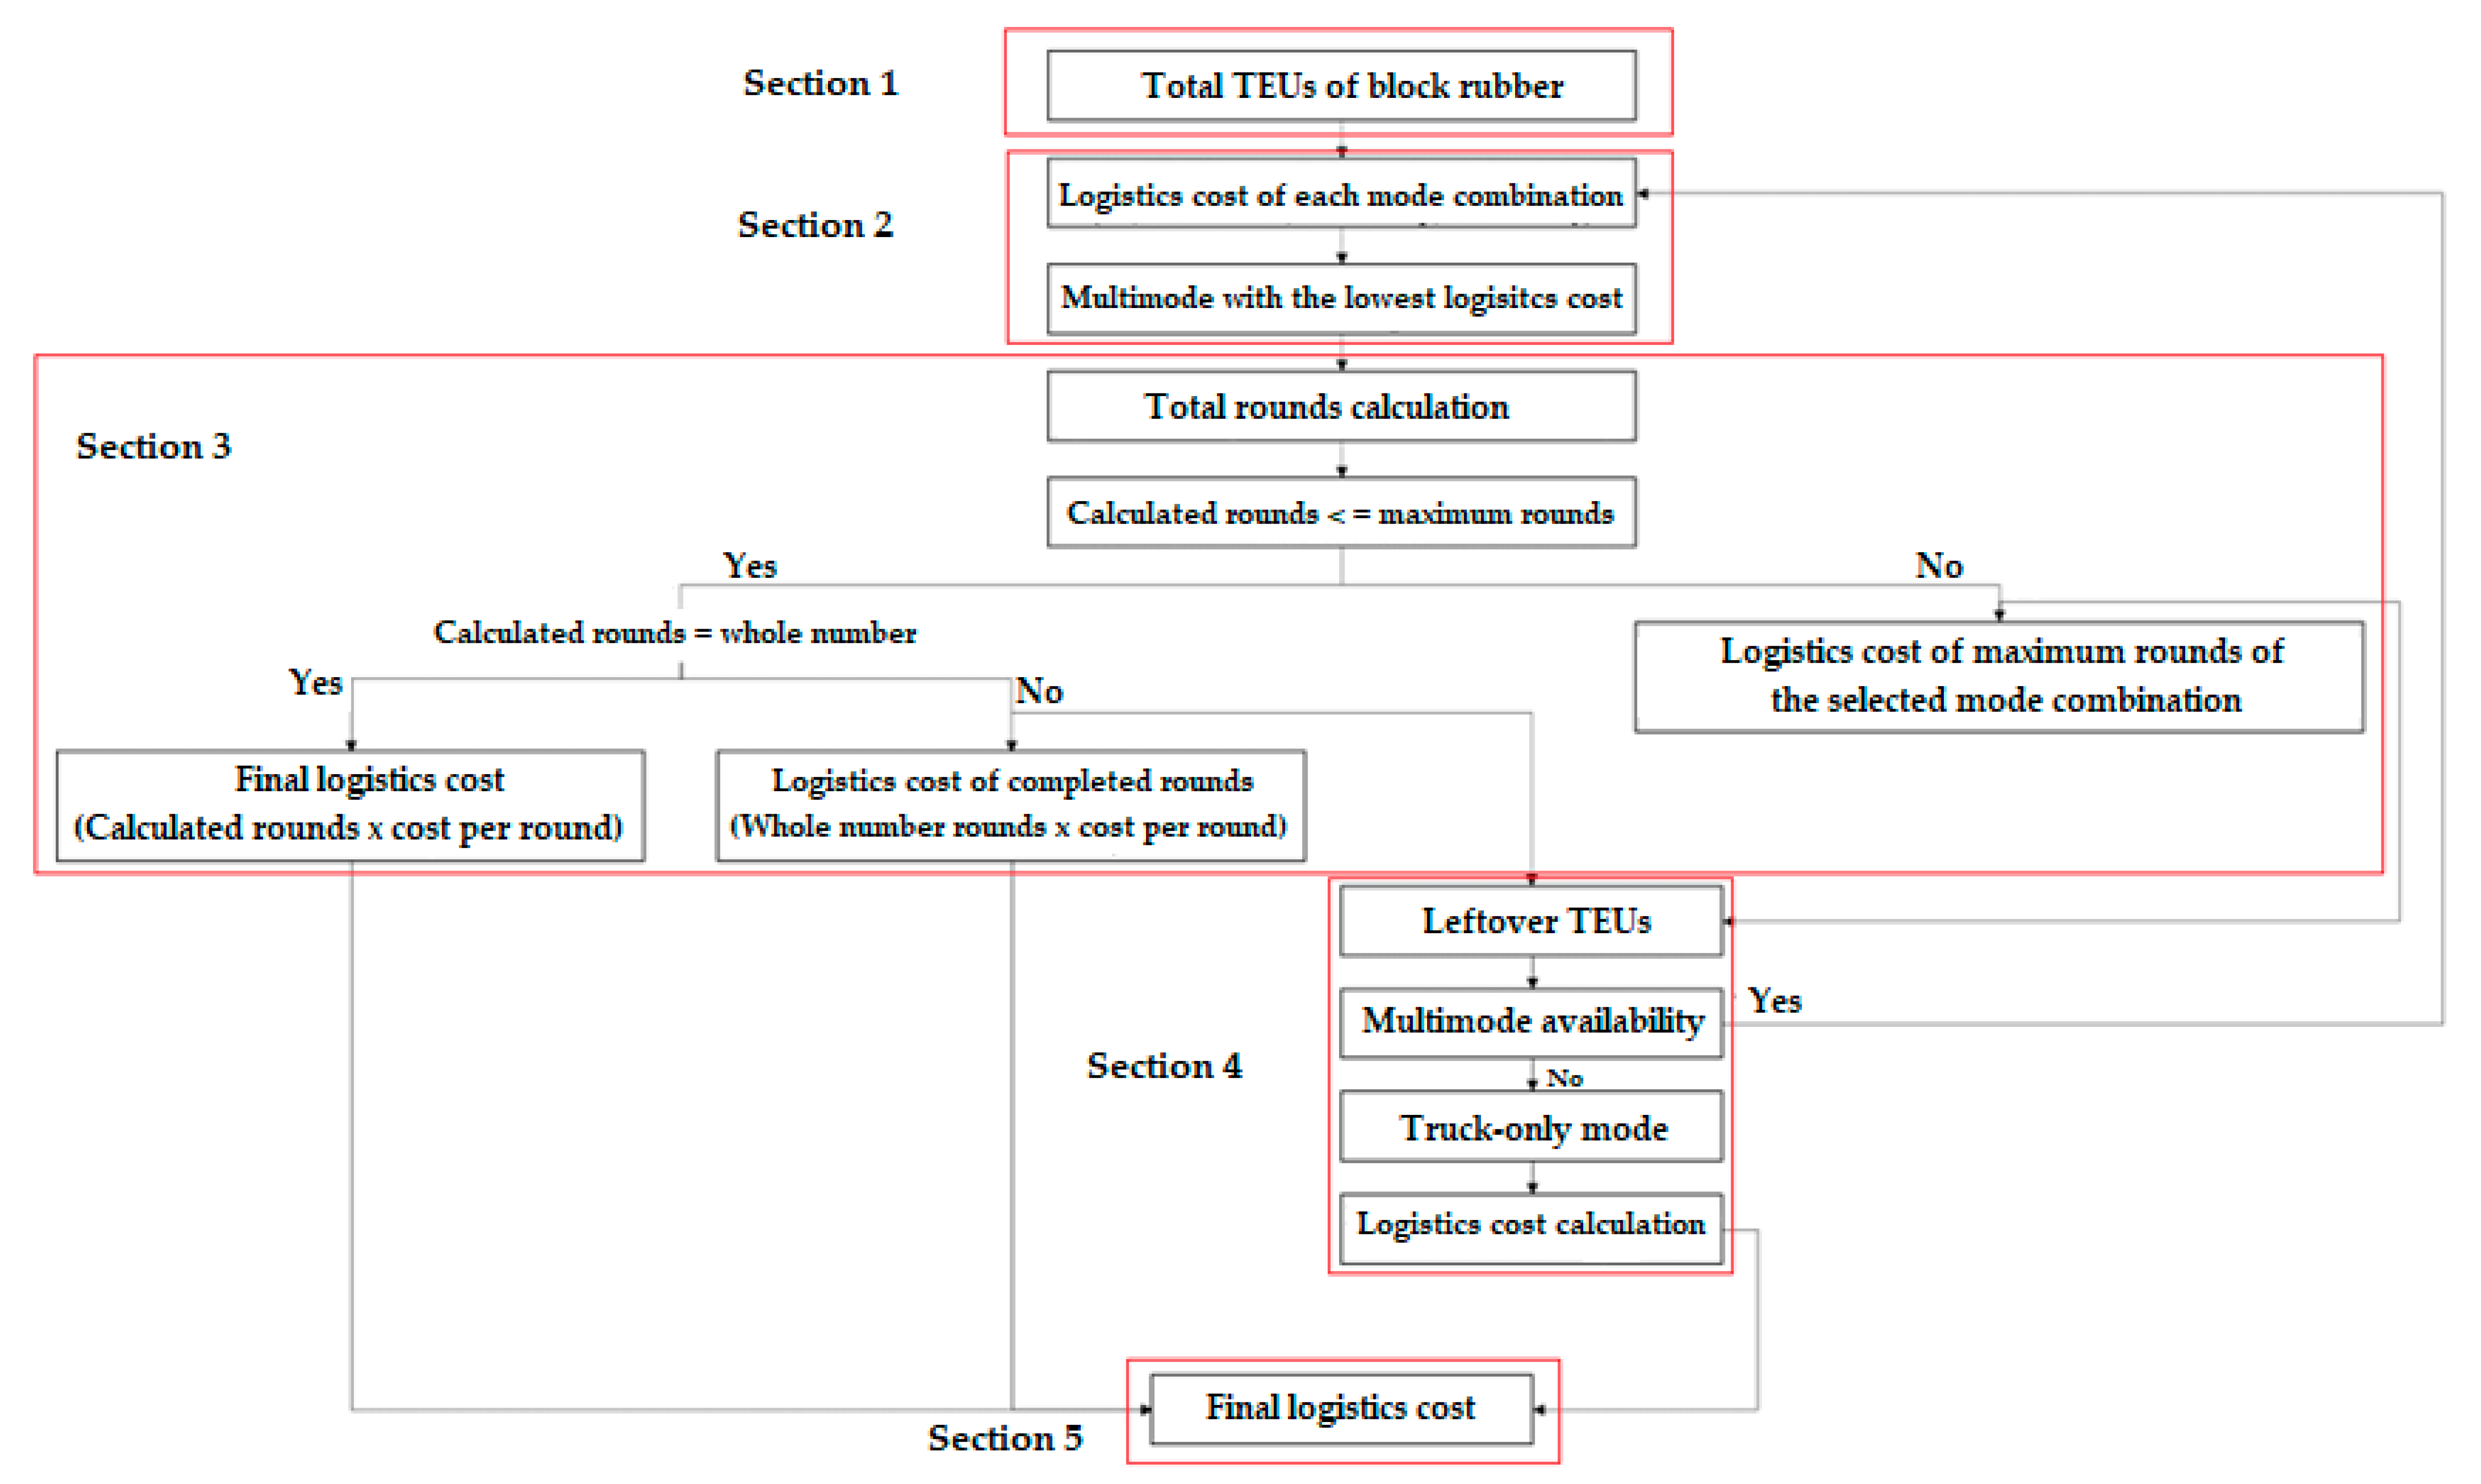
The flow of a SD model development is shown in Figure 5. The model consists of five sections, namely (1) the amount of block rubber transportation, (2) the multimode selection, (3) the amount of block rubber served by the first selected multimode, (4) the next available multimode selection for the leftover amount, and (5) the final logistics costs sections.

2.4.1. Section 1: Amount of Block Rubber Transportation

The amount of block rubber exported at Laem Chabang port per year is calculated from the natural rubber production capacity, the portion of natural rubber exported, the portion of block rubber exported, and the portion of block rubber exported at Laem Chabang port. The natural rubber production capacity is calculated from an initial amount of the natural rubber production capacity (i.e., 4,379,340 tonnes) with an increasing rate (INRP) of 3.8% per year [2]. This production capacity is limited by the rubber growing areas in the southern and northeastern regions of Thailand, where RP = the amount of rubber production (tonnes/year), MAXRP = maximum amount of rubber production in the country (tonnes/year), and YR = counter years (see Equation (1)).
RP = MAX 4379340 × 1 + INRP YR 1 , MAXRP
The amount of exported block rubber (BREX) is based on the portion of block rubber to the rubber production, the amount of block rubber transported at Laem Chabang, and the block rubber requirement from China, which is the leading exporter of Thai rubber (BRLCB = the amount of block rubber exported at Laem Chabang port, MAXLCB = maximum capacity at Leam Chabang port, BRCN = the block rubber requirement from China, and INCH = increasing rate of China’s block rubber requirements) (see Equations (2)–(4)). Please note that China’s initial block rubber requirement is 1.7 million tonnes, as shown in Equation (3) and Table 1.
BREX = MIN BRLCB , BRCN
BRLCB = MIN ( 0.32 × RP , MAXLCB )
BRCN = 1700000 × 1 + INCH YR 1
The amount of exported block rubber (BREX) is then shared between the two regions, see Equations (5) and (6), where the “BREXS” and “BREXNE” are the amount of exported block rubber from the southern and northeastern regions, respectively.
BREXS = 0.73 × BREX
BREXNE = BREX BREXS

2.4.2. Section 2: Multimode Selection

Each region calculates the logistics cost per TEU of each multimode (i.e., truck-train, truck-ship, and truck-only modes). The multimode with the minimum logistics cost is selected to be the first selected multimode used in block rubber transportation. The truck-train cost per TEU (TKTNC), for example, is calculated from the truck cost per TEU from the rubber production companies to CY (TKRC), and the train cost per TEU (TNC), which is limited by the maximum diesel price (MAXDS) (see Equations (7) and (8)). Please note that the “TNC” is converted from THB/kg to THB/TEU by multiplying with 20,000 kgs to represent 1 TEU [32] (see Table 1).
TKTNC = TKRC + TNC
TNC = 20000 × MIN ( 0.54 × 1.0455 YR 1 , MAXDS )
The “TKTNC” is reduced as the multimodal transportation usage reduces road accidents (RAR) and enhances the market efficiency (MEX) (i.e., there are interrelationships among the key multimodal transportation factors). These lead to the logistics cost per TEU of the truck-train mode combination (TKTNLC), see Equation (9).
TKTNLC = TKTNC RAR × 0.81 × 1.04 YR 1 × TLC MEX × 0.02 × 1.02 YR 1 × DELAY TKTNLC , 1
Similarly, the truck-ship cost per TEU (TKSHC) is calculated from the truck cost per TEU from the rubber production companies to the ports (TKPC), and the ship cost per TEU (SHC), which is limited by the maximum oil price (MAXOL) (see Equations (10) and (11)). The “TKSHC” is also reduced as the multimodal transportation usage reduces road accidents and enhances the market efficiency (i.e., there are interrelationships among the key multimodal transportation factors). These lead to the logistics cost per TEU of the truck-train mode combination (TKSHLC), see Equation (12).
TKSHC = TKPC + SHC
SHC = 20000 × MIN ( 0.54 × 1.0311 YR 1 , MAXOL )
TKSHLC = TKSHC 1.39 × 0.81 × 1.04 YR 1 × TLC 0.42 × 0.02 × 1.04 YR 1 × DELAY TKTNLC , 1
The logistics cost per TEU of the truck-only mode (TKLC) is calculated from the truck cost per TEU from the rubber production companies to Laem Chabang port, which is limited by the maximum NGV price (MAXNGV) (see Equation (13)).
TKLC = 20000 × MIN ( 0.79 × 1.0622 YR 1 , MAXNGV )
The “TKTNLC”, “TKSHLC”, and “TKLC” are compared, and the multimode with the lowest cost is selected to be the first multimode to be used for block rubber transportation in each region (see Equation (14)). The “MODECK” represents the decision of the first selected mode, where 0 = the truck-train mode selection, 1 = the truck-ship mode selection, and 2 = the truck-only mode selection.
MODECK = IF ( MIN TKTNLC , TKSHLC , TKLC = TKTNLC ) THEN   0   ELSE ( IF ( MIN TKTNLC , TKSHLC , TKLC = TKSHLC ) THEN   1   ELSE   2

2.4.3. Section 3: Amount of Block Rubber Served by the First Selected Multimode

Once the first multimode is selected, the “BRICS” and “BREXNE” are converted into TEUs. They are divided by the TEUs per round of the first selected mode, to calculate the total TEU rounds to be transported. The amount of block rubber to be transported by the first selected mode is then calculated, based on various conditions. Suppose the calculated rounds (in whole numbers, i.e., complete rounds with no decimal round) are less than or equal to the maximum rounds supported by the first selected mode (maximum capacity of the first selected multimode). All of the “BREXS” or “BREXNE” are transported using the first selected mode, and the overall logistics costs are calculated, based on the calculated rounds. Suppose the calculated rounds are less than the maximum rounds that can be supported by the first selected mode but are not in a whole number (i.e., there is a decimal round in the calculation). In that case, the logistics costs are calculated, based on the complete calculated rounds (full rounds only). The leftover TEUs are then considered with the next available multimode, explained in Section 4. If the calculated rounds are more than the maximum rounds supported by the first selected mode, then the logistics costs are calculated, based on the maximum rounds. The leftover TEUs are then considered with the next available multimode, explained in Section 4.
If the truck-train mode combination is selected as the first selected multimode, then the calculated daily rounds are achieved. Equations (15) and (16) give examples of the calculated rounds, per day, in the southern region. Actual rounds transported by the truck-train mode in the southern region are then calculated, using Equation (17). The leftover amount of block rubber, if any, is calculated, using Equations (18) and (19). The logistics costs of the southern region’s truck-train mode (the first selected mode) are then achieved (see Equations (20) and (21)).
TNTEUD = BREXS / TRD
TNRD = TNTEUD / TNTEUR
ATNRD = IF TNRD MAXTNRD THEN ROUND TNRD 0.5 ELSE MAXTNRD
LTNRD = IF TNRD MAXTNRD THEN TNRD ATNRD ELSE TNRD MAXTNRD
LTNRDY = IF MODECK = 0 THEN LTNRD ELSE 0
LC 1 TKTN = ATNRD × TRD × TNTEUR × TKTNLC
LC 1 TKTNY = IF MODECK = 0 THEN LC 1 TKTN ELSE 0
where
  • TNTEUD = Required TEUs transported by trains per day (TEUs/day)
  • TRD = Train operating days (days/year)
  • TNRD = Train rounds per day (rounds/day)
  • CENTER = TEUs transported by trains per round (TEUs/round)
  • AND = Actual train rounds per day (rounds/day)
  • MAXTNRD = Maximum train rounds per day (rounds/day)
  • LTNRD = Leftover amount of the truck-train mode for the next available mode combinations (rounds/day)
  • LTNRDY = Used leftover amount of the truck-train mode for the next available mode combinations (rounds/day)
  • LC1TKTN = Logistics costs of the truck-train as the first selected mode (THB/year)
  • LC1TKTNY = Used logistics costs of the truck-train as the first selected mode (THB/year)
If the truck-ship mode combination is selected as the first selected multimode, then the calculated daily rounds are achieved. Equations (22) and (23) show the calculated rounds per day in the southern region (the truck-ship mode is only available in the southern region). Actual rounds transported by the truck-ship mode in the southern region are then calculated using Equation (24). The leftover amount of block rubber, if any, is calculated using Equations (25) and (26). The logistics costs of the southern region’s truck-ship mode (the first selected mode) is then achieved (see Equations (27) and (28)).
SHTEUD = BREXS / SHD
SHRD = SHTEUD / SHTEUR
ASHRD = IF SHRD MAXSHRD THEN ROUND SHRD 0.5 ELSE MAXSHRD
LSHRD = IF SHRD MAXSHRD THEN SHRD ASHRD ELSE SHRD MAXSHRD
LSHRDY = IF MODECK = 1 THEN LSHRD ELSE 0
LC 1 TKSH = ASHRD × SHD × SHTEUR × TKSHLC
LC 1 TKSHY = IF MODECK = 1 THEN LC 1 TKSH ELSE 0
where
  • SHTEUD = Required TEUs transported by ships per day (TEUs/day)
  • SHD = Ship operating days (days/year)
  • SHRD = Ship rounds per day (rounds/day)
  • SHTEUR = TEUs transported by ships per round (TEUs/round)
  • ASHRD = Actual ship rounds per day (rounds/day)
  • MAXSHRD = Maximum ship rounds per day (rounds/day)
  • LSHRD = Leftover amount of the truck-ship mode for the next available mode combinations (rounds/day)
  • LSHRDY = Used leftover amount of the truck-ship mode for the next available mode combinations (rounds/day)
  • LC1TKSH = Logistics costs of the truck-ship as the first selected mode (THB/year)
  • LC1TKSHY = Used logistics costs of the truck-ship as the first selected mode (THB/year)
If the truck-only mode combination is selected as the first selected multimode, then the total rounds to be transported per year are achieved, as one truck serves for one TEU of the block rubber transportation. It means that the total rounds (or total trucks) required to be transported is equal to the “BREXS” or “BREXNE”, depending on the region. For example, the actual rounds transported by the truck-only mode in the southern region are then calculated, using Equation (29). The leftover amount of block rubber in the southern region, if any, is calculated using Equations (30) and (31). The logistics costs of the southern region’s truck-only mode (the first selected mode) is then achieved (see Equations (32) and (33)).
ATKR = IF BREXS = ROUND BREXS 0.5 THEN   BREXS   ELSE ROUND BREXS 0.5
LTKR = BREXS ATKR
LTKRY = IF MODECK = 2 THEN LTKR ELSE 0
LC 1 TK = ATKR × TKLC
LC 1 TKY = IF MODECK = 2 THEN LC 1 TK ELSE 0
where
  • ATKR = Actual truck rounds per year (rounds/year)
  • LTKR = Leftover amount of the truck-only mode for the next available mode combinations (rounds/year)
  • LTKRY = Used leftover amount of the truck-only mode for the next available mode combinations (rounds/year)
  • LC1TK = Logistics costs of the truck-only as the first selected mode (THB/year)
  • LC1TKY = Used logistics costs of the truck-only as the first selected mode (THB/year)
The actual leftover amount of the block rubber and the logistics costs of the first selected mode are achieved through Equations (34) and (35).
L 1 BR = LTNRDY + LSHRDY + LTKRY
LC 1 = LC 1 TKTNY + LC 1 TKSHY + LC 1 TKY
where
  • L1BR = Actual leftover amount of the block rubber (rounds/day or rounds/year)
  • LC1 = Actual logistics costs of the first selected mode (THB/year)

2.4.4. Section 4: The Next Available Multimode Selection for the Leftover Amount

The leftover amount of block rubber in each region (in TEUs), if any, is then considered with the next available mode combinations. This leftover amount may come from the exceeded or not full-round capacity (i.e., the not-integer round) of the previously selected multimode. All possible mode combinations (truck-train, truck-ship, and truck-only) are considered, if available or if the full capacity is yet achieved (see Equations (36) and (37)). The “MODECKAV” (see Equation (38)) is then used to calculate the logistics costs per TEU of each available mode combination, and the mode with the lowest logistics costs per TEU is selected to be used for the transportation of the leftover block rubber (see Equation (39)). The “MODECKAVY” in Equation (39) represents the decision of the next available mode, where 0 = the truck-train mode selection, 1 = the truck-ship mode selection, and 2 = the truck-only mode selection.
TKTNAV = IF MAXTNRD > ATNRD THEN 1 ELSE 0
TKSHAV = IF MAXSHRD > ASHRD THEN 1 ELSE 0
MODECKAV = IF ( TKTNAV   AND   TKSHAV = 1 ) THEN MIN TKTNLC , TKSHLC , TKLC ELSE ( ( IF ( TKTNAV = 1   AND   TKSHAV = 0 ) THEN MIN TKTNLC , TKLC ELSE ( ( IF ( TKTNAV = 0   AND   TKSHAV = 1 ) THEN MIN TKSHLC , TKLC ELSE TKLC ) )
MODECKAVY = IF ( MODECKAV = TKTNLC + THEN   0 ELSE IF MODECKAV = TKSHLC THEN   1   ELSE   2
where
  • TKTNAV = Available capacity of the truck-train mode (rounds/day)
  • TKSHAV = Available capacity of the truck-ship mode (rounds/day)
If the truck-train mode is selected, the calculations follow Equations (15)–(21). If the truck-ship mode is selected, then the calculations follow Equations (22)–(28). Equations (29)–(33) are used if the truck-only mode is selected. It is noted that the “BREXS” (or the “BREXNE” if the northeastern region is considered) in Equations (15), (22), (29) and (30) must be changed to the leftover amount of block rubber (the “L1BR” in Equation (34)) for the calculation. Moreover, the “MAXTNRD” in Equations (17) and (18) and the “MAXSHRD” in Equations (24) and (25) must be replaced by the available capacity of each multimode (the “TNRDAV” and “SHRDAV”), as shown in Equations (40) and (41), respectively.
TNRDAV = MAX MAXTNRD TNRD , 0
SHRDAV = MAX MAXSHRD SHRD , 0
Suppose there is still excessive block rubber after the second mode combination is selected. In that case, the leftover amount will again be considered with the next available mode combinations, where the logistics costs are compared, and the mode with minimum logistics costs is selected. The process repeats until all block rubber is transported to Laem Chabang port for the exporting process.

2.4.5. Section 5: Final Logistics Cost

Once all of the block rubber is transported to Laem Chabang port, the final logistics costs of each region is calculated by summing the logistics costs in each selected mode, to achieve the minimum logistics costs of block rubber transportation per year (see Equations (42) and (43)).
LC = LC 1 + LC 2 + LC 3 + + LC N
FLC = LCS + LCNE
where
  • N = number of mode combinations in the calculation
  • FLC = Final logistics costs of the block rubber transportation (THB/year)
  • LCS = Final logistics costs of the block rubber transportation in the southern region (THB/year)
  • LCNE = Final logistics costs of the block rubber transportation in the northeastern region (THB/year)

3. Results

3.1. Simulation Results

The SD model of multimodal transportation of block rubber in Thailand is simulated using the iThink software for the next 20 years, following the 20-year national strategy, which focuses on leveraging the government support on multimodal transportation and infrastructure development [34]. The simulation results of the final logistics costs of the southern and northeastern regions are shown in Table 2 and Table 3, respectively. Multimodal transportation is preferred over the traditional truck-only mode, to achieve the lowest final logistics costs in the long term. China [28] agreed that multimodal transportation is suitable for agricultural product transportation, including cassava products. Chen and Liu [35] agreed that the logistics costs of multimodal transportation of agricultural by-products is lower than that of road transportation. Ko et al. [18] added that multimodal transportation provides cost savings in biomass transportation, except for low annual capacities and short average distances. These confirm the uses of multimodal transportation for agricultural products, as they are primarily transported in big bulks and in high volumes.
For the southern region, the simulation results show that multimode transportation, i.e., truck-ship and truck-train modes, are used in block rubber transportation. The truck-ship mode is first selected for the first eight years of simulation, as it incurs the lowest logistics costs per TEU (see Table 2). This is consistent with Hanssen et al. [36] that determined that water transport has the lowest transport cost per ton per kilometer. Boonsuya [37] added that the truck-ship mode is suitable for rubber transportation in Thailand. Then, the truck-train mode is the preferred mode of block rubber transportation. This is consistent with the multimodal transportation development plan in [31,34], that the current train capacity and ability to support multimodal transportation are not fully utilized. It is due to the low operational efficiencies and inadequate transportation-supported facilities, resulting in delays, limited capacities, and the inability to support block rubber transportation. Ambrosino and Sciomachen [38] added that the most significant limitation of the rail mode is the infrastructure capacity, both the intermodal facilities and their connections. With the government’s plans to purchase new locomotives and improve the rail infrastructure, it is expected that train capacity will be enhanced and services will be improved to support multimodal transportation of the truck-train mode in the long term.
For the northeastern region, the simulation results show that the logistics costs of the multimode transportation, i.e., the truck-train mode, are an effective model combination. Due to its higher fuel efficiency and capability of hauling large loads, it leads to cost-effectiveness (see Table 3). Timaboot and Suthikarnnarunai [39] agreed that rail transportation costs less for agricultural product transportation, when compared with truck transportation because it can load many goods at one time and avoid traffic troubles.
Table 4 shows the final logistics costs of block rubber transportation in Thailand. Multimodal transportation saves about half the logistics costs, compared with the traditional mode of transportation (truck-only mode). The logistics companies may use the simulation results with the suggested mode combinations, to plan for the block rubber transportation, to avoid delays during the mode change. The government may also support the use of multimodal transportation in various areas, such as infrastructure development and R&D of agricultural product transportation, to enhance market competitiveness and the market enhancement on a global scale.

3.2. SD Model Validation

The developed SD model of the multimodal transportation must be validated, to ensure its use in actual practices. A sensitivity analysis is one of the standard validation processes. It reveals the degree of robustness of the model behavior and indicates the degree to which the policy recommendations may be influenced by uncertainty in the parameter values. Such testing can help to show the risk involved in adopting a model for policymaking [40].
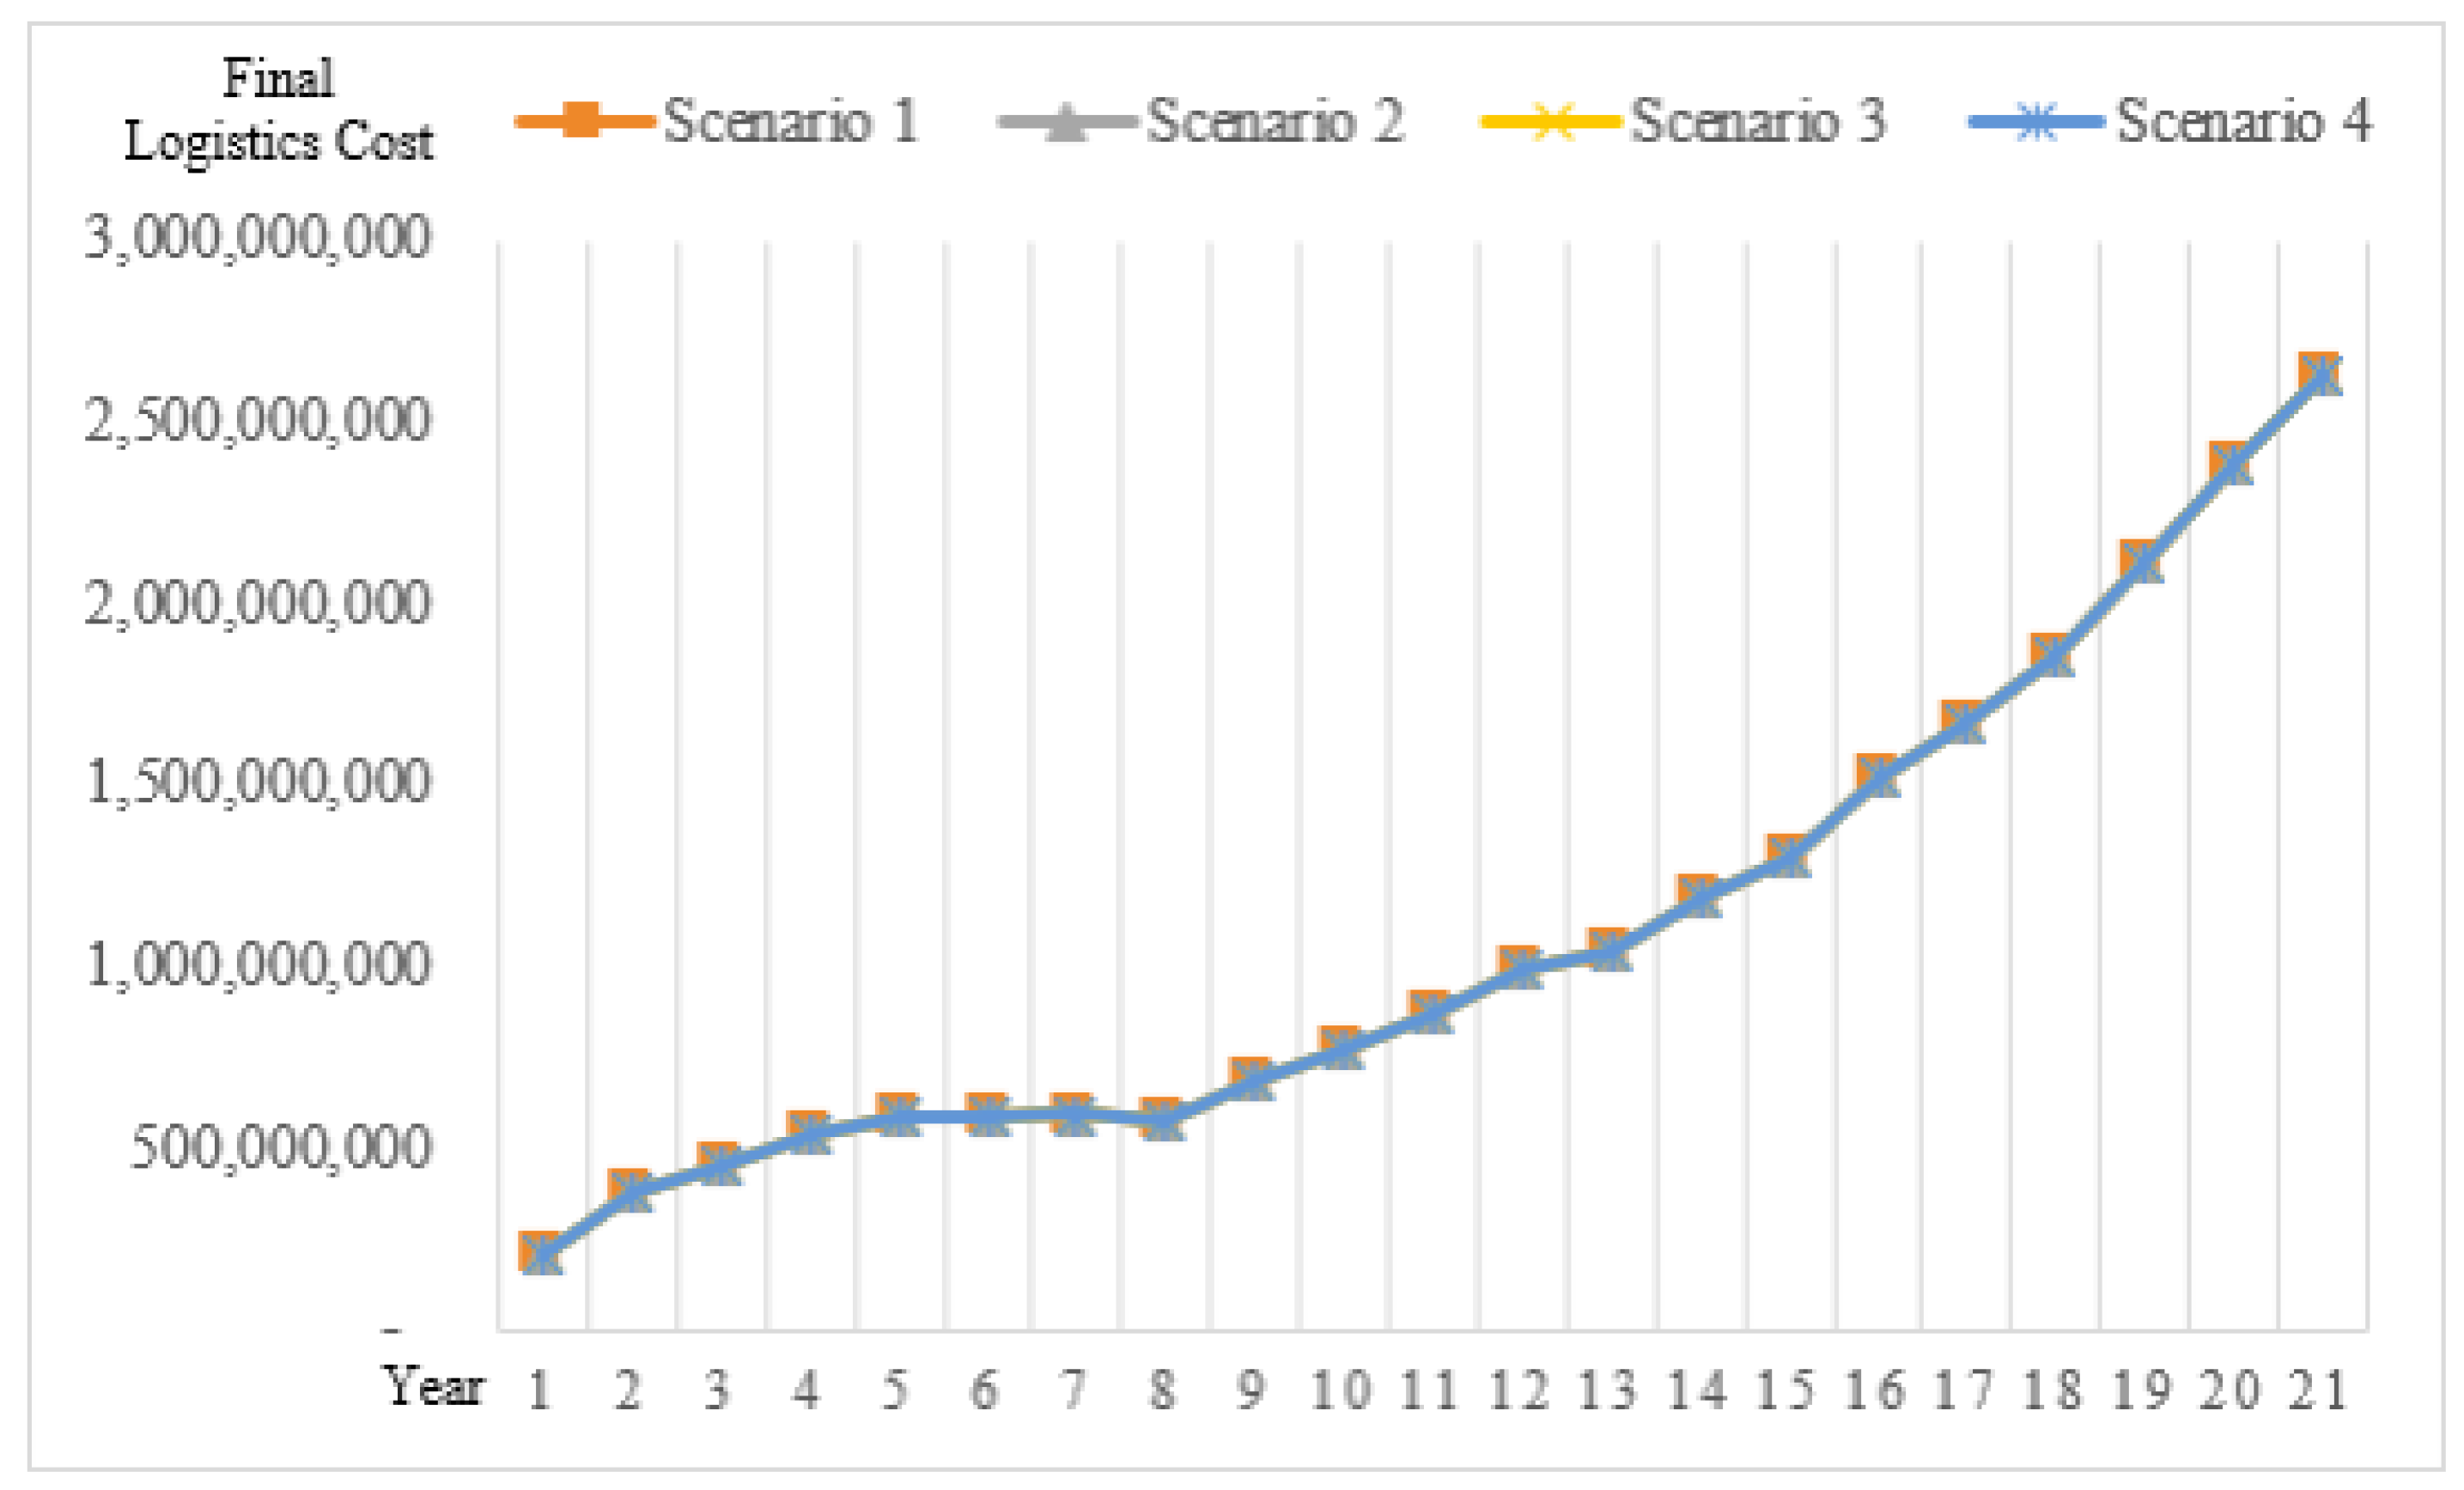
In this study, a sensitivity analysis is performed by varying the optimal number of ship rounds and train rounds per day, to examine the final logistics costs of multimodal transportation. Based on Table 2, the truck-ship mode is the first selected mode in the southern region, as it incurs the lowest logistics costs per TEU. Currently, three ships are operating in the southern region per day. By increasing port and ship efficiency, the water transportation velocity increases, resulting in more products being transported daily.
The sensitivity analysis is then performed by varying the possible number of ship rounds to be operated in the southern region, from three to six rounds per day (scenarios 1–4 in Figure 6, respectively), to examine the final logistics costs of block rubber transportation. The simulation results (see Figure 6) validate the developed SD model, as the model behavior does not change when the parameters are changed. The results also show that the increase in the number of ships per day does not improve the final logistics costs (i.e., the final logistics costs remain the same). It is because the amount of block rubber to be exported in the next 20 years do not exceed the current capacity of the port and ships (i.e., three ships per day). However, if the export amount increases through the government’s campaigns or the ports are shared with other products, then the increase of the port capacity might be necessary.
The sensitivity analysis is also performed by varying the possible number of train rounds to be operated in the northeastern region, from two to six rounds per day (scenarios 1–5 in Figure 7, respectively), to examine the final logistics costs of block rubber transportation. The simulation results (see Figure 7) validate the developed SD model, as only the magnitude of the model changes, and the model behavior does not change when the parameters are changed. An increase of the train rounds to six rounds per day in the northeastern region does not change the final logistics costs of the block rubber transportation in the first 15 years of the simulation. It is because the growing and production capacities of block rubber in the northeastern region are still low, and the current train capacity (i.e., two train rounds per day) is adequate to support the transportation to the exporting point. Then, 15 years later, it is expected that the growing and production capacities of block rubber will increase, resulting in the need to expand the train track to increase the train rounds to at least four rounds per day to support multimodal transportation and minimize the final logistics costs. This confirms the suitability of the government’s double-track plan in the northeastern region to be enlarged to four train rounds per day, in the future [31].
In summary, the sensitivity analysis results confirm the validity of the developed SD model to be used in the future, as only the magnitude of the simulation results is changed, while the model behavior remains the same. The policy analysis results also confirm that the government’s policies to support the multimodal transportation of block rubber are practical to be implemented in the next 10–15 years. Continuous support from the government in train and ship infrastructure improvement is needed if the demand for block rubber is highly increased from the changes in the world’s consumption, in the future. The improvement of transport infrastructure, information technology, and networks enhance the uses of multimodal transportation, reduce transport accidents, reduce environmental impacts, and may turn Thailand into a smart city, in the future [41,42].

4. Conclusions

Block rubber is a key agricultural product essential to Thailand’s economic growth. To achieve sustainable growth, the government invests in R&D to achieve higher quality products, promote new growing areas to satisfy increased demands, and support the transport infrastructure and logistics services to reduce logistics costs and to stay competitive in the global market. Several projects, including multimodal transportation, are established to enhance the transportation network and achieve a high transport efficiency. Multimodal transportation, especially the combinations of truck-train and truck-ship transportation, has become the government’s essential plan to reduce the high logistics costs of traditional truck-only transportation. This is because block rubber, as other agricultural products, usually has low prices and is transported in big bulks to achieve an economy of scale. Therefore, large transport capacities of trains and ships are favored to reduce the logistics costs per unit from the production companies to the export point, i.e., Laem Chabang. In contrast, transportation from the rubber fields to the production companies still relies on trucks for short-distance transportation. It is expected that multimodal transportation helps utilize the transportation network and infrastructure to serve high transport demands, reach high transport capacities, achieve the companies’ goals in time, costs, and profit aspects, and enhance the country’s market competitiveness.
This study examines the long-term effects of multimodal transportation to reduce the overall logistics costs. The SD model of multimodal transportation is developed utilizing the SD modeling approach. The simulation results confirm the use of multimodal transportation through truck-ship and truck-train modes, to minimize the final logistics costs of block rubber transportation from the origin (rubber fields) to the destination (export point, i.e., Laem Chabang), in the long term. With the increase in block rubber demand and government support in multimodal transportation improvement, such as double-track enlargement and port expansion, it is expected that the use of multimodal transportation may help reduce the final logistics costs of block rubber transportation by half, when compared with the cost of traditional (truck-only) transportation. With continuous support from the government in promoting the use of multimodal transportation, multimodal transportation will bring great benefit to the country, in terms of cost-saving, thus, raising the country’s competitiveness on a global scale and achieving sustainable growth and development, in the long term. The support and improvement must be continued if Thailand needs to maintain its rank as the world’s top exporter of block rubbers.
This study contributes to the existing body of knowledge. The study identifies the causal mechanisms that researchers, manufacturers, and transport managers need to understand to effectively plan for the multimodal transportation of block rubber, which is the leading export product of Thailand, to achieve the lowest logistics costs in the long term. The developed SD model explores the causal relationships among the key multimodal transportation factors, thus extending the knowledge and understanding of the key multimodal transportation factors and their influences on the multimode selection and logistics costs. The developed SD model also provides an integrated framework for understanding how multimode selection decisions and government-supporting policies influence the final logistics costs. Such contributions provide a strong foundation for understanding the multimodal transportation of block rubber, its key multimodal transportation factors, and the relationships among those key factors that affect the logistics costs in the long term, thus adding value to future infrastructure plans and related research studies.
This study has some recommendations. The transportation behavior in each country is different, depending on culture, stage of technology development, supporting policies, economic power, and regulations. Applying the study results in other geographical areas may require some adjustment from experts. A comparison between developed and developing countries could also be performed to examine the similarities and differences in perceptions regarding multimodal transportation efficiency.
Although the study results are validated for a particular case study of the block rubber transportation in Thailand, the proposed methodology is applicable for the multimodal transportation study of products that can be transported in bulk volume or containers to plan for the effective multimodal transportation development, in the long term.

Author Contributions

P.P. collected data, developed a SD model of the multimodal transportation, and drafted the manuscript. T.C. developed a SD model of the multimodal transportation and drafted the manuscript. All authors have read and agreed to the published version of the manuscript.

Funding

This research received no external funding.

Institutional Review Board Statement

Not applicable.

Informed Consent Statement

Not applicable.

Data Availability Statement

Not applicable.

Conflicts of Interest

The authors declare no conflict of interest.

References

  1. Thailand Board of Investment. Thailand’s Rubber Industry. Available online: https://www.boi.go.th/index.php?page=business_opportunities_detail&topic_id=117529 (accessed on 4 October 2022).
  2. Office of Agricultural Economics. Rubber’s Plant Area in Thailand [in Thai]. Available online: https://www.oae.go.th/assets/portals/1/fileups/prcaidata/files/para%20rubber63.pdf (accessed on 4 October 2022).
  3. Chanchaichujit, J. Green Supply Chain Management Model for the Thai Rubber Industry. Ph.D. Thesis, Curtin University, Perth, Australia, August 2014. [Google Scholar]
  4. Doner, R.; Abonyi, G. Upgrading Thailand’s rubber industry: Opportunities and challenges. Thammasat Econ. J. 2013, 31, 44–66. [Google Scholar]
  5. Krungsri Research. 2022–2024 Thailand Industry Outlook. Available online: https://www.krungsri.com/en/research/industry/summary-outlook/outlook-2022-2024 (accessed on 4 October 2022).
  6. Workman, D. Thailand’s Top 10 Exports. Available online: https://www.worldstopexports.com/thailands-top-10-exports/ (accessed on 10 January 2022).
  7. The Thai Rubber Association. Thai Rubber Statistics. Available online: http://www.thainr.com/th/?detail=stat-thai (accessed on 10 January 2022).
  8. Ministry of Transport. Thailand’s Transport Infrastructure Development Strategy 2015–2022. Available online: http://www.thaitransport.org/news/2558.07.01%20proceeding/presentation%20TSTS%2015%20.......02%2004%202015/panel%2001.pdf (accessed on 15 January 2022).
  9. Chanchaichujit, J.; Saavedra-Rosas, J.F. The elements of the natural rubber industry supply chain. In Using Simulation Tools to Model Renewable Resources; Palgrave Macmillan: Cham, Switzerland, 2017. [Google Scholar] [CrossRef]
  10. Amornvivat, S.; Homchampa, T.; Kantaumong, I.; Ratanapinyowong, T.; Srisamran, S. Insight Thai Transport Mega-Projects Pave Way for Countless Business Opportunities; SCB Economic Intelligence Center: Bangkok, Thailand, 2022; pp. 1–90. [Google Scholar]
  11. Hanssen, T.E.S.; Mathisen, T.A. Factors facilitating intermodal transport of perishable goods-transport purchasers viewpoint. Eur. Trans. Res. Rev. 2011, 49, 75–89. [Google Scholar]
  12. Rantasila, K.; Ojala, L. Measurement of National-Level Logistics Costs and Performance; Discussion Paper No. 2012-4; Turku School of Economics at the University of Turku: Turku, Finland, 2012. [Google Scholar]
  13. Choi, B.; Chung, K.; Lee, K. The impact of policy measures on promoting the modal shift from road to rail. Pers. Ubiquitous Comput. 2014, 18, 1423–1429. [Google Scholar] [CrossRef]
  14. Papaioannoua, D.; Martinez, L.M. The role of accessibility and connectivity in mode choice: A structural equation modeling approach. Trans. Res. Procedia 2015, 10, 831–839. [Google Scholar] [CrossRef] [Green Version]
  15. Jiang, X.; He, X.; Zhang, L.; Qin, H.; Shao, F. Multimodal transportation infrastructure investment and regional economic development: A structural equation modeling empirical analysis in China from 1986 to 2011. Trans. Pol. 2017, 54, 43–52. [Google Scholar] [CrossRef]
  16. Charoennapharat, T.; Chaopaisarn, P. Factors affecting multimodal transportation during COVID-19: A Thai service provider perspective. Sustainability 2022, 14, 4838. [Google Scholar] [CrossRef]
  17. Li, M.; Sun, X. Path optimization of low-carbon container multimodal transport under uncertain conditions. Sustainability 2022, 14, 14098. [Google Scholar] [CrossRef]
  18. Ko, S.; Choi, K.; Yu, S.; Lee, J. A stochastic optimization model for sustainable multimodal transportation for bioenergy production. Sustainability 2022, 14, 1889. [Google Scholar] [CrossRef]
  19. Kilani, M.; Diop, N.; De Wolf, D. A multimodal transport model to evaluate transport policies in the north of France. Sustainability 2022, 14, 1535. [Google Scholar] [CrossRef]
  20. PAT. Laem Chabang Phase 3 Market Sounding#1. Port Authority of Thailand. Available online: https://www.eeco.or.th/th/filedownload/1504/49bee2c4c0db25f03defbf3e5f85f15d.pdf (accessed on 4 October 2022).
  21. Kaew-ngarm, S.; Kao-ian, S.; Suchato, R. Supply Chain of Rubber Transportation in Northeastern Region to People’s Republic of China; Bangkok University Research Conference: Bangkok, Thailand, 2016. [Google Scholar]
  22. Monga, P. A System Dynamics Model of the Development of New Technologies for Ship Systems; Virginia Polytechnic Institute and State University: Blacksburg, VA, USA, 2001. [Google Scholar]
  23. Azhaginiyal, A.; Umadevi, G. System dynamics simulation modeling of transport, energy and emissions interactions. Civ. Eng. Archit. 2014, 2, 149–165. [Google Scholar] [CrossRef]
  24. Nesterova, N.; Anisimov, V. Effective strategies for multimodal transportation network. IOP Conf. Ser. Earth Environ. Sci. 2019, 403, 012204. [Google Scholar] [CrossRef]
  25. Pongsayaporn, P.; Chinda, T.; Ammarapala, V. Interrelationships among factors influencing multimodal transportation of agricultural products in Thailand: Structural equation modeling approach. Eng. Manag. J. 2021, 1–18. [Google Scholar] [CrossRef]
  26. Cansiz, O.F.; Unsalan, K. Cost analysis of multimodal freight transportation: A case of Iskenderun. Int. J. Adv. Eng. Res. Sci. 2018, 5, 315–319. [Google Scholar] [CrossRef]
  27. Kaewkak, K.; Ammarapala, V.; Charoensiriwath, C. Fuzzy AHP approach for route selection in multimodal transportation: The case of coal industry in Thailand. Sci. Technol. Asia 2021, 26, 84–95. [Google Scholar]
  28. China, T. Feasibility study of multimodal transportation of cassava products in Thailand: System dynamics modeling. ASEAN Eng. J. 2022, 12, 79–88. [Google Scholar] [CrossRef]
  29. Perez-Lespier, L. Examining the Efficiency of Multimodal Transportation Systems: A Systems Dynamics Approach. Master’s Thesis, Missouri University of Science and Technology, Rolla, MO, USA, 2013. [Google Scholar]
  30. NESDC. Thailand’s Logistics Report 2019. Office of the National Economic and Social Development Council. Available online: https://www.nesdc.go.th/nesdb_en/download/article/article_20201112144736.pdf (accessed on 4 October 2022).
  31. Ministry of Transport. 4-Year Performance. Available online: https://complain.mot.go.th/prproject/files_upload/publishonweb/4years-performance-mot.pdf (accessed on 25 September 2022).
  32. Merk, O. Container Ship Size and Port Relocation. Discussion Paper, International Transport Forum. Available online: https://www.itf-oecd.org/sites/default/files/docs/container-ship-size-and-port-relocation.pdf (accessed on 25 September 2022).
  33. BOT. Foreign Exchange Rates. Bank of Thailand. Available online: https://www.bot.or.th/english/_layouts/application/exchangerate/exchangerate.aspx (accessed on 29 September 2022).
  34. Strategic Transformation Office. The National Strategy: The Future of Thailand. Available online: https://sto.go.th/en/about/policy/20-year-strategic-plan (accessed on 25 September 2022).
  35. Chen, X.; Liu, Z. The choice of multimodal transport mode of agricultural by-product logistics in land-sea new corridor in western China based on big data. Wirel. Commu. Mobile Comput. 2021, 2021, 1880689. [Google Scholar] [CrossRef]
  36. Hanssen, T.E.S.; Mathisen, T.A.; Jørgensen, F. Generalized transport costs in intermodal freight transport. Procedia Soc. Behav. Sci. 2012, 54, 189–200. [Google Scholar] [CrossRef] [Green Version]
  37. Boonsuya, S. Songkhla Port Development to Increase Export Efficiency [in Thai]. Master’s Thesis, University of the Thai Chamber of Commerce, Bangkok, Thailand, 2010. [Google Scholar]
  38. Ambrosino, D.; Sciomachen, A. Impact of externalities on the design and management of multimodal logistics network. Sustainability 2021, 13, 5080. [Google Scholar] [CrossRef]
  39. Timaboot, W.; Suthikarnnarunai, N. Designing the Multimodal Network in An Agriculture Supply in Thailand. 2016. Available online: https://eng.utcc.ac.th/upload/staffs/publication/nanthi_sut/320_1516939236_65443017.pdf (accessed on 13 June 2022).
  40. Forrester, J.W.; Senge, P.M. Tests for building confidence in system dynamic models. TIMS Studies Manag. Sci. 1980, 14, 209–228. [Google Scholar]
  41. Mohapatra, H. Socio-technical challenges in the implementation of smart city. In Proceedings of the 2021 International Conference on Innovation and Intelligence for Informatics, Computing, and Technologies (3ICT), Zallaq, Bahrain, 29–30 September 2021; pp. 57–62. [Google Scholar] [CrossRef]
  42. Mohapatra., H.; Rath, A.K. An IoT based efficient multi-objective real-time smart parking system. Int. J. Sens. Netw. 2021, 37, 219–232. [Google Scholar] [CrossRef]
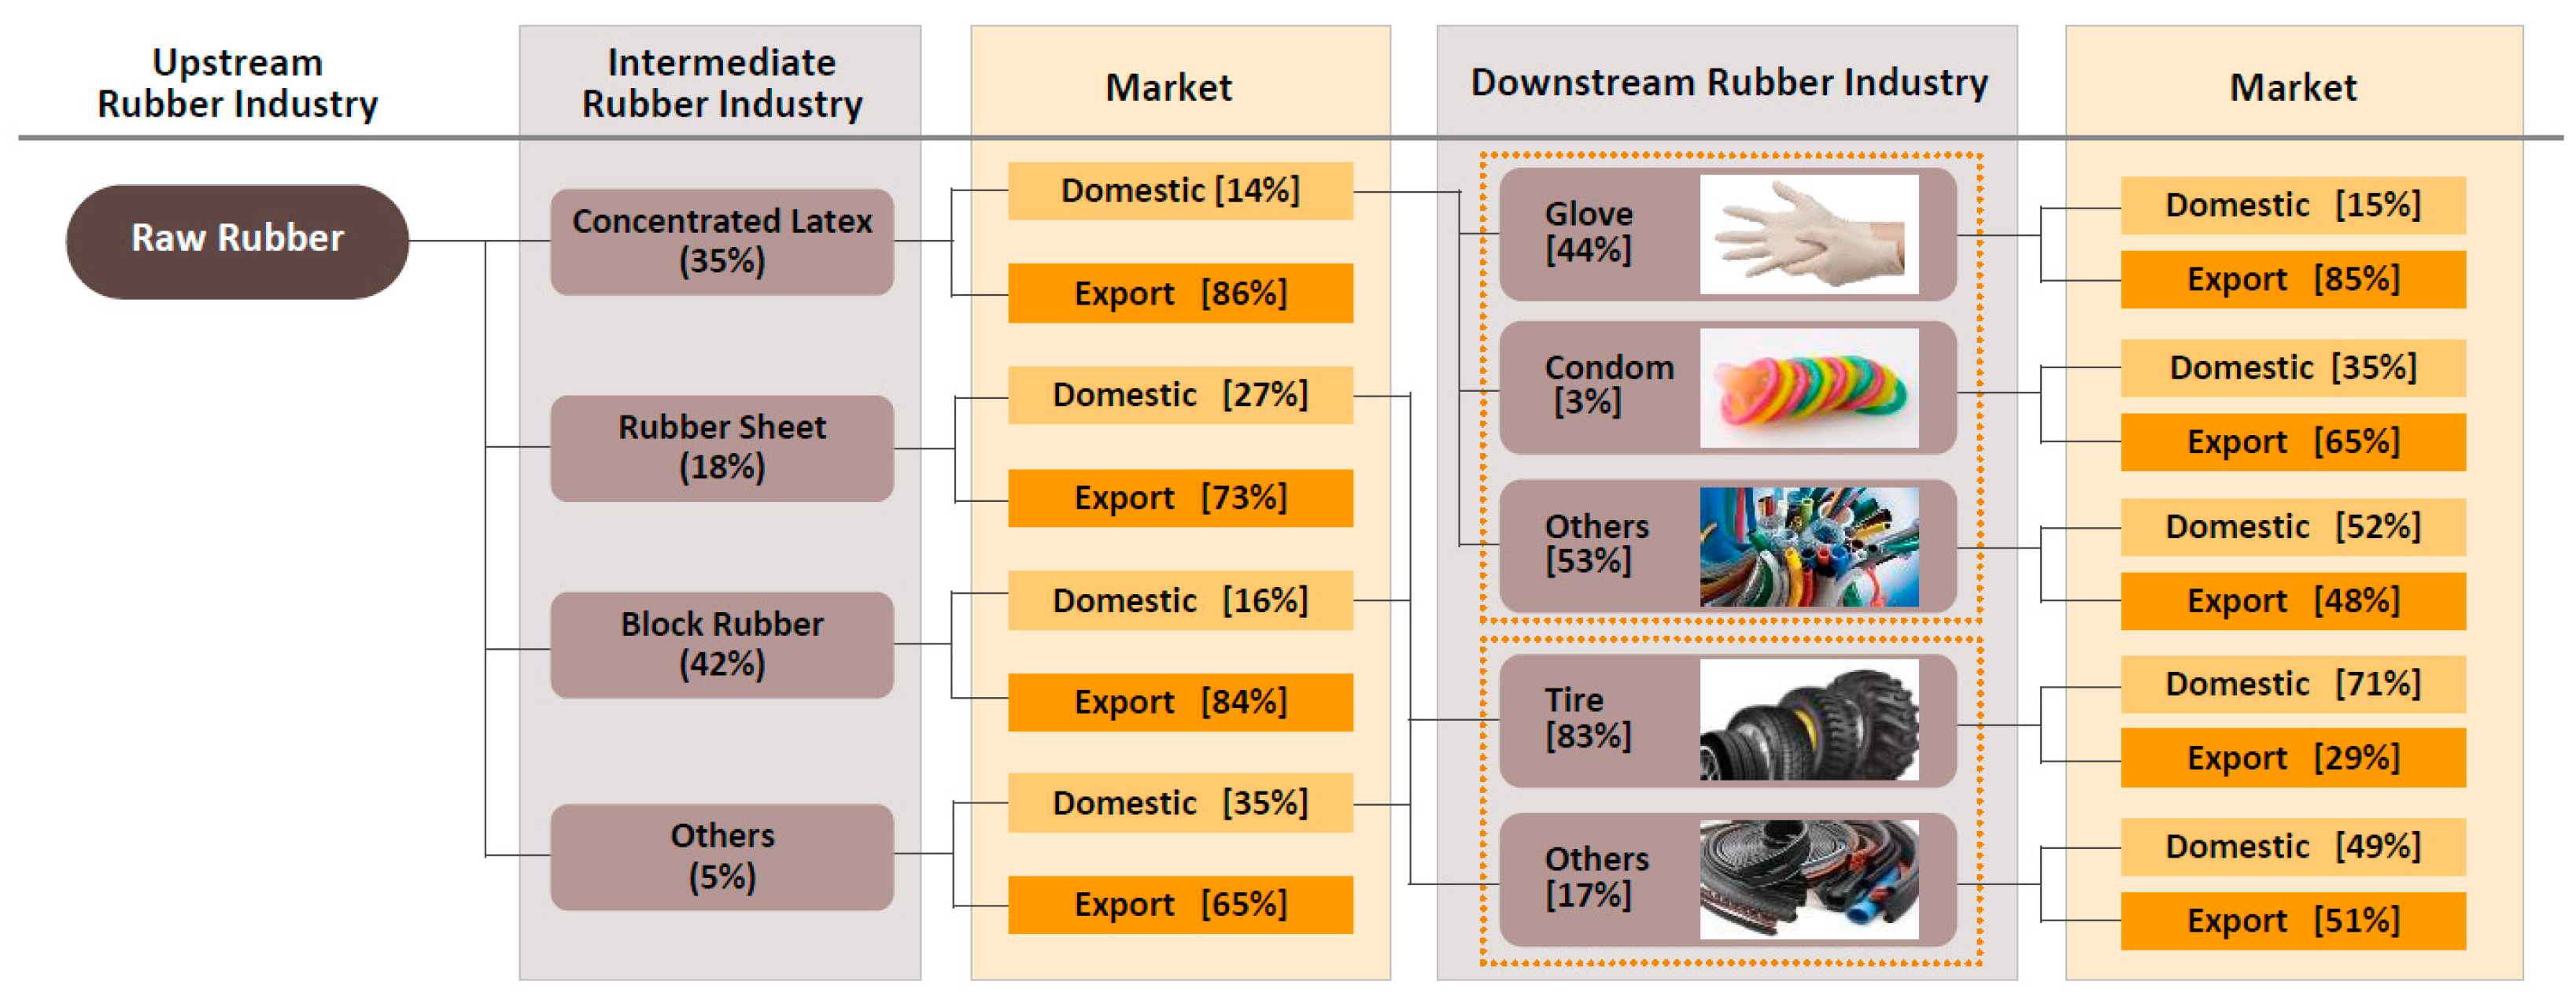
Figure 1. Thailand’s rubber market Reprinted/adapted with permission from Ref. [5]. 2022, Krungsri Research.
Sustainability 14 15350 g001
Figure 2. Research flow of this study.
Sustainability 14 15350 g002
Figure 3. Mode combinations of the block rubber transportation.
Sustainability 14 15350 g003
Figure 4. Steps of the SD model development.
Sustainability 14 15350 g004
Figure 5. The flow of the dynamic model of multimodal transportation of block rubber.
Sustainability 14 15350 g005
Figure 6. Graphical results of the final logistics costs of block rubber transportation when the number of ships per day in the southern region changes.
Sustainability 14 15350 g006
Figure 7. Graphical results of final logistics costs of block rubber transportation when the number of trains per day in the northeastern region changes.
Sustainability 14 15350 g007
Table 1. Data used in the development of a SD model of multimodal transportation.
Input Data Value Reference
Circumstance Rubber production capacity (RP)
  • Initial of 4,379,340 tonnes
[2,5,20,30,31]
Block rubber export amount
  • 32% of rubber production capacity
China’s block rubber requirements (BREX)
  • Initial of 1.7 million tonnes
The ratio of the southern exported block rubber to the northeastern exported block rubber
  • 73:27
Laem Chabang port capacity (MAXLCB)
  • Maximum of 11.1 million 20-ft equivalent units (TEUs 1)
  • Maximum of 1.2 million TEUs for block rubber
CY capacity
  • Ban Thung Pho Junction Railway Station (southern region): initial of 738,000 tonnes per year and 998,900 tonnes per year after the double-track railway project is completed.
  • Nong Takai Railway Station (northeastern region): initial of 1 million tonnes per and 2.13 million tonnes per year after the double-track railway project is completed.
Train capacity
  • Ban Thung Pho Junction Railway Station (southern region): 46 TEUs per round
  • Nong Takai Railway Station (northeastern region): 30 TEUs per round
  • Operating train rounds per day (MAXTNRD): 2
Ship capacity
  • 30 TEUs per round
  • Two rounds per day
Fuel price
  • Truck: natural gas (NGV) of 0.79 Baht 2 per kg
  • Train: diesel of 0.54 Baht 2 per kg
  • Ship: oil of 0.54 Baht 2 per kg
Scenario Increase amount of the rubber production capacity
  • An increasing rate of rubber production capacity (INRP): 3.8% per year
  • Maximum rubber production capacity (MAXRP): 5 million tonnes
[2,20,30]
An increasing rate of the block rubber export amount
  • 5.7% per year
An increasing rate of China’s block rubber requirements (INCH)
  • 4% per year
Increased fuel price
  • Truck: 6.22% per year with a maximum NGV price (MAXNGV) of 1.25 Baht 2 per kg
  • Train: 4.55% per year with a maximum diesel price (MAXDS) of 0.56 Baht 2 per kg
  • Ship: 3.1% per year with a maximum oil price (MAXOL) of 0.56 Baht 2 per kg
Policy Expansion of Laem Chabang port
  • Maximum of 18.1 million TEUs
  • Maximum of 1.2 million TEUs for block rubber
[20,31]
Expansion of the double-track rail
  • Ban Thung Pho Junction Railway Station (southern region): 60 TEUs per round and six rounds per day
  • Nong Takai Railway Station (northeastern region): 60 TEUs per round and four rounds per day
Interrelationship The incentive of multimodal transportation
  • Incentive from road accident reductions (RAR): 139%
  • Incentive from the market expansion (MEX): 42%
[25]
Road accident
  • 81.2% of the inland transportation accident statistics
  • Increasing rate: 2% per year
1 TEU is a standard container size that can be loaded and sealed onto ships, railroad cars, trucks, and planes with the dimensions of 20-ft in length, 8 ft in width, and 9 in ft height. 1TEU = 20,000 kgs [32]. 2 THB 38.16 = USD 1 [33].
Table 2. Final logistics costs of the southern region.
YearThe 1st Selected ModeThe 2nd Selected ModeThe 3rd Selected ModeFinal Logistics Cost (THB)
0Truck-shipTruck-train111,981,279
1Truck-shipTruck-only269,308,150
2Truck-shipTruck-only318,568,473
3Truck-shipTruck-only376,305,762
4Truck-shipTruck-train419,922,995
5Truck-shipTruck-train415,557,863
6Truck-shipTruck-train400,300,404
7Truck-shipTruck-train363,013,449
8Truck-shipTruck-only458,202,668
9Truck-train507,552,810
10Truck-trainTruck-only576,485,736
11Truck-train658,136,015
12Truck-trainTruck-only703,263,601
13Truck-train821,844,417
14Truck-trainTruck-only887,024,652
15Truck-trainTruck-only1,049,905,035
16Truck-trainTruck-ship1,137,093,207
17Truck-trainTruck-shipTruck-only1,298,910,958
18Truck-trainTruck-ship1,470,991,992
19Truck-trainTruck-shipTruck-only1,654,426,445
20Truck-trainTruck-ship1,844,678,821
Table 3. Final logistics costs of the northeastern region.
YearThe 1st Selected ModeThe 2nd Selected ModeFinal Logistics Cost (THB)
0Truck-trainTruck-only90,166,020
1Truck-trainTruck-only111,962,994
2Truck-trainTruck-only133,471,835
3Truck-trainTruck-only164,073,632
4Truck-trainTruck-only170,516,942
5Truck-trainTruck-only174,676,648
6Truck-trainTruck-only193,656,342
7Truck-trainTruck-only211,198,070
8Truck-trainTruck-only231,915,236
9Truck-trainTruck-only264,072,238
10Truck-trainTruck-only299,364,265
11Truck-trainTruck-only333,224,344
12Truck-trainTruck-only337,718,526
13Truck-trainTruck-only363,111,446
14Truck-trainTruck-only416,731,291
15Truck-trainTruck-only475,448,931
16Truck-trainTruck-only538,004,973
17Truck-trainTruck-only557,449,524
18Truck-trainTruck-only637,907,450
19Truck-trainTruck-only725,964,817
20Truck-trainTruck-only779,815,578
Table 4. Final logistics costs of the block rubber transportation.
YearFinal Logistics Costs of Multimodal Transportation (THB)Final Logistics Costs of the Traditional (Truck-Only) Mode (THB)Cost-Saving (%)
0202,147,299426,802,400111
1381,271,144512,693,56134
2452,040,308598,433,16932
3540,379,394690,965,18228
4590,439,937778,512,00032
5590,234,511855,481,20045
6593,956,746940,035,60058
7574,211,5191,032,998,40080
8690,117,9041,135,094,80064
9771,625,0481,247,324,40062
10875,850,0011,370,608,40056
11991,360,3591,506,122,80052
121,040,982,1271,655,024,00059
131,184,955,8631,818,605,60053
141,303,755,9431,998,396,40053
151,525,353,9662,195,964,40044
161,675,098,1802,413,034,40044
171,856,360,4822,651,586,00043
182,108,899,4422,913,736,00038
192,380,391,2623,201,758,00035
202,624,494,3993,518,278,40034
Publisher’s Note: MDPI stays neutral with regard to jurisdictional claims in published maps and institutional affiliations.