Article

Characterization of Hydrologic Sand and Dust Storm Sources in the Middle East

by
Ramin Papi
1,2,
Sara Attarchi
1,*,
Ali Darvishi Boloorani
1,* and
Najmeh Neysani Samany
1
1
Department of Remote Sensing and GIS, Faculty of Geography, University of Tehran, Azin Alley. 50, Vesal Str, Tehran 11369, Iran
2
National Cartographic Center (NCC), Meraj Alley, Azadi Square, Tehran 11369, Iran
*
Authors to whom correspondence should be addressed.
Sustainability 2022, 14(22), 15352; https://doi.org/10.3390/su142215352
Submission received: 4 August 2022 / Revised: 19 September 2022 / Accepted: 7 November 2022 / Published: 18 November 2022

Abstract

:
Due to diverse hydroclimatic conditions and human interventions, the Middle East hosts a variety of active sources of sand and dust storms (SDS). Discrimination of different types of SDS sources is the most important factor for adopting optimal mitigation measures to combat SDS. This study employed a binary mask-based modeling framework to identify Middle East SDS sources. Accordingly, using time series of remotely sensed data of land surface and atmospheric aerosol parameters, SDS sources covering an area of 1 million Km2 were identified with an overall accuracy of 82.6%. Considering the type of land use and spatial-temporal changes in water bodies, SDS sources were categorized into seven types in terms of origin. Desert sources have the largest share (>79%), whereas hydrologic sources accounted for about 8.4%. The results showed that water bodies had a declining trend after 2000. The occurrence of two severe drought periods in 2000–2001 and 2007–2012 led to a 52% decrease in water bodies and a 14–37% increase in SDS emission compared to the pre-2000 period. The latter drought period also led to a sharp decrease in groundwater resources across the region. Our results revealed that natural circumstances and drought actively contribute to the depletion of water resources that led to the formation of SDS sources in the Middle East, while the role of anthropogenic factors is predominant in the case of hydrologic SDS sources.

1. Introduction

Middle East (ME) is the most affected region by climate change with a significant contribution (15–20%) to global SDS emission [1]. Accordingly, as a prominent feature of this region, SDS has affected climatic parameters [2,3], human health [4,5], socio-economic factors [6], and terrestrial and marine ecosystems [7]. ME is the second most SDS-affected region in the world after North Africa. Considering its location within the subtropical high-pressure belt of the Northern Hemisphere and its expansive deserts [8], ME is experiencing SDS events in hot and dry seasons. However, the maximum activity period varies in different regions of ME. SDS events generally occur in the northwestern parts of the region in winter and spring. In addition, the most intense events form in the southwestern parts of the region in the summer [9].
SDS events are driven by a mixture of natural and anthropogenic factors [10]. Natural factors such as topographic diversity, climatic variability, and several seasonal effective air masses have created a highly complex situation in this region [11]. With mean annual precipitation of less than 200 mm, most parts of the Middle East suffer from dry and semi-arid climates. Therefore, water scarcity has been a lasting problem in the region with serious consequences for the stability and development of the region’s economy [12]. The spatial-temporal patterns of precipitation and temperature vary to a great extent across the region with over 1800 mm along the Caspian Sea in Northern Iran and zero annual precipitation in some desert areas in Central Iran and Saudi Arabia [11]. In addition to climatic conditions, global warming, climate change, and drought occurrence have intensified the spatial-temporal frequency of SDS events in the region [13,14]. Mismanagement of water, soil, and vegetation resources in different parts of the ME, especially in Iran, Iraq, Syria, and Turkey are recounted as anthropogenic factors affecting the SDS occurrence and intensity over the past few decades [13,15].
Numerous studies have explored the identification of the ME SDS sources, mostly identifying local scale sources in, e.g., Khuzestan [16] and Razavi Khorasan [17] provinces in Southwestern and Northeastern Iran, respectively. Other studies have been conducted on the catchment scale, for instance, the Euphrates River Basin [18], the Central Iran Basin [15], and the Tigris and Euphrates Rivers Basin [19,20]. Rashki et al. 2021 [21] identified and characterized the SDS sources in Iran on a national scale. Some studies such as [22,23,24,25] investigated ME SDS sources on a regional scale. As reported in the literature and by [10], the highest density of SDS sources is in the northern and northwestern parts of Iraq between the Tigris and Euphrates rivers and along the Syrian–Iraqi border. Considering the location of the mountains and the direction of the dominant regional wind (Shamal wind) [26], these sources affect Iraq as well as Iran and Kuwait, in the spring and summer. These sources are generally located in lands with extensive desert cover, low population density, and sparse agriculture along rivers. Iraq, Saudi Arabia, and the Persian Gulf margins, respectively, experience the greatest number of SDS events [10].
SDS occurrence is essentially a function of geographic and hydroclimatic conditions. Therefore, SDS sources located in different geographical regions may have different origins and types. Furthermore, various environmental parameters such as wind speed, evapotranspiration, precipitation, soil physicochemical properties (e.g., soil moisture, texture, and organic matter), vegetation cover, and topography are known as effective SDS drivers [19]. These drivers are interactively involved in the formation of SDS. For instance, water resources affect vegetation cover and are recognized as an essential factor in SDS emission [27]. Water bodies (e.g., rivers, wetlands, and permanent and seasonal lakes) accumulate fine-grained sediments, which are highly susceptible to wind erosion. These erodible lands are so-called “hydrological SDS sources”. As confirmed by the literature, changes in water resources (e.g., Urmia Lake [28,29], Hamoun Lakes [30,31], and Iraq’s lakes and wetlands [13]) have played a key role in the Middle East SDS emission. Therefore, it can be argued that the hydrological cycle parameters (e.g., precipitation, surface runoff, evapotranspiration, soil moisture, river flows, and surface water and groundwater resources [32]) have a determining role in the formation of SDS sources, which calls for further investigations.
A wide range of natural and anthropogenic factors contribute to the formation of SDS sources in the ME [22]. In addition to the identification of SDS sources, discriminating between types of sources is an essential way to adopt mitigation measures. Discrimination and characterization of SDS sources can provide useful information for better understanding and management of this environmental hazard. In this regard, at the basin scale, recently [15] identified SDS sources in Central Iran using remote sensing data and characterized them in terms of their origin. SDS is naturally a highly dynamic phenomenon driven by the large-scale interactions of environmental parameters of Earth’s ecosystems, which highlights the importance of identifying SDS sources at the regional scale. In [22], the authors identified the ME SDS sources and categorized them by their origin on a regional scale using atmospheric aerosol indices. This approach relied on the thresholding of atmospheric aerosol indices, which is not accurate enough and so the location of the identified sources is not entirely reliable.
Remote sensing methods are equipped with special capabilities for spatial-temporal modeling of SDS from the local [15] to global scales [33,34]. Previous studies have developed different approaches for SDS source identification using remote sensing data. They can be in three categories, namely aerosol loading-based [35], spectral indices-based [36], and susceptibility mapping [19]. Some innovative approaches have recently been developed, including the multi-step binary masking approach proposed by [15]. This approach benefits from not only simplicity but also provides more acceptable results considering the inclusion of the main SDS drivers and atmospheric aerosol indices in the modeling process.
Considering the effects of water resources on SDS activity in the Middle East, the main goal of this study is to identify hydrologic SDS sources. To achieve this goal, SDS sources are identified and then categorized based on their origin. Then, the long-term changes in surface and ground water in the hydrologic SDS sources are analyzed.

2. Materials and Methods
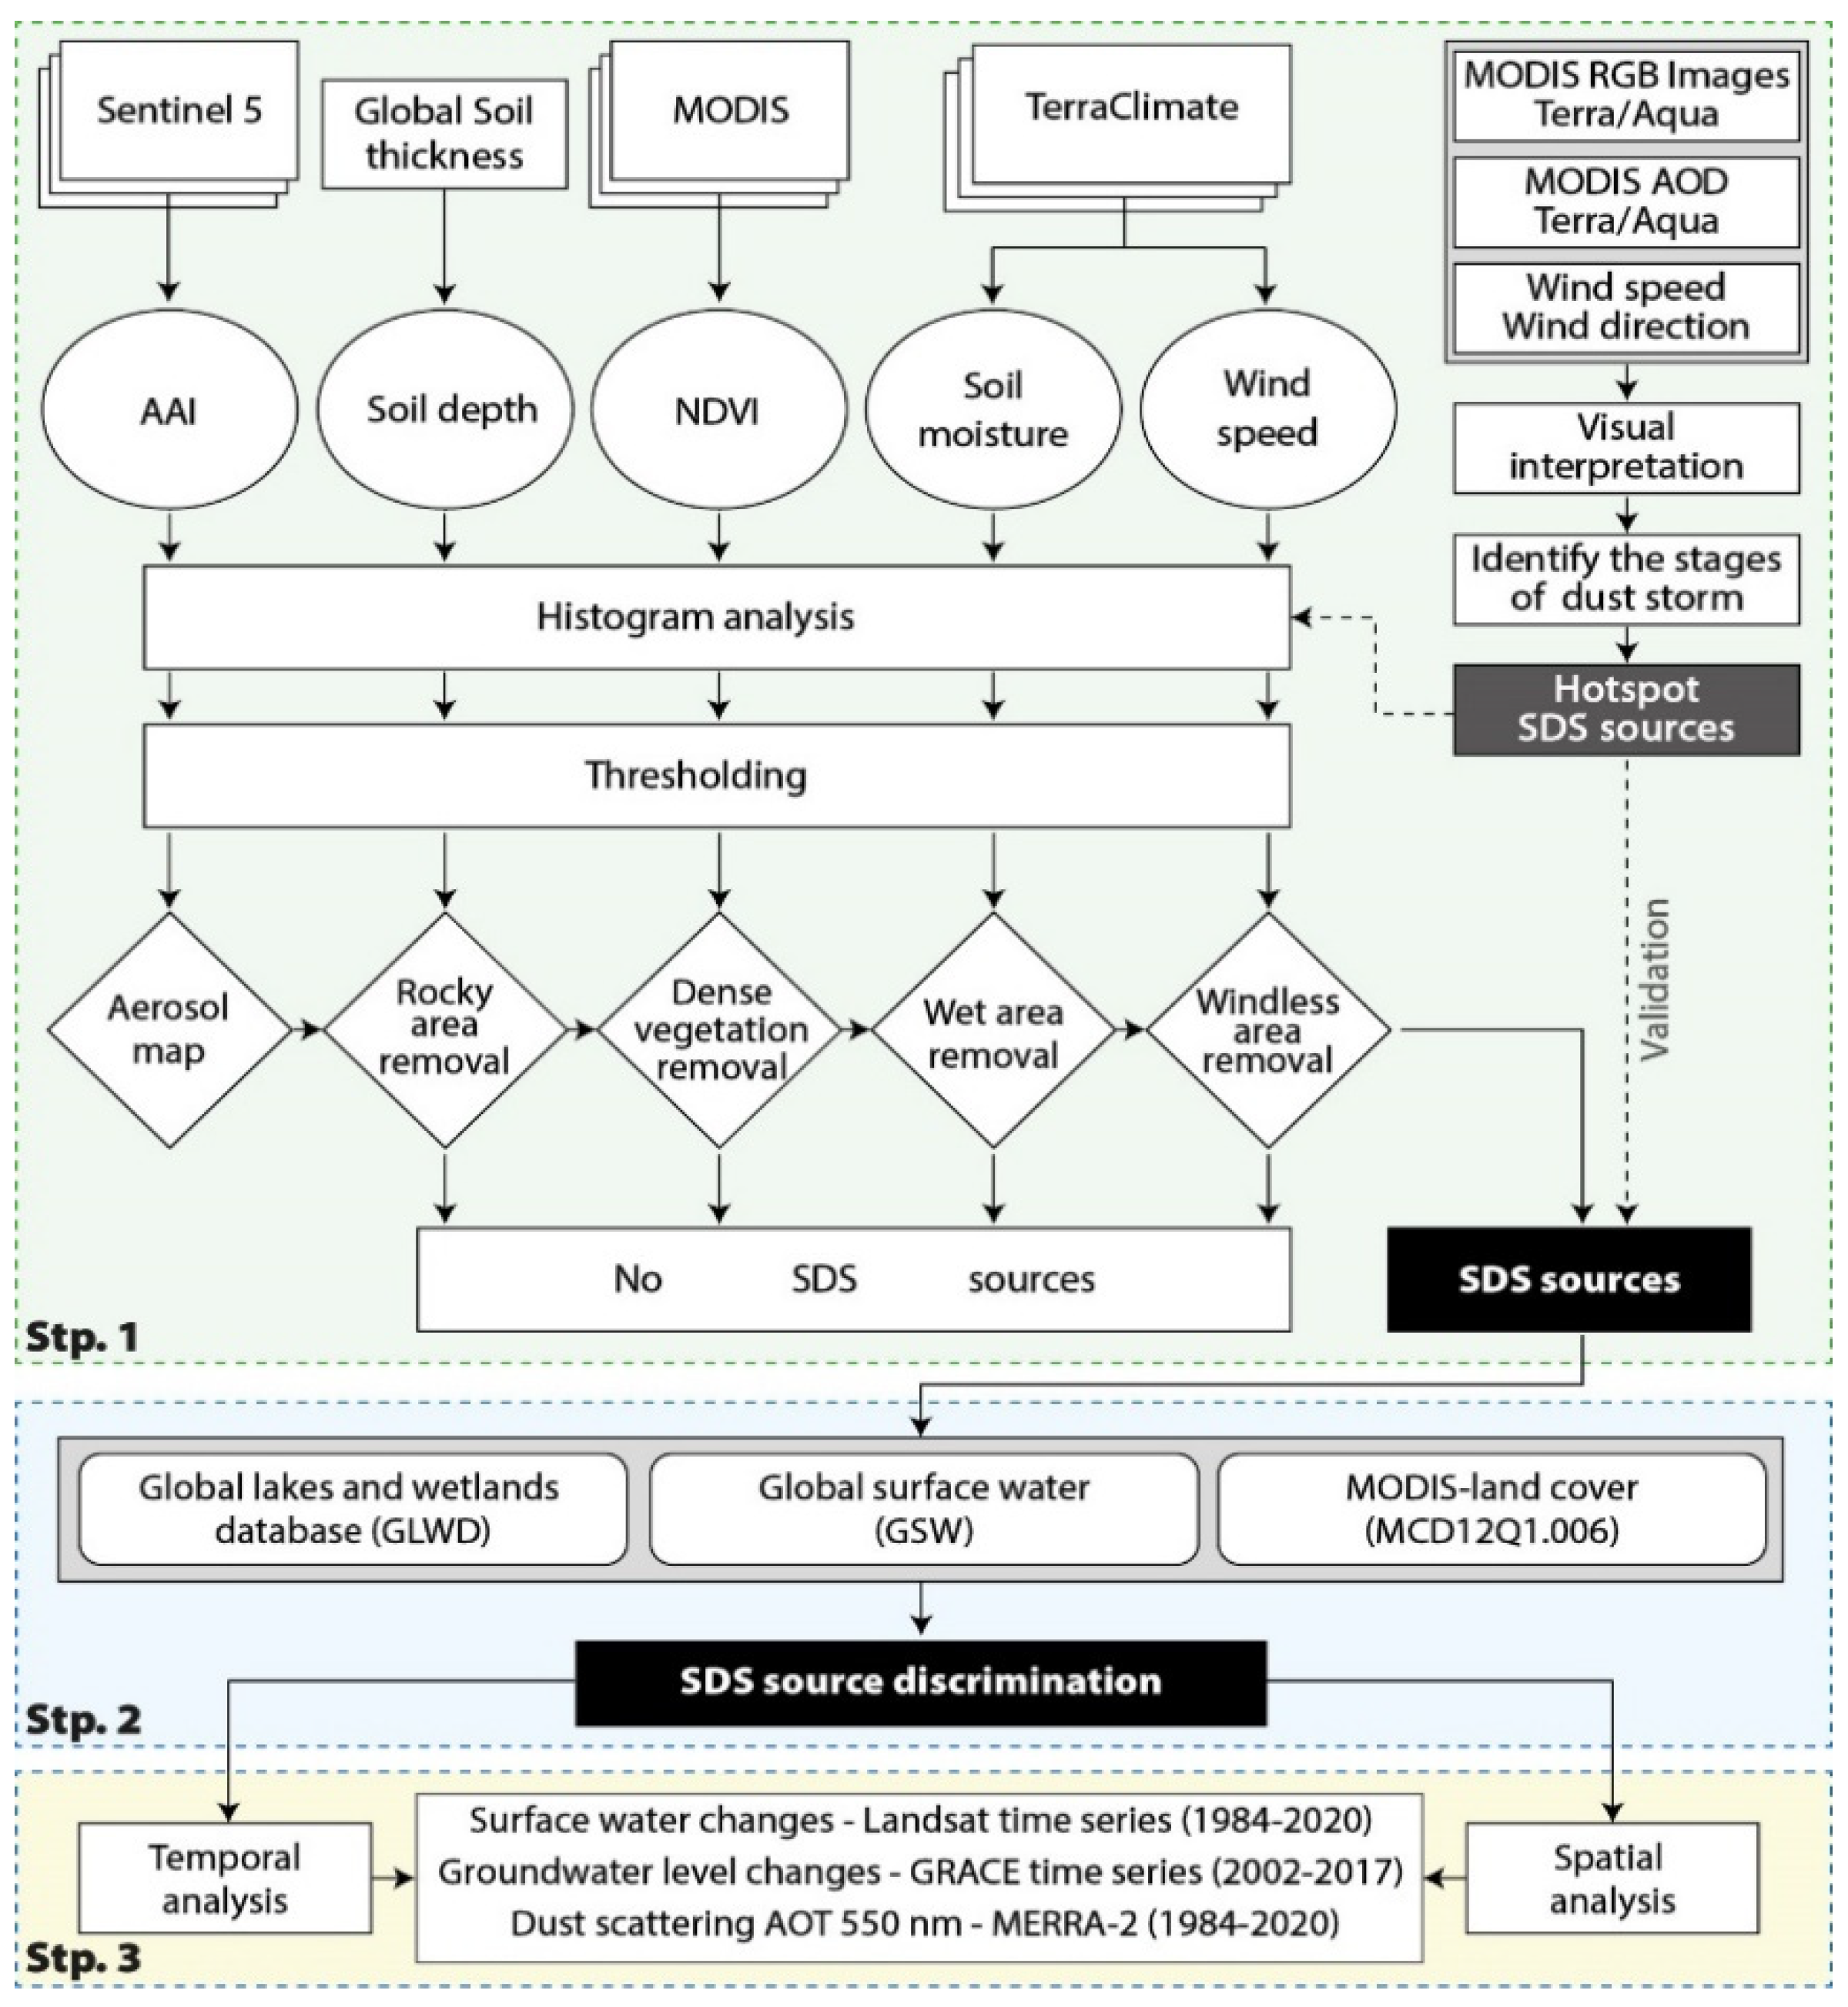
Methodology

As illustrated in Figure 1, the developed methodology to characterize hydrological SDS sources of the Middle East using remote sensing data can be summarized in three main steps. In the first step, SDS sources were identified by using a combination of atmospheric aerosol indices and land surface parameters (e.g., vegetation cover, wind speed, soil moisture, and soil sediment thickness) based on a multi-step masking approach. The second step involved categorizing the identified SDS sources in terms of their origin and type based on different land cover classes. In the final step, focusing on hydrologic SDS sources, spatial-temporal patterns of changes in surface and ground water resources were analyzed.
  • Identifying SDS sources (Stp. 1)
This study used a multi-step binary masking procedure [15] to identify SDS sources in the Middle East. In general, SDS sources are associated with long-term dense atmospheric aerosol content. However, a high aerosol content does not necessarily correspond to an SDS source. As [15] acknowledged, taking advantage of the spatial-temporal patterns of effective environmental parameters (i.e., SDS drivers) in combination with satellite atmospheric aerosol indices in a modeling framework can be useful to improve the accuracy of identified SDS sources. Because in this way, the long-term conditions of the atmosphere and the Earth’s surface are simultaneously considered to identify SDS emission sources. Accordingly, the preliminary SDS sources map was produced using atmospheric aerosol indices. Then, the accurate SDS sources map was generated by accounting for other effective SDS drivers through binary masks.
Sentinel 5 satellite was launched on 13 October 2017, by ESA to perform atmospheric measurements to be used for air quality, ozone, and UV radiation, and climate monitoring and forecasting. By thresholding, the mean absorbing aerosol index (AAI) of the Sentinel 5 (OFFL/L3_AER_AI) in the period from 11 July 2018 to 1 June 2022, the preliminary SDS sources map was generated. AAI is an aerosol index based on wavelength-dependent changes in the UV radiation for a specific wavelength pair (354 and 388 nm) during Rayleigh scattering. It is calculated from the difference between the observed top of the atmosphere reflectance and the modeled reflectance (the theoretical reflectance calculated from an atmosphere with only Rayleigh scattering). Positive values of AAI indicate the existence of UV-absorbing aerosols such as dust and smoke in the atmosphere. Moreover, ozone absorption is extremely low in the wavelengths used to produce the AAI product. Unlike aerosol optical depth (AOD) measurements that are highly affected by cloud cover [37], the AAI can be calculated even in cloudy conditions [38]. The mean AAI map shows the overall spatial patterns of atmospheric aerosol over a four-year period in the study area. An appropriate threshold must be defined to separate SDS from other aerosols when attempting to identify SDS sources using atmospheric aerosol indices [39], since only high atmosphere aerosol content in a region could not be an accurate indicator for identifying the emission sources. Therefore, surface SDS drivers must be considered to identify accurate SDS sources.
To identify SDS sources, it could be assumed that future sources will be created by the same past drivers and conditions [17]. Various environmental parameters play a role in the formation of SDS sources [40]. There is no specific rule for choosing these drivers [17]. In this study, the most important drivers including vegetation status, wind speed, soil moisture, and soil sediment thickness, which are mainly employed in the literature, were considered. Accordingly, MODIS 16-day normalized difference vegetation index (NDVI) (1 km spatial resolution) (MOD13A2.v006), TerraClimate monthly average 10 m wind speed and monthly soil moisture (4 km) [41], and global 1 km gridded thickness of soil [42] were used as SDS drivers. The 4-years mean maps (11 July 2018 to 1 June 2022) were obtained for all parameters except for soil thickness. There are four main stages in SDS formation from an emission source: start, maximum lifting, cutoff, and dispersion. Satellite imagery can be used to identify SDS sources with high accuracy in the initial stages (start and maximum lifting) via visual interpretation. By creating a color composite image (RGB), SDS events and their emission sources can be discriminated from other phenomena in the satellite image through image interpretation keys, including shape, size, pattern, tone, texture, etc. Based on the approach proposed by [19], a total of 1014 SDS hotspots were identified via visual interpretation of MODIS-Terra/Aqua sub-daily true-color composite images (RGB143) from 2018 to 2022 (Figure 2). Here, 70% of SDS hotspots were used as training samples for histogram analysis and determining appropriate thresholds for generating preliminary SDS sources maps and binary masks from SDS drivers. Histogram slicing and thresholding were performed based on the histograms of SDS drivers in hotspots. The appropriate thresholds were determined at the 99% confidence interval, and values outside this interval were assumed to be errors or outliers. Accordingly, the maps of SDS drivers were separated into two binary classes 0 (no SDS) and 1 (SDS). In the next step, the bitmaps were masked from the preliminary SDS sources to obtain the accurate SDS sources map, which was validated using the remaining 30% of SDS hotspots.
  • SDS Source Discrimination (Stp. 2)
The global lakes and wetlands database (GLWD), global surface water (GSW), and MODIS-land cover 2020 map (MCD12Q1.006) were used to attribute the identified SDS sources to the land cover type and surface conditions. GLWD is obtained from an aggregation of the best maps, data, and information available for global-scale lakes and wetlands using GIS functions [43]. GSW was produced using the time series of Landsat 5, 7, and 8 images from 16 March 1984 to 31 December 2020. Each pixel is classified into water and no-water classes using an expert system. The monthly GSW data available from 1984–2020 are applicable to change detection purposes [44]. The change detection map demonstrates the spatial-temporal pattern of changes in surface water. This makes it possible to identify intermittent lakes and wetlands and discriminate the corresponding SDS sources.
The identified sources were discriminated in terms of origin by overlaying the SDS sources map on different land cover classes. Ephemeral water bodies (wetlands, lakes, and rivers) contribute to SDS emissions [13]. Therefore, GLWD and GSW products were used to discriminate hydrologic SDS sources. Here, hydrologic SDS sources correspond to the margins and beds of permanent, seasonal, and dried lakes, wetlands, and rivers. Coastal SDS sources were discriminated by proximity analysis based on shorelines.
  • Surface and ground water changes (Stp. 3)
Surface and ground water resources in hydrologic SDS sources were analyzed through Landsat and Gravity Recovery and Climate Experiment (GRACE) satellite data. The normalized difference water index (NDWI) [45] based on Landsat 5, 7, and 8 data from 1984 to 2022 was used to extract surface water and assess their spatial-temporal changes. In this index, values greater than zero are assumed as water [45].
Monitoring of the groundwater changes based on GRACE data was performed through three products from different data processing centers, namely CSR (UT Center for Space Research), GFZ (GeoForschungsZentrum Potsdam), and JPL (NASA Jet Propulsion Laboratory) [46]. These centers are part of the GRACE Ground System and produce the level 2 data used in this dataset. The values of these three products are slightly different. Therefore, the average of these products from April 2002 to July 2017 was used to detect the spatial-temporal changes in the underground water level.

3. Results

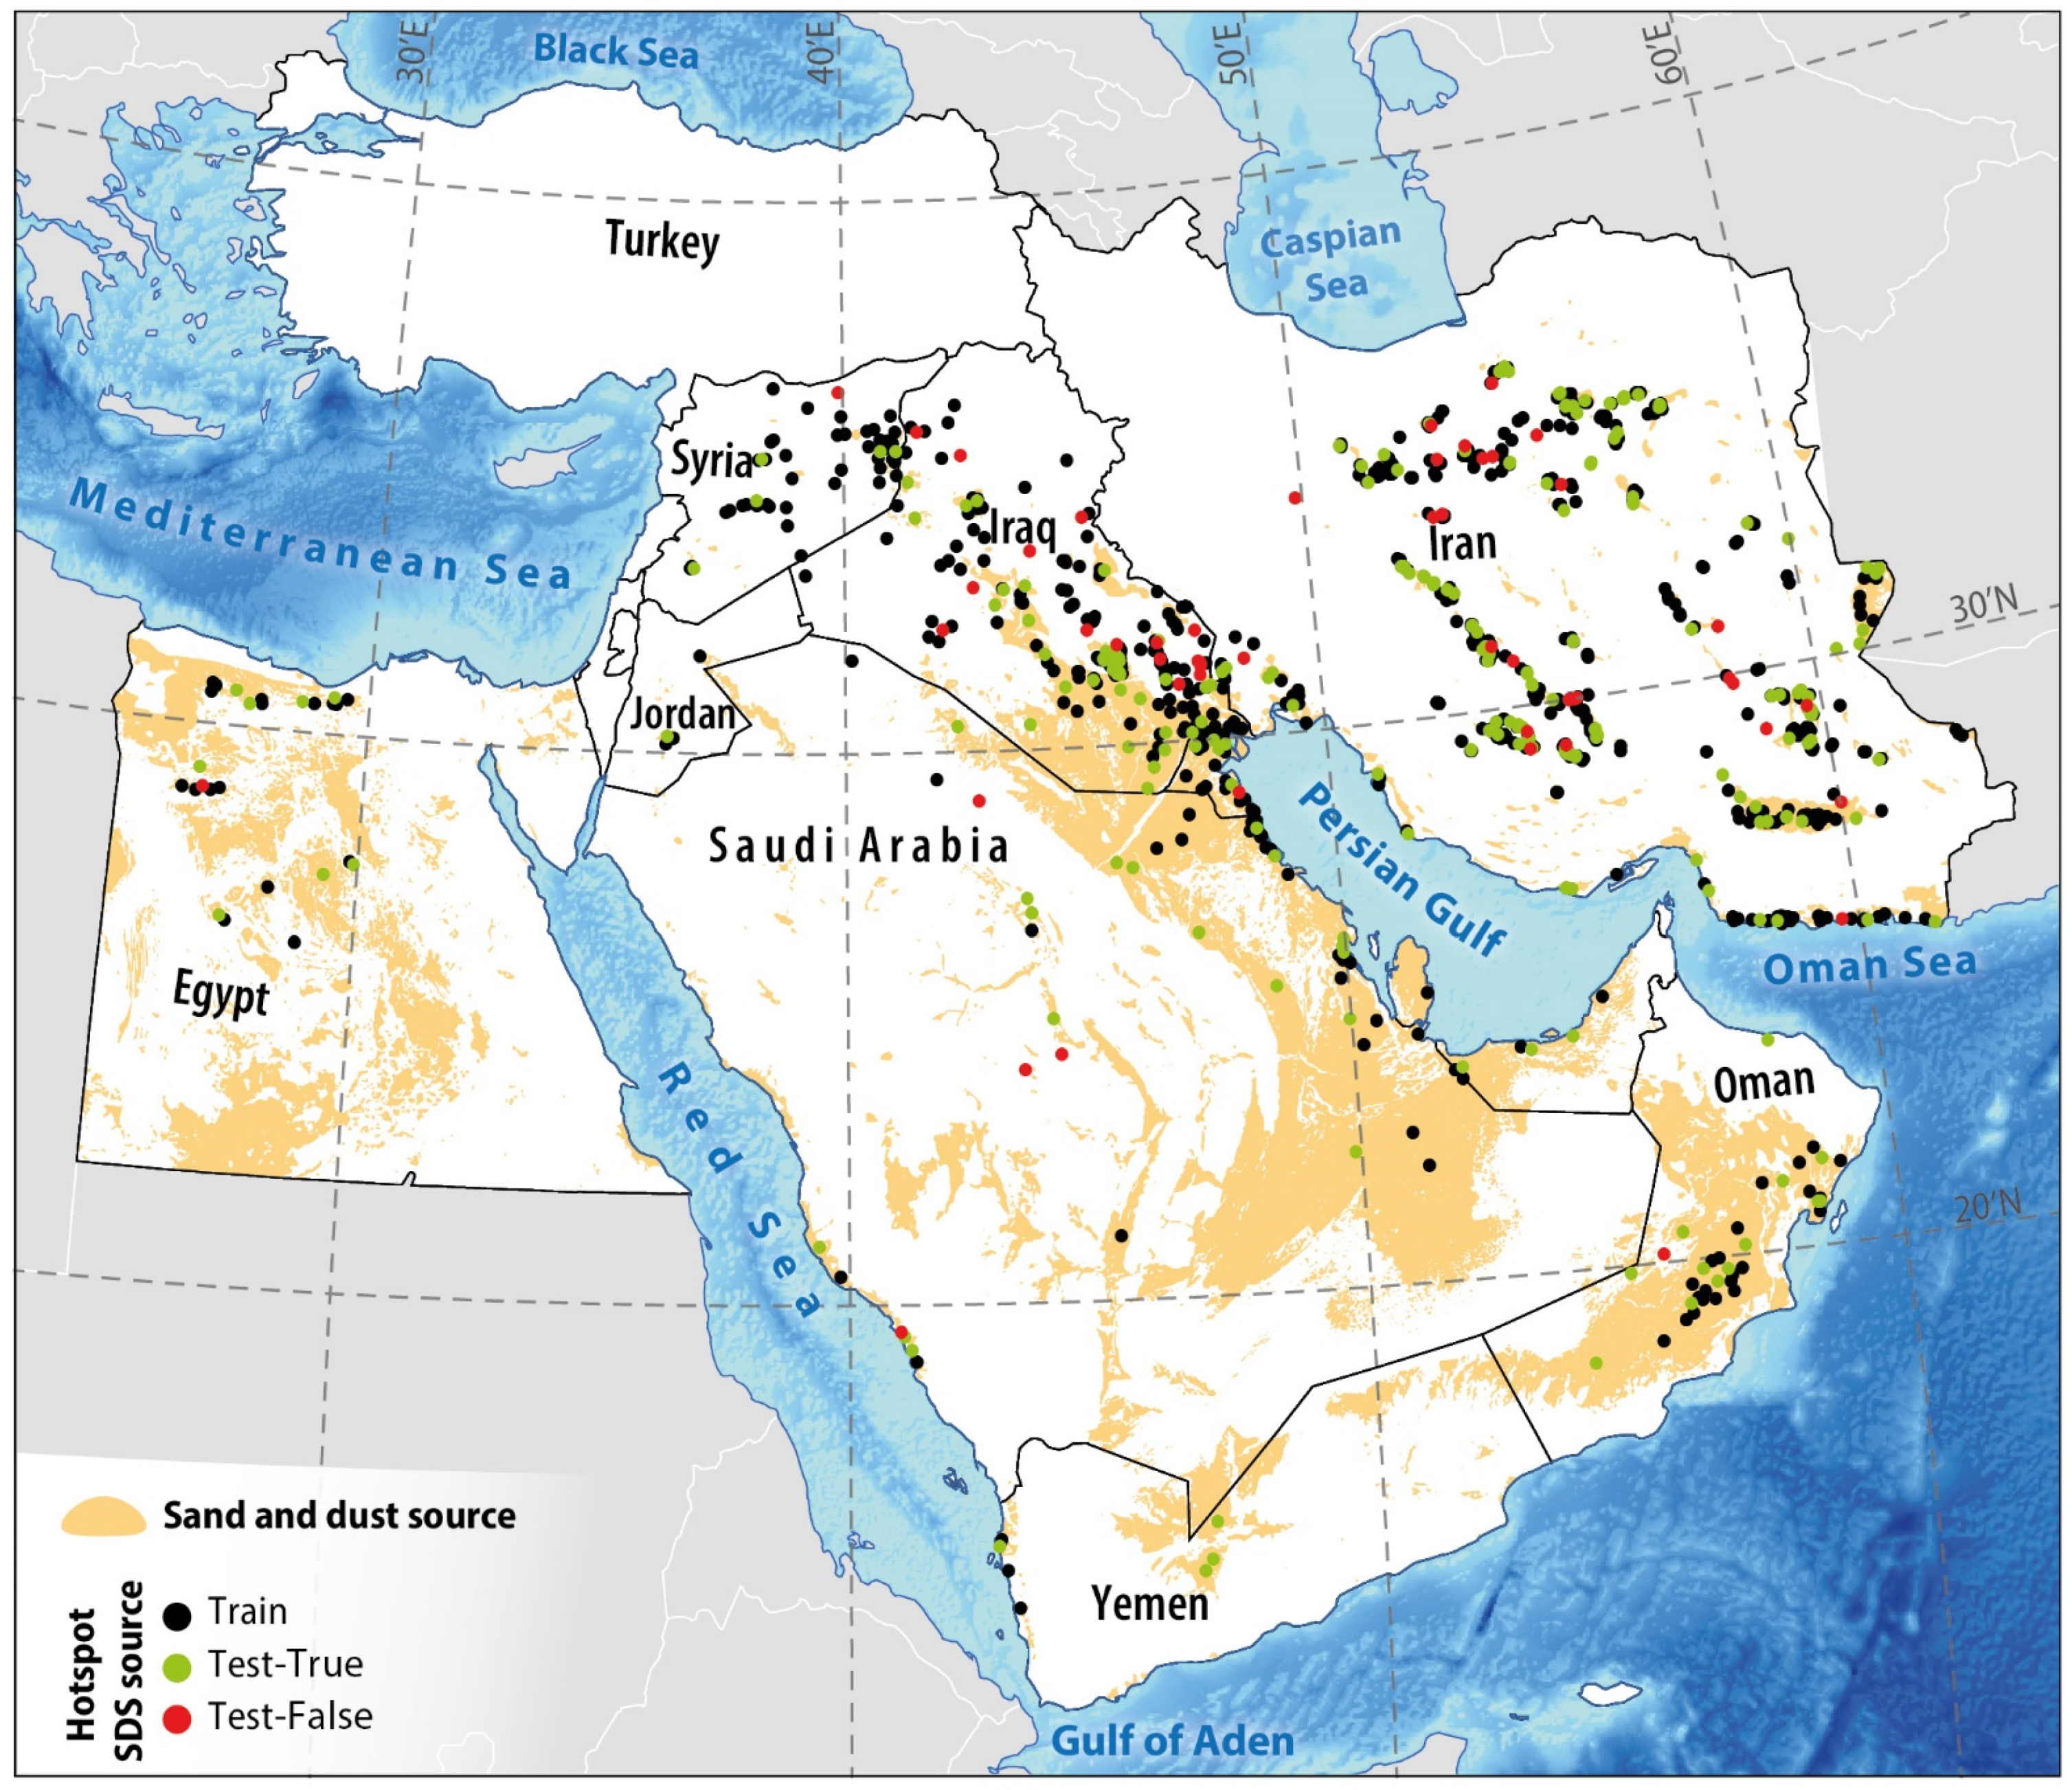
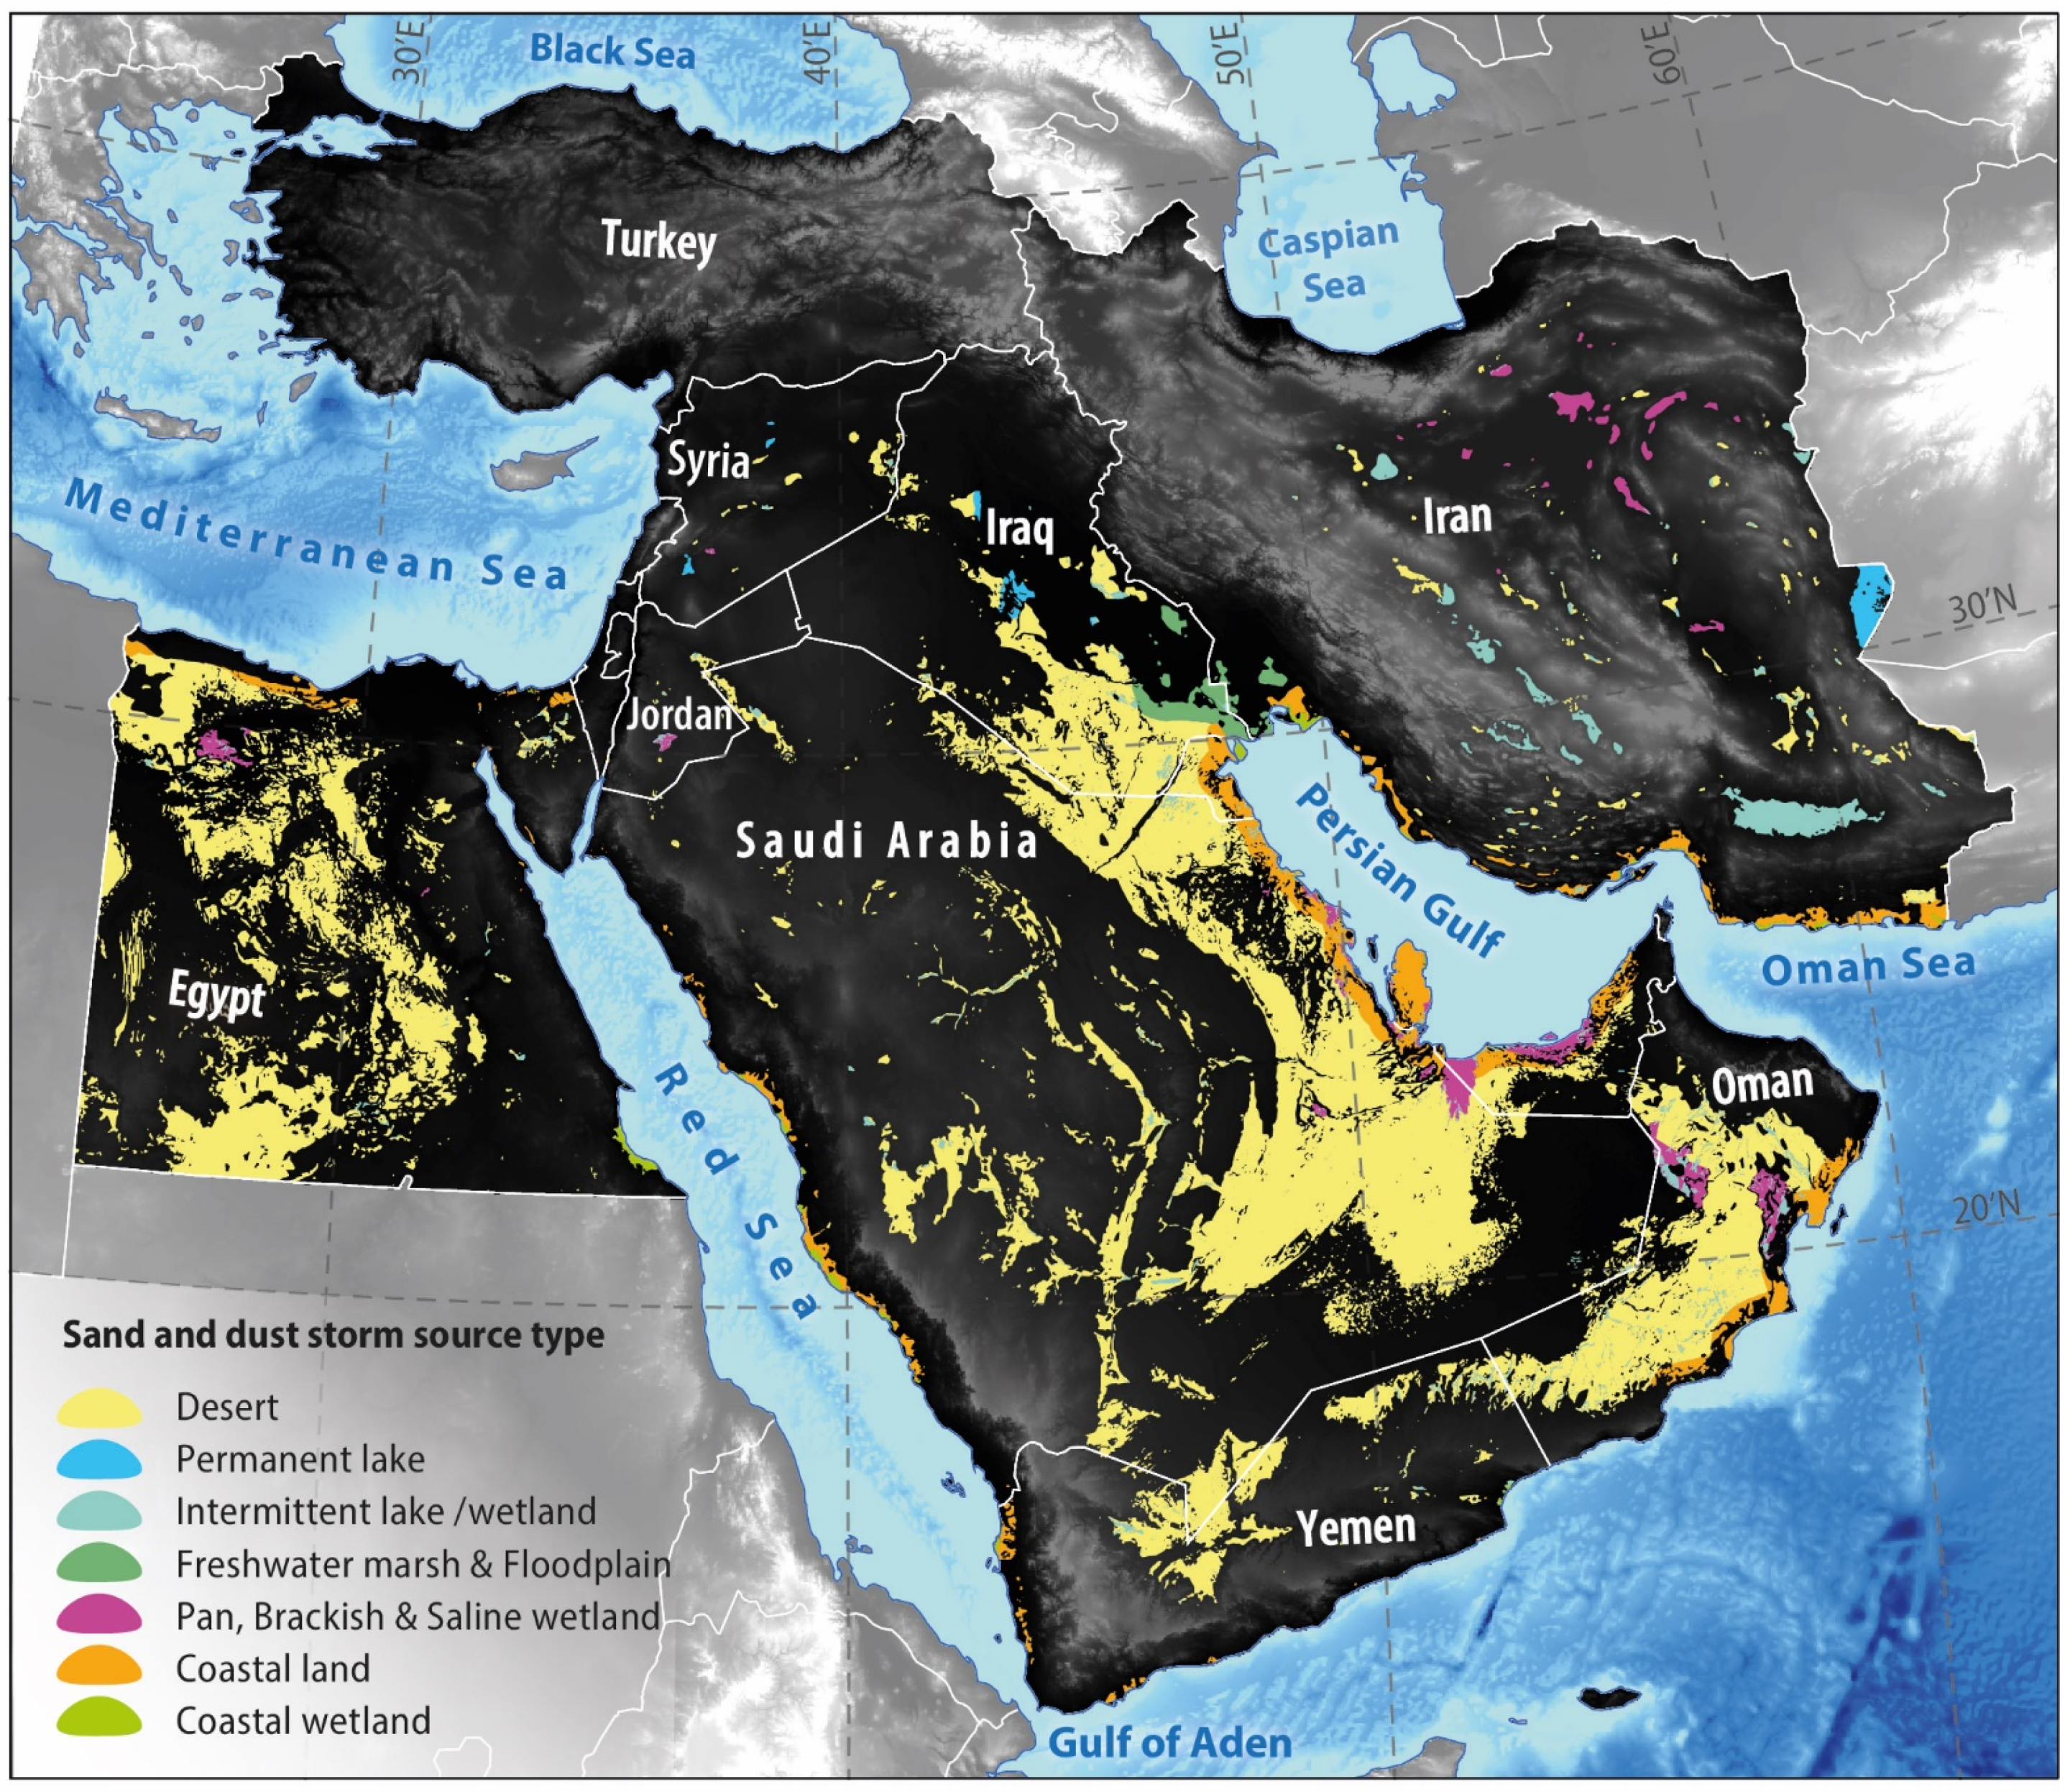
3.1. Identification and Attribution of SDS Sources

Histogram analysis based on reference SDS hotspots (Figure 2) was performed and the thresholds of 0, 0.15, 2.7 m/s, 5 mm, and 3 m at a 95% confidence level were determined for AAI, NDVI, wind speed, soil moisture, and soil thickness, respectively. Based on the thresholding of the average AAI map, a preliminary SDS sources map was produced for the Middle East. The binary masks of SDS drivers were then multiplied in the preliminary SDS sources map to obtain the accurate SDS sources (Figure 2). By using the reference SDS hotspots, the overall accuracy of the SDS sources map was obtained at 82.6%, which shows the reliability of the results. The green dots (Figure 2) are SDS hotspots that correspond correctly to the identified SDS sources. In contrast, the red dots are incorrectly identified as SDS sources. Despite the acceptable accuracy, it is worth noting that uncertainty is an inevitable part of modeling process. However, the precise amount for each independent parameter is unknown. Nevertheless, the accuracy assessment shows the overall uncertainty (17.4%) imposed on the model by the input parameters. Finally, the SDS sources were categorized into seven groups in terms of origin and type (Figure 3).
Table 1 shows the area of identified SDS sources by type and country. The largest and smallest sources corresponded to the desert (~79.1%) and coastal wetland (~0.9%), respectively. Saudi Arabia hosted the largest SDS sources (~41%) in the Middle East.
According to Figure 3, hydrologic SDS sources include permanent lake, intermittent lake/wetland, and freshwater marsh & floodplain classes. Coastal wetlands are also considered SDS sources with a hydrological origin. They are not highly affected by human activities and climatic events (e.g., drought) since they can benefit from seawater, unlike other hydrologic sources. Therefore, coastal wetlands were considered independently in this study. In terms of area, in total, hydrologic SDS sources cover 8.4% of the ME, of which the largest area (~5.9%) is corresponding to intermittent lake/wetland (Table 1). Intermittent lake/wetland SDS sources were identified in all countries listed in Table 1 with the largest area belonging to Iran (~41%). Meanwhile, permanent lake SDS sources were observed only in Iran (~68%), Iraq (~26%), and Syria (~6%). Freshwater marsh & floodplain sources were observed only in Iraq (~77%) and Iran (~23%). Overall, Iran (41%), Iraq (21%), Oman (14%), and Saudi Arabia (13%) have the largest area of hydrologic SDS sources (Table 1). Sources in Oman and Saudi Arabia correspond to only the intermittent lake/wetland class.

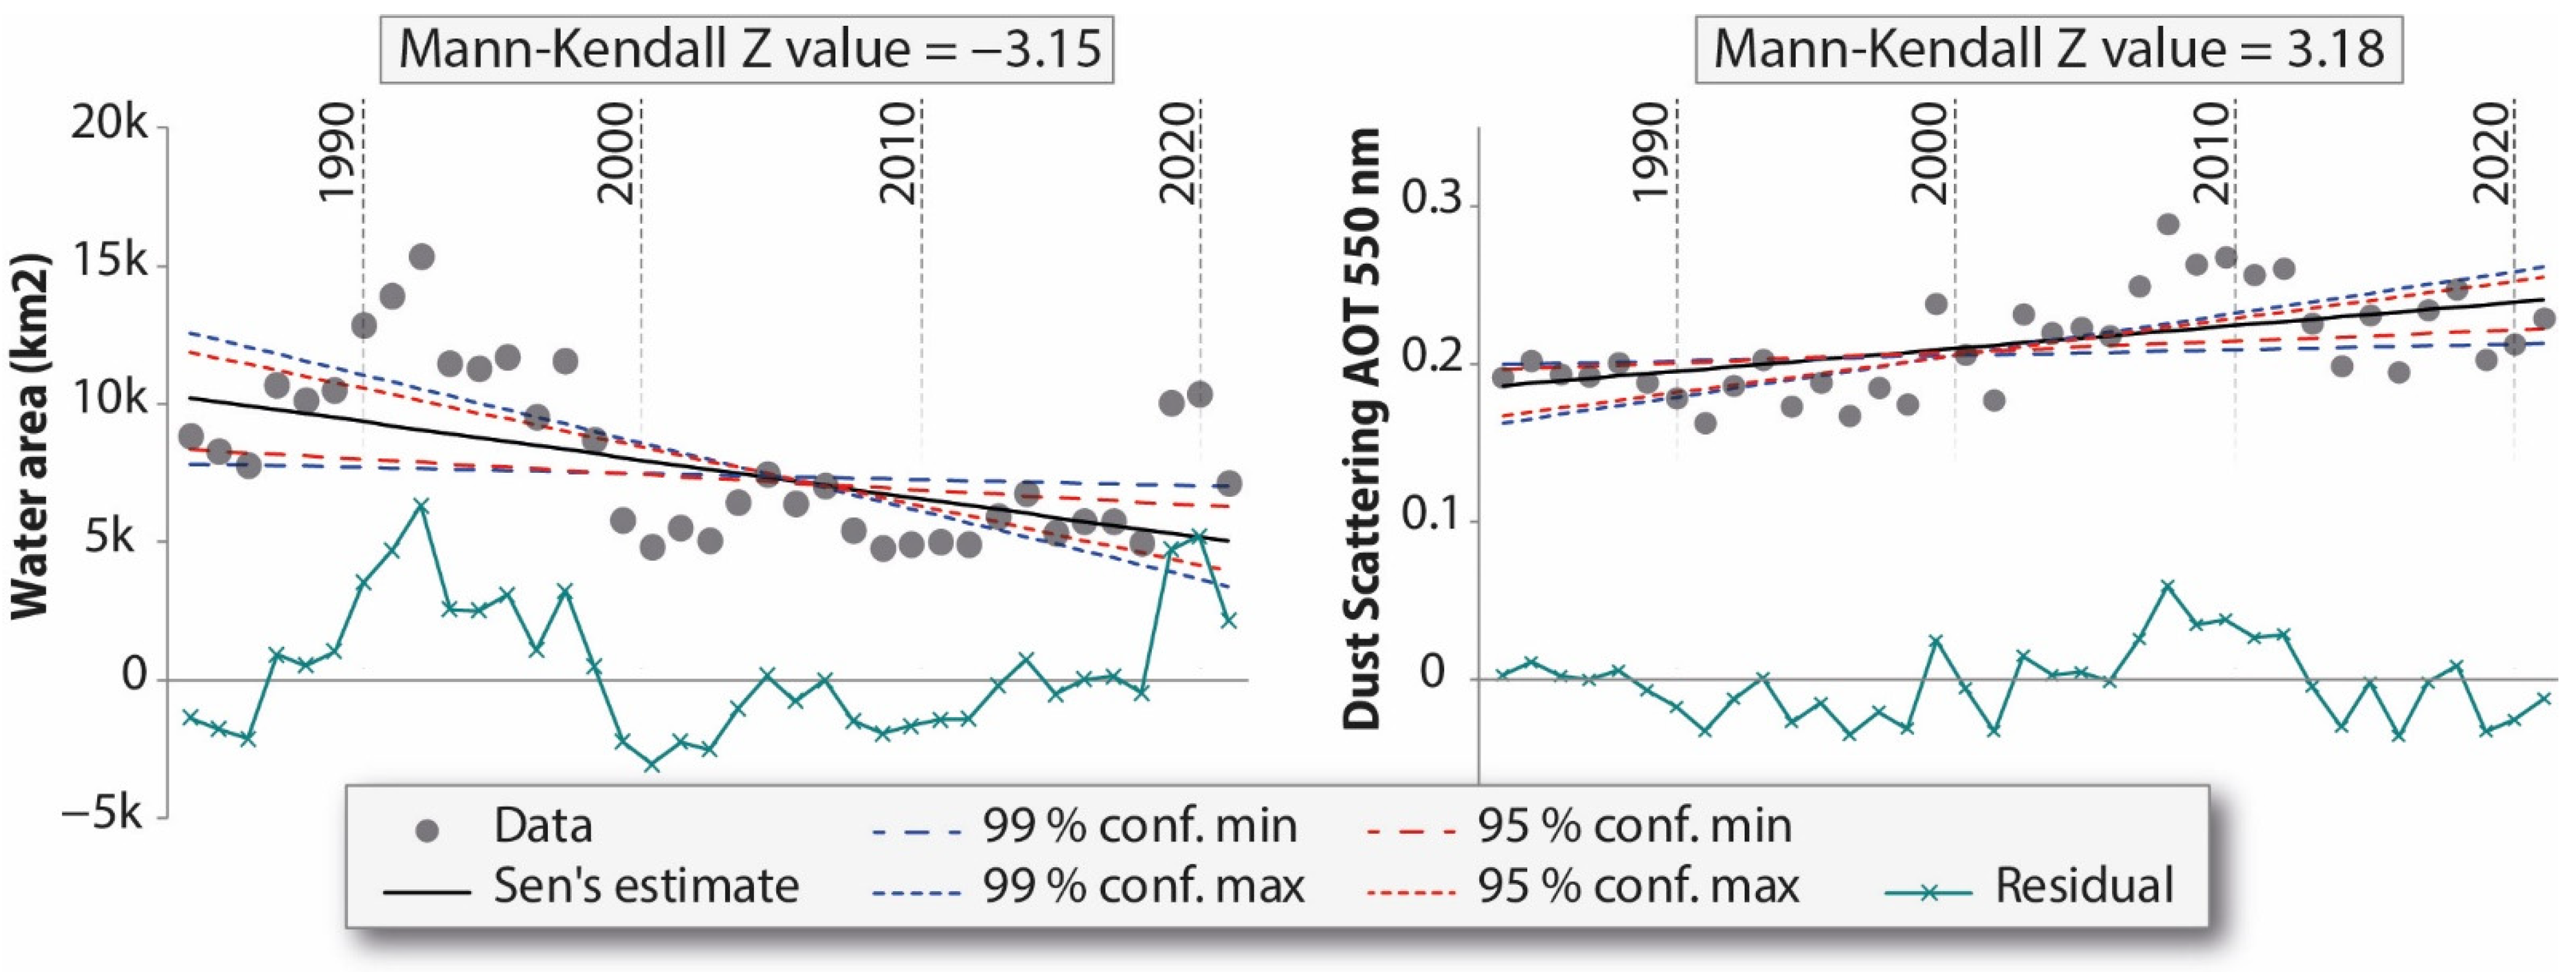
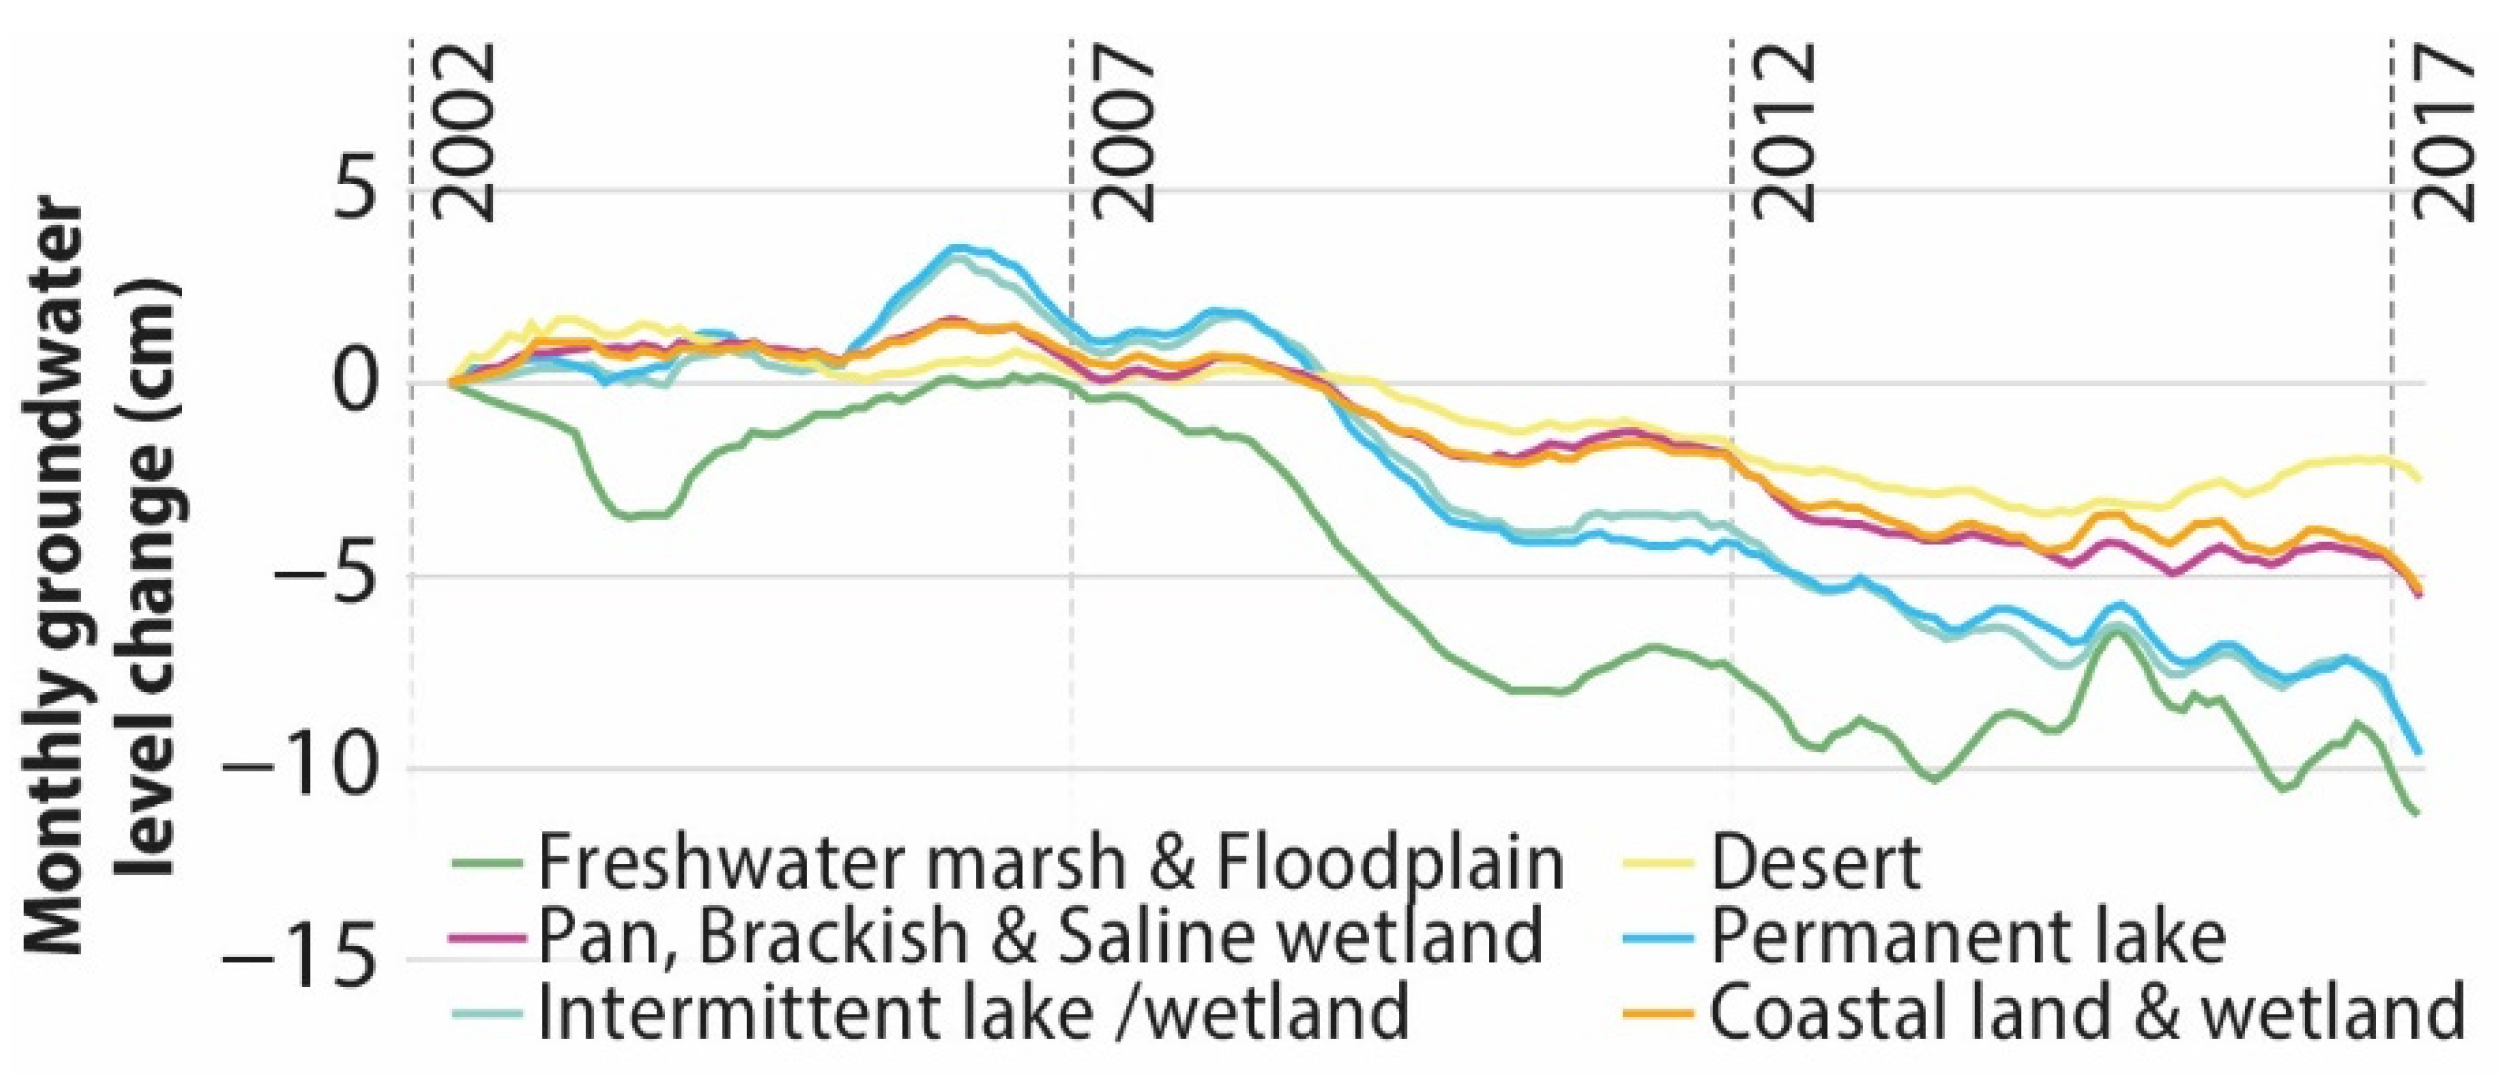
3.2. Temporal Analysis of Surface and Ground Water Changes in Hydrologic SDS Sources

The temporal pattern of water area changes in the ME lakes and wetlands was extracted using the long-term data archive (1984–2022) of Landsat 5, 7, and 8 satellites (Figure 4). The temporal pattern of SDS in the same period was obtained using the reanalysis MERRA-2 dust scattering AOT 550 nm, monthly 0.5 × 0.625 deg product (Figure 4).
As shown in Figure 4a,c, the lakes generally had an increasing trend before 2000 and a decreasing trend after 2000. The first drop in the lakes area occurred in the 2000–2001 period. The second drop can be seen from 2007 onwards, which continued nearly until 2012. Disregarding the seasonal changes, Mesopotamian wetlands exhibited an almost steady trend in the pre-2000 period (Figure 4b). Still, a decreasing trend can be seen since the 1990s, with the highest reduction observed in 2001. From 2003 to 2007, there has been a moderate increasing trend, which again reversed after this period. The second sharp drop occurred in 2008–2009 period and continued until 2012. A sharp and sudden increase can be seen after 2019 in Iran and Iraq due to the increase in rainfall and floods [47].
Dust scattering AOT temporal pattern shows a smaller change in the pre-2000 compared to the post-2000 period. In terms of seasonal patterns, extreme peaks can be seen after 2000, especially in spring and summer (brown graph in Figure 4). Regardless of seasonal changes, as indicated by the dust-scattering AOT moving average (black graph in Figure 4), SDS has increased by an average of 18.4% since 2000.
The correlation between changes in water bodies and SDS was calculated at −0.72, −0.64, and −0.39 for Iraqi lakes, Mesopotamian wetlands, and Hamoun Lake, respectively. Negative values indicate an inverse correlation between water body changes and SDS. The correlation is high for Iraqi lakes and Mesopotamian wetlands while it is low for Hamoun Lake. The correlation analysis showed an inverse but not very strong relationship between the area of water bodies and SDS emission.
Figure 5 shows the Mann–Kendall test for trend analysis of surface water area and dust scattering AOT. Where the z-value equal to −3.15 indicates that surface water has experienced a decreasing trend, while 3.18 for dust scattering AOT shows an increasing trend. These findings are approved by the Sen’s estimate lines of both graphs.
Figure 6 shows the temporal pattern of monthly changes in the groundwater level using GRACE data for SDS sources. The temporal signals of groundwater level changes in SDS sources indicate a high correlation. Accordingly, all SDS sources, except for freshwater marsh & floodplain, had an almost identical temporal change pattern, but their levels of change are different. Overall, a clear decreasing trend can be seen in the groundwater level of the ME SDS sources since 2008. The highest negative changes occurred in hydrologic SDS sources, particularly in freshwater marsh & floodplains. The least changes were observed in desert sources.

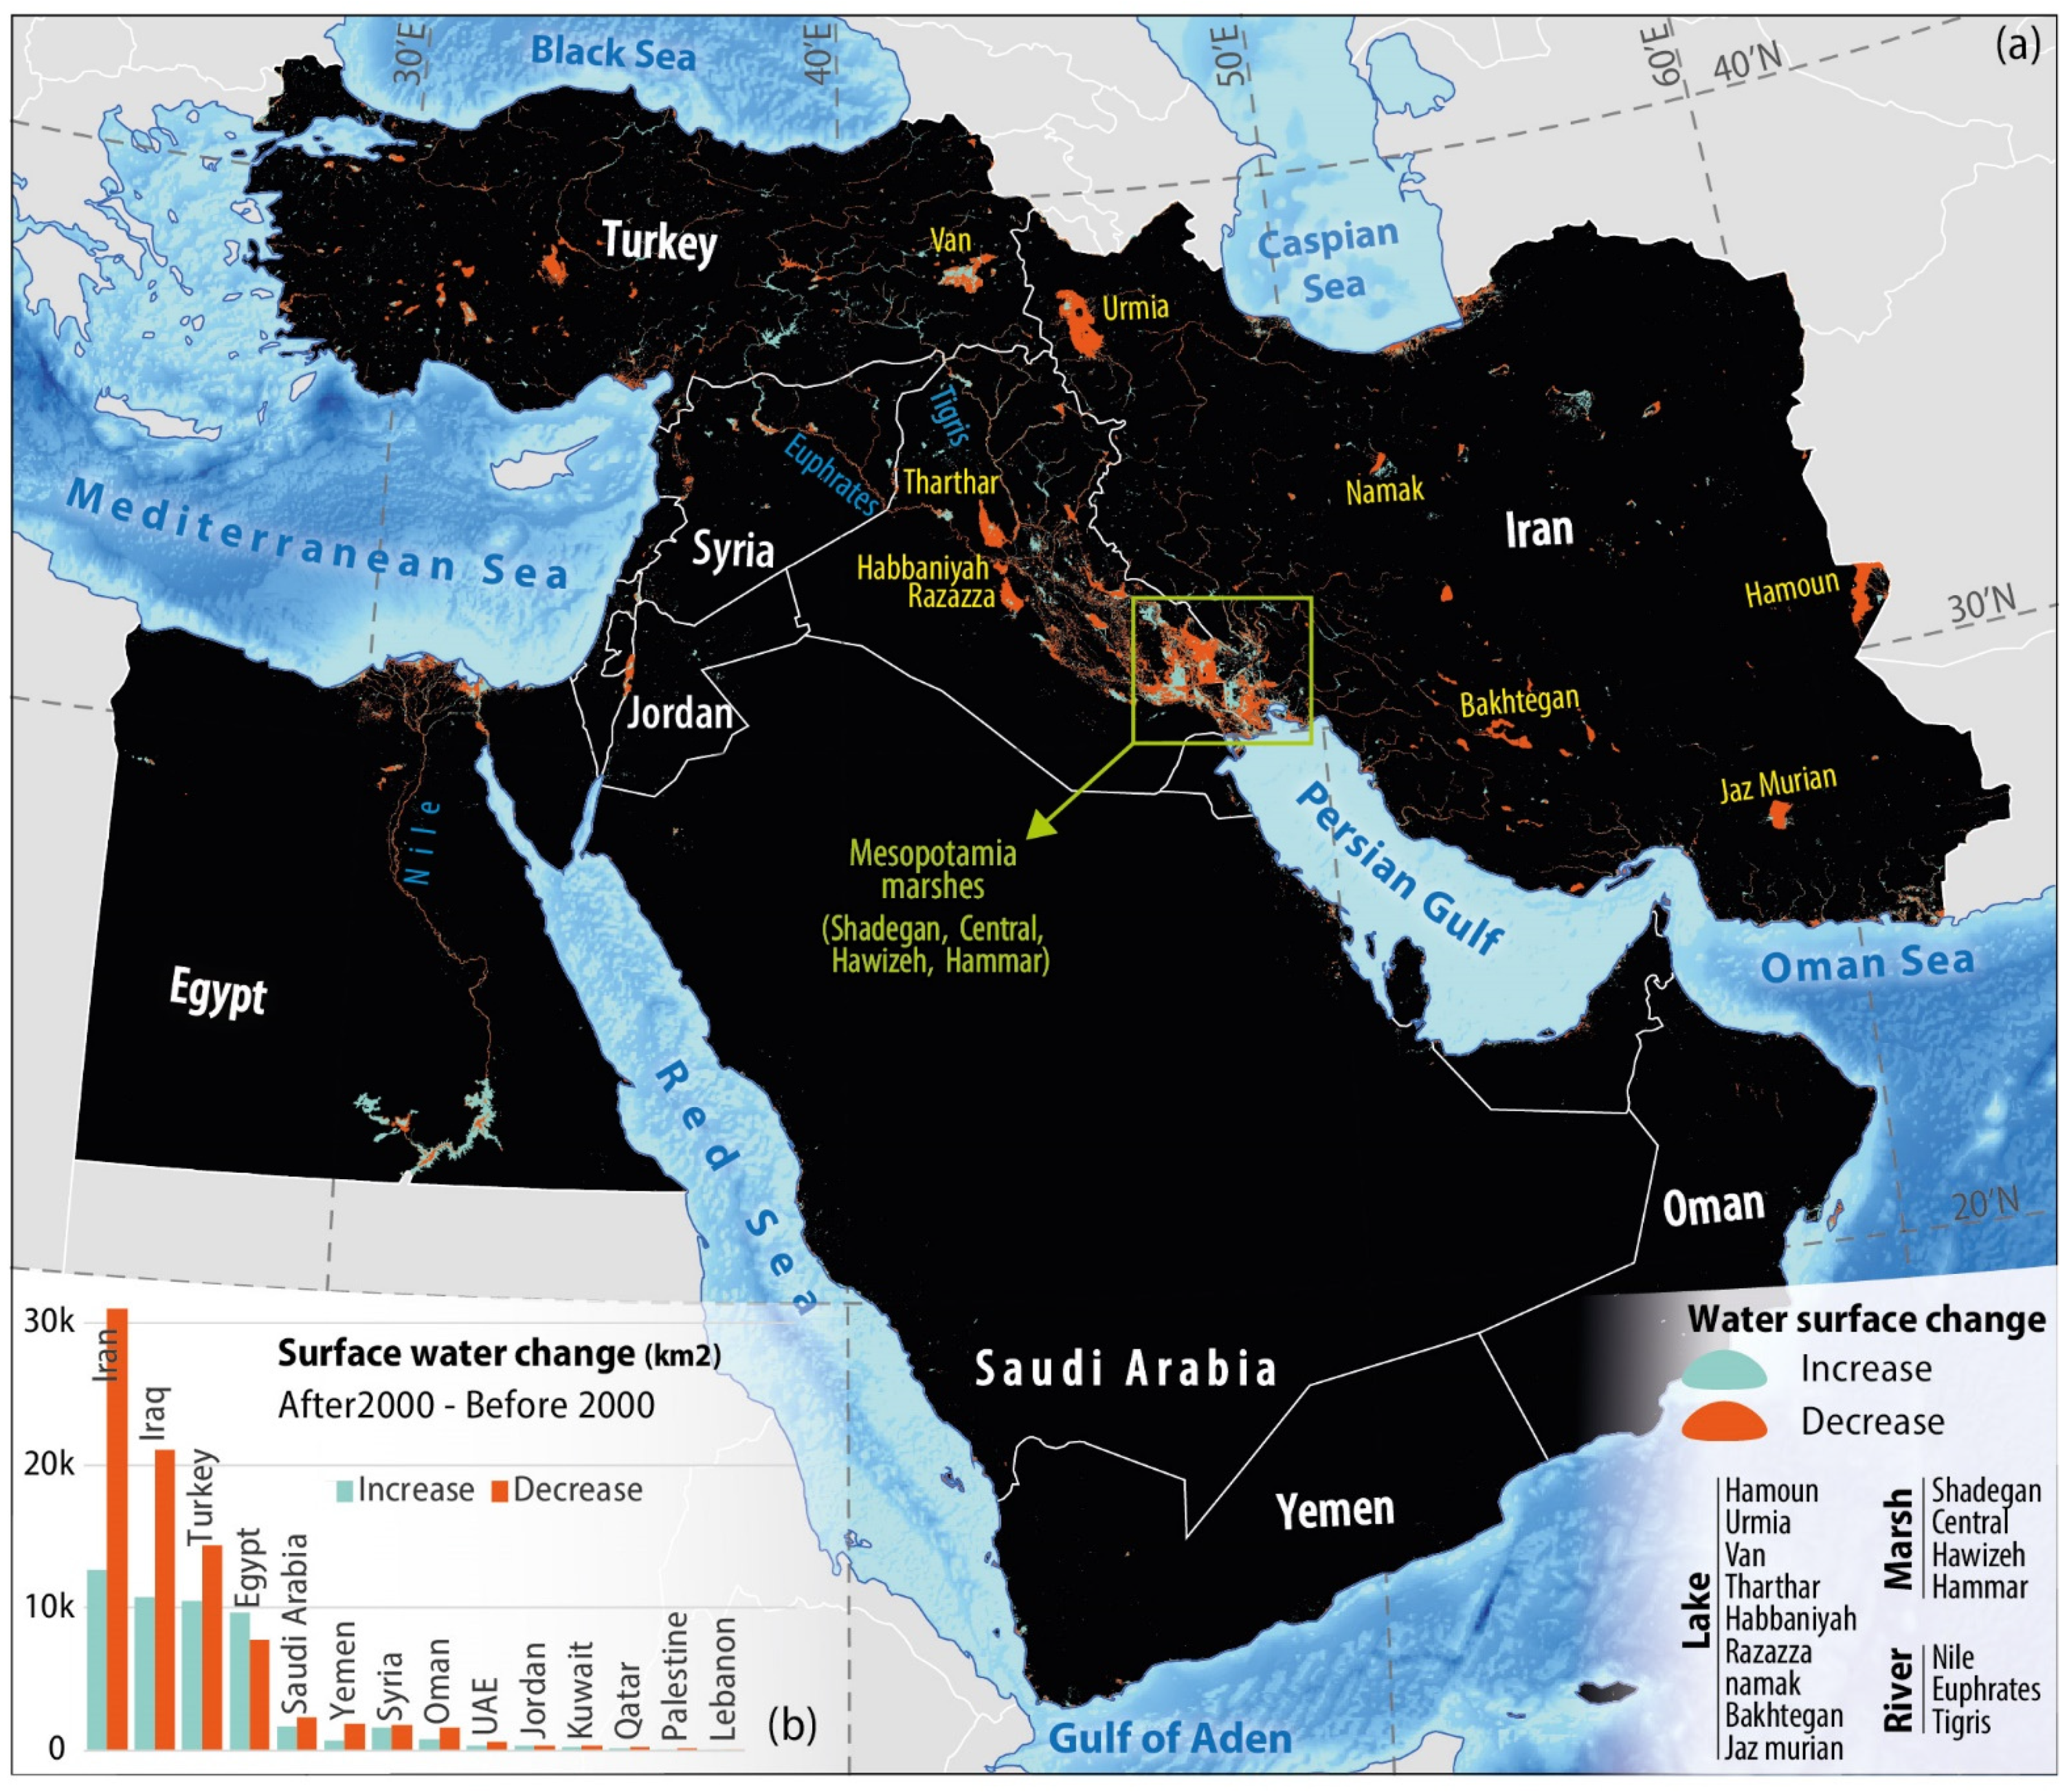
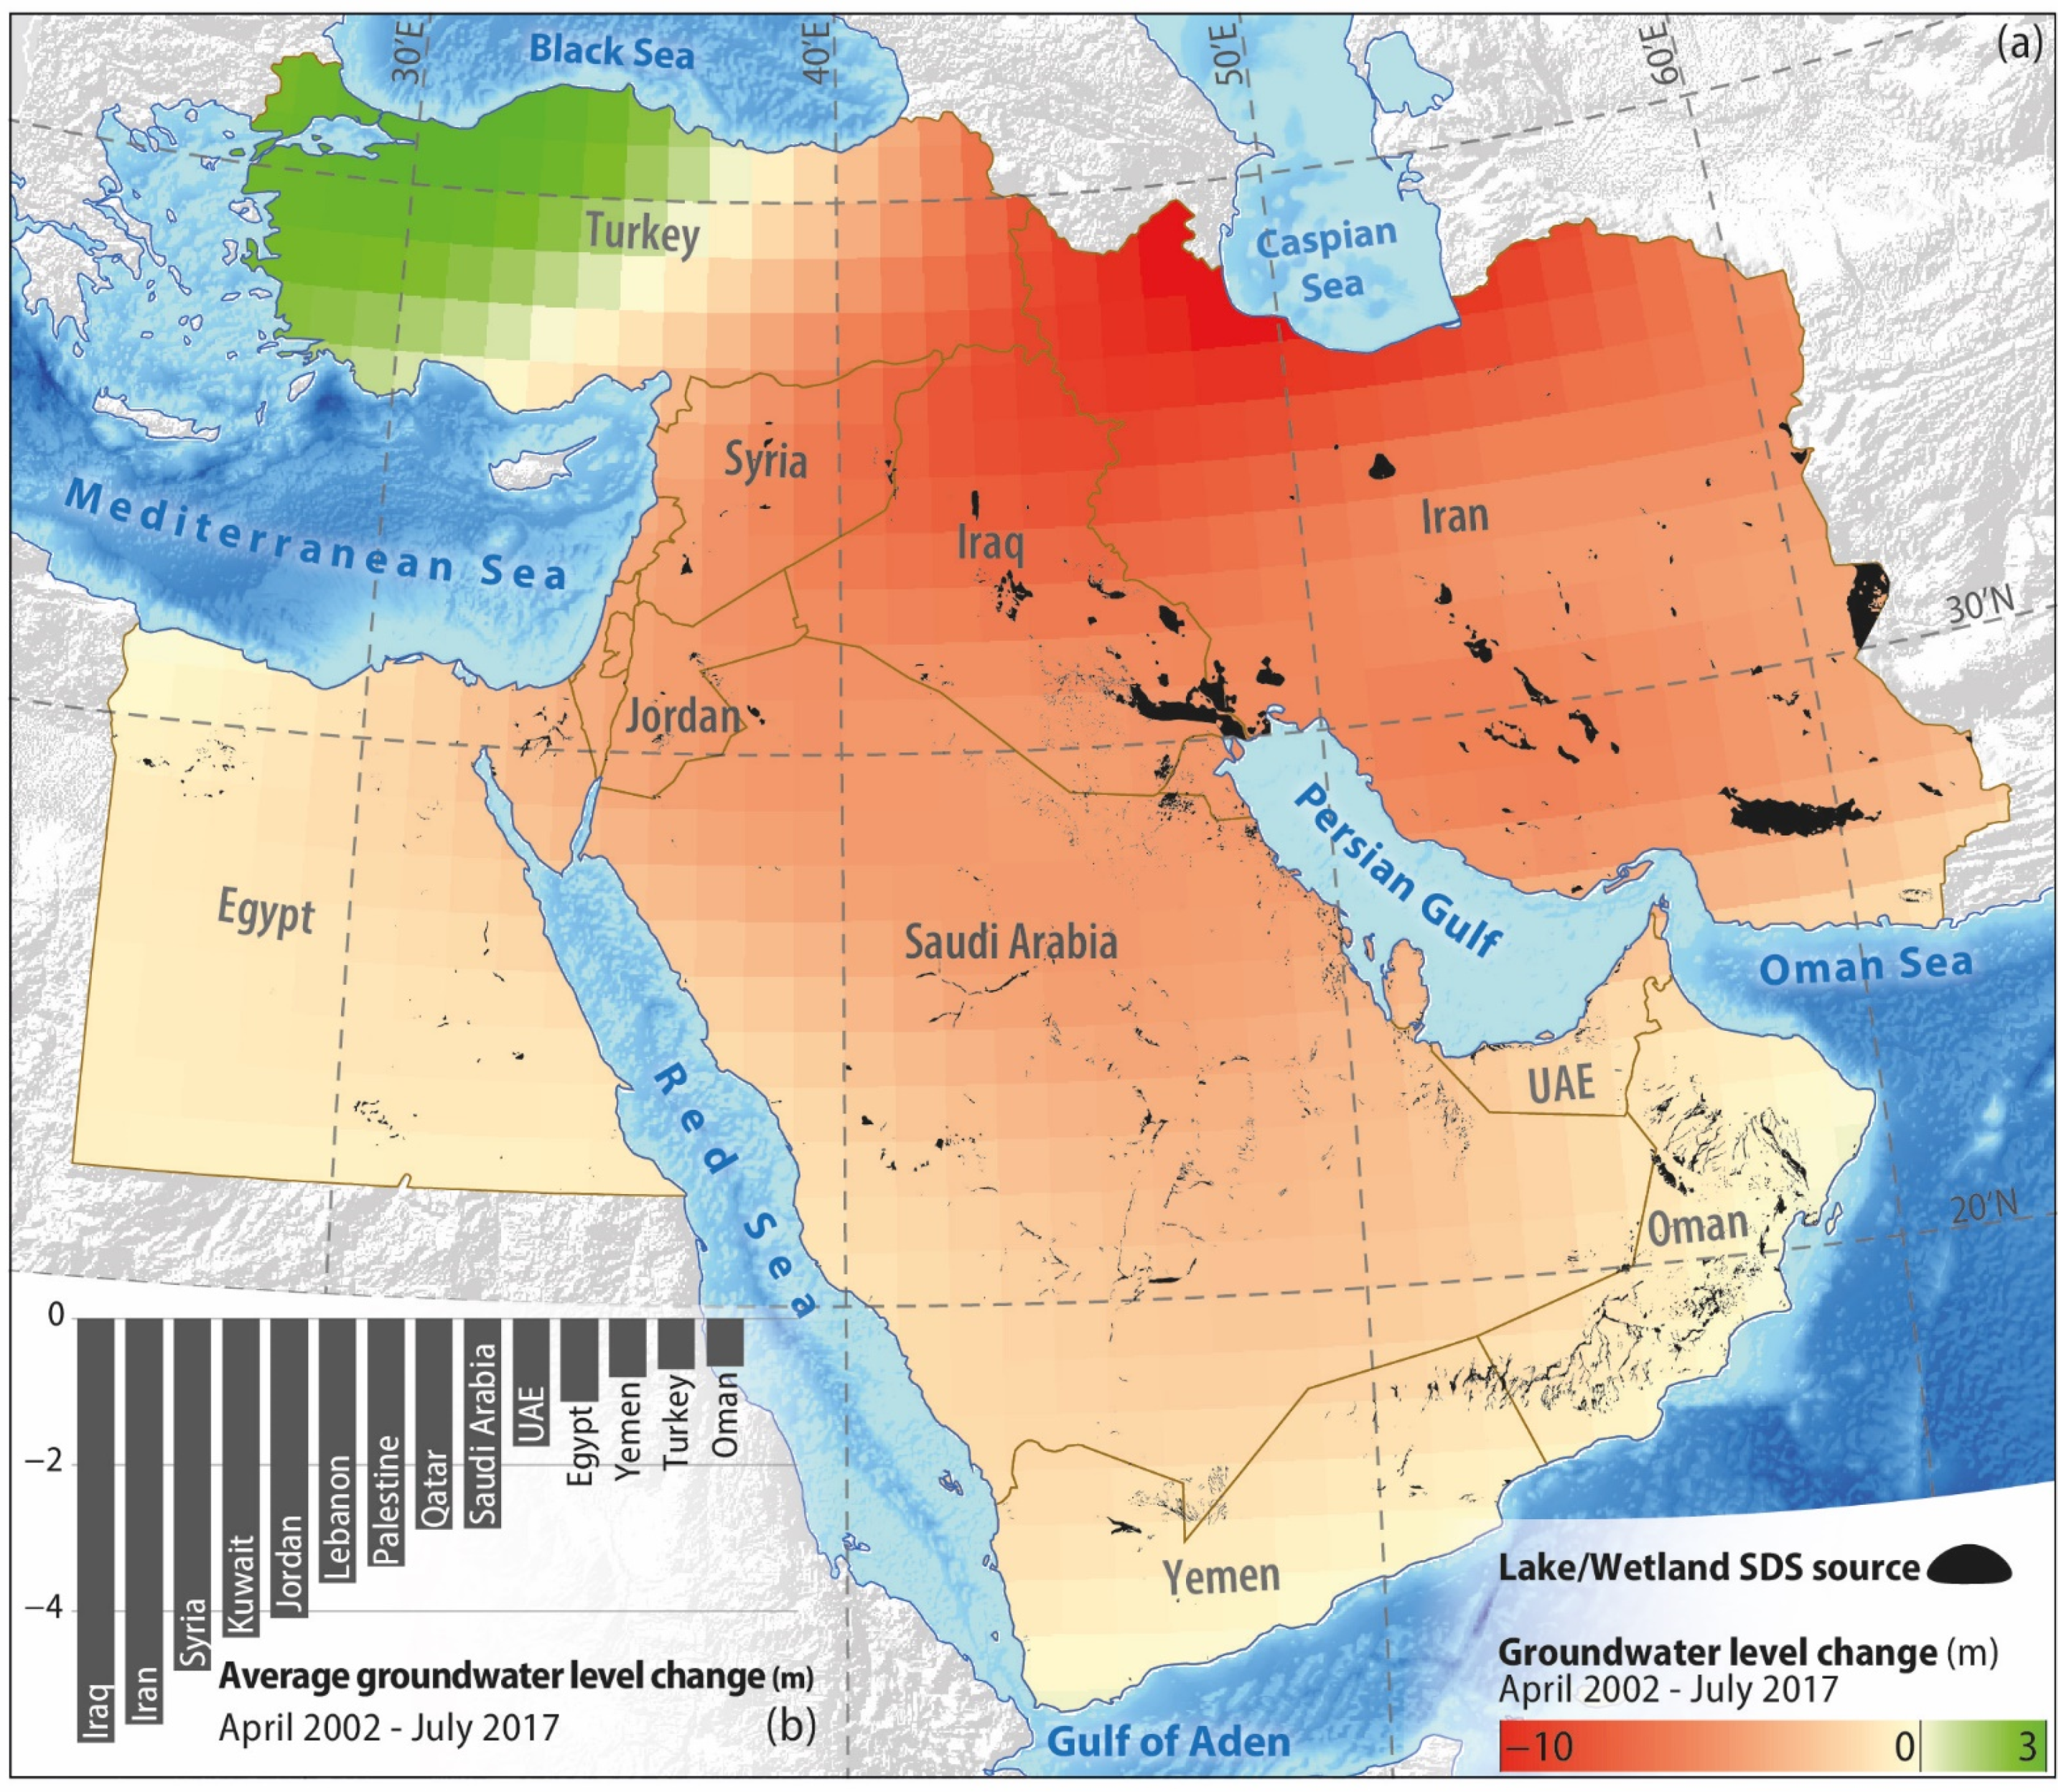
3.3. Spatial Analysis of Surface and Ground Water Changes in Hydrologic SDS Sources

The spatial pattern of changes in the surface water area (including lakes, wetlands, and rivers) was acquired for two periods before 2000 (1984–1999) and after 2000 (2000–2020) using GSW data (Figure 7a). The increasing and decreasing changes are illustrated in blue and red, respectively. As shown in Figure 7b, the highest changes in surface water occurred in Iran, Iraq, Turkey, and Egypt, respectively. In Iran, negative changes were roughly three times more than positive changes. For Iraq, negative changes were almost twice the positive changes. For all countries except Egypt, the decrease in surface water was greater than the increase. Negative changes in surface water in Iran were about 30% more than in Iraq, twice as much as in Turkey, and three times as much as in Egypt. The highest density of surface water changes was detected in the hydrologic SDS sources of Iraq, especially the southwestern areas and Mesopotamian wetlands (Figure 7a).
The spatial pattern of total groundwater level changes in the Middle East was extracted from April 2002 to July 2017 (Figure 8a). The variation of groundwater level in this period is between −10 and +3 m. The highest decrease and increase in groundwater level were observed for the northwestern regions of Iran and the western regions of Turkey, respectively. In hydrologic SDS sources, the groundwater level has mainly decreased. On the other hand, the spatial pattern of the groundwater level shows far fewer changes in desert SDS sources. Groundwater level changes by country are presented in Figure 8b. On average, the highest drop in the groundwater level occurred in Iraq, Iran, and Syria, respectively. Additionally, the largest area of hydrologic SDS sources can be found in Iraq and Iran. In addition, permanent lakes and freshwater marsh & floodplain SDS sources are located only in these three countries. The lowest decrease in groundwater level occurred in Oman. Oman has the largest area of hydrologic SDS sources after Iran and Iraq (Table 1).

4. Discussion

4.1. Characterization of Middle Eastern SDS Sources

The occurrence of SDS in different regions and from different emission sources exerts various impacts on the environment. Therefore, combating SDS in different sources requires specific mitigation measures [48]. Accordingly, an essential step for the proper management of SDS sources is identifying the source type. In desert sources, for example, common mitigation measures include stabilizing soil surface by mulching, planting climate-compatible shrubs and trees, using windbreaks, creating mechanical and biological barriers (e.g., dead vegetation), and employing other soil and plant resource management methods [48]. On the other hand, hydrologic SDS sources, including lakes, wetlands, and rivers, demand water resource management [27,49]. Water resource management in countries with shared basins such as Iran, Iraq, Turkey, and Syria could be undertaken through joint efforts.
The accurate identification of SDS sources is considered a challenging task. In the last few decades, various approaches have been used to identify and discriminate the SDS sources in ME. Most of these approaches fall under the atmospheric aerosol loading-based category (e.g., [21,22,35]). In these approaches, a region with a high concentration of atmospheric aerosols is generally considered an SDS source. The aerosol loading-based approaches often detect SDS events regardless where they are emitted from. Due to the highly dynamic nature of SDS, detected events may originate from more distant regions. Accordingly, using only atmospheric aerosol indices such as AOD and AAI may lead to errors in modeling and significantly reduce the accuracy of identifying SDS sources. To tackle this problem, by considering the multi-year average of thresholded atmospheric aerosol indices and SDS drivers through a supervised approach (by taking advantage of the SDS hotspots identified by visual interpretation), it is possible to identify SDS sources with satisfactory accuracy. However, compared to previous studies that have identified SDS sources only based on aerosol indices, the present approach gives more reliable results.
Most of the Middle East is located within the global desert belt given its low annual precipitation [50]. Here, as the results showed, over 79% of the identified SDS sources are in the desert class. SDS sources of Saudi Arabia, Egypt, Oman, and Yemen are mainly sandy deserts. Those in Iran, Iraq (especially Mesopotamian wetlands), and Syria are generally composed of fine-grained alluvial sediments. The larger size of the sources does not essentially mean greater activity and SDS emission. Accordingly, despite the high area, desert SDS sources in Saudi Arabia, Egypt, Oman, and Yemen they have low activity in terms of SDS frequency and intensity. Previous studies indicate that the highest SDS activity occurs in the northern and northwestern parts of Iraq and along the Syrian–Iraqi border [25]. This issue is dependent on the source type, particle diameter, time, duration, and intensity of erosive winds. Fine-grained particles (e.g., SDS sources in the alluvial plains of Iran, Iraq, and Syria) are lightweight and are easily detached from the Earth’s surface and lifted into the upper layers of the atmosphere, so they can travel over long distances [51]. These fine-grained SDS particles are easier to detect in satellite images due to their durability and the longer movement of the plume in the atmosphere.
The spatial-temporal analysis of water bodies showed that that both surface water (Figure 4 and Figure 6) and groundwater (Figure 5 and Figure 8) have decreased in the Middle East, which reveals the instability of the water balance conditions in the region. The results show that the water balance in hydrologic SDS sources is more negative than in other sources. In this regard, both surface water and groundwater resources have experienced severe reductions. Regarding coastal SDS sources, it is worth mentioning that these sources are influenced by the sea and its physicochemical reactions. Although they are considered hydrologic sources, reduction in their groundwater levels is not evident since they are recharged by the sea. Desert SDS sources have experienced much less groundwater depletion than other sources, which may be attributed to limited agricultural and low groundwater exploitation in these areas.

4.2. Influence of Drought on SDS Sources in Middle East

The long-term analysis of surface water changes in hydrologic SDS sources showed a relatively sharp decrease in the 2000–2001 and 2007–2012 periods compared to pre-2000. Further examination revealed that these two periods correspond almost to two very severe drought periods hitting the ME in the last 50 years [47,52]. As shown in Table 2, surface water resources in the first and second drought periods have decreased by 51% and 52.9%, respectively, compared to the pre-2000. Hamoun Lakes have experienced a very severe decrease (over 72%) in both drought periods compared to other water bodies. Iraqi lakes and Hamoun Lake experienced a sharper decrease in the second period compared to the first. In contrast, the Mesopotamia wetlands show a lower decline in the second period.
In the first and second periods, dust scattering AOT in water bodies increased by 14.5% and 37.3%, respectively, compared to the pre-2000 (Table 2), which the greatest increase occurred in Mesopotamian wetlands in both episodes. This increase in SDS from hydrological sources mainly occurred in spring and summer. This can be attributed to the predominance of seasonal wet conditions and regional wind regimes (e.g., Shamal Winds). Interestingly, SDS occurrence is a response to drought-induced climatic conditions (Figure 6), since the increase in SDS does not exactly coincide with the decrease in water bodies, and, generally, a rather irregular time lag is observed between the two. This is essentially because there is a delay between the reduction of water bodies and their complete desiccation and the erodibility of their substrate sediments. The duration of this time lag is a function of the hydroclimatic conditions and the soil’s physicochemical properties. Therefore, based on correlation analysis, there is no straightforward statistical relationship between water area changes and SDS activity. It can be argued that, in general, the reduction of surface water in most cases (especially during drought episodes) has been accompanied by an increase in SDS activity and vice versa. Another possible reason for the lack of a high correlation between surface water changes and SDS activity is the effect of human activities.
There was no information available about groundwater changes before 2002. Still, the effect of the second drought period on the reduction of ground water levels is clearly visible in Figure 8. The continuation of the decreasing groundwater trends after 2012 is likely due to insufficient aquifer recharge resulting from low precipitation and overexploitation. It can be argued that periodic droughts have directly affected the water balance and hydrological resources of the Middle East, leading to increased SDS activity.
A severe flood occurred in 2019 in the central and eastern regions of the Middle East, including Iran and Iraq [53], which caused the temporary restoration of wetlands and lakes in these regions (Figure 6). However, after that, the area of water bodies has been decreasing. The connection between surface water reduction and SDS occurrence means that the continuation of these conditions will intensify SDS activity in the Middle East in the future.

4.3. Influence of Human Interventions on Middle Eastern SDS Sources

Human intervention and exploitive intentions have always been artificial agents manipulating the environment. The population of the ME countries is estimated at 460 million in 2022, which is a significant growth compared to the previous decades. The rapid population growth in the past few decades has intensified the demand for water, food, and energy [12,54]. This has in turn increased and intensified water diversion projects (e.g., the construction of dams, pumping stations, irrigation canals, or other man-made structures that modifies the natural flow of a waterway) in the region to provide drinking water, expand agricultural lands, meet industrial uses, and hydropower energy [13]. In addition, the non-cooperation of countries, war, and insecurity in Iraq, Syria, and Yemen [55,56] have also contributed to the mismanagement of water resources and SDS in the Middle East.
Turkey’s GAP projects on the Tigris and Euphrates Rivers and Egypt’s dam construction on the Nile River are among the most intrusive anthropogenic activities affecting water resources in the Middle East. However, SDS sources in Egypt are mostly non-hydrologic (Figure 3) and this project has not so far affected SDS activity to a great extent. Still, the formation of new hydrologic SDS sources, particularly on the margins of the Nile in the future is not far-fetched. However, GAP dam construction projects have already reduced the environmental water right of wetlands and led to the drying of some lakes downstream. The same has happened in Iran due to the mismanagement of water resources in basins located in Central Iran [15]. Accordingly, as shown in Figure 3, some SDS sources in Southern and Central Iraq and Central and Eastern Iran have hydrologic origins. It can be concluded that human intervention has played a key role in the formation of hydrologic SDS sources and a limited role in coastal and desert sources.
Despite the occurrence of severe drought episodes in the region, there have been cases of increase in surface water resources in countries such as Egypt and Turkey (Figure 4). The analysis of the past 40-year trends does not show a significant increase in their precipitation. Therefore, this increase has been mainly due to human activities such as water diversion projects on the Nile River in Egypt and the Tigris and Euphrates Rivers in Turkey. Nevertheless, these projects have reduced the amount of downstream water flow and have disrupted the natural hydrological balance of their respective basins and sub-basins. On the other hand, the creation of artificial surface water resources may trigger the formation of new SDS sources in the future, as happened in the case of the artificial lakes of Tharthar, Habbaniyah, and Razzaza in Iraq. Therefore, the increase in surface water resources does not necessarily ensure SDS control in long term. Streams and rivers carry and deposit fine-grained sediments in lakes, wetlands, and floodplains. The permanent or seasonal desiccation of these water bodies accompanied by erosive winds prompts the formation of new SDS sources. This accentuates the critical importance of protecting natural and artificial surface water sources from instabilities caused by hydroclimatic conditions and human intervention to combat SDS.

5. Conclusions

This study investigated the Middle East as one of the global sand and dust storms (SDS) sources focusing on hydrological parameters. First, the SDS sources were identified using remote sensing data and a multi-step binary mask approach with an overall accuracy of 82.6%. The sources were categorized into seven classes based on land cover type, which included desert, permanent lake, freshwater marsh & floodplain, coastal wetland, pan, brackish & saline wetland, intermittent lake/wetland, and coastal land.
According to the findings, desert sources (over 79%) have the highest area of SDS sources. Hydrologic SDS sources including the permanent lake, intermittent lake/wetland, and freshwater marsh & floodplain accounted for 8.4% of SDS sources in the Middle East. The largest area of hydrologic SDS sources belonged to Iran (41%), Iraq (21%), Oman (14%), and Saudi Arabia (13%).
Our results revealed that Iran, Iraq, Turkey, and Egypt showed the highest amount of decreasing and increasing surface water changes, respectively. The highest density of surface water change was observed in those of the Mesopotamian wetlands in Southern Iraq. The highest decrease in groundwater was observed in Iran and Iraq, which includes the highest areas of hydrologic SDS sources.
The correlation analysis showed an inverse but not very strong relationship between surface water changes and SDS activities. The temporal pattern of changes in surface waters, including wetlands and lakes, showed a declining trend in the post-2000 compared to the pre-2000 period. Similarly, SDS activities have increased by an average of 18.4% since 2000. In the 2000–2001 and 2007–2012 periods, severe droughts corresponded to the shrinking of surface water up to 51% and 52.9%, respectively. SDS activities in surface water in the first and second periods increased by an average of 14.5% and 37.3%, respectively. Overall, it can be argued that periodic droughts have negatively affected the water resources in the Middle East, leading to an increase in SDS activity, especially from hydrologic SDS sources.
Despite the occurrence of severe drought episodes in the region, human interventions such as water diversion projects have reduced the water flow to downstream regions, which caused the SDS activities. For instance, the Mesopotamian wetlands of Iraq have experienced the highest density of hydrologic SDS sources, which is the consequence of anthropogenic activities upstream.
In general, it can be concluded that the main causes of SDS sources formation in the Middle East consist of natural factors such as the predominance of drought. Specifically, the hydrologic SDS sources are suffering from mismanagement of water resources, which greatly contributes to SDS activities.
The most important challenge of this approach was the identifying SDS hotspots using visual interpretation. Because these hotspots, as a training dataset, strongly affect the accuracy of the binary mask-based model. To perform this task, the interpreter must have sufficient knowledge about SDS and the study area. In addition, in general, visual interpretation is a time-consuming and expensive process, especially on a large scale. However, this approach can be extended to other areas, and in this way, global SDS sources can be discriminated.

Author Contributions

Conceptualization, R.P., S.A., A.D.B. and N.N.S.; data curation, R.P.; formal analysis, R.P.; investigation, R.P.; methodology, R.P.; project administration, S.A., A.D.B. and N.N.S.; software, R.P.; supervision, S.A., A.D.B. and N.N.S.; visualization, R.P.; writing—original draft, R.P.; writing—review and editing, R.P., S.A., A.D.B. and N.N.S. All authors have read and agreed to the published version of the manuscript.

Funding

The publication fees of this article have been supported by Mansoura University.

Institutional Review Board Statement

Not applicable.

Informed Consent Statement

Not applicable.

Data Availability Statement

Data are available on request due to their robustness and restrictions for sharing publicly.

Acknowledgments

The authors would like to express their appreciation to Masoud Soleimani, Mohsen Bakhtiari, and Saham Mirzaei for their supports in reviewing the paper.

Conflicts of Interest

The authors declare no conflict of interest.

References

  1. Zittis, G.; Almazroui, M.; Alpert, P.; Ciais, P.; Cramer, W.; Dahdal, Y.; Fnais, M.; Francis, D.; Hadjinicolaou, P.; Howari, F.; et al. Climate Change and Weather Extremes in the Eastern Mediterranean and Middle East. Rev. Geophys. 2022, 60, e2021RG000762. [Google Scholar] [CrossRef]
  2. Boloorani, A.D.; Najafi, M.S.; Soleimani, M.; Papi, R.; Torabi, O. Influence of Hamoun Lakes’ dry conditions on dust emission and radiative forcing over Sistan plain, Iran. Atmospheric Res. 2022, 272, 106152. [Google Scholar] [CrossRef]
  3. Francis, D.; Chaboureau, J.P.; Nelli, N.; Cuesta, J.; Alshamsi, N.; Temimi, M.; Pauluis, O.; Xue, L. Summertime dust storms over the Arabian Peninsula and impacts on radiation, circulation, cloud devel-opment and rain. Atmos. Res. 2021, 250, 105364. [Google Scholar] [CrossRef]
  4. Khaniabadi, Y.O.; Daryanoosh, S.M.; Amrane, A.; Polosa, R.; Hopke, P.K.; Goudarzi, G.; Mohammadi, M.J.; Sicard, P.; Armin, H. Impact of Middle Eastern Dust storms on human health. Atmos. Pollut. Res. 2017, 8, 606–613. [Google Scholar] [CrossRef]
  5. Soleimani, Z.; Teymouri, P.; Boloorani, A.D.; Mesdaghinia, A.; Middleton, N.; Griffin, D.W. An overview of bioaerosol load and health impacts associated with dust storms: A focus on the Middle East. Atmos. Environ. 2020, 223, 117187. [Google Scholar] [CrossRef]
  6. Middleton, N.; Kashani, S.S.; Attarchi, S.; Rahnama, M.; Mosalman, S.T. Synoptic Causes and Socio-Economic Consequences of a Severe Dust Storm in the Middle East. Atmosphere 2021, 12, 1435. [Google Scholar] [CrossRef]
  7. Jish Prakash, P.; Stenchikov, G.; Kalenderski, S.; Osipov, S.; Bangalath, H. The impact of dust storms on the Arabian Pen-insula and the Red Sea. Atmos. Chem. Phys. 2015, 15, 199–222. [Google Scholar] [CrossRef] [Green Version]
  8. Rezazadeh, M.; Irannejad, P.; Shao, Y. Climatology of the Middle East dust events. Aeolian Res. 2013, 10, 103–109. [Google Scholar] [CrossRef]
  9. Kutiel, H.; Furman, H.K.H. Dust Storms in the Middle East: Sources of Origin and Their Temporal Characteristics. Indoor Built Environ. 2003, 12, 419–426. [Google Scholar] [CrossRef]
  10. World Bank. Sand and Dust Storms in the Middle East and North Africa Region: Sources, Costs, and Solutions; World Bank: Washington, DC, USA, 2019. [Google Scholar]
  11. Heydarizad, M.; Minaei, M.; Ichiyanagi, K.; Sorí, R. The effects of local and regional parameters on the δ18O and δ2H values of precipitation and surface water resources in the Middle East. J. Hydrol. 2021, 600, 126485. [Google Scholar] [CrossRef]
  12. Bozorg-Haddad, O.; Zolghadr-Asli, B.; Sarzaeim, P.; Aboutalebi, M.; Chu, X.; Loáiciga, H.A. Evaluation of water shortage crisis in the Middle East and possible remedies. J. Water Supply: Res. Technol. 2020, 69, 85–98. [Google Scholar] [CrossRef]
  13. Boloorani, A.D.; Papi, R.; Soleimani, M.; Karami, L.; Amiri, F.; Samany, N.N. Water bodies changes in Tigris and Euphrates basin has impacted dust storms phenomena. Aeolian Res. 2021, 50, 100698. [Google Scholar] [CrossRef]
  14. Hamzeh, N.H.; Karami, S.; Opp, C.; Fattahi, E.; Jean-François, V. Spatial and temporal variability in dust storms in the Middle East, 2002–2018: Three case studies in July 2009. Arab. J. Geosci. 2021, 14, 538. [Google Scholar] [CrossRef]
  15. Papi, R.; Kakroodi, A.; Soleimani, M.; Karami, L.; Amiri, F.; Alavipanah, S.K. Identifying sand and dust storm sources using spatial-temporal analysis of remote sensing data in Central Iran. Ecol. Inform. 2022, 70, 101724. [Google Scholar] [CrossRef]
  16. Gholami, H.; Mohamadifar, A.; Collins, A.L. Spatial mapping of the provenance of storm dust: Application of data mining and ensemble modelling. Atmos. Res. 2020, 233, 104716. [Google Scholar] [CrossRef]
  17. Boroughani, M.; Pourhashemi, S.; Hashemi, H.; Salehi, M.; Amirahmadi, A.; Asadi, M.A.Z.; Berndtsson, R. Application of remote sensing techniques and machine learning algorithms in dust source detection and dust source susceptibility mapping. Ecol. Inform. 2020, 56, 101059. [Google Scholar] [CrossRef]
  18. Papi, R.; Argany, M.; Moradipour, S.; Soleimani, M. Modeling the potential of Sand and Dust Storm sources formation using time series of remote sensing data, fuzzy logic and artificial neural network (A Case study of Euphrates basin). Eng. J. Geo-spatial Inf. Technol. 2021, 8, 61–82. [Google Scholar] [CrossRef]
  19. Boloorani, A.D.; Samany, N.N.; Papi, R.; Soleimani, M. Dust source susceptibility mapping in Tigris and Euphrates basin using remotely sensed imagery. Catena 2022, 209, 105795. [Google Scholar] [CrossRef]
  20. Boloorani, A.D.; Kazemi, Y.; Sadeghi, A.; Shorabeh, S.N.; Argany, M. Identification of dust sources using long term satellite and climatic data: A case study of Tigris and Euphrates basin. Atmos. Environ. 2020, 224, 117299. [Google Scholar] [CrossRef]
  21. Rashki, A.; Middleton, N.J.; Goudie, A.S. Dust storms in Iran–Distribution, causes, frequencies and impacts. Aeolian Res. 2021, 48, 100655. [Google Scholar] [CrossRef]
  22. Ginoux, P.; Prospero, J.M.; Gill, T.E.; Hsu, N.C.; Zhao, M. Global-scale attribution of anthropogenic and natural dust sources and their emission rates based on MODIS Deep Blue aerosol products. Rev. Geophys. 2012, 50. [Google Scholar] [CrossRef]
  23. Cao, H.; Amiraslani, F.; Liu, J.; Zhou, N. Identification of dust storm source areas in West Asia using multiple environmental datasets. Sci. Total Environ. 2015, 502, 224–235. [Google Scholar] [CrossRef] [PubMed]
  24. Moridnejad, A.; Karimi, N.; Ariya, P.A. A new inventory for middle east dust source points. Environ. Monit. Assess. 2015, 187, 1–11. [Google Scholar] [CrossRef]
  25. Moridnejad, A.; Karimi, N.; Ariya, P.A. Newly desertified regions in Iraq and its surrounding areas: Significant novel sources of global dust particles. J. Arid Environ. 2015, 116, 1–10. [Google Scholar] [CrossRef]
  26. Parajuli, S.P.; Yang, Z.; Kocurek, G. Mapping erodibility in dust source regions based on geomorphology, meteorology, and remote sensing. J. Geophys. Res. Earth Surf. 2014, 119, 1977–1994. [Google Scholar] [CrossRef]
  27. Hamidi, M. The key role of water resources management in the Middle East dust events. Catena 2020, 187, 104337. [Google Scholar] [CrossRef]
  28. Boroughani, M.; Hashemi, H.; Hosseini, S.H.; Pourhashemi, S.; Berndtsson, R. Desiccating Lake Urmia: A New Dust Source of Regional Importance. IEEE Geosci. Remote Sens. Lett. 2019, 17, 1483–1487. [Google Scholar] [CrossRef]
  29. Ghale, Y.A.G.; Tayanc, M.; Unal, A. Dried bottom of Urmia Lake as a new source of dust in the northwestern Iran: Understanding the impacts on local and regional air quality. Atmospheric Environ. 2021, 262, 118635. [Google Scholar] [CrossRef]
  30. Rashki, A.; Kaskaoutis, D.; Goudie, A.; Kahn, R. Dryness of ephemeral lakes and consequences for dust activity: The case of the Hamoun drainage basin, southeastern Iran. Sci. Total Environ. 2013, 463–464, 552–564. [Google Scholar] [CrossRef]
  31. Miri, A.; Maleki, S.; Middleton, N. An investigation into climatic and terrestrial drivers of dust storms in the Sistan region of Iran in the early twenty-first century. Sci. Total Environ. 2021, 757, 143952. [Google Scholar] [CrossRef]
  32. Thakur, P.K.; Nikam, B.R.; Garg, V.; Aggarwal, S.P.; Chouksey, A.; Dhote, P.R.; Ghosh, S. Hydrological Parameters Estimation Using Remote Sensing and GIS for Indian Region: A Review. Proc. Natl. Acad. Sci. India Sect. A Phys. Sci. 2017, 87, 641–659. [Google Scholar] [CrossRef]
  33. O’Loingsigh, T.; Mitchell, R.; Campbell, S.; Drake, N.; McTainsh, G.; Tapper, N.; Dunkerley, D. Correction of dust event frequency from MODIS Quick-Look imagery using in-situ aerosol measurements over the Lake Eyre Basin, Australia. Remote Sens. Environ. 2015, 169, 222–231. [Google Scholar] [CrossRef]
  34. Baddock, M.C.; Bryant, R.G.; Acosta, M.D.; Gill, T.E. Understanding dust sources through remote sensing: Making a case for CubeSats. J. Arid Environ. 2021, 184, 104335. [Google Scholar] [CrossRef]
  35. Prospero, J.M.; Ginoux, P.; Torres, O.; Nicholson, S.E.; Gill, T.E. Environmental characterization of global sources of at-mospheric soil dust identified with the Nimbus 7 Total Ozone Mapping Spectrometer (TOMS) absorbing aerosol product. Rev. Geophys. 2002, 40, 1–2. [Google Scholar] [CrossRef]
  36. Karimi, N.; Moridnejad, A.; Golian, S.; Samani, J.M.V.; Karimi, D.; Javadi, S. Comparison of dust source identification techniques over land in the Middle East region using MODIS data. Can. J. Remote Sens. 2012, 38, 586–599. [Google Scholar] [CrossRef]
  37. Soleimani, M.; Argany, M.; Papi, R.; Amiri, F. Satellite aerosol optical depth prediction using data mining of climate parameters. Phys. Geogr. Res. Q. 2021, 53, 319–333. [Google Scholar] [CrossRef]
  38. Stein Zweers, D.C. TROPOMI ATBD of the UV aerosol index. S5P-KNMI-L2-0008-RP. 1.0. Available online: http://www.tropomi.eu/sites/default/files/files (accessed on 1 August 2022).
  39. Nabavi, S.O.; Haimberger, L.; Samimi, C. Climatology of dust distribution over West Asia from homogenized remote sensing data. Aeolian Res. 2016, 21, 93–107. [Google Scholar] [CrossRef] [Green Version]
  40. Shepherd, G.; Terradellas, E.; Baklanov, A.; Kang, U.; Sprigg, W.; Nickovic, S.; Joowan, C. Global Assessment of Sand and Dust Storms; WMO: Geneva, Switzerland, 2016. [Google Scholar]
  41. Abatzoglou, J.T.; Dobrowski, S.Z.; Parks, S.A.; Hegewisch, K.C. TerraClimate, a high-resolution global dataset of monthly climate and climatic water balance from 1958–2015. Sci. Data 2018, 5, 170191. [Google Scholar] [CrossRef] [Green Version]
  42. Pelletier, J.D.; Broxton, P.D.; Hazenberg, P.; Zeng, X.; Troch, P.A.; Niu, G.; Williams, Z.C.; Brunke, M.A.; Gochis, D. Global 1-km Gridded Thickness of Soil, Regolith, and Sedimentary Deposit Layers; ORNL DAAC: Oak Ridge, TN, USA, 2016. [Google Scholar]
  43. Lehner, B.; Döll, P. Development and validation of a global database of lakes, reservoirs and wetlands. J. Hydrol. 2004, 296, 1–22. [Google Scholar] [CrossRef]
  44. Pekel, J.-F.; Cottam, A.; Gorelick, N.; Belward, A.S. High-resolution mapping of global surface water and its long-term changes. Nature 2016, 540, 418–422. [Google Scholar] [CrossRef]
  45. Gao, B.-C. Normalized Difference Water Index for Remote Sensing of Vegetation Liquid Water from Space. In Proceedings of the SPIE’S 1995 Symposium on OE/Aerospace Sensing and Dual Use Photonics, Orlando, FL, USA, 17–21 April 1995; pp. 225–236. [Google Scholar] [CrossRef]
  46. Darvishi Boloorani, A.; Soleimani, M.; Papi, R.; Alavipanah, S.K.; Al-Quraishi, A.M.F. Zoning Areas Susceptible to Land Subsidence in Tigris and Euphrates Basins. Eng. Technol. J. 2019, 37, 265–272. [Google Scholar] [CrossRef]
  47. Barlow, M.; Zaitchik, B.; Paz, S.; Black, E.; Evans, J.; Hoell, A. A Review of Drought in the Middle East and Southwest Asia. J. Clim. 2016, 29, 8547–8574. [Google Scholar] [CrossRef]
  48. Middleton, N.; Kang, U. Sand and Dust Storms: Impact Mitigation. Sustainability 2017, 9, 1053. [Google Scholar] [CrossRef] [Green Version]
  49. Al-Ansari, N.; Adamo, N.; Sissakian, V. Water shortages and its environmental consequences within Tigris and Euphrates Rivers. J. Earth Sci. Geotech. Eng. 2019, 9, 27–56. [Google Scholar]
  50. Batanouny, K.H. Climatic Aridity in the Deserts of the Middle East. In Plants in the Deserts of the Middle East; Springer: Berlin/Heidelberg, Germany, 2001; pp. 11–24. [Google Scholar] [CrossRef]
  51. Bolin, B.; Aspling, G.; Persson, C. Residence time of atmospheric pollutants as dependent on source characteristics, at-mospheric diffussion processes and sink mechanisms. Tellus 1974, 26, 185–195. [Google Scholar] [CrossRef] [Green Version]
  52. Trigo, R.M.; Gouveia, C.; Barriopedro, D. The intense 2007–2009 drought in the Fertile Crescent: Impacts and associated atmospheric circulation. Agric. For. Meteorol. 2010, 150, 1245–1257. [Google Scholar] [CrossRef]
  53. Yadollahie, M. The Flood in Iran: A Consequence of the Global Warming? Int. J. Occup. Environ. Med. 2019, 10, 54–56. [Google Scholar] [CrossRef] [Green Version]
  54. Roudi-Fahimi, F.; Creel, L.; De Souza, R.-M. Finding the Balance: Population and Water Scarcity in the Middle East and North Africa; Population Reference Bureau: Washington, DC, USA, 2002. [Google Scholar]
  55. Allan, J.A. Hydro-Peace in the Middle East. SAIS Rev. 2002, 22, 255–272. [Google Scholar] [CrossRef]
  56. Amery, H.A. Water wars in the Middle East: A looming threat. Geogr. J. 2002, 168, 313–323. [Google Scholar] [CrossRef]
Figure 1. Stepwise approach to characterize hydrologic SDS sources of the Middle East.
Sustainability 14 15352 g001
Figure 2. SDS sources of Middle East. The colored solid dots are SDS hotspots identified using visual interpretation of MODIS-RGB images used for histogram analysis (70%: black dots) and accuracy assessment (30%: green and red dots).
Sustainability 14 15352 g002
Figure 3. SDS source discrimination in the Middle East in terms of origin.
Sustainability 14 15352 g003
Figure 4. The temporal pattern of changes in water bodies and SDS levels in the Middle East. Blue graph shows the surface water area changes and the brown and black graphs are dust scattering and its moving average, respectively.
Sustainability 14 15352 g004
Figure 5. Mann–Kendall test for trend analysis of surface water area and dust emission AOT.
Sustainability 14 15352 g005
Figure 6. Temporal pattern of groundwater level changes in the Middle East SDS sources obtained from GRACE monthly data.
Sustainability 14 15352 g006
Figure 7. Changes in the surface water area of the Middle Eastern hydrologic SDS sources based on GSW data (a) and surface water area changes by country (b).
Sustainability 14 15352 g007
Figure 8. Groundwater level changes in the Middle East from April 2002 to July 2017, obtained from GRACE monthly data (a) and average changes by country (b).
Sustainability 14 15352 g008
Table 1. The area (km2) of different types of SDS sources in the Middle Eastern countries.
CountryDesertPermanent LakeFreshwater Marsh & FloodplainCoastal WetlandPan, Brackish & Saline WetlandIntermittent Lake/WetlandCoastal LandTotal %
Bahrain---12-314386<0.1
Egypt201,503--1938306827556476215,73919.9
Iran14,934736236852972955526,39216,00080,8997.5
Iraq74,858283412,282--397469594,6438.8
Jordan936---9994403024060.2
Kuwait5972--743-395604213,1521.2
Oman108,898--41510,97713,19212,572146,05313.5
Qatar---148372241841791790.9
Saudi Arabia396,711--2720752812,11724,562443,63941
Syria3039698--157522-44160.4
UAE10,980---7137805684325,7652.4
Yemen38,386--448-3531343445,8004.2
Total 856,21510,89415,966939739,79364,39785,1141,081,776100
%79.11.01.50.93.75.97.9100
Table 2. Surface water changes and dust scattering AOT from hydrologic SDS sources during drought periods.
NamePre-2000First DroughtChange in First Drought Compared to Post-2000 (%)Second DroughtChange in Second Drought Compared to Pre-2000 (%)
Water area (km2)Iraq lake39423037−23.02496−36.7
Marshes33431275−61.91699−49.2
Hamoun 3535990−72.0899−74.6
Total108215301−51.05094−52.9
AOTIraq lake0.190.2212.00.2633.3
Marshes0.130.1518.10.1840.6
Hamoun 0.240.2713.50.3337.9
Mean0.190.2114.50.2637.3
Publisher’s Note: MDPI stays neutral with regard to jurisdictional claims in published maps and institutional affiliations.

