
Systematic Analysis of the Contributory Factors Related to Major Coach and Bus Accidents in China

Abstract
:1. Introduction
1.1. Background
1.2. Literature Review
1.3. HFACS and Its Modification
1.4. The Purpose of This Study
2. Methods
2.1. Data Collection
2.2. Data Analysis Method
2.2.1. Qualitative Content Analysis
2.2.2. Gray Relational Analysis
- (i)
- Determining the reference sequence and comparison sequences .
- (ii)
- Normalizing the reference and comparison sequences using the method of maximum values.
- (ii)
- Calculating the correlation coefficient :
- (iv)
- Striving for the correlation degree :
3. Results
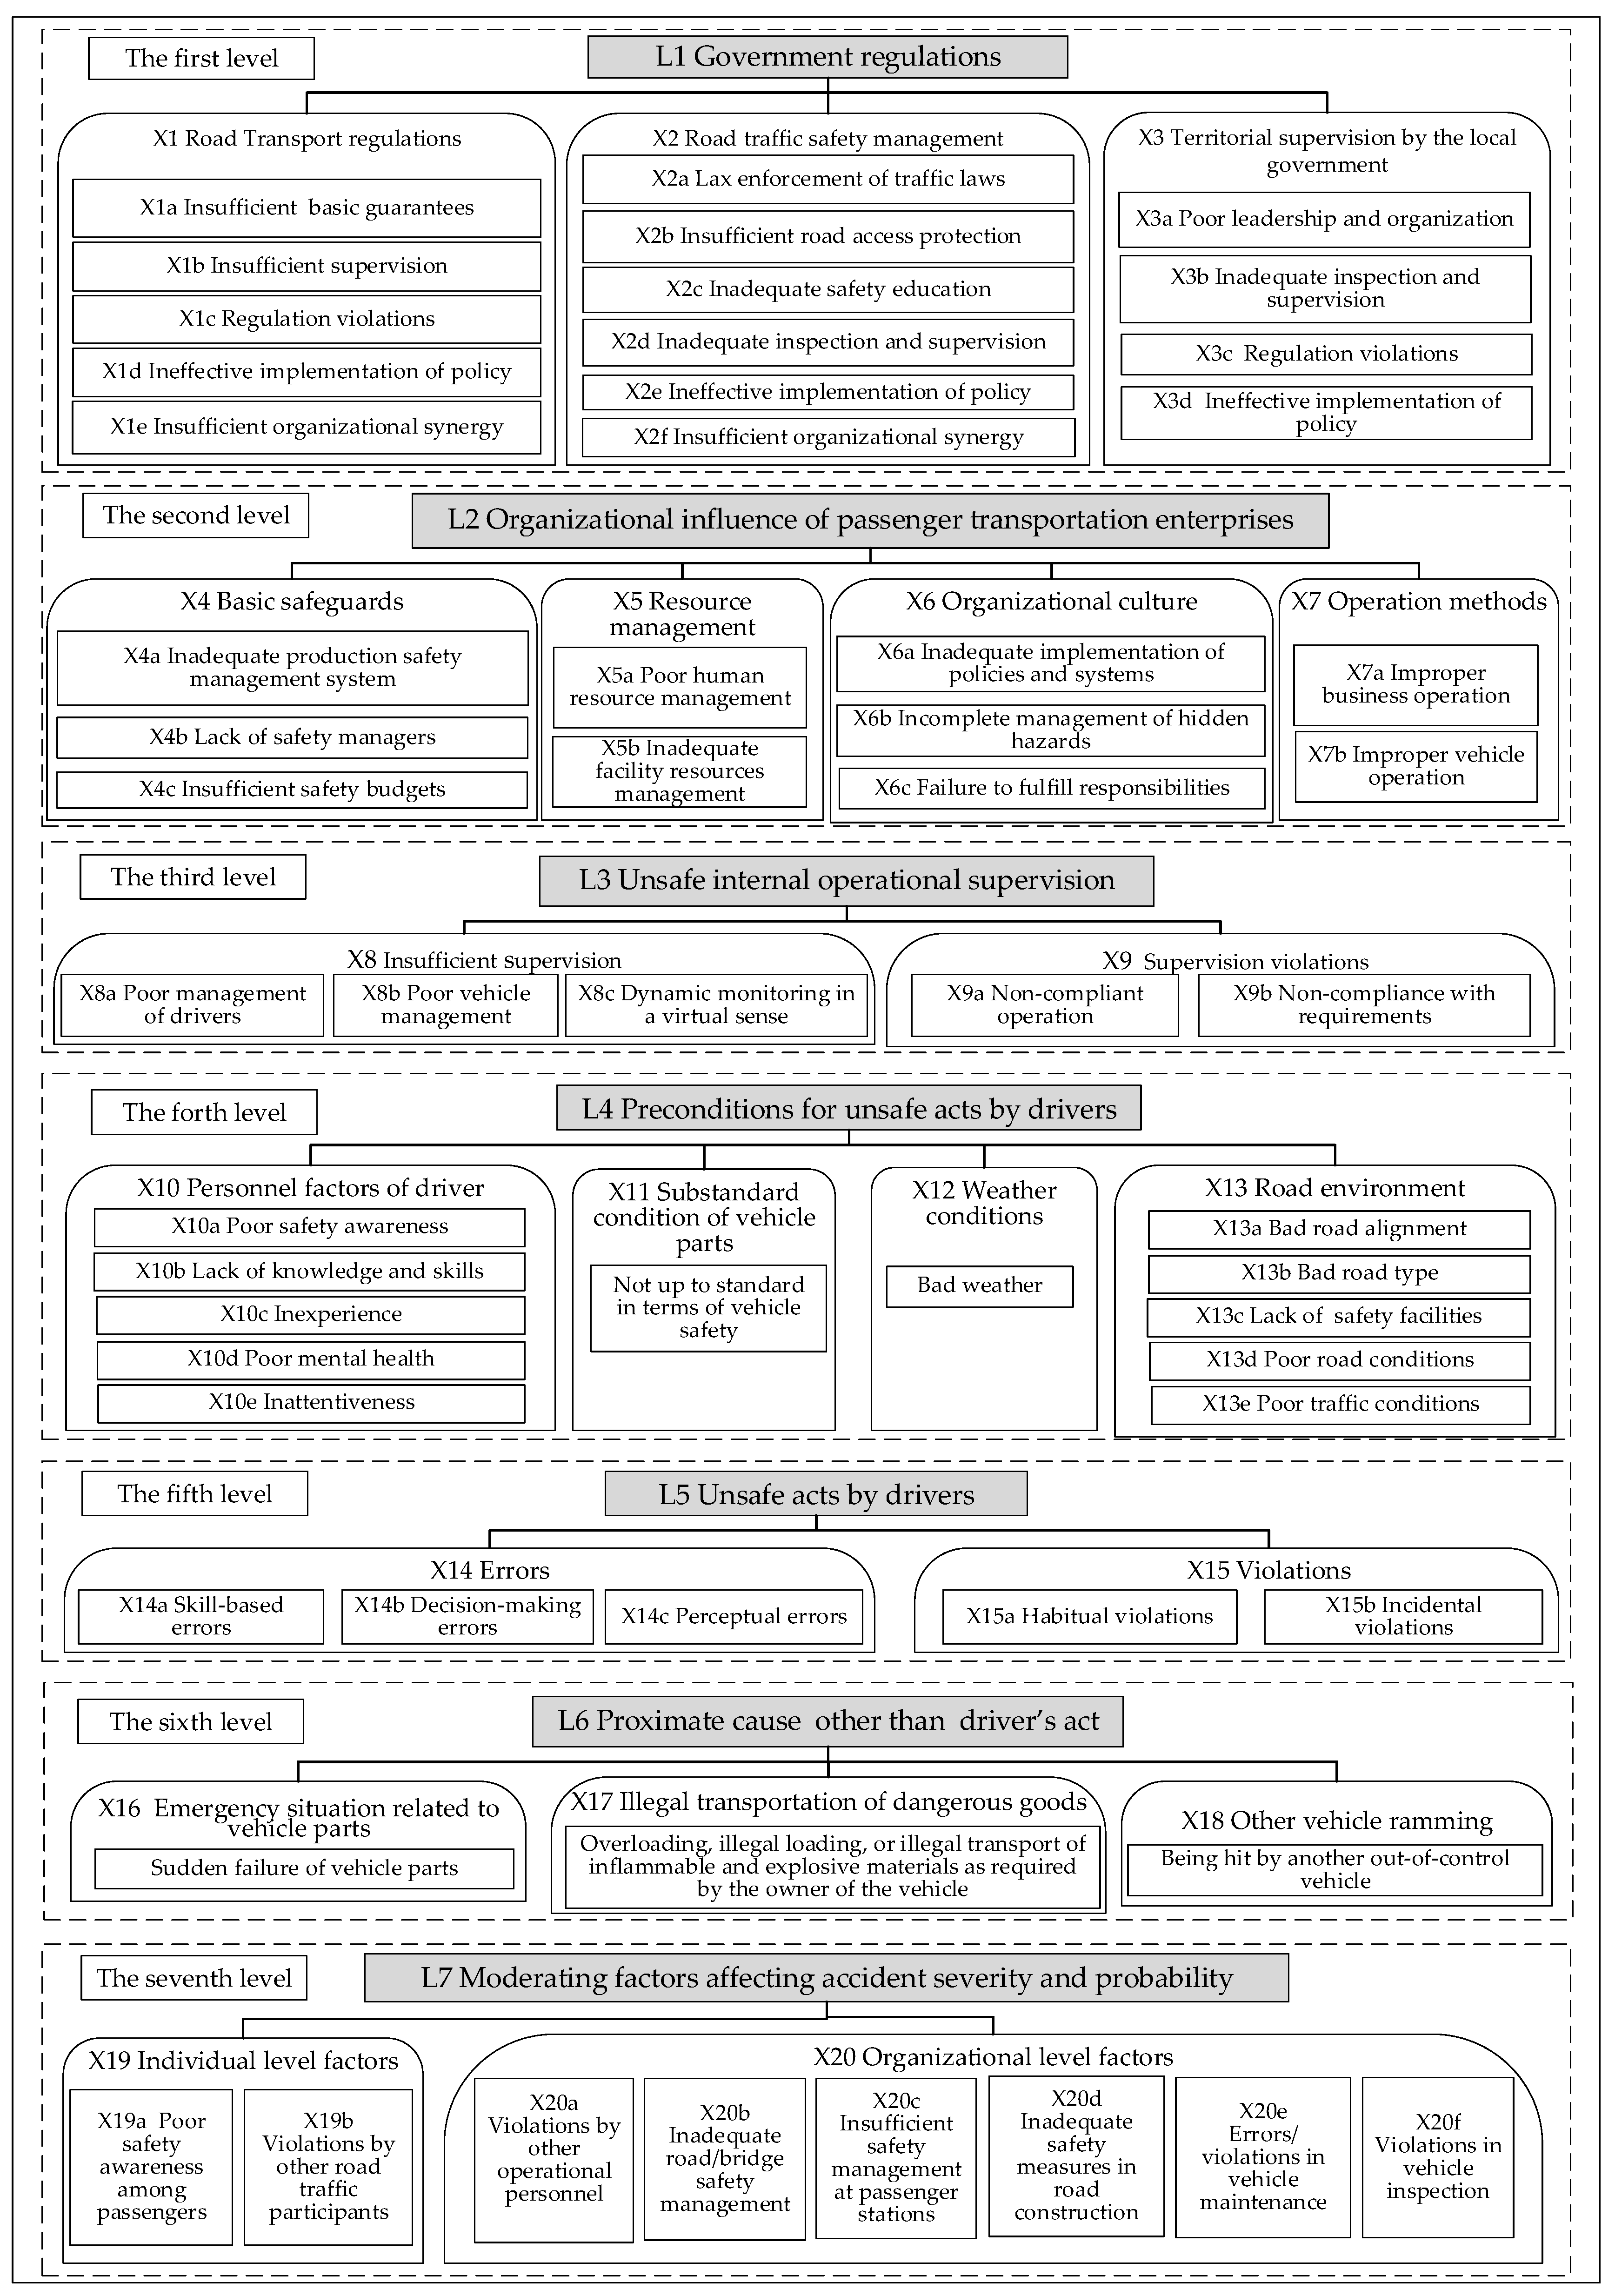
3.1. The Modified Contributory Factor Classification System
3.2. Reliability and Validity of the System
3.3. Correlation Analysis Results
3.3.1. Correlation Analysis between the First-Level Factors and Their Summation
- (i)
- We took L0 as the reference sequence and L1–L7 as the comparative sequences. In gray relational analysis, the reference sequence and comparison sequence are also called the parent sequence and subsequence, similar to a dependent variable and independent variable in statistical analysis. This part mainly aims to identify which layer of the causal factors in L1–L7 is more closely related to the accident’s cause by calculating the correlation degree. Therefore, L1–L7 were taken as the comparison sequences, and the data sequence L0 formed by the addition of L1–L7 was taken as the reference sequence. The data of the reference sequence and the comparative sequences, as shown in Table A5, were summarized based on the initial data in Table A4.
- (ii)
- The reference and comparison sequences were normalized using the maximum values method. We divided all the numbers in each row of L0–L7 by the maximum value of each row. Taking L0 as an example, since its maximum value is 224, we divide L0’s numbers by 224. The results are shown in Table A6.
- (iii)
- The absolute difference between the comparison sequences and the reference sequence was calculated. We subtracted each of the comparison sequence data from its corresponding reference sequence data and then took the absolute values. Accordingly, we calculated the correlation coefficients between the comparison sequences and reference sequence. The results are shown in Table A7 and Table A8. Thus, the groups of gray correlation coefficients were obtained, and each group contained 10 correlation coefficients.
- (iv)
- The correlation degrees between factors L0 and L1–L7 in the first layer were obtained. The seven gray correlation degrees between each first-level factor of L1–L7 and L0 (the summation of L1–L7) are as follows: (L0, L1) = 0.716, (L0, L2) = 0.891, (L0, L3) = 0.785, (L0, L4) = 0.806, (L0, L5) = 0.793, (L0, L6) = 0.676, (L0, L7) = 0.726. Thus, the ranking of the seven factors is as follows: L2 > L4 > L5 > L3 > L7 > L1 > L6. Based on the above analysis, the factors in the middle levels are the main causes of the accidents. Thus, we can state that the gray correlation degrees between each level of the classification system for the contributory factors and their summation appear to be weak at both ends but strong in the middle.
3.3.2. Correlation Analysis between Primary Indicators and Their First-Level Factors
3.3.3. Correlation Analysis between Secondary Indicators and Their Primary Indicators
4. Discussion
4.1. On Accident Investigations
4.1.1. Accident Causation Analysis Should Begin with the Accident Process
4.1.2. The Analysis of the System Vulnerabilities Should Be Strengthened
4.2. On Accident Prevention and Control
4.2.1. Passenger Transport Enterprises Should Be Prohibited from Contracting Traffic Operation Rights to Individuals
4.2.2. Construct a Legal Responsibility System for Passenger Transport Enterprises
4.2.3. Strengthen the Governance of Accident Risks Based on a System Perspective
5. Conclusions
Author Contributions
Funding
Institutional Review Board Statement
Informed Consent Statement
Data Availability Statement
Conflicts of Interest
Appendix A

| No. | Year | Full Name of the Accident Case |
|---|---|---|
| 1 | 2010 | “3/14” major accident on Datong Ring Expressway in Shanxi Province |
| 2 | 2010 | “5/23” major accident in Fuxin City, Liaoning Province |
| 3 | 2010 | “6/26” major accident in Haiyuan County, Ningxia Hui Autonomous Region |
| 4 | 2010 | “10/16” major accident in Haixi Mongolian and Tibetan Autonomous Prefecture, Qinghai Province |
| 5 | 2011 | “1/29” major accident in Guyuan City, Ningxia Hui Autonomous Region |
| 6 | 2011 | “2/4” drowning accident in Shaowu City, Fujian Province |
| 7 | 2011 | “3/16” major accident on Linfen Beltway in Shanxi Province |
| 8 | 2011 | “7/4” major accident on Xiantao Section of Suizhou–Yueyang Expressway in Hubei Province |
| 9 | 2011 | “7/22” fire accident on Xinyang Section of Beijing–Hong Kong–Macao Expressway in Henan Province |
| 10 | 2011 | “8/28” major accident in Shangyi County, Hebei Province |
| 11 | 2011 | “10/1” major accident in Xingshan County, Hubei Province |
| 12 | 2011 | “10/7” major accident on Binhai New Area–Baoding Expressway in Tianjin Municipality |
| 13 | 2011 | “10/7” major accident in Sheqi County, Henan Province |
| 14 | 2011 | “12/12” major accident in Feng County, Jiangsu Province |
| 15 | 2012 | “1/4” major accident on Shanghai–Kunming Expressway in Guizhou Province |
| 16 | 2012 | “2/25” major accident on Jincheng Section of National Highway 207 in Shanxi Province |
| 17 | 2012 | “3/13” major accident in Barkam County, Aba Tibetan and Qiang Autonomous Prefecture, Sichuan Province |
| 18 | 2012 | “4/7” major accident in Dalian Free Trade Zone, Liaoning Province |
| 19 | 2012 | “4/12” major accident on Xiaoxian Section of National Highway 311 in Anhui Province |
| 20 | 2012 | “4/22” major accident on Suzhou Section of Changshu–Hefei Expressway in Jiangsu Province |
| 21 | 2012 | “8/26” major accident on Yan’an Section of Baotou–Maoming Expressway in Shaanxi Province |
| 22 | 2012 | “8/31” major accident on Sanmenxia Section of Lianyungang–Horgos Expressway in Henan Province |
| 23 | 2012 | “11/10” major accident on Qiangao Highway in Xinjiang Uygur Autonomous Region |
| 24 | 2012 | “12/9” major accident in Minquan County, Henan Province |
| 25 | 2013 | “2/1” major accident in Gulin County, Sichuan Province |
| 26 | 2013 | “2/1” major accident in Ningxian County, Gansu Province |
| 27 | 2013 | “2/2” major accident in Congjiang County, Guizhou Province |
| 28 | 2013 | “2/19” Major accident in Jianshi County, Hubei Province |
| 29 | 2013 | “3/12” major accident on Jinzhou Yangtze River Bridge of Erenhot–Guangzhou Expressway in Hubei Province |
| 30 | 2013 | “6/18” major accident in Changji Hui Autonomous Prefecture, Xinjiang Uygur Autonomous Region |
| 31 | 2013 | “8/9” major accident on Hefei Section of Bengbu–Hefei Expressway in Anhui Province |
| 32 | 2013 | “9/24” major accident in Lixin County, Anhui Province |
| 33 | 2014 | “3/3” major accident in Hezuo City, Gansu Province |
| 34 | 2014 | “3/5” fire accident in Jilin city, Jilin Province |
| 35 | 2014 | “3/6” major accident in Yilong County, Sichuan Province |
| 36 | 2014 | “3/25” major accident on Qianjiang Section of Baotou–Maoming Expressway in Chongqing Municipality |
| 37 | 2014 | “7/19” major accident on Shanghai–Kunming Expressway in Hunan Province |
| 38 | 2014 | “8/9” major accident in Lhasa City, Tibet Autonomous Region |
| 39 | 2014 | “8/26” major accident on Guazhou Section of Lianyungang–Horgos Expressway in Gansu Province |
| 40 | 2015 | “1/16” major accident on Laizhou Section of Rongcheng–Wuhai Expressway in Shandong Province |
| 41 | 2015 | “4/4” major accident in Nayong County, Guizhou Province |
| 42 | 2015 | “5/15” major accident in Xianyang City, Shaanxi Province |
| 43 | 2015 | “6/10” major accident in Gongga County, Tibet Autonomous Region |
| 44 | 2015 | “6/26” major accident on Wuhu Section of Nanjing–Wuhu Expressway in Anhui Province |
| 45 | 2015 | “9/11” major accident on Xinxian Section of Daqing–Guangzhou Expressway in Henan Province |
| 46 | 2016 | “6/26” major accident on Chenzhou Section of Yizhang–Fengtouling Expressway in Hunan Province |
| 47 | 2016 | “7/1” major accident on Tianjin–Jizhou Expressway in Tianjin Municipality |
| 48 | 2016 | “8/20” major accident in Ziyun County, Guizhou Province |
| 49 | 2017 | “3/2” major accident in Yunxian County, Yunnan Province |
| 50 | 2017 | “4/29” major accident in Arun Banner, Inner Mongolia Autonomous Region |
| 51 | 2017 | “5/15” major accident in Yingtan City, Jiangxi Province |
| 52 | 2017 | “7/6” major accident on Longmen Section of Guangzhou–Heyuan Expressway in Guangdong Province |
| 53 | 2017 | “7/21” major accident on Yuxian Section of National Highway 109 in Hebei Province |
| 54 | 2017 | “8/10” major accident on Ankang Section of Beijing–Kunming Expressway in Shaanxi Province |
| 55 | 2018 | “2/20” major accident in Ganzhou City, Jiangxi Province |
| 56 | 2019 | “9/28” major accident on Wuxi Section of Changchun–Shenzhen Expressway in Jiangsu Province |
| Defined Levels and SubLevels of Contributory Factors | Original Survey Report Statements | |
|---|---|---|
| L1 Government regulations | ||
| X1 Road transport regulations | X1b Insufficient supervision | The Ruijin Municipal Road Transport Administrative Bureau did not strictly inspect and supervise passenger transport enterprises according to regulations. |
| X1c Regulation violations | The Ruijin Municipal Road Transport Administrative Bureau found the illegal behavior of the Ruixiang Company and Lu Xiang Company four times, but never passed on the problem indicators to the public security traffic management department for further investigation. They did not issue corrective instructions to these two passenger transport companies, and their records regarding the questioning of the enterprises were falsified. | |
| X1e Insufficient organizational synergy | The Ruijin City Transport Bureau did not guide and supervise the Ruijin City Road Transport Authority in the regulation of passenger transport enterprises in the replacement of the material submitted for road transport operating permits. | |
| X2 Road traffic safety management | X2d Inadequate inspection and supervision | There is an unreasonable distribution of duty points among the four traffic management brigades of the Ningdu County Public Security Bureau, thereby preventing the formation of a road inspection network that covers the entire county. |
| X3 Territorial supervision by the local government | X3a Poor leadership and organization | Multiple departments of the Ruijin Municipal Government do not co-operate effectively when enforcing traffic laws for passenger vehicles and passenger transport enterprises. |
| X3b Inadequate inspection and supervision | The Ruijin Municipal Government has not investigated or managed the perennial chaos of the passenger transport market. | |
| L2 Organizational influence of passenger transportation enterprises | ||
| X4 Basic safeguard | X4b Lack of safety managers | The number of safety managers at Ruixiang Transportation Enterprise was insufficient. |
| X6 Organizational culture | X6a Inadequate implementation of policies and systems | Ruixiang Transportation Enterprise did not hold safety meetings and conduct safety inspections as required. |
| X6b Incomplete management of hidden hazards | Ruixiang Transportation Enterprise failed to take strong measures to prevent overcrowding in vehicles. | |
| X6c Failure to fulfill responsibility | Ruixiang Transportation Enterprise failed to carry out effective safety management of the vehicles operated jointly with Luxiang Transportation Enterprise and failed to implement their main responsibility for safety production. | |
| X7 Operation method | X7b Improper vehicle operation | The Ruixiang company has a contract with the Luxiang company enabling it to operate and manage 20 buses of six passenger lines (including the accident bus). |
| L3 Unsafe internal operational supervision | ||
| X9 Supervision violation | X9a Non-compliant operation | In Jixiang Passenger Transportation vehicles, Luxiang Transportation Enterprise promotes overcrowding by linking driver and passenger earnings to business gains. |
| L4 Preconditions for unsafe acts by drivers | ||
| X10 Personnel factors of driver | X10a Poor safety awareness | Neither the driver nor passengers were wearing seat belts at the time of the accident. |
| X12 Weather conditions | There was precipitation at the time of the accident on the incident road. | |
| X13 Road environment | X13a Bad road alignment | The incident section has a bend radius of 275 m and a longitudinal slope of 5.72%. |
| X13b Bad road type | There is a deep ditch on the west side of the road, 6.8 m below the road surface | |
| X13c Lack of safety facility | The road section where the accident occurred is lacking in protection facilities. | |
| L5 Unsafe acts by drivers | ||
| X14 Error | X14a Skill-based error | An improper operation of the driver caused the bus to swing widely before the accident. |
| X15 Violation | X15a Habitual violation | During the time of the accident, the vehicle’s speed increased from 58 km/h to 70 km/h from 10:12:23 to 10:12:45, despite the 40 km/h speed limit. |
| L7 Moderating factors affecting accident severity and probability | ||
| X19 Individual-level factor | X19a Poor safety awareness among passengers | Some passengers were standing in the carriage at the time of the accident. |
| X20 Organizational-level factor | X20b Inadequate road/bridge safety management | In May 2017, the Jiangxi Provincial Road Administration issued an additional security project plan for the incident section, requiring completion by 1 February 2018, but by the time of the accident, The Ningdu Branch of the Ganzhou City Road Administration Bureau still had not started construction. |
| Contributory Factors | Description |
|---|---|
| ◆ Government regulations | |
| ▲ Road transport regulations | |
| • Insufficient basic guarantees | The system, methods, means, and staffing required for safety supervision are inadequate |
| • Insufficient supervision | The safety supervision of passenger transport enterprises, operating vehicles, automobile maintenance enterprises, or passenger stations is not in place |
| • Regulation violations | Violations in safety supervision, such as the violation of operational procedures, lower penalty standards, failure to correct any problems found, and failure to issue operating certificates as required |
| • Ineffective implementation of policy | Ineffective implementation of the relevant national laws, higher authorities’ regulations, local government policies, or bureau (institute) work plans |
| • Insufficient organizational synergy | Insufficient coordination with higher authorities, subordinate organizations, or other entities in handling-related matters |
| ▲ Road traffic safety management | |
| • Lax enforcement of traffic laws | Problems in road enforcement, such as inadequate supervision and ineffective investigation and punishment of violations |
| • Insufficient road access protection | Untimely problems with road traffic protection, including road hazard investigation, traffic order control, and accident rescue |
| • Inadequate safety education | Inadequate education and training of passenger transport companies and their drivers |
| • Inadequate inspection and supervision | Failure to detect the problem of unsafe operation by passenger transport companies, the inspection and supervision of the operating vehicles’ safety is not in place |
| • Ineffective implementation of policy | Failure to effectively implement the relevant laws, regulations, policies, or internal work programs |
| • Insufficient organizational synergy | Insufficient cooperation with relevant agencies in handling existing problems or problems identified during safety supervision |
| ▲ Territorial supervision by the local government | |
| • Poor leadership and organization | No effective organization and leadership of the safety supervision work of the relevant road transport safety management authorities |
| • Inadequate inspection and supervision | No effective supervision and inspection of road transport authorities, road traffic safety management agencies, and transport enterprises |
| • Regulation violations | Management beyond the authority of local safety regulations |
| • Ineffective implementation of policy | Inadequate implementation of the policies of the ministry (bureau) or higher government |
| ◆ Organizational influence of passenger transportation enterprises | |
| ▲ Basic safeguards | |
| • Inadequate production of a safety management system | Inadequate institutional system for safety management regulations, such as responsibilities for production safety, parking of non-operating vehicles, dispatching of operating vehicles, dynamic monitoring, and drivers’ safety education and training |
| • Lack of safety managers | Leaders in charge of production, full-time safety managers, and dynamic monitors are not equipped |
| • Insufficient safety budgets | Not equipped with special funds for production safety as required |
| ▲ Resource management | |
| • Poor human resource management | Inadequate management of the workers’ hiring, qualification review, education and training, remuneration, and assessment |
| • Inadequate facility resource management | Inadequate management of vehicles, dynamic monitoring equipment, or other facilities |
| ▲ Organizational culture | |
| • Inadequate implementation of policies and systems | Laws and regulations of road traffic or road transport production safety are often ignored |
| • Incomplete management of hidden hazards | Risks of production safety, such as the environment, management, and vehicle operation, are not investigated or not effectively investigated and managed |
| • Failure to fulfill responsibilities | People in charge of safety operations or safety management personnel do not perform their duties seriously |
| ▲ Operation methods | |
| • Improper business operation | Problems with the operation of passenger transport enterprises, such as contracting passenger transport enterprises to individuals, lack of guidance and supervision of branch offices, and lack of reasonable provision of competent leaders |
| • Improper vehicle operation | Passenger vehicles are often contracted or affiliated operations |
| ◆ Unsafe internal operational supervision | |
| ▲ Insufficient supervision | |
| • Poor management of drivers | Driver safety education, training, and assessment are not implemented as required by the operation management department; drivers’ violations are not strictly handled |
| • Poor vehicle management | Poor management of the vehicles’ technical safety condition, repair and maintenance, effectiveness of parts, private modification, or parking |
| • Dynamic monitoring in a virtual sense | Problems with dynamic monitoring, such as inadequate configuration, unreasonable settings, irregular operation, and lack of warning and correction of drivers’ unsafe acts |
| ▲ Supervision violations | |
| • Non-compliant operation | Irregularities in the operation, such as illegal authorization to operate, illegal organization operation, and forgery of operation materials |
| • Non-compliance with requirements | Noneffective implementation of the relevant laws of the state, regulations of road transport authorities, or correction notices of road traffic safety management agencies |
| ◆ Preconditions for unsafe acts by drivers | |
| ▲ Personnel factors of driver | |
| • Poor safety awareness | The safety concept has not been built up |
| • Lack of knowledge and skills | Lack of driving knowledge and skills |
| • Inexperience | Lack of experience and knowledge in dealing with unexpected situations |
| • Poor mental health | Unable to concentrate on safe driving due to fatigue, alcohol, or drugs |
| • Inattentiveness | Actions that distract the driver from concentrating on safe driving, such as answering the phone and chatting with passengers while driving |
| ▲ Substandard condition of vehicle parts | |
| • Not up to standard in terms of vehicle safety | Vehicle braking, driving, steering, and other components of the safety and technical condition are not up to standard, which will lead to the drivers’ errors |
| ▲ Weather conditions | |
| • Bad weather conditions | Bad weather that affects driving safety and road access conditions, such as rain, snow, and fog |
| ▲ Road environment | |
| • Bad road alignment | The road design characteristics of combined horizontal and vertical alignments that affect safe driving, such as the slope section, curve section, and curve and slope section |
| • Bad road type | From the cross-sectional view of traffic accident-prone road sections, such as near the cliff (ditch), near the water, intersections, bridges, tunnels, and width restrictions |
| • Lack of safety facilities | A defect in traffic signs, signals, lighting, or protective facilities, resulting in unsafe acts by drivers |
| • Poor road conditions | Slippery road caused by rain, snow, or ice, reducing the safety of driving |
| • Poor traffic conditions | Vehicles cannot pass normally due to construction or traffic accidents |
| ◆ Unsafe acts by Drivers | |
| ▲ Errors | |
| • Skill-based errors | Unsafe operating behavior of which the driver is rarely aware or unaware, usually related to inappropriate attention or memory loss, sometimes manifested as poor driving skills |
| • Decision-making errors | The operation is carried out as planned, but the plan is inadequate or did not apply to the situation |
| • Perceptual errors | Errors that occur when the driver’s sensory input does not match the real situation |
| ▲ Violations | |
| • Habitual violations | Intentional or habitual violation of the regulations governing road passenger transportation |
| • Incidental violations | Occasional violations of road passenger transport management regulations, non-habitual behavior |
| ◆ Proximate cause other than the driver’s act | |
| • Emergency situation related to vehicle parts | Partial system of the vehicle, such as braking, driving, or steering, breaks down in the process of driving |
| • Illegal transportation of dangerous goods | Overloading, illegal loading, or illegal transport of inflammable and explosive materials, as required by the owner of the vehicle |
| • Other vehicle ramming | The vehicle is hit by another out-of-control vehicle during normal travel |
| ◆ Moderating factors affecting accident severity and probability | |
| ▲ Individual-level factors | |
| • Poor safety awareness among passengers | Ignoring the rules of safe riding, disregarding the safety of vehicle loading, or lacking emergency self-rescue knowledge |
| • Violations by other road traffic participants | Other road traffic participants do not comply with traffic rules and affect the safe movement of the passenger vehicle |
| ▲ Organizational-level factors | |
| • Violations by other operational personnel | Vehicle investors violate road passenger transport business license or business management regulations; vehicle contract operators violate the provisions of road passenger transport regulations or contract contracts |
| • Inadequate road/bridge safety management | Road (bridge) access management, maintenance of the road (bridge), or the supervision of the road (bridge) construction project is not in place |
| • Insufficient safety management at passenger stations | Passenger station safety management, such as the inspection of vehicles entering and exiting the station or policy implementation, is not in place |
| • Inadequate safety measures in road construction | Road construction agency safety management, such as safety warning sign setting, greening changes, and hidden danger control, is not in place |
| • Errors/violations in vehicle maintenance | Vehicle maintenance errors and violations of the vehicle maintenance agencies’ regulations |
| • Violations in vehicle inspection | Irregularity in the passenger vehicle safety testing, such as reduced inspection, omission, and issuance of false inspection reports |
| Contributory Factors | 2010 | 2011 | 2012 | 2013 | 2014 | 2015 | 2016 | 2017 | 2018 | 2019 |
|---|---|---|---|---|---|---|---|---|---|---|
| L1 Government regulations | 14 | 22 | 32 | 43 | 42 | 30 | 28 | 41 | 12 | 11 |
| X1 Road transport regulations | 5 | 7 | 17 | 19 | 16 | 14 | 11 | 13 | 4 | 4 |
| X1a Insufficient basic guarantees | 0 | 0 | 0 | 1 | 0 | 1 | 1 | 0 | 0 | 0 |
| X1b Insufficient supervision | 3 | 4 | 10 | 8 | 7 | 6 | 3 | 6 | 1 | 1 |
| X1c Regulation violations | 1 | 0 | 3 | 3 | 1 | 2 | 2 | 3 | 1 | 1 |
| X1d Ineffective implementation of policy | 1 | 2 | 1 | 2 | 6 | 2 | 2 | 2 | 1 | 1 |
| X1e Insufficient organizational synergy | 0 | 1 | 3 | 5 | 2 | 3 | 3 | 2 | 1 | 1 |
| X2 Road traffic safety management | 7 | 10 | 12 | 16 | 18 | 13 | 11 | 19 | 5 | 5 |
| X2a Lax enforcement of traffic laws | 1 | 2 | 4 | 4 | 3 | 4 | 3 | 5 | 1 | 1 |
| X2b Insufficient road access protection | 1 | 2 | 1 | 2 | 2 | 1 | 0 | 0 | 0 | 0 |
| X2c Inadequate safety education | 2 | 1 | 3 | 1 | 2 | 3 | 3 | 4 | 1 | 1 |
| X2d Inadequate inspection and supervision | 3 | 3 | 4 | 3 | 5 | 4 | 3 | 4 | 1 | 1 |
| X2e Ineffective implementation of policy | 0 | 1 | 0 | 2 | 3 | 0 | 0 | 3 | 1 | 1 |
| X2f Insufficient organizational synergy | 0 | 1 | 0 | 4 | 3 | 1 | 2 | 3 | 1 | 1 |
| X3 Territorial supervision by the local government | 2 | 5 | 3 | 8 | 8 | 3 | 6 | 9 | 3 | 2 |
| X3a Poor leadership and organization | 1 | 2 | 2 | 4 | 4 | 1 | 2 | 4 | 1 | 1 |
| X3b Inadequate inspection and supervision | 1 | 3 | 1 | 4 | 4 | 1 | 2 | 3 | 1 | 1 |
| X3c Regulation violations | 0 | 0 | 0 | 1 | 1 | 0 | 0 | 0 | 0 | 0 |
| X3d Ineffective implementation of policy | 0 | 0 | 0 | 0 | 0 | 1 | 2 | 2 | 1 | 0 |
| L2 Organizational influence of passenger transportation enterprises | 24 | 11 | 44 | 61 | 48 | 33 | 24 | 37 | 8 | 10 |
| X4 Basic safeguards | 4 | 2 | 7 | 13 | 8 | 6 | 6 | 8 | 2 | 3 |
| X4a Inadequate production safety management system | 2 | 1 | 5 | 4 | 3 | 3 | 2 | 3 | 1 | 1 |
| X4b Lack of safety managers | 1 | 1 | 2 | 4 | 3 | 2 | 2 | 3 | 1 | 1 |
| X4c Insufficient safety budgets | 1 | 0 | 0 | 5 | 2 | 1 | 2 | 2 | 0 | 1 |
| X5 Resource management | 5 | 2 | 8 | 13 | 11 | 8 | 6 | 9 | 2 | 2 |
| X5a Poor human resource management | 3 | 1 | 3 | 7 | 5 | 4 | 3 | 5 | 1 | 1 |
| X5b Inadequate facility resource management | 2 | 1 | 5 | 6 | 6 | 4 | 3 | 4 | 1 | 1 |
| X6 Organizational culture | 11 | 7 | 24 | 24 | 21 | 14 | 9 | 17 | 3 | 3 |
| X6a Inadequate implementation of policies and systems | 4 | 2 | 8 | 8 | 7 | 4 | 3 | 5 | 1 | 1 |
| X6b Incomplete management of hidden hazards | 3 | 3 | 8 | 8 | 7 | 5 | 3 | 6 | 1 | 1 |
| X6c Failure to fulfill responsibilities | 4 | 2 | 8 | 8 | 7 | 5 | 3 | 6 | 1 | 1 |
| X7 Operation methods | 4 | 0 | 5 | 11 | 8 | 5 | 3 | 3 | 1 | 2 |
| X7a Improper business operation | 1 | 0 | 0 | 3 | 3 | 1 | 0 | 0 | 0 | 1 |
| X7b Improper vehicle operation | 3 | 0 | 5 | 8 | 5 | 4 | 3 | 3 | 1 | 1 |
| L3 Unsafe internal operational supervision | 11 | 6 | 32 | 39 | 29 | 18 | 15 | 22 | 5 | 4 |
| X8 Insufficient supervision | 10 | 5 | 22 | 24 | 19 | 13 | 9 | 14 | 3 | 3 |
| X8a Poor management of drivers | 4 | 2 | 7 | 8 | 6 | 5 | 3 | 6 | 1 | 1 |
| X8b Poor vehicle management | 3 | 1 | 7 | 8 | 7 | 4 | 3 | 4 | 1 | 1 |
| X8c Dynamic monitoring in a virtual sense | 3 | 2 | 8 | 8 | 6 | 4 | 3 | 4 | 1 | 1 |
| X9 Supervision violations | 1 | 1 | 10 | 15 | 10 | 5 | 6 | 8 | 2 | 1 |
| X9a Non-compliant operation | 1 | 0 | 3 | 7 | 3 | 1 | 3 | 3 | 1 | 1 |
| X9b Non-compliance with requirements | 0 | 1 | 7 | 8 | 7 | 4 | 3 | 5 | 1 | 0 |
| L4 Preconditions for unsafe acts by drivers | 15 | 18 | 32 | 44 | 29 | 30 | 8 | 19 | 3 | 3 |
| X10 Personnel factors of driver | 5 | 8 | 16 | 16 | 13 | 11 | 5 | 8 | 1 | 1 |
| X10a Poor safety awareness | 3 | 5 | 8 | 6 | 7 | 6 | 3 | 4 | 1 | 1 |
| X10b Lack of knowledge and skills | 2 | 3 | 5 | 5 | 3 | 4 | 0 | 2 | 0 | 0 |
| X10c Inexperience | 0 | 0 | 1 | 2 | 1 | 0 | 0 | 1 | 0 | 0 |
| X10d Poor mental health | 0 | 0 | 2 | 1 | 1 | 0 | 0 | 1 | 0 | 0 |
| X10e Inattentiveness | 0 | 0 | 0 | 2 | 1 | 0 | 1 | 0 | 0 | 0 |
| X11 Substandard condition of vehicle parts | 2 | 0 | 3 | 1 | 4 | 3 | 1 | 1 | 0 | 1 |
| X12 Weather conditions | 1 | 2 | 1 | 2 | 1 | 2 | 0 | 2 | 0 | 0 |
| X13 Road environment | 7 | 8 | 12 | 25 | 11 | 14 | 2 | 8 | 2 | 1 |
| X13a Bad road alignment | 2 | 1 | 3 | 4 | 3 | 2 | 0 | 2 | 0 | 0 |
| X13b Bad road type | 2 | 3 | 7 | 7 | 2 | 3 | 1 | 3 | 0 | 0 |
| X13c Lack of safety facilities | 2 | 2 | 0 | 6 | 1 | 3 | 0 | 0 | 1 | 1 |
| X13d Poor road conditions | 1 | 1 | 2 | 2 | 3 | 3 | 1 | 3 | 1 | 0 |
| X13e Poor traffic conditions | 0 | 1 | 0 | 6 | 2 | 3 | 0 | 3 | 0 | 0 |
| L5 Unsafe acts by drivers | 4 | 8 | 18 | 18 | 13 | 9 | 3 | 10 | 2 | 0 |
| X14 Errors | 2 | 5 | 10 | 10 | 9 | 4 | 0 | 6 | 1 | 0 |
| X14a Skill-based errors | 1 | 1 | 4 | 6 | 5 | 3 | 0 | 3 | 1 | 0 |
| X14b Decision-making errors | 0 | 4 | 5 | 2 | 4 | 1 | 0 | 3 | 0 | 0 |
| X14c Perceptual errors | 1 | 0 | 1 | 2 | 0 | 0 | 0 | 0 | 0 | 0 |
| X15 Violations | 2 | 3 | 8 | 8 | 4 | 5 | 3 | 4 | 1 | 0 |
| X15a Habitual violations | 2 | 1 | 7 | 7 | 4 | 5 | 3 | 4 | 1 | 0 |
| X15b Incidental violations | 0 | 2 | 1 | 1 | 0 | 0 | 0 | 0 | 0 | 0 |
| L6 Proximate cause other than the driver’s act | 3 | 6 | 3 | 3 | 3 | 2 | 2 | 3 | 1 | 1 |
| X16 Emergency situation related to vehicle parts | 0 | 1 | 1 | 0 | 0 | 1 | 0 | 0 | 0 | 1 |
| X17 Illegal transportation of dangerous goods | 2 | 1 | 1 | 2 | 1 | 1 | 2 | 0 | 1 | 0 |
| X18 Other vehicle ramming | 1 | 4 | 1 | 1 | 2 | 0 | 0 | 3 | 0 | 0 |
| L7 Moderating factors affecting accident severity and probability | 8 | 11 | 20 | 16 | 8 | 10 | 5 | 14 | 2 | 1 |
| X19 Individual-level factors | 2 | 6 | 10 | 4 | 4 | 3 | 1 | 4 | 1 | 1 |
| X19a Poor safety awareness among passengers | 1 | 4 | 7 | 2 | 1 | 2 | 1 | 0 | 1 | 1 |
| X19b Violations by other road traffic participants | 1 | 2 | 3 | 2 | 3 | 1 | 0 | 4 | 0 | 0 |
| X20 Organizational-level factors | 6 | 5 | 10 | 12 | 4 | 7 | 4 | 10 | 1 | 0 |
| X20a Violations by other operational personnel | 1 | 1 | 7 | 1 | 2 | 2 | 2 | 3 | 0 | 0 |
| X20b Inadequate road/bridge safety management | 2 | 3 | 1 | 6 | 0 | 2 | 0 | 4 | 1 | 0 |
| X20c Insufficient safety management at passenger stations | 2 | 0 | 0 | 0 | 0 | 0 | 1 | 1 | 0 | 0 |
| X20d Inadequate safety measures in road construction | 1 | 1 | 0 | 0 | 0 | 1 | 0 | 1 | 0 | 0 |
| X20e Errors/violations in vehicle maintenance | 0 | 0 | 1 | 5 | 0 | 0 | 1 | 1 | 0 | 0 |
| X20f Violations in vehicle inspection | 0 | 0 | 1 | 0 | 2 | 2 | 0 | 0 | 0 | 0 |
| L0 | 79 | 82 | 181 | 224 | 172 | 127 | 79 | 138 | 31 | 29 |
| 2010 | 2011 | 2012 | 2013 | 2014 | 2015 | 2016 | 2017 | 2018 | 2019 | |
|---|---|---|---|---|---|---|---|---|---|---|
| 79 | 82 | 181 | 224 | 172 | 132 | 85 | 146 | 33 | 30 | |
| 14 | 22 | 32 | 43 | 42 | 30 | 28 | 41 | 12 | 11 | |
| 24 | 11 | 44 | 61 | 48 | 33 | 24 | 37 | 8 | 10 | |
| 11 | 6 | 32 | 39 | 29 | 18 | 15 | 22 | 5 | 4 | |
| 15 | 18 | 32 | 44 | 29 | 30 | 8 | 19 | 3 | 3 | |
| 4 | 8 | 18 | 18 | 13 | 9 | 3 | 10 | 2 | 0 | |
| 3 | 6 | 3 | 3 | 3 | 2 | 2 | 3 | 1 | 1 | |
| 8 | 11 | 20 | 16 | 8 | 10 | 5 | 14 | 2 | 1 |
| 2010 | 2011 | 2012 | 2013 | 2014 | 2015 | 2016 | 2017 | 2018 | 2019 | |
|---|---|---|---|---|---|---|---|---|---|---|
| 0.353 | 0.366 | 0.808 | 1.000 | 0.768 | 0.567 | 0.353 | 0.616 | 0.138 | 0.129 | |
| 0.326 | 0.512 | 0.744 | 1.000 | 0.977 | 0.698 | 0.651 | 0.953 | 0.279 | 0.256 | |
| 0.393 | 0.180 | 0.721 | 1.000 | 0.787 | 0.541 | 0.393 | 0.607 | 0.131 | 0.164 | |
| 0.282 | 0.154 | 0.821 | 1.000 | 0.744 | 0.462 | 0.385 | 0.564 | 0.128 | 0.103 | |
| 0.341 | 0.409 | 0.727 | 1.000 | 0.659 | 0.682 | 0.182 | 0.432 | 0.068 | 0.068 | |
| 0.222 | 0.444 | 1.000 | 1.000 | 0.722 | 0.500 | 0.167 | 0.556 | 0.111 | 0.000 | |
| 0.500 | 1.000 | 0.500 | 0.500 | 0.500 | 0.333 | 0.333 | 0.500 | 0.167 | 0.167 | |
| 0.400 | 0.550 | 1.000 | 0.800 | 0.400 | 0.500 | 0.250 | 0.700 | 0.100 | 0.050 |
| Absolute Difference | 2010 | 2011 | 2012 | 2013 | 2014 | 2015 | 2016 | 2017 | 2018 | 2019 |
|---|---|---|---|---|---|---|---|---|---|---|
| ∆1 | 0.027 | 0.146 | 0.064 | 0.000 | 0.209 | 0.131 | 0.298 | 0.337 | 0.141 | 0.126 |
| ∆2 | 0.041 | 0.186 | 0.087 | 0.000 | 0.019 | 0.026 | 0.041 | 0.010 | 0.007 | 0.034 |
| ∆3 | 0.071 | 0.212 | 0.012 | 0.000 | 0.024 | 0.234 | 0.122 | 0.257 | 0.061 | 0.053 |
| ∆4 | 0.012 | 0.043 | 0.081 | 0.000 | 0.109 | 0.115 | 0.171 | 0.184 | 0.070 | 0.061 |
| ∆5 | 0.130 | 0.078 | 0.192 | 0.000 | 0.046 | 0.067 | 0.186 | 0.061 | 0.027 | 0.129 |
| ∆6 | 0.147 | 0.634 | 0.308 | 0.500 | 0.268 | 0.234 | 0.019 | 0.116 | 0.028 | 0.037 |
| ∆7 | 0.047 | 0.184 | 0.192 | 0.200 | 0.368 | 0.067 | 0.103 | 0.084 | 0.038 | 0.079 |
| 2010 | 2011 | 2012 | 2013 | 2014 | 2015 | 2016 | 2017 | 2018 | 2019 | |
|---|---|---|---|---|---|---|---|---|---|---|
| 0.921 | 0.685 | 0.832 | 1.000 | 0.603 | 0.708 | 0.515 | 0.484 | 0.693 | 0.715 | |
| 0.886 | 0.631 | 0.785 | 1.000 | 0.943 | 0.924 | 0.886 | 0.971 | 0.978 | 0.902 | |
| 0.818 | 0.599 | 0.962 | 1.000 | 0.929 | 0.576 | 0.722 | 0.552 | 0.838 | 0.858 | |
| 0.964 | 0.881 | 0.797 | 1.000 | 0.745 | 0.734 | 0.650 | 0.632 | 0.819 | 0.838 | |
| 0.708 | 0.802 | 0.623 | 1.000 | 0.874 | 0.826 | 0.630 | 0.840 | 0.921 | 0.710 | |
| 0.683 | 0.333 | 0.507 | 0.388 | 0.542 | 0.576 | 0.942 | 0.732 | 0.918 | 0.895 | |
| 0.870 | 0.633 | 0.623 | 0.613 | 0.463 | 0.826 | 0.755 | 0.791 | 0.892 | 0.800 |
References
- Ministry of Emergency Management of the People’s Republic of China. The Investigation Report of “9·28” Extraordinary Serious Road Traffic Accident on Changchun-Shenzhen Expressway in Wuxi, Jiangsu Province; Ministry of Emergency Management: Beijing, China, 2020. Available online: https://www.mem.gov.cn/gk/sgcc/tbzdsgdcbg/2020/202009/P020200911576236508884.pdf (accessed on 8 October 2020).
- Cafiso, S.; Di Graziano, A.; Pappalardo, G. Using the Delphi method to evaluate opinions of public transport managers on bus safety. Saf. Sci. 2013, 57, 254–263. [Google Scholar] [CrossRef]
- Bakhit, P.R.; Guo, B.B.; Ishak, S. Crash and Near-Crash Risk Assessment of Distracted Driving and Engagement in Secondary Tasks: A Naturalistic Driving Study. Transport. Res. Rec. 2018, 2672, 245–254. [Google Scholar] [CrossRef]
- Sajid, F.; Javed, A.R.; Basharat, A.; Kryvinska, N.; Afzal, A.; Rizwan, M. An Efficient Deep Learning Framework for Distracted Driver Detection. IEEE Access 2021, 9, 169270–169280. [Google Scholar] [CrossRef]
- Vennelle, M.; Engleman, H.M.; Douglas, N.J. Sleepiness and sleep-related accidents in commercial bus drivers. Sleep Breath. 2010, 14, 39–42. [Google Scholar] [CrossRef] [PubMed]
- Kim, H.; Jang, T.W.; Kim, H.R.; Lee, S. Evaluation for Fatigue and Accident Risk of Korean Commercial Bus Drivers. Tohoku J. Exp. Med. 2018, 246, 191–197. [Google Scholar] [CrossRef] [PubMed] [Green Version]
- Chung, W.Y.; Chong, T.W.; Lee, B.G. Methods to Detect and Reduce Driver Stress: A Review. Int. J. Automot. Technol. 2019, 20, 1051–1063. [Google Scholar] [CrossRef]
- Papalimperi, A.H.; Athanaselis, S.A.; Papadodima, S.A. Incidence of fatalities of road traffic accidents associated with alcohol consumption and the use of psychoactive drugs: A 7-year survey (2011–2017). Exp. Ther. Med. 2019, 18, 2299–2306. [Google Scholar] [CrossRef] [Green Version]
- McCollum, E. Effectiveness of an intervention to reduce accidents in bus drivers. Occup. Med. 2022, 72, 252–254. [Google Scholar] [CrossRef]
- Tseng, C.M. Social-demographics, driving experience and yearly driving distance in relation to a tour bus driver’s at-fault accident risk. Tour. Manag. 2012, 33, 910–915. [Google Scholar] [CrossRef]
- Klinjun, N.; Kelly, M.; Praditsathaporn, C.; Petsirasan, R. Identification of Factors Affecting Road Traffic Injuries Incidence and Severity in Southern Thailand Based on Accident Investigation Reports. Sustainability 2021, 13, 12467. [Google Scholar] [CrossRef]
- Zhou, C.Y.; Zhao, X.; Huang, R. Dynamic bayesian network-based escape probability estimation for coach fire accidents. Promet-TrafficTransportation 2021, 33, 193–204. [Google Scholar] [CrossRef]
- Gamero, N.; Silla, I.; Sainz-Gonzalez, R.; Sora, B. The Influence of Organizational Factors on Road Transport Safety. Int. J. Environ. Res. Public Health 2018, 15, 1938. [Google Scholar] [CrossRef] [PubMed] [Green Version]
- Naevestad, T.O.; Phillips, R.O.; Laiou, A.; Bjørnskau, T.; Yannis, G. Safety culture among bus drivers in Norway and Greece. Transp. Res. Part F 2019, 64, 323–341. [Google Scholar] [CrossRef]
- Mokarami, H.; Alizadeh, S.S.; Pordanjani, T.R.; Varmazyar, S. The relationship between organizational safety culture and unsafe behaviors, and accidents among public transport bus drivers using structural equation modeling. Transp. Res. Part F 2019, 65, 46–55. [Google Scholar] [CrossRef]
- Wang, S.Y.; Wu, K.F. Reducing intercity bus crashes through driver rescheduling. Accid. Anal. Prev. 2019, 122, 25–35. [Google Scholar] [CrossRef]
- Wu, X.L.; Zhang, H.M.; Xiao, W.X.; Ning, P.S.; Schwebel, D.C.; Hu, G.Q. Are bus company regulations associated with crash risk? Findings from a retrospective survey in four Chinese cities. Int. J. Environ. Res. Public Health 2019, 16, 1342. [Google Scholar] [CrossRef] [Green Version]
- La, Q.N.; Duong, D.V.; Lee, A.H.; Meuleners, L.B. Factors underlying bus-related crashes in Hanoi, Vietnam. Transp. Res. Part F 2017, 46, 426–437. [Google Scholar] [CrossRef]
- Ali, Q.; Yaseen, M.R.; Khan, M.T.I. Road traffic fatalities and its determinants in high-income countries: A continent-wise comparison. Environ. Sci. Pollut. Res. 2019, 26, 19915–19929. [Google Scholar] [CrossRef]
- Obregon-Biosca, S.A.; Betanzo-Quezada, E.; Romero-Navarrete, J.A.; Ríos-Nuñez, M. Rating road traffic education. Transp. Res. Part F 2018, 56, 33–45. [Google Scholar] [CrossRef]
- Chu, H.C. Assessing factors causing severe injuries in crashes of high-deck buses in long-distance driving on freeways. Accid. Anal. Prev. 2014, 62, 13–136. [Google Scholar] [CrossRef]
- Yusof, M.b.; bin Afripin, M.A.A. Effect of Beam Profile Size on Bus Superstructure Strength Having Rollover Crash. Appl. Mech. Mater. 2013, 372, 620–629. [Google Scholar] [CrossRef]
- Xu, A.; Qiao, X.M. Research on traffic accident and braking safe performances of inter-urban coach. In Proceedings of the The International Symposium on Safety Science and Technology, Beijing, China, 24–27 September 2008. [Google Scholar]
- Hammad, H.M.; Ashraf, M.; Abbas, F.; Bakhat, H.F.; Qaisrani, S.A.; Mubeen, M.; Fahad, S.; Awais, M. Environmental factors affecting the frequency of road traffic accidents: A case study of sub-urban area of Pakistan. Environ. Sci. Pollut. Res. 2019, 26, 5674–5685. [Google Scholar] [CrossRef] [PubMed]
- Huang, H.; Wang, J.; Hou, M.; Tang, X.; Cheng, J.C. Analysis of Wind as a Contributing Factor in Bus Accidents in Rolling Terrain. In Proceedings of the 19th COTA International Conference of Transportation Professionals, Nanjing, China, 6–8 July 2019. [Google Scholar] [CrossRef]
- Karlaftis, M.G.; Golias, I. Effects of road geometry and traffic volumes on rural roadway accident rates. Accid. Anal. Prev. 2002, 34, 357–365. [Google Scholar] [CrossRef]
- Xu, X.C.; Saric, Z.; Zhu, F.; Babic, D. Accident severity levels and traffic signs interactions in state roads: A seemingly unrelated regression model in unbalanced panel data approach. Accid. Anal. Prev. 2018, 120, 122–129. [Google Scholar] [CrossRef] [PubMed]
- Li, X.L.; Kuang, H.; Fan, Y.H.; Zhang, G.X. Traffic accidents on a single-lane road with multi-slowdown sections. Int. J. Mod. Phys. C. 2014, 25, 1450036. [Google Scholar] [CrossRef]
- Shappell, S.A.; Wiegmann, D.A. A Human Error Approach to Accident Investigation: The Taxonomy of Unsafe Operations. Int. J. Aviat. Psychol. 1997, 7, 269–291. [Google Scholar] [CrossRef]
- Jiang, W.; Han, W. Analysis of “2·28” KEEPER Chemical Industries Hazardous Chemical Explosion Accident Based on FTA and HFACS. Int. J. Environ. Res. Public Health 2018, 15, 2151. [Google Scholar] [CrossRef] [Green Version]
- Umut, Y.; Ersan, B.; Özkan, U. Assessment of collisions and grounding accidents with human factors analysis and classification system (HFACS) and statistical methods. Saf. Sci. 2019, 119, 412–425. [Google Scholar] [CrossRef]
- Zhan, Q.; Zheng, W.; Zhao, B. A hybrid human and organizational analysis method for railway accidents based on HFACS-Railway Accidents (HFACS-RAs). Saf. Sci. 2017, 91, 232–250. [Google Scholar] [CrossRef]
- Ugurlu, O.; Yildiz, S.; Loughney, S.; Wang, J. Modified human factor analysis and classification system for passenger vessel accidents (HFACS-PV). Ocean Eng. 2018, 161, 47–61. [Google Scholar] [CrossRef] [Green Version]
- Chen, S.T. An approach of identifying the common human and organisational factors (HOFs) among a group of marine accidents using GRA and HFACS-MA. J. Transp. Saf. Secur. 2020, 12, 1252–1294. [Google Scholar] [CrossRef]
- Lin, Z.; Fu, G.; Xue, Y.J.Y. Human and organizational factors in Chinese hazardous chemical accidents: A case study of ‘8.12’ Tianjin Port fire and explosion using the HFACS-HC. Int. J. Occup. Saf. Ergon. 2018, 24, 329–340. [Google Scholar] [CrossRef]
- Nwankwo, C.D.; Arewa, A.O.; Theophilus, S.C.; Esenowo, V.N. Analysis of accidents caused by human factors in the oil and gas industry using the HFACS-OGI framework. Int. J. Occup. Saf. Ergon. 2022, 28, 1642–1654. [Google Scholar] [CrossRef]
- Ye, G.; Tan, Q.; Gong, X.L.; Xiang, Q.T.; Wang, Y.H.; Liu, Q.J. Improved HFACS on Human Factors of Construction Accidents: A China Perspective. Adv. Civ. Eng. 2018, 2018, 4398345. [Google Scholar] [CrossRef]
- Zhang, Y.; Jing, L.; Sun, C.; Fang, J.L.; Feng, Y. Human factors related to major road traffic accidents in China. Traffic Inj. Prev. 2019, 20, 796–800. [Google Scholar] [CrossRef]
- Zhang, X.Y.; Hu, W.W.; Zhou, J.L.; Zuo, Q.J.; Wu, R.L.; Tang, Z.X. The Failure Route between Active and Latent Error in Bus Accident. IEEE Access 2019, 9, 164941–164951. [Google Scholar] [CrossRef]
- The State Council of the People’s Republic of China. Regulations on Investigation and Handling of Production Safety Accidents; State Council: Beijing, China, 2007. Available online: http://www.gov.cn/flfg/2007-04/19/content_589264.htm (accessed on 12 October 2020).
- Schreier, M. Qualitative Content Analysis in Practice; Sage: London, UK, 2012; pp. 230–240. [Google Scholar]
- Krippendorff, K. Content Analysis: An Introduction to Its Methodology; Sage: Thousand Oaks, CA, USA, 1980; pp. 29–31. [Google Scholar]
- Elo, S.; Kyngäs, H. The qualitative content analysis process. J. Adv. Nurs. 2010, 62, 107–115. [Google Scholar] [CrossRef] [PubMed]
- Glaser, B.; Strauss, A. The Discovery of Grounded Theory: Strategies for Qualitative Research; Aldine: Chicago, IL, USA, 1967; pp. 56–70. [Google Scholar]
- Strauss, A.; Corbin, J. Basics of Qualitative Research: Grounded Theory Techniques and Procedures; Sage: Newbury Parks, CA, USA, 1990; pp. 61–142. [Google Scholar]
- Akyuz, E. A marine accident analysing model to evaluate potential operational causes in cargo ships. Saf. Sci. 2017, 92, 17–25. [Google Scholar] [CrossRef]
- Jing, L.; Bai, Q.; Guo, W.; Yan Feng, Y.; Liu, L.; Zhang, Y.Y. Contributory factors interactions model: A new systems-based accident model. Syst. Res. Behav. Sci. 2019, 37, 255–276. [Google Scholar] [CrossRef]
- Wang, X.L.; Li, X.X.; Guan, W.L.; Peng, S.T. Study on Wharf Accidents Based on the Grey Cor-relation Analysis. Appl. Mech. Mater. 2014, 505–506, 683–688. [Google Scholar] [CrossRef]
- Guo, Y.; Sun, Y.; Chen, S. Research on Human-Error Factors of Civil Aircraft Pilots Based on Grey Relational Analysis. MATEC Web Conf. 2018, 151, 05005. [Google Scholar] [CrossRef] [Green Version]
- Leveson, N. Engineering a Safer World: Systems Thinking Applied to Safety; MIT Press: Cambridge, MA, USA, 2011. [Google Scholar]
- Choi, Y.; Park, J.H.; Jang, B. Developing safety checklists for predicting accidents. In Proceedings of the International Conference on Information and Communication Technology Convergence (ICTC), Jeju Island, Republic of Korea, 17–19 October 2018. [Google Scholar] [CrossRef]
- Ministry of Transport of the People’s Republic of China. Regulations on the Safety Management of Road Passenger Transport Companies; Ministry of Transport: Beijing, China, 2018. Available online: https://xxgk.mot.gov.cn/2020/jigou/ysfws/202006/t20200623_3315491.html (accessed on 12 October 2020).
- Jackson, M.C. Critical Systems Thinking and the Management of Complexity; John Wiley & Sons Ltd.: West Sussex, UK, 2019; pp. 261–289. [Google Scholar]
| Original Survey Report Statements | Open Coding | Axial Coding | Selective Coding | ||
|---|---|---|---|---|---|
| Labeling | Conceptualizing | Sub-Category | Generic Category | Main Category | |
| 6 March 2014: The driver drove a Chuan R41518 bus on the road and slid downhill in neutral gear near Wuyi bridge. | Sliding downhill in neutral gear | Improper operation | Skill-based error | Errors | Drivers’ unsafe acts |
| 10 November 2012: The driver drove the motor vehicle onto *** Road without maintaining a safe speed. | Failure to maintain safe speed | Unsafe vehicle speed | Decision-making errors | ||
| 24 September 2013: The driver’s failure to carefully observe the intersection was the direct cause of the accident. | Failure to observe carefully | Pass without confirmation of safety | |||
| 19 February 2013: EQ01466 bus drove to *** Town, and when it encountered a vehicle driving in the opposite direction, it was too close to the edge (cliff). | Too close to the edge when encountering oncoming traffic | Misjudged lateral distance | Perceptual error | ||
| 12 April 2012: The accident was caused directly by ***, the driver of the Anhui L60670 bus, illegally occupying the other lane and colliding with oncoming traffic. | Illegally occupying the other lane | Driving in the opposite direction | Incidental violation | Violations | |
| 28 August 2011: At the time of the accident, the vehicle was traveling at a speed greater than 65 km/h. | Exceeding the speed limit | Exceeding the speed limit | Habitual violations | ||
| 10 June 2015: The large ordinary bus AL0240 overtook two trucks loaded with sand and gravel at 23 km + 300 m, scraped against AR0117 coming from the opposite direction, and fell over the steep cliff. | Illegal overtaking | Illegal overtaking | |||
| Categories of the Selective Coding Stage | Cohen’s κ Scores |
|---|---|
| L1: Government regulations | 0.78 b |
| L2: Organizational influence of passenger transportation enterprises | 0.85 a |
| L3: Unsafe internal operational supervision | 0.84 a |
| L4: Preconditions for unsafe acts by drivers | 0.92 a |
| L5: Unsafe acts by drivers | 0.95 a |
| L6: Proximate cause other than driver’s act | 0.86 a |
| L7: Moderating factors affecting accident severity and probability | 0.82 a |
| L1 | L2 | L3 | L4 | L5 | |||||
| X1 | 0.711 | X4 | 0.712 | X8 | 0.747 | X10 | 0.803 | X14 | 0.743 |
| X2 | 0.823 | X5 | 0.778 | X9 | 0.670 | X11 | 0.630 | X15 | 0.712 |
| X3 | 0.692 | X6 | 0.715 | X12 | 0.633 | ||||
| X7 | 0.644 | X13 | 0.801 | ||||||
| L6 | L7 | ||||||||
| X16 | 0.479 | X19 | 0.690 | ||||||
| X17 | 0.662 | X20 | 0.679 | ||||||
| X18 | 0.577 |
| X1 | X2 | X3 | X4 | X5 | |||||
| X1a | 0.576 | X2a | 0.784 | X3a | 0.851 | X4a | 0.743 | X5a | 0.757 |
| X1b | 0.794 | X2b | 0.582 | X3b | 0.807 | X4b | 0.797 | X5b | 0.734 |
| X1c | 0.755 | X2c | 0.725 | X3c | 0.580 | X4c | 0.636 | ||
| X1d | 0.683 | X2d | 0.755 | X3d | 0.604 | ||||
| X1e | 0.775 | X2e | 0.636 | ||||||
| X2f | 0.646 | ||||||||
| X6 | X7 | X8 | X9 | X10 | |||||
| X6a | 0.767 | X7a | 0.655 | X8a | 0.734 | X9a | 0.617 | X10a | 0.840 |
| X6b | 0.767 | X7b | 0.810 | X8b | 0.751 | X9b | 0.642 | X10b | 0.793 |
| X6c | 0.800 | X8c | 0.767 | X10c | 0.641 | ||||
| X10d | 0.641 | ||||||||
| X10e | 0.579 | ||||||||
| X13 | X14 | X15 | X19 | X20 | |||||
| X13a | 0.753 | X14a | 0.593 | X15a | 0.868 | X19a | 0.802 | X20a | 0.695 |
| X13b | 0.785 | X14b | 0.796 | X15b | 0.493 | X19b | 0.680 | X20b | 0.727 |
| X13c | 0.750 | X14c | 0.653 | X20c | 0.572 | ||||
| X13d | 0.617 | X20d | 0.572 | ||||||
| X13e | 0.743 | X20e | 0.636 | ||||||
| X20f | 0.547 |
| Proximate Causes | Frequency (Percentage) | ||
|---|---|---|---|
| Proximate causes | L5: Unsafe acts by drivers | X14 Errors | 47 (42.0) |
| X15 Violations | 38 (33.9) | ||
| L6: Proximate cause other than the driver’s act | X16 Emergency situation related to vehicle parts | 4 (3.6) | |
| X17 Illegal transportation of dangerous goods | 11 (9.8) | ||
| X18 Other vehicle ramming | 12 (10.7) | ||
| Total | 112 (100) | ||
Publisher’s Note: MDPI stays neutral with regard to jurisdictional claims in published maps and institutional affiliations. |
© 2022 by the authors. Licensee MDPI, Basel, Switzerland. This article is an open access article distributed under the terms and conditions of the Creative Commons Attribution (CC BY) license (https://creativecommons.org/licenses/by/4.0/).
Share and Cite
Sha, Y.; Hu, J.; Zhang, Q.; Wang, C. Systematic Analysis of the Contributory Factors Related to Major Coach and Bus Accidents in China. Sustainability 2022, 14, 15354. https://doi.org/10.3390/su142215354
Sha Y, Hu J, Zhang Q, Wang C. Systematic Analysis of the Contributory Factors Related to Major Coach and Bus Accidents in China. Sustainability. 2022; 14(22):15354. https://doi.org/10.3390/su142215354
Chicago/Turabian StyleSha, Yongzhong, Junyan Hu, Qingxia Zhang, and Chao Wang. 2022. "Systematic Analysis of the Contributory Factors Related to Major Coach and Bus Accidents in China" Sustainability 14, no. 22: 15354. https://doi.org/10.3390/su142215354