Abstract
Thirty-four surface soil samples were collected from the palm farms of the Al-Ammariah area, northwest Riyadh, Saudi Arabia to assess the contamination and environmental risk of potentially toxic elements (PTEs). Aluminum (Al), arsenic (As), cadmium (Cd), cobalt (Co), chromium (Cr), copper (Cu), iron (Fe), mercury (Hg), manganese (Mn), nickel (Ni), lead (Pb), antimony (Sb), strontium (Sr), uranium (U), vanadium (V), and zinc (Zn) were analyzed using inductively coupled plasma–atomic emission spectroscopy (ICP–AES). Several pollution indices were employed to assess contamination and to evaluate the environmental risks of these PTEs. Average values (mg/kg) for Cr (19.97), Pb (5.08), Cu (11.36), Zn (52.16), Ni (26.94), Co (3.89), and V (18.94) were under the values recorded for soils globally, while the average values of Hg (0.50) and U (8.06) were greater than the average values of worldwide soils. Pollution indices indicated that the studied soils exhibited indications of severe enrichment and significant contamination with Hg, and moderately severe enrichment with U and As. The potential ecological (RI) findings indicated a moderate level of risk posed by PTEs in the study area. The potentially toxic elements originated from both natural and human sources, largely due to chemical weathering of the neighboring mountains, in addition to the widespread utilization of insecticides and fertilizers.
1. Introduction
Soil contamination is defined as any natural or anthropogenic material that accumulates in soil and can cause adverse changes in the bio-soil system [1]. Urbanization and associated industrialization due to economic development of many societies entail the accumulation of PTEs [2,3]. The pollution of soil with PTEs from pesticides, fertilizers, mining activities, and factory operations has attracted attention and would lead to the PTEs from the soil entering the human body through dermal inhalation and ingestion pathways [4,5]. While the effects of PTEs such as Ni, Cu, Zn, and Mn can be positive to a certain extent, the effects of different PTEs (Pb, Cr, Hg, As, Cd, and Zn) on soils, animals, plants, and humans are negative. Such negative impacts are attributed to their non-degradable nature coupled with their bioaccumulation and persistence as well bioamplification within food chains [6,7]. Potentially toxic elements negatively affect soils by triggering a reduction in the fertility and biodiversity of the soil, nitrogen fixation, and crop yields in addition to soil loss. Conversely, both humans and animals can be harmed, including impacts on the nervous system, abnormal behaviors, and a decrease in intelligence in adults [8]. Furthermore, wastewater that contains PTEs could cause soils to be contaminated via irrigation along with fruit and vegetables planted in these soils, which will have a subsequent detrimental impact on the health of humans [9].
Chemical and physical properties of soil can have a direct impact on types and concentrations of PTEs via the usage of fertilizers that contain various PTEs [10]. PTEs do not degrade naturally and are converted into metal compounds with increased toxicity and can seriously affect crop yield and quality [11]. From the different PTEs, Pb and Cd have been identified as being highly toxic and persistent [12]. Hence, if it is determined that soils are polluted with PTEs, it is critical that the association among the distribution of PTEs within the soils as well as the different patterns of land use is identified for the purpose of alleviating the impacts of PTE contamination [13].
Saudi Arabia is the largest country in the Middle East, with a total area of approximately 2.25 million km2 [14]. Topographically, Saudi Arabia is characterized by various natural features, including mountains, plateaus, plains, valleys, and sand dunes. Geologically, Saudi Arabia is divided into four distinct terrains [15]: The Proterozoic Arabian Shield of metamorphosed volcanosedimentary successions intruded by granite and gabbro, the Arabian platform dipping gently eastward, the Tertiary ‘harrats’ mainly overlying the Shield, and the narrow Red Sea coastal plain of Tertiary and Quaternary sedimentary rocks and coral reefs [16].
Saudi Arabia is characterized by a variety of soil types based on their mineralogical properties and the rocks from which they were derived [17] (Shadfan et al., 1984). The soils range from Torrifluvents and Gypsiorthids in the eastern region of coarse texture with high salt, gypsum, and carbonate contents to Haplargids with minor amounts of carbonate and salt in the western region. Soils of the central region are characterized by Torriorthents, Torrifluvents, and Torripsamments of medium to coarse texture with smaller amounts of gypsum and salt, with dominance of quartz, carbonate, feldspars, and kaolinite. Most soils in Saudi Arabia could be considered immature or young soils due to the dearth of moisture [18]. According to the modern US soil classification, Saudi Arabian soil can be divided as follows: Entisols, the sandy soils and valleys that form modern lands; Aridisols, dry soils that contain accumulations of lime and salts; and Mollisols, soils that are rich in organic matter and concentrated in the southwest region of the Saudi Kingdom [14,19,20].
Saudi Arabia ranks second in terms of global date palm production [21]. The Al-Ammariah area largely comprises palm farms producing dates, fruits, leafy green plants, and vegetables. The average values of As, Hg, Cd, and Se in soil from the Al Uyaynah–Al Jubailah region beyond the present study area in northwest Riyadh were greater than the those in worldwide soils and continental crust, and have been attributed mainly to the chemicals used in agricultural applications and P fertilizers [7]. The most likely potential sources of soil pollution by copper, lead, nickel, chromium, and zinc in Riyadh were domestic wastes, smelting, plant waste, car exhaust, and coal combustion [22]. Since soil is important for food safety and impacts human health directly, the objectives of the present study are to determine spatial distribution and the environmental risk of PTEs and to detect their potential sources in the study area.
2. Material and Methods
Al-Ammariah is located in northwest Riyadh, Saudi Arabia (Figure 1). Geologically, the study area primarily comprises a combination of marine carbonates and siliciclastics from the upper Jurassic Hanifa Formation, Jubaila Formation, and Quaternary sediments (Figure 2). The Hanifa Formation lies atop the Tuwaiq Mountain Formation in a disconformable manner and its base comprises muddy carbonates with lagoonal carbonates overlying them [23,24]. The Jubaila Formation lies atop the Hanifa Formation in a disconformable manner and its base comprises marine carbonates at a moderate depth with the upper layers consisting of shallow marine stromatoporoid-associated assemblages [25].
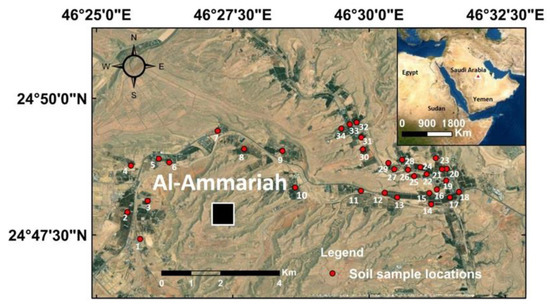
Figure 1.
Location map of the study area and sampling sites.
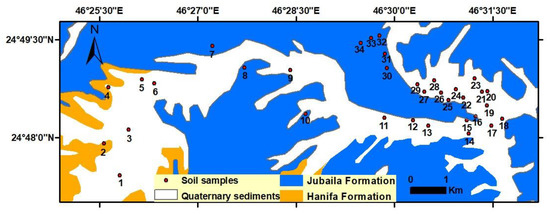
Figure 2.
Sampling location map and stratigraphic lithology of the study area.
A total of 34 topsoil samples were gathered from palm farms located in Al-Ammariah, northwest Riyadh, Saudi Arabia (Figure 1). Sample collection was performed at a maximum depth of 5 cm from the soil surface, using a plastic hand trowel. At each sampling station, a composite sample consisting of three subsamples was thoroughly mixed to have a representative sample. Samples were stored in plastic sample bags and placed in an icebox. In the laboratory, soil samples were air-dried and, after removing large rocks and organic debris, were manually disaggregated by an agate mortar and pestle followed by size fractionation using a nest of sieves (>500 μm, 500–250 μm, 250–125 μm, 125–63 μm, and <63 μm). Analysis of V, Fe, Sr, Al, As, Hg, Sb, Cd, Co, Mn, Ni, Zn, Cr, Pb, and Cu was performed utilizing inductively coupled plasma–atomic emission spectrometry (ICP–AES) at the Jeddah branch of the ALS Geochemistry Lab in Saudi Arabia. First, 0.50 g of the <63 μm fraction was digested using HNO3-HCl aqua regia for a period of 45 min within a graphite heating block [26]. Subsequent to being cooled, deionized water was used to dilute the solution to 12.5 mL, after which it was mixed and analyzed. Validation of the ICP–AES technique was performed with regard to the linearity, limits of detection (LODs), and limits of quantification (LOQs), as well as whether it was accurate and precise. Three samples were analyzed in duplicate to verify the precision of analysis. The ALS Geochemistry Laboratory used a standard analytical batch including a reagent blank to measure background and certified reference material (CRM) to ensure the accuracy of data prior to release. Supplementary Table S1 presents the land use pattern of the region being investigated, the coordinates of the studied sites, the analysis of PTEs, and the coefficient of variation (CV), while Supplementary Table S2 presents the results of the grain size analysis of the investigated soil samples.
The sediment quality guideline (SQG) process was utilized for the purpose of predicting the harmful outcomes generated by contaminated soils on microorganisms [27]. The lack of the concentration values present in soil before human occupation and industrial development is one of the main difficulties related to evaluating the impact of anthropogenic activities on soil [28]. The enrichment factor, EF [29], geoaccumulation index, I-geo [30], contamination factor, CF [31], and pollution load index, PLI [32], were employed to assess HM contamination in studied soils compared with a reference reflecting a natural condition [8,33,34]. Herein, the concentration values of Turekian and Wedepohl [35] were used as a background reference. The indices are classified in Supplementary Table S3, and calculated according to the following formulas:
where Cmsample is the sample metal being analyzed in the sample examined, Cmbackground is the degree of the normalizer element, M is the metal being analyzed, X is a normalizer element’s level (Fe), Co is the content of metal within soil and Cb is the metal’s standard background value, CF is the contamination factor and CFn stands for the contamination factor of metal n, Eri denotes a given element’s potential ecological risk factor, Tri represents the biological toxic response factor of a specific element, and Cf stands for the contamination factor of every individual element. The multivariate statistical techniques utilized for the purpose of determining potential sources of PTEs within the analyzed sediment included hierarchical clustering analysis (HCA), Pearson’s correlation coefficients, and principal component analysis (PCA).
EF = (M/X)sample ÷ (M/X)background
I-geo = Log2 (Cmsample ÷ 1.5× Cmbackground)
CF = C0 ÷ Cb
PLI = (CF1 × CF2 × CF3 × CF4…. × CFn)1/n.
Eri = Tri × Cfi
3. Results
3.1. Spatial Distribution of Potentially Toxic Elements
The average PTE levels (mg/kg) within the soil samples in descending order were: Fe (11581) > Al (6331) > Sr (247) > Mn (180) > Zn (52.16) > Ni (26.94) > Cr (19.97) > V (18.94) > Cu (11.36) > U (8.06) > Pb (5.08) > Co (3.89) > As (3.78) > Sb (1.08) > Hg (0.50) > Cd (0.25). Table 1 shows the minimums, maximums, and averages of the PTEs (mg/kg) within the studied area, as well as comparison with the local and the background references and sediment quality. The highest values for Al, Co, Cr, Fe, Pb, and V were recorded in S2 (12400, 8.00, 34.0, 18100, 8.00, and 33.0 mg/kg, respectively). The highest value for As (6.00 mg/kg) was recorded for S18, whereas the highest values for Cu and Zn were recorded in S26 (30.0 and 261 mg/kg, respectively). Furthermore, the highest values for Ni (51.0 mg/kg), Mn (311 mg/kg), and Sr (653 mg/kg) were recorded in S27, S28, and S29. The average values for Cr, Pb, Cu, Zn, Ni, Co, and V were under those of the global references [36,37], the Earth’s crust [38], and the continental crust [39,40]. Conversely, the average values for U and Hg were higher than the aforementioned backgrounds for soils globally and the Earth’s crust, suggesting that the widespread usage of fertilizers is influential. Nevertheless, the average values for As, Cd, and Sr varied when compared with the aforementioned backgrounds (Table 1).

Table 1.
Minimum, maximum, average (mg/kg), and standard deviation of PTEs in the study area and the average levels in other Saudi and worldwide soils and sediment quality guidelines.
Pearson correlation coefficient indicated positive correlations between various pairs of elements, including Al–As, Al–Co, Al–Cr, Al–Fe, Al–Mn, Al–Ni, Al–Pb, Al–Sr, and Al–V, implying that the aforementioned PTEs were from similar sources (Table 2). As Fe, Al, and Mn were present in positive correlations with PTEs, this suggests that they originated from natural sources—at least partially—due to weathering from the Jurassic rocks found in the neighboring mountains [41]. The Q-mode HCA grouped the soil samples into three clusters (Figure 3). A total of 19 samples are included in the first cluster (S3–S5, S7, S9, S15, S17, S18, S20, S22–S26, S28–30, S32, and S34), whose concentrations of Zn, Sr, Mn, Cu, and As were the highest. Conversely, the second cluster accounted for nine samples (S1, S6, S10, S11, S13, S16, S22, S31, and S33), whose concentrations of Al, As, Fe, Mn, Zn, Co, Cr, Ni, Pb, U, Sr, and V were the lowest. Lastly, the third cluster includes six samples (S2, S8, S12, S19, S21, and S27), whose concentrations of Al, Co, Cr, Fe, Pb, Ni, and V were the highest. The grain sizes 500–250 μm and 250–125 μm represent the fundamental sizes within most samples. A size less than 63 μm was more common in samples S2, S8, S20–S22, S26–S29, which recorded the highest values of the PTEs.
Table 2.
Correlation matrix for PTEs of soil samples.
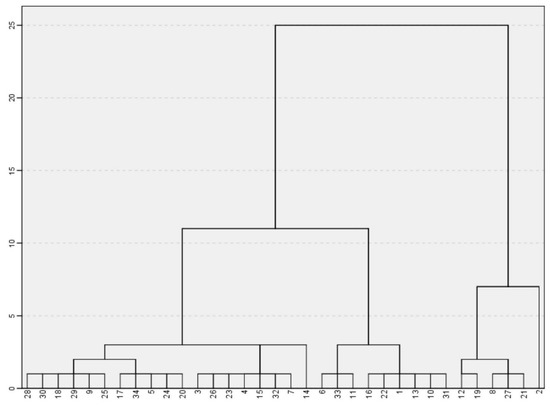
Figure 3.
Q-mode HCA of soil samples.
Two principal components accounting for 79.82% of the total variance were extracted from principal component analysis (Table 3, Figure 4). The PC1 explained 65.18% and showed strong association with Al, As, Co, Cr, Fe, Mn, Ni, Pb, Sr, and V. The presence of Fe, Al, and Mn suggested natural processes, however, the average enrichment factor for As was 9.13 (Table 4), implying anthropological contributions, mostly from agricultural activities [42]. The PC2 accounted for 14.65% of the overall variance and exhibited a strong association with Cu and Zn, indicating an anthropogenic source, mostly from phosphate fertilizers [43,45].
Table 3.
Loading matrix of PCs and the total variance explained by each PC.
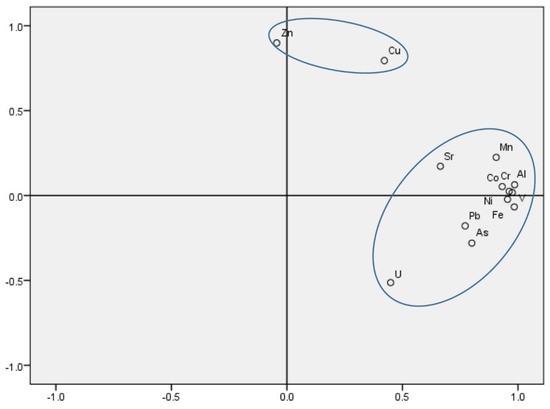
Figure 4.
Factor analysis and distribution of PTEs in two component plots.
Table 4.
Minimum, maximum, and average values of the EF, I-geo, CF, PLI, and Eri.
3.2. Environmental Risk Assessment
Pollution indices are tools used to assess PTE contamination in soil environments [7,46,47,48]. Results of enrichment factors in Table 4 suggested that the investigated palm soils are very severely enriched with Hg (average EF = 26.24), severely enriched with As and U (average EF = 5–10), and moderately enriched with Cd and Sb (average EF = 3–5). As the enrichment values were higher, this suggests that the aforementioned PTEs have anthropogenic origins, predominantly from the widespread usage of insecticides and fertilizers [37]. Figure 5 presents the spatial distribution of EF for PTEs greater than 2. It was indicated that the EF for Hg, As, Cd, and U was increased in the western and southern areas of the investigated region, while Sr and Sb increased in the northeastern part (Figure 5). However, the eastern, northern, and western parts reported an increase in RI values, which may be attributed to the increase in CF values. The findings of the geoaccumulation index (I-geo) revealed moderate levels of U and Hg contamination (1 < I-geo < 2), unpolluted to moderately contaminated with Cd and As (0 < I-geo < 1), and there was no indication of any contamination by the other PTEs (I-geo < 0). Nevertheless, specific samples such as S8, S12, S19, and S27 exhibited increased I-geo values, implying that the levels of U and Hg pollution were moderate to severe (2 < I-geo < 3).
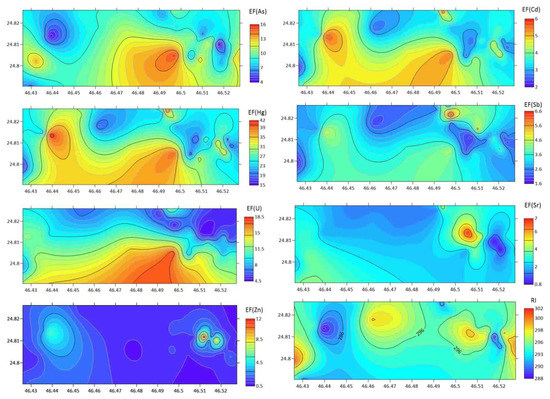
Figure 5.
Spatial distribution of EF for PTEs greater than 2 and RI in the study area.
Based on the average values of the contamination factor (CF), the soil samples were very highly polluted with Hg (Cf ≥ 6), moderately polluted with U and As (1 ≤ Cf < 3), and the values for the other PTEs revealed low levels of contamination. Similar to EF and I-geo, the CF values for specific samples of soil were high, including S2 and S18 for As. The pollution load index (PLI) is a tool utilized to ascertain the extent to which PTEs have contaminated a specific location [49,50]. Results of the PLI indicated that the soils were not polluted with PTEs (PLI < 1). A potential ecological risk assessment (RI) is a beneficial tool that allows researchers to understand and control heavy metal pollution of the ecology of a given region [50]. According to the average ecological risk factor values, the risk of Hg was high (160 ≤ Eri < 320) but the remaining PTEs exhibited minimal to no risk. The potential ecological (RI) outcomes ranged between 276.42 and 314.380, where the average was 296.39, suggesting moderate risk. Compared to the sediment quality guideline maximum and minimum trigger values [51], it was found that none of the PTE values exceeded ISQG-High. Nevertheless, across the samples of soil, the Cu, As, Cd, Pb, and Cr values were under ISQG-Low, indicating that these PTEs presented no risk. Each of the Hg values was in the range between ISQG-Low (0.15 mg/kg) and ISQG-High (1.0), implying moderate levels of Hg contamination and therefore the bioavailability of metal should be monitored and ecological investigations should be conducted. Eight samples (25.53%) showed Ni values under ISQG-Low, whereas twenty-six samples (76.47%) reported values between ISQG-Low and ISQG-High, thus implying that moderate levels of Ni contamination were present. Moreover, two samples (5.88%) and one sample (2.89%) reported Sb and Zn values, respectively, between ISQG-Low and ISQG-High, suggesting moderate contamination of these PTEs.
4. Discussion
The investigated soil samples exhibited trivial and zero enrichment for other PTEs including Pb, Zn, Ni, Cu, Co, Sr, Cr, and V (average EF < 3), suggesting that they came from geogenic sources [44,52,53]. Nevertheless, specific samples exhibited increased EF values for Zn and Sr, indicating that anthropogenic factors played a role [54,55]. Moreover, some samples showed Hg, Ni, Sb, and Zn values located between ISQG-Low and ISQG-High, suggesting moderate contamination of these PTEs [28,33,51]. The Pearson correlation, Q-mode HCA, and principal component analysis indicated natural sources for Fe, Al, and Mn, mostly from weathering of Jurassic marine carbonates and siliciclastics, and Quaternary sediments [54,55,56]. Due to the increase in specific surface area and the presence of Fe/Mn/Al oxides, the soil samples S2, S8, S20–S22, and S26–S29 recorded the highest values of the PTEs [57,58]. Fe and Mn hydron oxides are efficient scavengers (sorption/coprecipitation) of HMs by adsorption, ion exchange, or coprecipitation, depending on pH, metal concentrations, and ionic strength [39,55]. The fact that the correlations between Zn and the other PTEs were negative and weak, apart from Cu, implied that the origins of these PTEs were varied [45], predominantly from the numerous chemicals employed in agricultural activities and P fertilizers [43]. As, Co, Pb, U, Cu, Cr, V, Ni, Zn, and Sr in the studied soil revealed anthropogenic sources, mostly from phosphate fertilizers and other agricultural activities [43,45]. However, the latter PTEs showed natural sources, at least to a certain extent.
5. Conclusions
The averages of PTEs (mg/kg) in the soil of palm farms in the Al-Ammariah area had the following descending order: Fe (11581) > Al (6331) > Sr (247) > Mn (180) > Zn (52.16) > Ni (26.94) > Cr (19.97) > V (18.94) > Cu (11.36) > U (8.06) > Pb (5.08) > Co (3.89) > As (3.78) > Sb (1.08) > Hg (0.50) > Cd (0.25). The average values for U and Hg exceeded those reported from worldwide soils and the Earth’s crust. Furthermore, the findings indicated that the soil was very severely enriched and very highly contaminated with Hg, and moderately severely enriched with As and U. The RI outcomes showed that there was a moderate level of risk. Statistical analyses indicated that the PTEs originated from a combination of natural and anthropogenic sources, largely due to weathering of Earth materials and agricultural processes (nitrogen and phosphorus fertilizers, and pesticides). To achieve a reduction in the PTE content and diminish soil contamination, manure and bio-fertilizers should be used, along with less reliance on pesticides and fertilizers, and periodical assessments should be conducted to identify their volumes and origins.
Supplementary Materials
The following supporting information can be downloaded at: https://www.mdpi.com/article/10.3390/su142215402/s1, Table S1: Land use pattern of the region being investigated, the coordinates of the studied sites, concentra-tion of PTEs (mg/kg), and the coefficient of variation (CV). Table S2: Percentage of the size fraction for the different mangrove sediment samples. Table S3: Pollution indices and sediment quality guidelines and their classifications. Table S4: Exposure factors used in chronic daily intake (CDI) estimation for non-carcinogenic risk (Adapted from USEPA, 2002), and the reference dose (RfD) values of trace elements (USEPA, 2011). Table S5: The K-S test (p-value) of the investigated PTEs.
Author Contributions
Conceptualization, S.S.A., A.S.E.-S., K.A.-K. and M.A.; methodology, S.S.A., A.S.E.-S., K.A.-K. and M.A.; software, S.S.A., A.S.E.-S.; validation, S.S.A., A.S.E.-S., K.A.-K. and M.A.; formal analysis, S.S.A., A.S.E.-S., K.A.-K. and M.A.; writing—original draft preparation, S.S.A., A.S.E.-S., K.A.-K. and M.A.; writing—review and editing, S.S.A., A.S.E.-S., K.A.-K. and M.A.; visualization, S.S.A., A.S.E.-S., K.A.-K. and M.A.; supervision, S.S.A., A.S.E.-S., K.A.-K. and M.A.; project administration, S.S.A., A.S.E.-S.; funding acquisition, S.S.A. All authors have read and agreed to the published version of the manuscript.
Funding
This research was funded by King Saud University, grant number RSP2022R496.
Institutional Review Board Statement
Not applicable.
Informed Consent Statement
Not applicable.
Data Availability Statement
All data generated or analyzed during this study are included in this published article and its Supplementary Information Files.
Acknowledgments
This research was supported by the Researchers Supporting Project (RSP2022R496), King Saud University, Riyadh, Saudi Arabia.
Conflicts of Interest
The authors have no relevant financial or non-financial interests to disclose.
References
- Al-Rajhi, M.A.; Seaward, M.R.D.; Al-Aamer, A.S. Metal levels in indoor and outdoor dust in Riyadh, Saudi Arabia. Environ. Int. 1996, 22, 315–324. [Google Scholar] [CrossRef]
- Pan, L.; Wang, Y.; Ma, J.; Hu, Y.; Su, B.; Fang, G.; Wang, L.; Xiang, B. A review of heavy metal pollution levels and health risk assessment of urban soils in Chinese cities. Environ. Sci. Pollut. Res. 2017, 25, 1055–1069. [Google Scholar] [CrossRef] [PubMed]
- Tashakor, M.; Modabberi, M. Human Health Risks Associated with Potentially Harmful Elements from Urban Soils of Hamedan City, Iran. Pollution 2021, 7, 709–722. [Google Scholar] [CrossRef]
- Li, X.Y.; Liu, L.J.; Wang, Y.G.; Luo, G.P.; Chen, X.; Yang, X.L.; Hall, M.H.P.; Guo, R.C.; Wang, H.J.; Cui, J.H. Heavy metal contamination of urban soil in an old industrial city (Shenyang) in Northeast China. Geoderma 2013, 192, 50–58. [Google Scholar] [CrossRef]
- Xia, Q.; Zhang, J.; Chen, Y.; Ma, Q.; Peng, J.; Rong, G.; Tong, Z.; Liu, X. Pollution, Sources and Human Health Risk Assessment of Potentially Toxic Elements in Different Land Use Types under the Background of Industrial Cities. Sustainability 2020, 12, 2121. [Google Scholar] [CrossRef]
- Al-Boghdady, A.A.; Hassanein, K.M.A. Chemical analysis and environmental impact of heavy metals in soil of wadi Jazan area, southwest of Saudi Arabia. Appl. Ecol. Environ. Res. 2019, 17, 7067–7084. [Google Scholar] [CrossRef]
- Alharbi, T.; El-Sorogy, A.S. Spatial distribution and risk assessment of heavy metals pollution in soils of marine origin in central Saudi Arabia. Mar. Pollut. Bull. 2021, 170, 112605. [Google Scholar] [CrossRef]
- Kowalska, J.B.; Mazurek, R.; Gasiorek, M.; Zaleski, T. Pollution indices as useful tools for the comprehensive evaluation of the degree of soil contamination–A review. Environ. Geochem. Health 2018, 40, 2395–2420. [Google Scholar] [CrossRef]
- Gupta, N.; Khan, D.K.; Santra, S.C. Determination of public health hazard potential of wastewater reuse in crop production. World Rev. Sci. Technol. Sustain. Dev. 2010, 7, 328–340. [Google Scholar] [CrossRef]
- Wang, Z.; Xiao, J.; Wang, L.; Liang, T.; Guo, Q.; Guan, Y.; Rinklebe, J. Elucidating the differentiation of soil heavy metals under different land uses with geographically weighted regression and self-organizing map. Environ. Pollut. 2020, 260, 114065. [Google Scholar] [CrossRef]
- Adimalla, N. Heavy metals pollution assessment and its associated human health risk evaluation of urban soils from Indian cities: A review. Environ. Geochem. Health 2020, 42, 173–190. [Google Scholar] [CrossRef] [PubMed]
- Kelepertzis, E. Accumulation of heavy metals in agricultural soils of Mediterranean: Insights from Argolida basin, Peloponnese, Greece. Geoderma 2014, 221–222, 82–90. [Google Scholar] [CrossRef]
- Bastami, K.D.; Neyestani, M.R.; Shemirani, F.; Soltani, F.; Haghparast, S.; Akbari, A. Heavy metal pollution assessment in relation to sediment properties in the coastal sediments of the southern Caspian Sea. Mar. Bull. 2015, 92, 237–243. [Google Scholar] [CrossRef]
- Al-Dosary, N.M.N. Evaluation of Soil Characteristics for Agricultural Machinery Management and Cropping Requirements in AL Aflaj Oasis, Saudi Arabia. Sustainability 2022, 14, 7991. [Google Scholar] [CrossRef]
- Laurent, D. Kingdom of Saudi Arabia Atlas of Industrial Minerals; Saudi Arabian Directorate General of Mineral Resources in Cooperation with the Bureau de Recherches Geologiques et Minieres; The Directorate: Jeddah, Saudi Arabia, 1993; pp. 7–10. [Google Scholar]
- Sheta, A.S.; Al-Sewailem, M.; Sallam, A.; Al-Amry, A. Pedological characteristics of the soils of wadi Bishah in southwestern regions Saudi Arabia. J. King Saud Univ. Agric. Sci. 2015, 17, 47–62. [Google Scholar]
- Shadfan, H.; Mashhady, A.; Eter, A.; Hussen, A.A. Mineral Composition of Selected Soils in Saudi Arabia. J. Soil Nutr. Soil Sci. 1987, 147, 649–802. [Google Scholar] [CrossRef]
- Ashraf, A.M. The National Soil Survey and Land Classification Projects; PAO/Ministry of Agriculture and Water: Riyadh, Saudi Arabia, 1991. [Google Scholar]
- Al-Mashhady, A.S.; Sheta, A.S.; Sallam, A.S. Soil Types and Agricultural Management Methods in the Kingdom of Saudi Arabia; Agricultural Extension Bulletin Number 68; Agricultural Extension Center, College of Food and Agricultural Sciences, King Saud University: Riyadh, Saudi Arabia, 1998. [Google Scholar]
- Sheta, A.S. Soil Quality: Standards of Soil Quality under the Conditions of Saudi Arabia, 7th ed.; Saudi Society for Agricultural Sciences, King Saud University: Riyadh, Saudi Arabia, 2004. (In Arabic) [Google Scholar]
- Salama, K.F.; Randhawa, M.A.; Al Mulla, A.A.; Labib, O.A. Heavy metals in some date palm fruit cultivars in Saudi Arabia and their health risk assessment. Int. J. Food Prop. 2019, 22, 1684–1692. [Google Scholar] [CrossRef]
- Alaswad, S.O. Evaluation of soil contamination with industrial waste effluent in Riyadh, Saudi Arabia. Pak. J. Biol. Sci. 2020, 23, 9–16. [Google Scholar] [CrossRef]
- El-Sorogy, A.S.; Al-Kahtany, K. Contribution to the scleractinian corals of Hanifa Formation, Upper Jurassic, Jabal al-Abakkayn Central Saudi Arabia. Hist. Biol. 2015, 27, 90–102. [Google Scholar] [CrossRef]
- Al-Dabbagh, M.E.; El-Sorogy, A.S. Diagenetic alterations of the Upper Jurassic scleractinian corals, Hanifa Formation, Jabal Al-Abakkayn, Central Saudi Arabia. J. Geol. Soc. India 2016, 87, 337–344. [Google Scholar] [CrossRef]
- Powers, R.W.; Ramirez, L.F.; Redmond, C.D.; Elberg, E.L.J.R. Geology of the Arabian Peninsula, Sedimentary Geology of Saudi Arabia. U.S. Geol. Surv. Prof. Pap. 1966, 560, 147. [Google Scholar]
- Grassin-Delyle, S.; Martin, M.; Hamzaouia, O.; Lamy, E.; Jayle, C.; Sage, E.; Etting, I.; Devillier, P.; Alvarez, J.-C. A high-resolution ICP-MS method for the determination of 38 inorganic elements in human whole blood, urine, hair and tissues after microwave digestion. Talanta 2019, 199, 228–237. [Google Scholar] [CrossRef] [PubMed]
- Crane, J.; MacDonald, D. Applications of numerical sediment quality targets for assessing sediment quality conditions in a US Great Lakes area of concern. Environ. Manag. 2003, 32, 128–140. [Google Scholar] [CrossRef] [PubMed]
- Valdés, J.; Tapia, J.S. Spatial monitoring of metals and As in coastal sediments of northern Chile: An evaluation of background values for the analysis of local environmental conditions. Mar. Pollut. Bull. 2019, 145, 624–640. [Google Scholar] [CrossRef] [PubMed]
- Reimann, C.; de Caritat, P. Intrinsic flaws of element enrichment factors (EFs) in environmental geochemistry. Environ. Sci. Technol. 2000, 34, 5084–5091. [Google Scholar] [CrossRef]
- Muller, G. Index of geoaccumulation in sediments of the Rhine River. GeoJournal 1969, 2, 108–118. [Google Scholar]
- Hakanson, L. An ecological risk index for aquatic pollution control. A sedimentological approach. Water Res. 1980, 14, 975–1001. [Google Scholar] [CrossRef]
- Liu, W.; Zhao, J.; Ouyang, Z.; Söderlund, L.; Liu, G. Impacts of sewage irrigation on heavy metal distribution and contamination in Beijing, China. Environ. Int. 2005, 31, 805–812. [Google Scholar] [CrossRef]
- Trifuoggi, M.; Donadio, C.; Mangoni, O.; Ferrara, L.; Bolinesi, F.; Nastro, R.; Stanislao, C.; Toscanesi, M.; Di Natale, G.; Arienzo, M. Distribution and enrichment of trace metals in surface marine sediments in the Gulf of Pozzuoli and off the coast of the brownfield metallurgical site of Ilva of Bagnoli (Campania, Italy). Mar. Pollut. Bull. 2017, 124, 502–511. [Google Scholar] [CrossRef]
- Harikrishnan, N.; Ravisankar, R.; Chandrasekaran, A.; Suresh Gandhi, M.; Kanagasabapathy, K.V.; Prasad, M.V.R.; Satapathy, K.K. Assessment of Heavy Metal Contamination in Marine Sediments of East Coast of Tamil Nadu Affected by Different Pollution Sources. Mar. Pollut. Bull. 2017, 121, 418–424. [Google Scholar] [CrossRef] [PubMed]
- Turekian, K.K.; Wedepohl, K.H. Distribution of the elements in some major units of the earth’s crust. Geol. Soc. Am. 1961, 72, 175–192. [Google Scholar] [CrossRef]
- Kitagishi, K.; Yamane, I. (Eds.) Heavy Metal Pollution in Soils of Japan; Japan Science Society Press: Tokyo, Japan, 1981; p. 302. [Google Scholar]
- Kabata-Pendias, A. Trace Elements of Soils and Plants, 4th ed.; CRC Press, Taylor & Francis Group, LLC.: Boca Raton, FL, USA, 2011; p. 505. [Google Scholar]
- Yaroshevsky, A.A. Abundances of chemical elements in the Earth’s crust. Geochem. Int. 2006, 44, 48–55. [Google Scholar] [CrossRef]
- Taylor, S.R. Abundance of chemical elements in the continental crust: A new table. Geochim. Cosmochim. Acta 1964, 28, 1273–1285. [Google Scholar] [CrossRef]
- Rudnick, R.L.; Gao, S. Composition of the continental crust. Crust 2003, 3, 1–64. [Google Scholar]
- Tawfik, M.; Al-Dabbagh, M.E.; El-Sorogy, A.S. Sequence stratigraphy of the late middle Jurassic open shelf platform of the Tuwaiq Mountain Limestone Formation, central Saudi Arabia. Proc. Geol. Assoc. 2016, 127, 395–412. [Google Scholar] [CrossRef]
- Kahal, A.; El-Sorogy, A.S.; Qaysi, S.; Almadani, S.; Kassem, S.M.; Al-Dossari, A. Contamination and ecological risk assessment of the Red Sea coastal sediments, southwest Saudi Arabia. Mar. Pollut. Bull. 2020, 154, 111125. [Google Scholar] [CrossRef] [PubMed]
- Alharbi, T.; El-Sorogy, A.S. Assessment of seawater pollution of the Al-Khafji coastal area, Arabian Gulf, Saudi Arabia. Environ. Monit. Assess. 2019, 191, 383. [Google Scholar] [CrossRef]
- Nour, H.N.; Alshehri, F.; Sahour, H.; El-Sorogy, A.S.; Tawfik, M. Assessment of heavy metal contamination and health risk in the coastal sediments of Suez Bay, Gulf of Suez, Egypt. J. Afr. Earth Sci. 2022, 195, 104663. [Google Scholar] [CrossRef]
- Nuralykyzy, B.; Wang, P.; Deng, X.; An, S.; Huang, Y. Heavy metal contents and assessment of soil contamination in different land-use types in the Qaidam Basin. Sustainability 2021, 13, 12020. [Google Scholar] [CrossRef]
- Caeiro, S.; Costa, M.H.; Ramos, T.B.; Fernandes, F.; Silveira, N.; Coimbra, A.; Medeiros, G.; Painho, M. Assessing heavy metal contamination in Sado estuary sediment: An index analysis approach. Ecol. Indic. 2005, 5, 151–169. [Google Scholar] [CrossRef]
- Kowalska, J.; Mazurek, R.; Gasiorek, M.; Setlak, M.; Zaleski, T.; Waroszewski, J. Soil pollution indices conditioned by medieval metallurgical activity: A case study from Krakow (Poland). Environ. Pollut. 2016, 218, 1023–1036. [Google Scholar] [CrossRef] [PubMed]
- Weissmannová, H.D.; Pavlovský, J. Indices of soil contamination by heavy metals –methodology of calculation for pollution assessment (minireview). Environ. Monit. Assess. 2017, 189, 616. [Google Scholar] [CrossRef] [PubMed]
- Rabee, A.M.; Al-Fatlawy, Y.F.; Nameer, M. Using Pollution Load Index (PLI) and geoaccumulation index (I-Geo) for the assessment of heavy metals pollution in Tigris river sediment in Baghdad Region. Al-Nahrain J. Sci. 2011, 14, 108–114. [Google Scholar] [CrossRef]
- Hossain, M.S.; Ahmed, M.K.; Liyana, E.; Hossain, M.S.; Jolly, Y.N.; Kabir, M.J.; Akter, S.; Rahman, M.S.A. Case Study on Metal Contamination in Water and Sediment near a Coal Thermal Power Plant on the Eastern Coast of Bangladesh. Environments 2021, 8, 108. [Google Scholar] [CrossRef]
- Simpson, S.L.; Batley, G.B.; Chariton, A.A. Revision of the ANZECC/ARMCANZ Sediment Quality Guidelines. CSIRO Land and Water Science Report. CSIRO Land Water 2013, 132. [Google Scholar]
- Al-Kahtany, K.; El-Sorogy, A.S.; Al-Kahtany, F.; Youssef, M. Heavy metals in mangrove sediments of the central Arabian Gulf shoreline, Saudi Arabia. Arab. J. Geosci. 2018, 11, 155. [Google Scholar] [CrossRef]
- Alshehri, F.; Almadani, S.; El-Sorogy, A.S.; Alwaqdani, E.; Alfaifi, H.; Alharbi, T. Influence of seawater intrusion and heavy metals contamination on groundwater quality, Red Sea coast, Saudi Arabia. Mar. Pollut. Bull. 2021, 165, 112094. [Google Scholar] [CrossRef] [PubMed]
- Alharbi, T.; Alfaifi, H.; Almadani, S.; El-Sorogy, A. Spatial distribution and metal contamination in the coastal sediments of Al-Khafji area, Arabian Gulf, Saudi Arabia. Environ. Monit. Assess. 2017, 189, 634. [Google Scholar] [CrossRef]
- El-Sorogy, A.S.; Youssef, M.; Al-Kahtany, K. Evaluation of coastal sediments for heavy metal contamination, Yanbu area, Red Sea coast, Saudi Arabia. Mar. Pollut. Bull. 2021, 163, 111966. [Google Scholar] [CrossRef] [PubMed]
- Kahal, A.; El-Sorogy, A.S.; Alfaifi, H.; Almadani, S.; Ghrefat, H.A. Spatial distribution and ecological risk assessment of the coastal surface sediments from the Red Sea, northwest Saudi Arabia. Mar. Pollut. Bull. 2018, 137, 198–208. [Google Scholar] [CrossRef] [PubMed]
- Cai, Y.; Cabrera, J.C.; Georgiadis, M.; Jayachandran, K. Assessment of arsenic mobility in the soils of some golf courses in South Florida. Sci. Total Environ. 2002, 291, 123–134. [Google Scholar] [CrossRef]
- Yao, Q.; Wang, X.; Jian, H.; Chen, H.; Yu, Z. Characterization of the Particle Size Fraction associated with Heavy Metals in Suspended Sediments of the Yellow River. Int. J. Environ. Res. Public Health 2015, 12, 6725–6744. [Google Scholar] [CrossRef] [PubMed]


Publisher’s Note: MDPI stays neutral with regard to jurisdictional claims in published maps and institutional affiliations. |
© 2022 by the authors. Licensee MDPI, Basel, Switzerland. This article is an open access article distributed under the terms and conditions of the Creative Commons Attribution (CC BY) license (https://creativecommons.org/licenses/by/4.0/).