Abstract
Refuge Green Space (RGS) plays roles in both rapid evacuation and short-term resettlement in response to sudden natural hazards, especially geological disasters. As a result, its evaluation and location optimization are crucial for the development of sustainable cities. In this study, the Three-Step Floating Catchment Area Method (3SFCA) and Moran’s I index were used as measurement models. The rapid evacuation and short-term resettlement capacity of RGS were evaluated by calculating accessibility with 5, 10, 15 and 30 min of walking. The purpose of this study was to quantitatively evaluate the supply capacity of RGS in the central area of Tianjin and to provide recommendations for future additions to RGS. The results show that over 80% of the research area exhibited relatively poor service capacity within a 5–10 min walking distance, while less than 20% exhibited relatively good service capacity. Within a 15–30 min walking distance, approximately 60% of the study area was not well served by the RGS, while approximately 40% was well served. In conclusion, the layout of RGS in the central area of Tianjin exhibits unevenness and polarization of phenomena, and the supply of different categories of RGS varies widely. There is an insufficient supply of Emergency Sheltered Green Space and Temporary Sheltered Green Space, and that which is available is difficult to reach within 5–10 min. The coverage capacity of Disaster Prevention Park Space is relatively good, essentially covering the entire study area within a 15–30 min walking distance; however, the service capacity is average. Based on these conclusions, areas in which the RGS supply was weak were identified, and future potential RGS additions were identified in conjunction with the Green Space System Plan.
1. Introduction
1.1. Research Background
China has survived and developed for thousands of years in its struggle against natural hazards [1]. During the last 20 years, China has experienced the highest number of disaster events of any country in the world, with 577 events [2], including the 2008 Sichuan Earthquake and the Yushu Earthquake on 14 April 2010.
Geological disasters have become a major concern in many Chinese cities, as they are one of the most unpredictable natural hazards [3]. Over 70% of cities with more than one million residents are located within seismic zones [4].
Urban green spaces play a crucial role in enhancing urban resilience to natural hazards [5,6,7], such as providing safe places to which residents can evacuate quickly to seek temporary shelter, forming protective rings to achieve fire protection through the water system and planting fire-resistant low-oil plants, and blocking dirt and killing bacteria through the use of green plants that secrete bactericidal substances. With the introduction of concepts such as the Healthy City and the Resilient City, the ecological and healing benefits of urban green spaces have gradually been accepted by the public [8]. In China, however, residents are relatively unaware of the role that green space plays in disaster prevention and risk reduction [9,10].
1.2. Literature Review
Although the definition of Refuge Green Space (RGS) varies from country to country, it is broadly defined as urban green spaces that mitigate the degree of harm suffered, providing a place for the evacuation and rehousing of residents before, during and after the occurrence of natural disasters [11].
In western countries, the study of RGS can be traced back as far as the Renaissance [12]. During the reconstruction of Catalonia following the earthquake in the 17th century, streets were replaced with wide urban roads [13]. To ensure that people would have open space to which to evacuate during an earthquake, large squares were planned. Several street trees were planted on both sides of city streets in order to prevent objects from striking evacuees directly [14]. There were successive fires in Chicago and Boston during the 19th century. In the aftermath of these disasters, parks and parkways were used to divide densely populated urban areas [15]. Systematic layouts were also implemented for open spaces in order to prevent fires from spreading and to improve cities’ ability to withstand natural hazards [16]. The planning approach used here served as a forerunner to the later planning of green space systems for disaster prevention and mitigation [17]. In 1923, fires caused by the Great East Japan Earthquake destroyed nearly 40% of Tokyo’s urban area [18]. City squares, green spaces, and parks played a vital role in protecting residents and slowing the spread of fire [19].
McHarg advocated incorporating urban ecology into emergency shelter planning in 1969, promoting a broader perspective of the role of urban parks in disaster prevention [20]. In 1995, after the Great Hanshin Earthquake in Japan, the Ministry of Construction put forward two requirements for the construction of urban parks with respect to disaster prevention. Firstly, that the number of Disaster Prevention Parks in old urban areas should be increased in order to form a network system of disaster prevention parks [21]. Secondly, that general parks should be transformed into Disaster Prevention Parks to enhance their capacity for disaster prevention and mitigation [22,23]. To improve disaster preparedness and emergency shelter planning, many western countries have incorporated Refuge Green Space Evaluations (RGSE) into their disaster prevention systems [24], such as the Evaluation and Shelter Guidance in the UK [25] and the National Framework in the US [26].
In China, there are two main stages in the research of RGS. The first stage is to learn from the experiences of other countries. Yun, L. [27], Kito Yonghei [28] and Junhua, Z. [29] have described and analyzed Japanese Urban Disaster Prevention Parks from different perspectives. Yan, P. et al. [30] analyzed the urban disaster prevention and mitigation systems in France and Germany. There have been a number of related studies focusing on the period between 1995 and 2010, a period when RGS in China was still in its infancy, and it was urgently necessary to enumerate its basic functions and clarify its uses [31].
An evaluation and practice stage occurred between 2010 and the present. The introduction of Geographical Information Systems (GIS) technology into China resulted in some Chinese scholars combining GIS with the practice of RGS in China and developing new research models [32,33,34]. Junfei, X. et al. [35] used the spatial analysis of GIS, combined with population distribution density, to conduct a quantitative analysis study of the hazard avoidance capacity of RGS in Beijing. Mingwu, Y. et al. [36] used the 2SFCA model to quantitatively analyze whether the RGS evacuation capacity in the Centre Area of Shanghai could meet the disaster avoidance needs of the surrounding residents. Wen L et al. [37] used Harbin Green Park Space as a research object to evaluate the service status of Green Park Space for disaster prevention in terms of accessibility. In the study by Jianhong, W. et al. [38], a Multi-objective Planning Model was applied to develop a decision support system for RGS. In these studies, the scope and depth of RGS evaluation and location optimization methods have been expanded. Several studies around the world have examined the evacuation capacity of individual RGS, and scholars have summarized the major associated factors [39,40]. Each influence factor has been classified into positive and negative correlations according to its relationship with the RGS, and the commonly used evaluation factors are shown in Table 1 [41].

Table 1.
Indicator Factors for RGS Evaluation.
Taking into account the needs of the general population, these impact factors may not be appropriate for special populations. Some scholars have conducted studies on the disaster prevention and evacuation behavior of special populations in recent years. In actual evacuation scenarios, the evacuation speed and post-disaster response time of special groups such as children, the elderly and the disabled are significantly slower than those of young people, and their evacuation behaviour and choices are also significantly different from those of young people [42]. Researchers conducted evacuation experiments in kindergartens in order to determine children’s disaster response times and compare children’s and adults’ density–velocity relationships [43]. Among the main experimental studies on the evacuation of visually impaired people are studies on the evacuation speed of blind people and studies on the pattern of evacuation of visually impaired people [44]. According to Zhang et al., the single-guide focused evacuation model had the highest average speed during the indoor unguided evacuation of visually impaired individuals [45]. To maximize the number of evacuees from special populations, Maziar et al. proposed a multiple group differential evolution method based on the concept of opposed learning from the perspective of public transport [46].
The Life Safety Code in the USA as well as the ADA’s rules refer to the following two methods of evacuating special populations in hospitals: fire lifts and refuge areas [47]. Consequently, both public and high-rise buildings provide Areas of Refuge Space (AORS) for special populations. In the event of a disaster, special populations are able to reach the AORS and wait for assistance. For the current design and planning of RGS interiors, fast escape routes and barrier-free access are provided for special groups [48]. The Japanese government has established community-based autonomous disaster prevention organizations, which provide organized disaster mitigation training through group activities on a daily basis [49]. Additionally, this initiative allows the general population to assist certain people in the event of a disaster.
1.3. Refuge Green Space Evaluation Models
In light of the critical role that RGS can play before, during, and after a disaster, the location of the RGS is of paramount importance [50]. RGS evaluation and optimization models will play a significant role in this process [51]. According to the law on Disaster Prevention and Mitigation, the RGS area per capita should be greater than 1 m2 [52].
It should be noted, however, that regulations at the quantitative level alone are faced with numerous practical difficulties. First of all, it does not take into account the actual spatial distribution of the RGS. During a natural disaster, such as an earthquake, certain residential areas may be located near the RGS and are therefore easily accessible. In contrast, some may be located further away from the RGS, allowing them to escape and evacuate more slowly. Secondly, no consideration has been given to the extent to which the population is matched to the RGS in terms of disaster prevention. The escape process may result in a large number of people congregating in one RGS for a short period of time, resulting in a lower service capacity than expected [53].
Researchers have proposed methods for evaluating accessibility based on these issues [54]. The term accessibility refers to the ease with which one can move from one point in space to another [55]. It is also important to assess the capacity of public facilities to meet the needs of the population by calculating accessibility, a process that involves evaluating the degree of matching between supply and demand points [56,57]. There is a growing use of measurement models based on accessibility calculations in the evaluation system of public facilities [58]. The most common evaluation models include the Gravity Model, Gravitational Model, Network Analysis, and Two Step Floating Catchment Area Method (2SFCA) [59].
Recent years have seen an increase in the use of 2SFCA and its optimization approach [60,61]. In Illinois, the method was first employed to identify areas with limited healthcare resources and to measure healthcare accessibility [62]. Traditional 2SFCA methods ignore spatial distance decay and use Euclidean distances rather than actual distances between supply and demand points [63]. Therefore, scholars have developed decay functions based on 2SFCA to model actual spatial decay [64]. 2SFCA incorporates non-spatial attributes into the study of spatial accessibility, taking into account the scale of supply points, the scale of demand points, and the interaction between supply and demand points when calculating accessibility. This method is a valuable tool for evaluating the spatial accessibility of public service facilities [60,62]. In various fields, such as metro and public service facilities, the modified 2SFCA is widely used in accessibility evaluations [65].
1.4. Research Innovations
Based on accessibility calculations, the study evaluates the layout of the RGS in the central area of Tianjin and proposes additions for future locations. The study methodology utilized the improved Three Step Floating Catchment Area Method (3SFCA) and the Bivariate Evaluation Model Index-Moran’s I to identify service blind areas.
The 2SFCA overestimates the potential population demand when multiple facilities are available at the same location without taking into account the potential for population competition [66,67]. The method tends to underestimate the accessibility of rural areas while overestimating the accessibility of urban areas [56]. To rectify this, Wan et al. proposed the Three Step Floating Catchment Area Method (3SFCA) by incorporating the competitive potential between facilities [68].
A competition effect occurs when there are multiple facilities within the search radius of a demand point [69]. In particular, the 3SFCA method calculates the choice weights between facility points and demand points based on travel time, reflecting how residents’ demand for a facility point varies based on the availability of other nearby facilities, then repeats the steps of the 2SFCA method [70].
Using the 3SFCA, the calculation function is optimized and accuracy is improved. Consequently, the traditional Gaussian-type decay function was replaced with a gravity-type decay function. Despite the fact that the Gaussian Function can fit the two variables of distance decay and park area well, it is not appropriate for RGS layout studies. As disasters occur suddenly and are time-sensitive, distance plays a much greater role in RGS layout and site selection than in regular parks [71,72]. Therefore, coupling supply and demand alone is not sufficient.
To improve both the granularity and precision of the analysis, this study uses residential points as the basis of analysis, in addition to real entrances and exits to the park. The results of this study are not affected by the use of population raster data or the homogenization of residential areas.
This improved research method is based on accessibility calculations and is well adapted for the evaluation of RGS in plain cities in general. When using the gravity-based distance decay function, however, the rate of decay must be further considered for mountainous cities. As a result of the complexity of the roads in mountainous cities, cross-sectional comparisons of RGS accessibility may be more difficult than in plain cities [73]. To determine the degree of attenuation in mountainous cities, this method requires integrated consideration and multiple calculations.
2. Materials and Methods
2.1. Research Area
The Urban Green Space System (UGS) is defined as a whole consisting of green spaces of various types and scales in a city [74]. UGS is mainly composed of Parkland, Production Green Space, Protective Green Space, Road Green Space, and Subsidiary Green Space [75]. In practice, RGS falls under the category of Parkland in the UGS, but does not include specialized parks [76].
An urban disaster prevention system incorporates all the green spaces in a city that have disaster prevention capabilities in order to form a disaster prevention system [77]. There are usually a number of priority RGSs in a disaster prevention system [78]. They are located in the heart of the city and are well connected, often with rescue routes and accessible pathways within the green space [79]. In order to facilitate rescue operations, fire stations, medical stations, etc., are frequently located in their vicinity [80].
However, when disaster strikes, the focus on creating RGS alone is insufficient to meet the needs of the population [81]. Therefore, studies typically use Parkland (excluding specialized parks) under the UGS as the research object for all RGS in the city [79,80,81]. In addition to the priority RGSs, these green spaces also include alternative sites and other green spaces.
The study area is located in the central area of Tianjin. Tianjin is one of the four major municipalities directly under the Chinese central government, located in the northeastern part of the North China Plain. Based on the Seventh National Census [60], Tianjin was classified as a mega-city in 2021. The central area of Tianjin, including Heping District, Hexi District, Hedong District, Nankai District, Hongqiao District and Hebei District, with a total area of approximately 173 km2, is also the most densely populated and densely built-up area in Tianjin [82]. Figure 1 shows the location and extent of the research area.
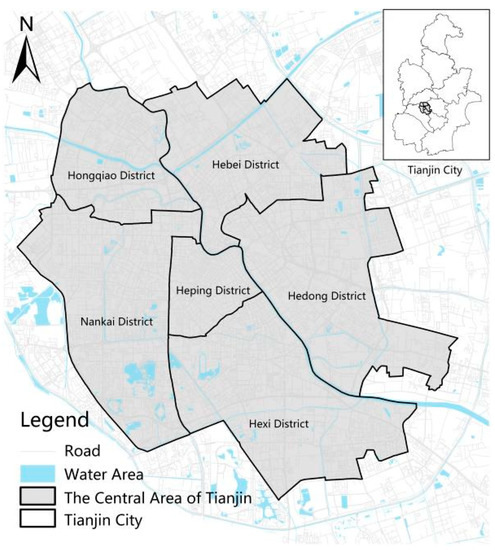
Figure 1.
Map of the central area of Tianjin City.
Tianjin is located in the North China Plain seismic zone. More than 140 earthquakes of magnitude 4.7 or higher have occurred in the North China Plain seismic zone since 1980. Among them, there were five earthquakes of magnitude 7 to 7.9 and one earthquake of magnitude 8 or above [83]. In 1976, an earthquake of magnitude 7.8 on the Richter scale occurred in Tangshan, which affected Tianjin. It is estimated that 64% of the houses in the six districts of Tianjin were damaged and 14% were completely destroyed [84]. Tianjin Ninghe was struck by an earthquake of 6.9 magnitude in November of the same year. Tianjin and its surrounding areas have been subjected to 10 earthquakes of magnitude 4 or greater since 1980, with an average of one every three years [85].
Furthermore, the study area includes 14 Historical Districts, most of which are situated on both sides of the Haihe River, covering a total area of 9.9 km2. It is noted that the Historical Districts are rich in cultural relics and have a deep influence on the establishment of modern Tianjin City [86,87]. The Cultural relics and ancient buildings in the Historical District are at high risk during a geological disaster.
2.2. Data Sources and Processing
2.2.1. Refuge Green Space Data
According to the Tianjin Green Space System Plan (2020–2035), a three-tier green space system will include Disaster Prevention Park Space, Temporary Sheltered Green Space, and Emergency Sheltered Green Space [88]. Figure 2 and Figure 3 illustrate the distribution of different types of RGS within the research area. Among them, Disaster Prevention Park Space generally refers to parks with a scale larger than 50,000 m2 and a service radius of no more than 5000 m. Temporary Sheltered Green Space refers to green spaces with a scale larger than 20,000 m2 and a service radius of no more than 1500 m. Emergency Sheltered Green Space refers to green spaces with a scale larger than 1000 m2 and a service radius of 500 m [89].
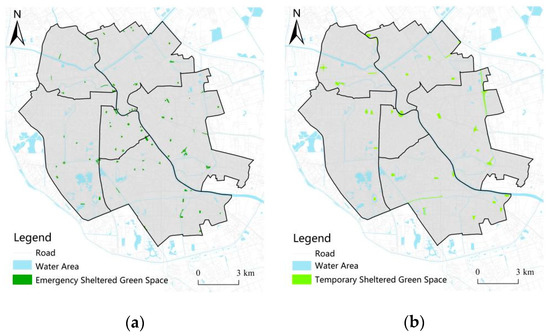
Figure 2.
Map of Emergency Sheltered Green Space and Temporary Sheltered Green Space. (a) The distribution of Emergency Sheltered Green Space in the research area. (b) The distribution of Temporary Sheltered Green Space in the research area.
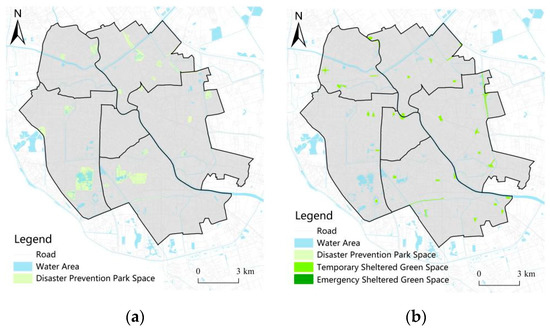
Figure 3.
Map of Disaster Prevention Park Space and all types of Refuge Green Space. (a) The distribution of Disaster Prevention Park Space in the research area. (b) The distribution of all types of Refuge Green Space in the research area.
These three types of green space serve different scopes and carry different functions [90,91]. Emergency Sheltered Green Space is generally used for the rapid evacuation of people after a disaster, and can be reached within 3–5 min. In addition to evacuation, the Temporary Sheltered Green Space should serve as a short-term rescue facility and can be reached within 10 min of an event. Disaster Prevention Park Space is a large gathering place after a disaster. Besides serving as a residence for residents for a relatively long period of time, it must serve as a center for disaster prevention activities. Ideally, residents should be able to reach Disaster Prevention Park Space within 30–60 min of their residence. The statistics for these three types of RGS are shown in Table 2.
Table 2.
Research Area Refuge Green Space Statistics.
According to the Open Source Data from the Tianjin Municipal Bureau of Planning and Natural Resources, basic information on the Registered Green Park Space in the central area of Tianjin can be obtained [92]. Furthermore, the location and extent of green spaces in the Open Street Map (OSM) were compared, calibrated, and park OSM data were obtained. In previous studies, the geometric center of RGS has been used as the space center. As a result of this approach, the effect of the park’s actual size would not be considered in the calculations [93]. Therefore, this study used the Baidu Coordinate Picker to obtain information on the real entrance/exit locations of RGS in the central area of Tianjin. Following the conversion of coordinates, these were matched with the park surface data to improve the accuracy of the calculation.
2.2.2. Residential Data
Through the Open Access API Port of Gaode Map, the point data of residential areas in the central area of Tianjin can be obtained. All Residential Points (POI) are WGS84 Coordinates, which correspond to the actual location, and also contain information on the number of buildings, floors and units. Combined with the data from the Seventh Population Census, the population data of residential areas in the central area of Tianjin can be obtained. The formula for calculating the population of one single residential unit is as follows:
P represents the number of people in the residential unit, N represents the total number of households in the neighborhood and M represents the average number of people per household. According to the data of the Seventh Population Census of Tianjin, M was taken as 2.4 [94]. Additionally, the population density was calculated using a 250 m × 250 m square grid. The study area was classified as Low, Relatively Low, General, Relatively High, High, or Very High based on the results of the population density value. By using residential neighborhoods as the object of study, rather than blocks or streets, we were able to obtain a higher level of granularity. Because most blocks are irregular in shape, accessibility calculations based on the center of mass may be inaccurate [95]. The result of the calculations using the above optimization method is shown in Figure 4.
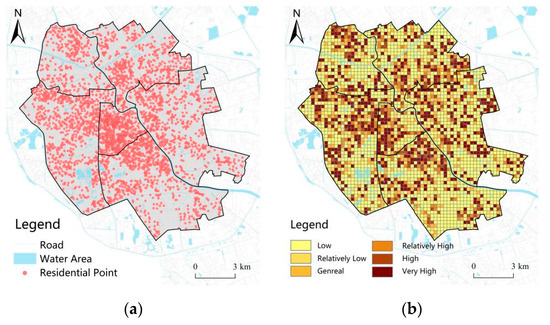
Figure 4.
Map of Residential Areas and Population Distribution. (a) The distribution of residential areas in the research area. (b) The population density in the research area (number of people/m2). Calculated as: Population Density Value = Number of people ÷ Area.
2.2.3. Road Network Data
The study was conducted under the assumption that the city’s road network would be fully operational following a disaster. Data on the road network were obtained from Open Street Map [96].
According to previous disaster prevention research and experience, natural hazards such as earthquakes adversely affect the transportation systems of many large cities [97,98]. Bicycles, cars, and rail are less suitable for measuring the service capacity of RGS. Consequently, this study focuses on walking as a mode of transportation.
Using walking time rather than spatial geometric distance is more in line with actual disaster prevention efforts based on the urban road network [99]. The distance measures in this study were 5 min, 10 min, 15 min, and 30 min in order to reflect the city’s capacity for rapid evacuation and temporary resettlement following a disaster. Researchers use 5–15 min walking distances as a measure of rapid evacuation capacity in urban central areas in plain areas [100,101]. According to studies, the effective escape time for earthquakes is usually 12 s. A 5.0 magnitude earthquake occurred on 22 October in Luding, Sichuan, and Chengdu was notified 57 s in advance, thereby providing the population with a valuable amount of time to evacuate [102,103]. Within five to fifteen minutes, a rapid evacuation was initiated in order to minimize the risk of secondary injuries and aftershocks [104].
2.3. Calculation Process
As a first step, the supply–demand ratio of RGS in the study area is calculated. This step takes the RGS as a starting point to search for the distribution of residential areas at different radius distances. By introducing a Gravity-based Distance Decay Function, weights are assigned to simulate the actual exponential decline in attractiveness with distance. The Population Selection Weight Function for RGS is then introduced and weighted again. Finally, a summation is made and the ratio of supply to demand for RGS is calculated.
Rj is the ratio of supply to demand of RGS. J represents the supply point, which is RGS. I represents the demand point, which encompasses residential areas. K represents the number of residential districts (pcs) within the search radius. Sj represents the supply capacity of RGS. In this study, the area of the RGS is counted in m2. Di is the size of the residential area, expressed in terms of the population in the residential area (pcs). Dij denotes the distance between the supply point j and the demand point i. The distance is represented by the walking commuting time (minute) in this study. D0 denotes the search radius.
In the second step, the Gravity-based Distance Decay Function G(dij) and the Population Selection Weight Function W(dij) for the RGS are calculated respectively. In the formula, G(dij) represents the Gravity-based Distance Decay Function, which is calculated as
β denotes the degree of attenuation and generally takes a value of 1 for plain cities and metropolitan areas [105,106]. W(dij) represents the simulator’s selection and competition for the RGS, which is calculated as
From Equations (2)–(4), the ratio of supply to demand for RGS Rj (m2/person) can be derived.
In the third step, accessibility values for residential areas are calculated. This calculation then starts with the residential area and searches for the distribution of RGS at different radius distances and superimposes the function.
In the formula, m denotes the number of RGS searched; Rj denotes the ratio of supply to demand for RGS obtained in the first step (m2/person); and Ai denotes the accessibility value for each residential area (m2/person).
In the fourth step, Moran’s I value is calculated to assess the degree of association between RGS accessibility and population density. The output value of Moran’s I index is the Aggregation Level, which indicates the degree of spatial aggregation of research objects.
I in the formula stands for Moran’s I. Zx refers to the normalized value of RGS accessibility within region i. Zy refers to the normalized value of the population density y within region i. Mij refers to the spatial weight matrix between I and j.
The Moran’s I index output results in the following 5 categories: H-H, L-L, H-L, L-H and Not Significant [107,108]. The H-H category indicates that the area has high RGS accessibility and high population density. The L-L category indicates that the site has low RGS accessibility and low population density. The H-L category refers to high RGS accessibility but low population density. The L-H category means that the place has low RGS accessibility but high population density. The Not Significant category indicates that the spatial relationship between RGS accessibility and population density is not significant.
3. Results
3.1. RGS Accessibility Results
According to the above calculation method, the accessibility results of RGS in the central area of Tianjin can be obtained. The results are classified as Class I Unreachable (Value: 0), Class II Low Accessibility (Value: 0–0.1), Class III Relatively Low Accessibility (Value: 0.1–0.5), Class IV Moderate Accessibility (Value: 0.5–1.0), Class V Relatively High Accessibility (Value: >1.0), and Class VI High Accessibility (Value: >2.0) [108,109].
Among them, according to the Tianjin RGS Planning and Design Guideline [110], the study used 5-min Emergency Sheltered Green Space accessibility and 10-min Temporary Sheltered Green Space accessibility to evaluate the rapid evacuation capacity of RGS in the central area of Tianjin. Another study was conducted to evaluate the short-term evacuation capacity of RGS in the central area of Tianjin using 15 min and 30 min of Disaster Prevention Park Space accessibility.
Figure 5 shows the results of the calculations for 5 min and 10 min. Table 3 and Table 4 show the classification and statistics of the results. The percentage of Class I for the accessibility of 5-min Emergency Sheltered Green Space is 30.54%. This means that 30.54% of residential areas cannot reach the Emergency Sheltered Green Space within 5 min, and that there is no Emergency Sheltered Green Space supply in these areas. The proportion of areas with relatively poor service capacity (Class II and Class III) is 56.41%, indicating that more than half of the areas in the central area of Tianjin have poor ability to reach the Emergency Sheltered Green Space within 5 min. The proportion of areas with relatively good service capacity (Class IV, Class V and Class VI) is only 13.06%, which means that only a small proportion of the research area are in the position of having good access to the Emergency Sheltered Green Space in 5 min.
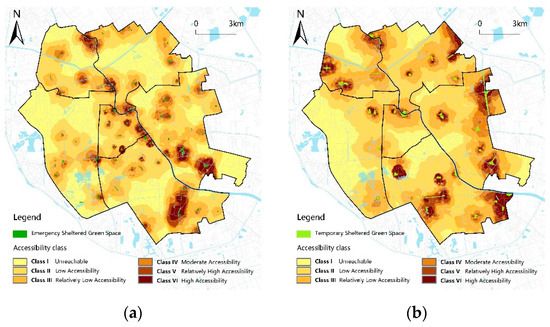
Figure 5.
Accessibility of Emergency Sheltered Green Space (5 min) and Temporary Sheltered Green Space (10 min). (a) Accessibility of 5-min Emergency Sheltered Green Space. (b) Accessibility of 10-min Temporary Sheltered Green Space.
Table 3.
Emergency Sheltered Green Space (5 min) Statistics.
Table 4.
Temporary Sheltered Green Space (10 min) Statistics.
For the accessibility of the 10-min Temporary Sheltered Green Space, the Class I category accounted for 18.57%. This means that nearly one-fifth of the areas in the central area of Tianjin are unable to reach the Temporary Sheltered Green Space within 10 min. The percentage of areas with relatively poor service capacity (Class II and Class III) is 64.06%, which means that nearly two-thirds of the areas have difficulty to reach the Temporary Sheltered Green Space within 10 min. The percentage of relatively good service capacity (Class IV, Class V and Class VI) is only 17.38%, less than one fifth of the total area.
The combination of the 5-min Emergency Sheltered Green Space accessibility and the 10-min Temporary Sheltered Green Space accessibility shows that the rapid evacuation capacity of the RGS in the central area of Tianjin is comparatively poor. Less than 20% of the research area is located in relatively good service capacity (Class IV, Class V and Class VI) level for both Emergency Sheltered Green Space and Temporary Sheltered Green Space. Over 80% of the remaining place is located in areas with relatively poor service capacity (Class II and III) and no RGS provision (Class I).
In Figure 6 and Table 5 and Table 6, it is shown that the short-term resettlement capacity of the RGS in the central area of Tianjin can be calculated with the 15-min and 30-min accessibility of the Disaster Prevention Park Space. For the 15-min accessibility of the Disaster Prevention Park Space, the Class I category accounts for 8.94%, indicating that just under 10% of the area is inaccessible to the Disaster Prevention Park Space within 15 min. The percentage of areas which have a relatively poor service capacity (Class II and Class III) is 53.73%, meaning that nearly half of the area is not easily accessible to the Disaster Prevention Park Space within 15 min. The percentage of areas that are in relatively good service capacity (Class IV, Class V and Class VI) is 37.32%, i.e., it is relatively easy to reach the Disaster Prevention Park Space within 15 min in almost 40% of the areas.
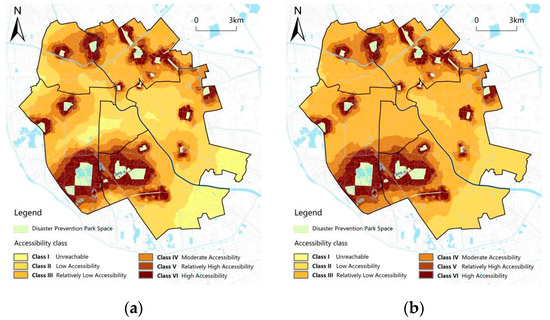
Figure 6.
Accessibility of Disaster Prevention Park Space (15 min) and Disaster Prevention Park Space (30 min). (a) Accessibility of 15-min Disaster Prevention Park Space. (b) Accessibility of 30-min Disaster Prevention Park Space.
Table 5.
Accessibility of Disaster Prevention Park Space (15 min) Statistics.
Table 6.
Accessibility of Disaster Prevention Park Space (30 min) Statistics.
For the 30-min accessibility of the Disaster Prevention Park Space, the Class I category has a percentage of 0.00%, indicating that there are no places in the study area that are not accessible to the Disaster Prevention Park Space within 30 min. The percentage of areas that have a relatively poor service capacity (Class II and Class III) is 59.63%. Moreover, the percentage of areas that have a relatively good service capacity (Class IV, Class V and Class VI) is 40.37%.
After analysis, it can be seen that the RGS has a general short-term resettlement capacity in the central area of Tianjin. The results show that the RGS achieves over 90% area coverage at the 15-min level and full coverage at the 30-min level. However, the results of the 15-min and 30-min accessibility of the Disaster Prevention Park Space indicate that more than half of the areas are located in areas with relatively poor service capacity, meaning that more than half of the areas are still unable to reach the RGS within 15–30 min.
3.2. Moran’s I Results
Moran’s I is a valuable indicator for assessing RGS accessibility and population density. H-H and L-L categories are typically used to identify urban cores and urban fringes, respectively. The H-L category indicates high RGS accessibility and low population density, showing a good level of RGS service. The L-H category indicates low accessibility and high population density, which means a poor level of RGS service with high potential for improvement. The Not Significant category indicates that the relationship between population density and accessibility is not significant. In summary, the L-H area represents the most valuable part of this study, and it is this area that should be the focus of future developments for the RGS.
Combining the RGS 5 min, 10 min, 15 min and 30 min accessibility and Moran’s I values, the area of concentration of L-H can be determined. By dividing the study area into 250 M × 250 M grids and combining the results of the Moran’s I calculations, the results shown in Figure 7 and Figure 8 can be obtained. Table 7 shows the statistics for calculations at 5–30 min.
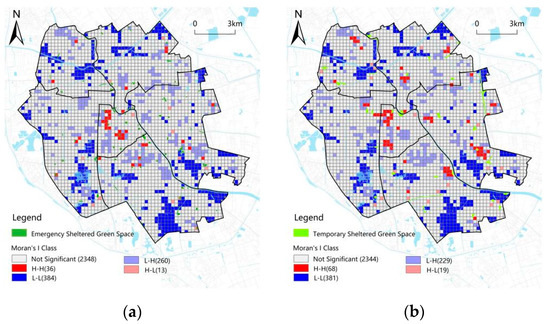
Figure 7.
Moran’s I of Emergency Sheltered Green Space (5 min) and Temporary Sheltered Green Space (10 min). (a) Moran’s I of 5-min Emergency Sheltered Green Space. (b) Moran’s I of 10-min Temporary Sheltered Green Space.
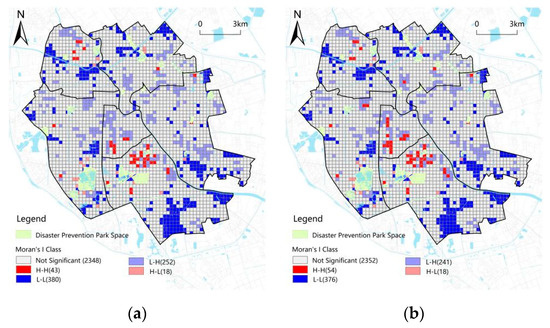
Figure 8.
Moran’s I of Disaster Prevention Park Space (15 min) and Disaster Prevention Park Space (30 min). (a) Moran’s I Classification of 15-min Disaster Prevention Park Space. (b) Moran’s I Classification of 30-min Disaster Prevention Park Space.
Table 7.
Area of L-H Statistics.
4. Discussion
4.1. Analysis of Calculation Results
The research evaluates the accessibility of RGS in the central area of Tianjin by using the Improved 3SFCA Method. A polarization phenomenon can be observed in the supply capacity of RGS in the central area of Tianjin based on the calculation results.
According to comparisons with similar studies on RGS [111,112], there are three main reasons for the polarisation phenomenon. Firstly, the layout of the city is a contributing factor. Many Chinese cities are arranged in a central-suburban pattern [113]. The areas located in the city centre have a high building density and high population density. As land is scarce, RGS are sparsely distributed, making it impossible for them to meet the needs of the population. As a result, the available space and the area of RGS are relatively adequate in suburban areas, where the population density is low. Thus, RGS located in suburban areas are more capable of serving the population than those located in urban areas.
The second reason can be attributed to the study’s methodology as well as its nature. With increasing distance, the 3SFCA and Gravity Decay Function used in the study decay faster than the 2SFCA and Gaussian Function [87]. The RGS is better able to characterize distance decay and is more in line with the evaluation criteria for its rapid evacuation capabilities in response to major urban disasters. In addition, it may also result in polarization in certain areas if accessibility declines too rapidly with distance. The mode of transportation used in this study is walking for 5–30 min. Because walking is slower than cycling and driving, the area within the RGS is smaller than for other travel modes, and the overall accessibility of the RGS is lower in the calculation than that for other travel modes. The walking mode, however, is more in line with real-life behavioural patterns during a disaster.
The third reason is that this study utilized the Grading Mechanism of the RGS in its statistical analysis. In previous studies, RGS were examined as a whole without considering their actual function or classification [93,107,108]. In terms of research results, studying RGS as a whole is more accessible than studying classifications However, this method also poses problems, such as the inability to develop future optimization methods and recommendations for grading RGS construction. Optimisations and recommendations can only be made at the level of the overall layout, and not for the addition or placement of a particular type of RGS.
While the use of the RGS Grading Mechanism can result in low accessibility calculations and exacerbate polarization, specific optimization measures can be proposed in accordance with the functions performed by different types of RGS. For example, the layouts of the Emergency Sheltered Green Space, Temporary Sheltered Green Space and Disaster Prevention Park Space are adjusted for the 5-min, 10-min rapid evacuation capacity of the RGS and the 15–30 min short term resettlement capacity respectively. Due to this, the RGS classification has a higher reference value for the actual implementation of disaster prevention than when viewed as a whole.
4.2. Construction of the RGS in the Historic District
As shown in Figure 9, the Historical Districts were concentrated in the center of the research area during the course of the study. Moreover, there is a high population density, but low RGS accessibility in the Historic District.
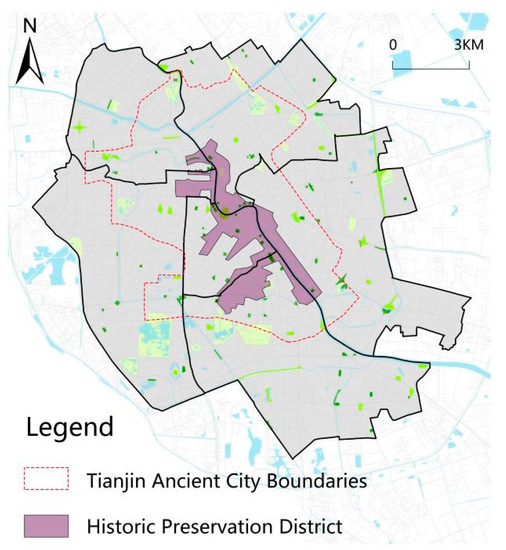
Figure 9.
Map of Historic Preservation District Boundaries.
An earthquake evacuation would be difficult in the Historic District because of its small interior spaces, chaotic road network, and the limited number of evacuation routes. The buildings are also old, and the quality of the construction of the housing is relatively low. As a result, the Historic District is at high risk of disasters, such as earthquakes and fires.
Due to the unique nature of the Historic District, adding a large amount of Disaster Prevention Park Space is not practical. Consequently, the addition of Emergency Sheltered Green Space or Temporary Sheltered Green Space will enhance the Historic District’s disaster-proofing capabilities. By installing pocket parks and neighborhood parks around historic buildings, the damage from earthquakes and fires can be mitigated, and population pressure can be relieved in central areas. For example, the installation of pocket parks in densely populated areas can divide the space and act as a buffer zone. In the event of an earthquake, street trees planted in the park can provide shelter for pedestrians from falling objects such as glass and billboards. During an earthquake, the emergency water supply points in the pocket park can provide water as well as act as a fire-fighting solution [114]. It is also effective to increase the number of park entrances and the number of facilities within the RGS.
In spite of this, due to the constraints of the study, it is not possible to conduct a separate study of the Historic District at the block level. Future research can focus on the Historic District separately. It is possible to make suggestions and additions to the future RGS for the Historic District by combining the site selection model in GIS with the optimisation model.
5. Conclusions
5.1. Overall RGS Supply Capacity Evaluation
The overall RGS supply capacity can be determined by combining the results of the accessibility calculation for the central area of Tianjin with Moran’s I value. There is a lack of supply capacity of the RGS in the central area of Tianjin when it comes to the rapid evacuation capacity in the event of a disaster. Over 80% of the study area is difficult to reach within 5–10 min after a disaster, and less than 20% of the area is relatively well served (Class IV, Class V, and Class VI), i.e., it is difficult to reach the RGS within 5–10 min after a disaster.
As far as the RGS’s short-term resettlement capacity for disasters is concerned, the central area of Tianjin possesses a general capacity. In spite of the high coverage, there is insufficient stock. As a result of the 15-min walk approach, 8.94% of the area remains inaccessible to Disaster Prevention Park Space. Using the 30-min walk approach, all residential areas in the study area are accessible to the Disaster Prevention Park, although the degree of difficulty varies. Based on the results of the 15–30 min park accessibility study, close to 40% of residential areas have relatively good service capacity (Class IV, Class V, and Class VI). About 60% of the residential areas are located in areas with a poor service capacity (Class II and Class III), which means that residents in these areas are less likely to reach the RGS within 15–30 min.
The layout of RGS in the central area of Tianjin is uneven and polarized. Approximately 8% of the area lies within the L-H area, an area with a high population density but limited accessibility. From the center of the research area to the edge, the RGS distribution increases. RGS accessibility is therefore low in urban centers and even nonexistent in some areas as a result of this distribution.
Depending on the type of RGS, the supply of each type varies greatly. In general, the Disaster Prevention Park Space covers most of the central area of Tianjin within a 15–30 min walking distance. There is however a general shortage of service capacity, primarily due to the distance between Disaster Prevention Park Spaces and the insufficient total area. Temporary Sheltered Green Space and Emergency Sheltered Green Space are in short supply. This is primarily reflected in the insufficient total amount and the uneven distribution of funds. Within 5–10 min, most residential areas have difficulty reaching the RGS.
5.2. Future RGS Additions Proposal
For different time periods, the accessibility of the RGS is calculated. The calculation results indicate that areas without RGS coverage, areas with low accessibility, and L-H areas are priority areas for future RGS construction. These three types of areas can be integrated using the GIS platform to determine the proposed areas for the construction of 5-min Emergency Sheltered Green Space, 10-min Temporary Shelter Green Space, and 15–30 min Disaster Prevention Park Space. This is shown in Figure 10 and Figure 11.
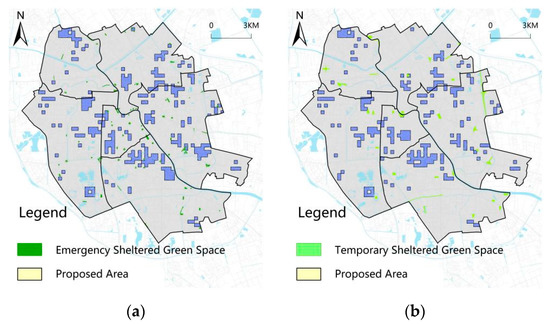
Figure 10.
Preliminary Proposed New Area of Emergency Sheltered Green Space (5 min) and Temporary Sheltered Green Space (10 min). (a) Preliminary proposed construction area of Emergency Sheltered Green Space. (b) Preliminary proposed construction area of Temporary Sheltered Green Space.
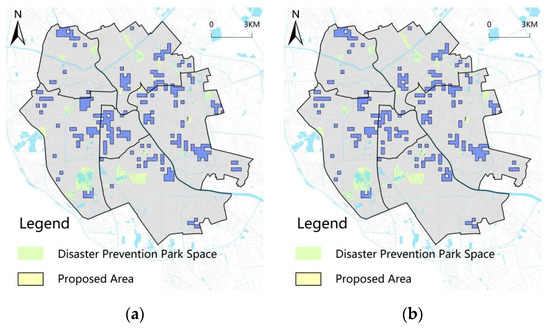
Figure 11.
Preliminary Proposed New Area of Disaster Prevention Park Space. (a) Preliminary proposed construction area of Disaster Prevention Park Space (15 min). (b) Preliminary proposed construction area of Disaster Prevention Park Space (30 min).
After determining where future RGS can be proposed, due to limited resources, the new RGS should be located at a certain distance from the existing RGS. Thus, excluding the RGS areas within 500 m of the existing Emergency Sheltered Green Space, 1500 m of the Temporary Sheltered Green Space and 1500 m of the Disaster Prevention Park Space, a more precise area of proposed future RGS additions can be identified, as shown in Figure 12 and Figure 13.
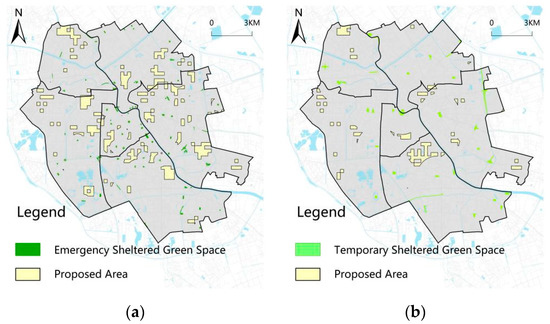
Figure 12.
Future Proposed New Area of Emergency Sheltered Green Space (5 min) and Temporary Sheltered Green Space (10 min). (a) Future proposed construction area of Emergency Sheltered Green Space. (b) Future proposed construction area of Temporary Sheltered Green Space.
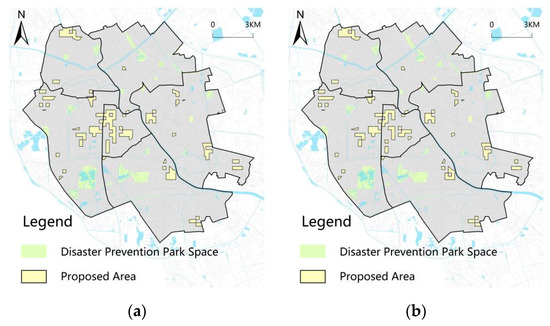
Figure 13.
Future Proposed New Area of Disaster Prevention Park Space. (a) Future proposed construction area of Disaster Prevention Park Space (15 min). (b) Future proposed construction area of Disaster Prevention Park Space (30 min).
According to the Tianjin Green Space System Plan (2020–2035) [88], proposed green spaces can be obtained, as shown in Figure 14. These areas will be used as Urban Green Spaces (UGS) in the future. The Priority RGS locations for construction in the future can be identified by examining areas that overlap, are adjacent to, or are close to the proposed green spaces. Figure 15 illustrates the most important areas for future RGS additions and construction.
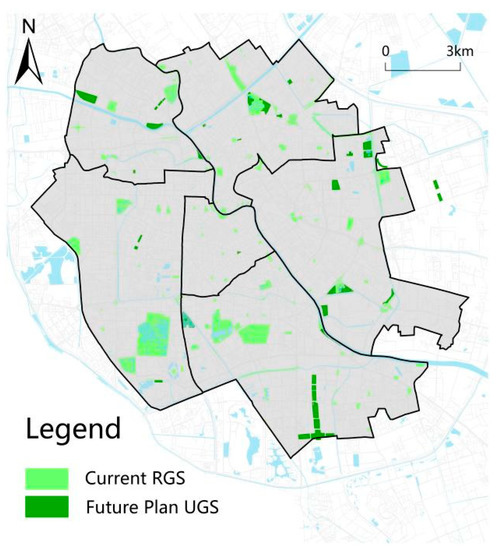
Figure 14.
Map of Future Plan UGS.
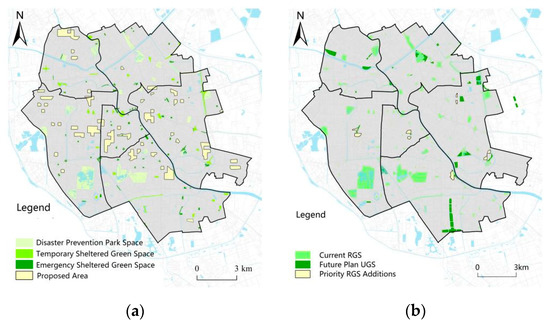
Figure 15.
Future Priority RGS Additions (a) Future Proposed RGS Area; (b) Future Priority RGS Additions Considering the UGS Plan.
In practice, however, the proposed Disaster Prevention Park Space would require significant costs and public resources. Based on the calculations, the Disaster Prevention Park Space in the RGS has a relatively reasonable evacuation capacity. In spite of the fact that there is still room for improvement, the coverage is satisfactory. However, there is a severe shortage of Emergency Sheltered Green Space as well as Temporary Sheltered Green Space. The future construction of RGS in the central area of Tianjin should focus on increasing the number of Emergency Sheltered Green Spaces and Temporary Sheltered Green Spaces. As a result, an additional RGS area of 1000–20,000 m2 would be a better use of resources. It is important to note, however, this result is only considered in the context of RGS accessibility. As a practical matter, it should be considered in conjunction with other factors. For ease of reading, Figure A1 shows the framework of the study.
6. Research Outlook
Based on accessibility calculations, this study evaluates the layout of RGS in the central area of Tianjin and identifies the most appropriate areas for the future construction of RGS. In spite of this, the study still has some areas for improvement. Firstly, the study default accessibility calculation was carried out with the urban road network intact. In practice, large natural hazards such as earthquakes and fires can cause damage to the urban road network on different scales. Walking-based travel modes may also be adversely affected. Therefore, future research could adapt a more precise method of measuring the speed associated with walking-based travel modes.
The study only provides an analysis from the RGS perspective and did not take into account urban squares, car parks, playgrounds, etc. These facilities can also play a vital role in urban disaster prevention. In future studies, these areas could be evaluated from a more holistic perspective. The proposed area for the RGS in this study only identifies the general area. In practice, the situation is much more complex. The elevation of the site, the cost of construction, etc., will all influence the choice of the proposed area. In terms of site selection and optimization, more refined decision models can be used for comparison.
Author Contributions
Conceptualization, Y.C. and Y.G.; methodology, Y.C.; software, Y.C. and C.W.; validation, Y.C. and Y.G.; formal analysis, Y.C. and C.W.; investigation, Y.C. and C.W.; resources, Y.G.; data curation, Y.C. and Y.G.; writing—original draft preparation, Y.C., writing—review and editing, Y.C. and Y.G.; visualization, Y.C. and Y.G.; supervision, Y.L.; project administration, Y.L. All authors have read and agreed to the published version of the manuscript.
Funding
This research was funded by Research and Demonstration of Multiple Methods Based on Ecological Effect Enhancement, grant number D171100007117003.
Institutional Review Board Statement
Ethical review and approval were waived for this study due to all the data applied belongs to open access.
Informed Consent Statement
Informed consent was obtained from all subjects involved in the study.
Data Availability Statement
RGS Information Available at: https://www.tj.gov.cn (accessed on 28 May 2022); Population Data Information Available at: http://tj.bendibao.com/news/2021521/102385.shtm (accessed on 28 May 2022); Road Network Data Information Available at: https://www.openstreetmap.org (accessed on 4 June 2022).
Acknowledgments
We express thanks to Zhe Sun for his kind suggestions for this article. Thanks to the four reviewers for their constructive comments and patient responses to the article.
Conflicts of Interest
The authors declare no conflict of interest.
Appendix A

Figure A1.
Research Framework.
References
- Yuming, L.; Jin, L. China’s 70 years of disaster prevention and mitigation: Review and interpretation. Soc. Secur. Res. 2019, 6, 37–43. [Google Scholar]
- UN Report. Available online: https://baijiahao.baidu.com/s?id=1680416229649368176&wfr=spider&for=pc (accessed on 8 May 2022).
- Junfeng, H.; Baojun, Z.; Da, F.; Siquan, Y. Current situation and development ideas of standardization of comprehensive disaster prevention and reduction in China. J. Ecol. 2014, 33, 235–241. [Google Scholar] [CrossRef]
- Xiumei, L.; Zhenlin, X.; Zhigang, Z. Urban disaster prevention park planning problem. J. Hebei Inst. Technol. 2006, 4, 135–138. [Google Scholar]
- Fagen, J.L.; Sorensen, W.; Anderson, P.B. Why not the University of New Orleans? Social disorganization and sexual violence among internally displaced women of Hurricane Katrina. J. Community Health 2011, 5, 721–727. [Google Scholar] [CrossRef]
- Rey, T.; Le De, L.; Leone, F.; Gilbert, D. An integrative approach to understand vulnerability and resilience post-disaster: The 2015 cyclone Pam in urban Vanuatu as case study. Disaster Prev. Manag. 2017, 3, 259–275. [Google Scholar] [CrossRef]
- Sister, C.; Wolch, J.; Wilson, J. Got green? addressing environmental justice in park provision. GeoJournal 2010, 75, 229–248. [Google Scholar] [CrossRef]
- Rigolon, A.; Németh, J. Green gentrification or ‘just green enough’: Do park location, size and function affect whether a place gentrifies or not? Urban Stud. 2020, 2, 402–420. [Google Scholar] [CrossRef]
- Deren, L.; Liangming, L.; Wei, L. The System Concept of the Chinese Disaster Reduction System. Impact Sci. Soc. 2010, 4, 25–30. [Google Scholar]
- Lei, J. Research on China’s comprehensive disaster Reduction Legislation System. J. Natl. Acad. Gov. 2004, 6, 45–48. [Google Scholar] [CrossRef]
- Zhiyi, B.; Bo, C. Construction of urban green space system and urban disaster reduction and disaster prevention. J. Nat. Disaster 2004, 2, 155–160. [Google Scholar]
- Jinqun, T.; Dongmei, L.; Jianzhong, J. Urban Safety and Urban Green Space Planning and Construction in China. Chin. Gard. 2008, 9, 1–4. [Google Scholar]
- Spanò, M.; Gentile, F.; Davies, C.; Lafortezza, R. The DPSIR framework in support of green infrastructure planning: A case study in Southern Italy. Land Use Policy 2017, 61, 242–250. [Google Scholar] [CrossRef]
- French, E.L.; Birchall, S.J.; Landman, K.; Brown, R. Designing public open space to support seismic resilience: A systematic review. Int. J. Disaster Risk Reduct. 2019, 34, 1–10. [Google Scholar] [CrossRef]
- Skarbek, E.C. The Chicago Fire of 1871: A bottom-up approach to disaster relief. Public Choice 2014, 160, 155–180. [Google Scholar] [CrossRef]
- Anhorn, J.; Khazai, B. Open space suitability analysis for emergency shelter after an earthquake. Nat. Hazards Earth Syst. Sci. 2015, 15, 789–803. [Google Scholar] [CrossRef]
- Spinney, R.G. City of Big Shoulders: A History of Chicago; Cornell University Press: New York, NY, USA, 2020; pp. 167–182. [Google Scholar]
- Tsurumi, T.; Managi, S. Environmental value of green spaces in Japan: An application of the life satisfaction approach. Ecol. Econ. 2015, 120, 1–12. [Google Scholar] [CrossRef]
- Rupprecht, C.D.; Byrne, J.A.; Ueda, H.; Lo, A.Y. ‘It’s real, not fake like a park’: Residents’ perception and use of informal urban green-space in Brisbane, Australia and Sapporo, Japan. Landsc. Urban Plan. 2015, 143, 205–218. [Google Scholar] [CrossRef]
- Wolch, J.R.; Byrne, J.; Newell, J.P. Urban green space, public health, and environmental justice: The challenge of making cities ‘just green enough’. Landsc. Urban Plan. 2014, 125, 234–244. [Google Scholar] [CrossRef]
- Kim, M.; Rupprecht, C.D.; Furuya, K. Residents’ perception of informal green space—A case study of Ichikawa City, Japan. Land 2018, 7, 102. [Google Scholar] [CrossRef]
- Kim, M.; Rupprecht, C.D.; Furuya, K. Typology and perception of informal green space in urban interstices: A case study of Ichikawa city, Japan. Int. Rev. Spat. Plan. Sustain. Dev. 2020, 8, 4–20. [Google Scholar] [CrossRef]
- Yu, M.; Yang, C.; Li, Y. Big Data in Natural Disaster Management: A Review. Geosciences 2018, 8, 165. [Google Scholar] [CrossRef]
- Granell, C.; Ostermann, F.O. Beyond data collection: Objectives and methods of research using VGI and geo-social media for disaster management. Comput. Environ. Urban Syst. 2016, 59, 231–243. [Google Scholar] [CrossRef]
- Evacuation and Shelter Guidance. Available online: https://www.gov.uk/government/publications/evacuation-and-shelter-guidance (accessed on 14 May 2022).
- The National Response Framework. Available online: https://www.gsa.gov/governmentwide-initiatives/emergency-response/the-national-response-framework (accessed on 14 May 2022).
- Yun, L. Planning and construction of Japanese Urban Disaster Prevention Park after the Hanshin Light Road earthquake. Chin. Gard. 2007, 7, 13–15. [Google Scholar]
- Yonghei, K.; Yue, S. The Planning of Urban Green Space in Japan. Chin. Gard. 2007, 7, 1–5. [Google Scholar]
- Junhua, Z. Technology trend of disaster prevention and mitigation in Japanese urban parks. Chin. Gard. 2008, 9, 19–21. [Google Scholar]
- Neng, L.; Yan, P. Disaster Prevention Education in Shizuoka Prefecture Japan—Countermeasures to earthquake-tsunami continuous composite disaster. Int. Earthq. Dyn. 2012, 11, 34–35+38. [Google Scholar]
- Youpo, S.; Ruixing, L. Reduction function of the disaster prevention park. Eng. J. Disaster Prev. Mitig. 2004, 2, 232–235. [Google Scholar]
- Sharifi, A.; Yamagata, Y. Resilient Urban Planning: Major Principles and Criteria. Energy Procedia 2014, 61, 1491–1495. [Google Scholar] [CrossRef]
- Xiaoling, L.; Chunliang, X.; Lin, C.; Nuying, W. Application of—Neighborhood method based on disaster prevention target in Changchun city. J. Appl. Ecol. 2016, 27, 3641–3648. [Google Scholar] [CrossRef]
- Zhanpeng, L. High-density Urban Disaster Prevention Park Green Space Planning Study—Takes Hong Kong as the research analysis object. Chin. Gard. 2008, 9, 37–42. [Google Scholar]
- Junfei, X.; Yanming, L.; Shuhua, L. Research on the Emergency Escape Function Distribution of Beijing Urban Park Green Space. Chin. Gard. 2007, 7, 23–27. [Google Scholar]
- Mingwu, Y.; Jun, W.; Yaolong, L.; Shiyuan, X. Study on refuge accessibility in Shanghai based on GIS. Geogr. Geogr. Inf. Sci. 2008, 2, 96–98+103. [Google Scholar]
- Wen, L.; Lin, Z.; Ying, L. Analysis of accessibility and service efficiency in Harbin City Park. Chin. Gard. 2010, 26, 59–62. [Google Scholar]
- Jianhong, W.; Weiguo, W. Site selection decision support system for emergency shelters. J. Tsinghua Univ. 2011, 51, 632–636. [Google Scholar] [CrossRef]
- Bruneau, M.; Chang, S.E.; Eguchi, R.T.; Lee, G.C.; O’Rourke, T.D.; Reinhorn, A.M.; Shinozuka, M.; Tierney, K.; Wallace, W.A.; Von Winterfeldt, D. A framework to quantitatively assess andenhance the resilience of communities. Earthq. Spectra 2003, 4, 733–752. [Google Scholar] [CrossRef]
- Ouyang, M.; Dueñas-Osorio, L.; Min, X. A three-stage resilience analysis framework for urban infrastructure systems. Struct. Saf. 2012, 36–37, 23–31. [Google Scholar] [CrossRef]
- Cutter, S.L.; Barnes, L.; Berry, M.; Burton, C.; Evans, E.; Tate, E.; Webb, J. A place-based model for understanding community resilience to natural disasters. Glob. Environ. Chang. 2008, 18, 598–606. [Google Scholar] [CrossRef]
- Yang, L.; Rao, P.; Zhu, K.; Liu, S.; Zhan, X. Observation study of pedestrian flow on staircases with different dimensions under normal and e-mergency conditions. Saf. Sci. 2012, 5, 1173–1179. [Google Scholar] [CrossRef]
- Yuan, Z.; Jia, H.; Zhang, L.; Bian, L. Simulation of pedestrian behavior in the collision-avoidance process considering their moving preferences. Discret. Dyn. Nat. Soc. 2017, 2017, 3678268. [Google Scholar] [CrossRef]
- Yumin, T. Study on evacuation behavior and evacuation design of special population. Sci. Disaster 2013, 3, 91–94. [Google Scholar]
- Xuefeng, Z.; Chengjun, Z.; Chenixi, B. Multiple disaster personnel evacuation perception model based on agent technology. J. Syst. Simul. 2016, 3, 534–541. [Google Scholar]
- Yazdani, M.; Mojtahedi, M.; Loosemore, M. Enhancing evacuation response to extreme weather disasters using public transportation systems: A novel simheuristic approach. J. Comput. Des. Eng. 2020, 7, 195–210. [Google Scholar] [CrossRef]
- Psrsons, M.; Morley, P. TheAustralian natural disaster resilience index. Aust. Emerg. Manag. 2017, 2, 20. [Google Scholar]
- Bozza, A.; Asprone, D.; Parisi, F.; Manfredi, G. Alternative resilience indices for city ecosystems subjecred to natural hazards. Comput.-Aided Civ. Infrastruct. Eng. 2017, 7, 527–545. [Google Scholar] [CrossRef]
- Chunguo, W. Japanese community disaster prevention and mitigation system and emergency response capacity building model. Urban Disaster Reduct. 2010, 2, 18–19. [Google Scholar]
- Fei, C.; Chunqing, L.; Jin, G.; Qing, X. Research on Urban Disaster Prevention and Green Space System Planning in Nanchang City. Ind. Saf. Environ. Prot. 2012, 38, 27–29. [Google Scholar]
- Xi, Z.; Xiaochun, S. Discussion on disaster prevention planning, construction and management of Urban Green Space—Based on the thinking of Sichuan Wenchuan earthquake. China’s Popul. Resour. Environ. 2008, 6, 152–156. [Google Scholar]
- Chunqing, L.; Qi, Z.; Wenjun, F. The Construction of Urban Disaster Prevention and Risk Relief Green Space System. China Agric. Bull. 2010, 26, 204–208. [Google Scholar]
- Ying, Z.; Hao, W.; Shaoping, Z.; Xiaodong, W. Urumqi city disaster prevention Park green space construction countermeasures. Urban Plan. 2009, 12, 48–52. [Google Scholar]
- Kongjian, Y.; Tiewu, D.; Jihua, L.; Jinfu, P. Landscape accessibility as an evaluation method and case to measure the functional indicators of urban green space system. Urban Plan. 1999, 8, 7–10. [Google Scholar]
- Jie, C.; Feng, L.; Changxiu, C. Review of the accessibility measurement method and applied research progress. Adv. Geogr. Sci. 2007, 5, 100–110. [Google Scholar]
- Ariel, M. Accessibility theory: An overview. Text Represent. Linguist. Psycholinguist. Asp. 2001, 8, 29–87. [Google Scholar]
- Handy, S.L.; Niemeier, D.A. Measuring accessibility: An exploration of issues and alternatives. Environ. Plan. A 1997, 29, 1175–1194. [Google Scholar] [CrossRef]
- Páez, A.; Scott, D.M.; Morency, C. Measuring accessibility: Positive and normative implementations of various accessibility indicators. J. Transp. Geogr. 2012, 25, 141–153. [Google Scholar] [CrossRef]
- Van Wee, B.; Hagoort, M.; Annema, J.A. Accessibility measures with competition. J. Transp. Geogr. 2001, 9, 199–208. [Google Scholar] [CrossRef]
- Luo, W.; Whippo, T. Variable catchment sizes for the two-step floating catchment area (2SFCA) method. Health Place 2012, 18, 789–795. [Google Scholar] [CrossRef] [PubMed]
- Ahn, J.S.; Kim, L.B.; Park, M.R. An analysis of variation of spatial accessibility pattern based on 2SFCA: A case study of welfare facilities for the aged in Gumi city. J. Korean Assoc. Geogr. Inf. Stud. 2014, 17, 112–128. [Google Scholar] [CrossRef][Green Version]
- Luo, W.; Wang, F. Measures of Spatial Accessibility to Health Care in a GIS Environment: Synthesis and a Case Study in the Chicago Region. Environ. Plan. B Plan. Des. 2003, 30, 865–884. [Google Scholar] [CrossRef] [PubMed]
- Langford, M.; Higgs, G.; Fry, R. Multi-modal two-step floating catchment area analysis of primary health care accessibility. Health Place 2016, 38, 70–81. [Google Scholar] [CrossRef] [PubMed]
- Hu, S.; Song, W.; Li, C.; Lu, J. A multi-mode Gaussian-based two-step floating catchment area method for measuring accessibility of urban parks. Cities 2020, 105, 102815. [Google Scholar] [CrossRef]
- Xing, L.; Liu, Y.; Wang, B.; Wang, Y.; Liu, H. An environmental justice study on spatial access to parks for youth by using an improved 2SFCA method in Wuhan, China. Cities 2020, 96, 102405. [Google Scholar] [CrossRef]
- Kc, K.; Corcoran, J.; Chhetri, P. Measuring the spatial accessibility to fire stations using enhanced floating catchment method. Socio-Econ. Plan. Sci. 2020, 69, 100673. [Google Scholar] [CrossRef]
- Delamater, P.L. Spatial accessibility in suboptimally configured health care systems: A modified two-step floating catchment area (M2SFCA) metric. Health Place 2013, 24, 30–43. [Google Scholar] [CrossRef] [PubMed]
- Ranga, V.; Panda, P. Spatial access to in-patient health care in northern rural India. Geospat. Health 2014, 8, 545–556. [Google Scholar] [CrossRef] [PubMed]
- Shah, T.I.; Bell, S.; Wilson, K. Spatial accessibility to health care services: Identifying under-serviced neighbourhoods in Canadian urban areas. PLoS ONE 2016, 11, e0168208. [Google Scholar] [CrossRef] [PubMed]
- Rekha, R.S.; Wajid, S.; Radhakrishnan, N.; Mathew, S. Accessibility analysis of health care facility using geospatial techniques. Transp. Res. Procedia 2017, 27, 1163–1170. [Google Scholar] [CrossRef]
- Wan, N.; Zou, B.; Sternberg, T. A three-step floating catchment area method for analyzing spatial access to health services. Int. J. Geogr. Inf. Sci. 2012, 26, 1073–1089. [Google Scholar] [CrossRef]
- Canqiang, Z.; Biao, Z.; Wenhua, L.; Highland, X.; Yu, X. Evaluation of disaster prevention and risk avoidance function of green space in Beijing city. Geogr. Res. 2012, 31, 2301–2309. [Google Scholar]
- Rekha, R.S.; Radhakrishnan, N.; Mathew, S. Spatial accessibility analysis of schools using geospatial techniques. Spat. Inf. Res. 2020, 28, 699–708. [Google Scholar] [CrossRef]
- Kondo, M.C.; Fluehr, J.M.; McKeon, T.; Branas, C.C. Urban green space and its impact on human health. Int. J. Environ. Res. Public Health 2018, 15, 445. [Google Scholar] [CrossRef]
- Wang, X.J. Analysis of problems in urban green space system planning in China. J. For. Res. 2009, 20, 79–82. [Google Scholar] [CrossRef]
- Li, Y.; Liu, Y.; Jiao, J. A GIS-based suitability analysis of Xiamen’s green space in park for earthquake disaster prevention and refuge. Urban Plan. Des. Res. 2013, 1, 1–8. [Google Scholar]
- Ding, A.; Cenci, J.; Zhang, J. Links between the pandemic and urban green spaces, a perspective on spatial indices of landscape garden cities in China. Sustain. Cities Soc. 2022, 85, 104046. [Google Scholar] [CrossRef] [PubMed]
- Douglas, O.; Lennon, M.; Scott, M. Green space benefits for health and well-being: A life-course approach for urban planning, design and management. Cities 2017, 66, 53–62. [Google Scholar] [CrossRef]
- Zhang, L. Transformation of the urban green space as a disaster refuge-a case study on Hangzhou Qianjiang new CBD core area. J. Zhejiang Univ. 2016, 43, 372–378. [Google Scholar]
- Zhang, H.; Chen, B.; Sun, Z.; Bao, Z. Landscape perception and recreation needs in urban green space in Fuyang, Hangzhou, China. Urban For. Urban Green. 2013, 12, 44–52. [Google Scholar] [CrossRef]
- Fei, W.; Wu, J.; Shi, Y.; Chen, Q. Construction of disaster prevention capability evaluation framework of urban park system: Methodology and its application in china. J. Environ. Eng. Landsc. Manag. 2020, 28, 9–19. [Google Scholar] [CrossRef]
- Lin, G.; Hui, C.; Yanqiong, L.; Shaowei, Z.; Jun, L.; Changlong, M. Green space area index of shock absorber evacuation park in Chengdu city. Ecol. J. 2008, 28, 5876–5883. [Google Scholar]
- Tianjin Government. Available online: https://www.tj.gov.cn (accessed on 28 May 2022).
- Disaster Statistics. Available online: https://baike.baidu.com/item/%E5%A4%A9%E6%B4%A5/132308?fr=aladdin (accessed on 28 May 2022).
- Youpo, S.; Yumin, Z. Study on earthquake damage distribution of Tangshan Earthquake. Seism. Eng. Eng. Vib. 2006, 3, 18–21. [Google Scholar] [CrossRef]
- Guoqiang, Z. Planning and construction of central area of Tianjin. Urban Plan. 2007, 10, 23–29. [Google Scholar]
- Jianfeng, S.; Qingbin, Z. The suitability evaluation of—Takes the central city of Tianjin as an example. Earthq. Def. Technol. 2021, 16, 414–420. [Google Scholar]
- Tianjin City Green Space System Plan. Available online: https://csgl.tj.gov.cn/zwgk_57/zfxxgk01/fdzdgknr/qtfdgkxx1/202102/t20210220_5361913.html (accessed on 28 May 2022).
- Xiaolei, X.; Weiyong, S.; Hong, W. Establish a perfect urban disaster prevention system. Zhejiang Archit. 2009, 26, 1–4. [Google Scholar] [CrossRef]
- Juan, C.; Xiaofei, W. Discussion on the construction of disaster prevention and green space in high-density central city—Take the Wuhou District of Chengdu city as an example. J. Huaihua Coll. 2012, 31, 88–92. [Google Scholar] [CrossRef]
- Baojun, Z. On the construction of Urban disaster prevention and risk avoidance green space. Shanxi Constr. 2009, 35, 45–46. [Google Scholar]
- Tianjin Planning and Natural Resources Bureau. Available online: https://ghhzrzy.tj.gov.cn (accessed on 28 May 2022).
- Cao, Y.; Guo, Y.; Zhang, M. Research on the Equity of Urban Green Park Space Layout Based on Ga2SFCA Optimization Method—Taking the Core Area of Beijing as an Example. Land 2022, 11, 1323. [Google Scholar] [CrossRef]
- The Seventh Census. Available online: http://tj.bendibao.com/news/2021521/102385.shtm (accessed on 28 May 2022).
- Li, M.; Yang, L.; Wei, Y. Improved Gaussian based 2-step floating catchment area method: A case study of green space accessibility in Shanghai. Prog. Geogr. 2016, 35, 990–996. [Google Scholar]
- OpenStreetMap Project. Available online: https://www.openstreetmap.org/ (accessed on 14 January 2019).
- Wang, Q.; Taylor, J.E. Patterns and limitations of urban human mobility resilience under the influence of multiple types of natural disaster. PLoS ONE 2016, 11, e0147299. [Google Scholar] [CrossRef] [PubMed]
- Yazici, M.A.; Ozbay, K. Impact of probabilistic road capacity constraints on the spatial distribution of hurricane evacuation shelter capacities. Transp. Res. Rec. 2007, 1, 55–62. [Google Scholar] [CrossRef]
- Stangl, P. Prospects for Urban Morphology in Resilience Assessment. In Resilience-Oriented Urban Planning, 1st ed.; Yamagata, Y., Sharifi, A., Eds.; Springer: Cham, Switzerland, 2018; Volume 65, pp. 181–193. [Google Scholar]
- Masuda, N. Disaster refuge and relief urban park system in Japan. Landsc. Archit. Front. 2014, 2, 52–61. [Google Scholar]
- Liu, W.; Xu, H.; Wu, J.; Hu, H. Measuring spatial accessibility to refuge green space after earthquakes: A case study of Nanjing, China. PLoS ONE 2022, 17, e0270035. [Google Scholar] [CrossRef] [PubMed]
- Xiao, M.L.; Chen, Y.; Yan, M.J.; Ye, L.Y.; Liu, B.Y. Simulation of household evacuation in the 2014 Ludian earthquake. Bull. Earthq. Eng. 2016, 14, 1757–1769. [Google Scholar] [CrossRef]
- Baijiaohao. Available online: https://baijiahao.baidu.com/s?id=1747369004995516992&wfr=spider&for=pc (accessed on 28 October 2022).
- Nakamura, Y.; Saita, J. UrEDAS, the earthquake warning system: Today and tomorrow. In Earthquake Early Warning Systems, 1st ed.; Gasparini, P., Manfredi, G., Zschau, J., Eds.; Springer: Berlin/Heidelberg, Germany, 2007; Volume 5, pp. 249–281. [Google Scholar]
- Bo, Y.; Shaobin, W.; Wenyong, T. Planning strategy of disaster prevention and green space system in Shapingba Unit of Chongqing. J. Nat. Disaster 2012, 21, 136–143. [Google Scholar] [CrossRef]
- Yonghua, L.; Shuang, L. Study on improved space accessibility of Shenzhen Indoor Emergency Shelters in G2SFCA. J. Wuhan Univ. 2019, 44, 1391–1398. [Google Scholar] [CrossRef]
- Jiwei, X.; Shiming, F.; Chunyan, L. Analysis of spatial fairness of parks in Wuhan based on G2SFCA. Resour. Sci. 2017, 39, 430–440. [Google Scholar]
- Kelejian, H.H.; Prucha, I.R. On the asymptotic distribution of the Moran I test statistic with applications. J. Econom. 2011, 104, 219–257. [Google Scholar] [CrossRef]
- Ziming, Z.; Xinhua, Q. Space Development of Minnan Delta based on Moran’I. Econ. Geogr. 2009, 29, 1977–1980. [Google Scholar]
- Greco, G.M. The nature of accessibility studies. J. Audiov. Transl. 2018, 1, 205–232. [Google Scholar] [CrossRef]
- Levine, J. A century of evolution of the accessibility concept. Transp. Res. Part D Transp. Environ. 2020, 83, 102309. [Google Scholar] [CrossRef]
- Wei, Y.; Jin, L.; Xu, M.; Pan, S.; Xu, Y.; Zhang, Y. Instructions for planning emergency shelters and open spaces in China: Lessons from global experiences and expertise. Int. J. Disaster Risk Reduct. 2020, 51, 101813. [Google Scholar] [CrossRef] [PubMed]
- Wei, X.Y.; Cai, J.H.; Ye, Y.C.; Zhou, Y.; Liu, C.Q. Landscape pattern analysis and optimum design of park green space in Nanchang City, China based on GIS. J. Appl. Ecol. 2018, 29, 2852–2860. [Google Scholar]
- Zhang, X.; Yu, J.; Chen, Y.; Wen, J.; Chen, J.; Yin, Z. Supply–Demand Analysis of Urban Emergency Shelters Based on Spatiotemporal Population Estimation. Int. J. Disaster Risk Sci. 2020, 11, 519–537. [Google Scholar] [CrossRef]
Publisher’s Note: MDPI stays neutral with regard to jurisdictional claims in published maps and institutional affiliations. |
© 2022 by the authors. Licensee MDPI, Basel, Switzerland. This article is an open access article distributed under the terms and conditions of the Creative Commons Attribution (CC BY) license (https://creativecommons.org/licenses/by/4.0/).