Article

Numerical Analysis of a TEG and mPCM Enhancement System for BIPVs Using CFD

1
Department of Architectural Engineering, College of Engineering, Hanyang University, Seoul 04763, Republic of Korea
2
Department of Living and Built Environment Research, Korea Institute of Civil Engineering and Building Technology, Goyang 10223, Republic of Korea
*
Author to whom correspondence should be addressed.
Sustainability 2022, 14(23), 15559; https://doi.org/10.3390/su142315559
Submission received: 2 November 2022 / Revised: 15 November 2022 / Accepted: 20 November 2022 / Published: 23 November 2022
(This article belongs to the Special Issue Healthy, Smart and Interactive Built Environment)

Abstract

:
Building-integrated photovoltaics (BIPVs) are the most promising systems for net-zero energy buildings. However, there are few practical cases because of shortcomings, such as the lack of solar tracking and the rapid rise in PV surface temperature. Therefore, methods of increasing the efficiency of BIPVs have been proposed and studied. These include using phase change material (PCM) or heat fins, wavelength selection, decreasing the PV surface temperature, or using a thermoelectric generator (TEG) and convection cooling to utilize the waste heat from the PV. Many preceding studies have been conducted on TEG and convection heat dissipation methods to utilize as much waste heat as possible. Therefore, in this study, a TEG–PCM hybrid system using mPCM was proposed to improve constructability. Herein, the appropriate phase change temperature of the PCM, the heat fin spacing in the PCM container, and the TEG arrangement were analyzed through computational fluid dynamics (CFD)-based simulations. The appropriate melting temperature of the PCM, the heat fin interval, and the arrangement of the TEG for the proposed system are 25 °C, 20 mm, and 140 mm, respectively. In order to achieve optimal efficiency, it is necessary to consider an appropriate amount of heat transfer, and it has been confirmed that if there are too many thermoelectric elements, the opposite effect occurs.

1. Introduction

Currently, because of urbanization, the increasing number of people living in cities has led to the construction of more buildings [1]. In addition, more and more electronic devices are being used in buildings, such as Internet of things (IoT) sensors, electric cars, electric heaters, ventilation systems, air conditioning (HVAC) systems, etc., and this causes a large amount of electrical energy to be consumed by buildings [2]. Therefore, to obtain such a large amount of electric energy consumption in an environmentally friendly way, many studies are being conducted on the application of renewable energy to cities. Photovoltaic (PV) panels are the most widely used tools in this field. Nevertheless, the reality is that it is challenging to supply a large amount of renewable energy due to the limited space of cities. Therefore, many studies have been conducted on building-integrated photovoltaics (BIPVs), which refers to solar panels integrated with buildings.
Unlike conventional PVs, BIPVs are fixed to the wall or roof of the building. Therefore, BIPVs have a limited time and angle for receiving sunlight, and the generation efficiency of the PV panels is reduced due to a lack of heat rejection. When the temperature of the PV panel increases, the power generation efficiency decreases by 0.4 or 0.65% per °C [3], and when the panel surface temperature reaches 65 °C, the power generation efficiency can be lowered to about 2.6% [4]. Therefore, to solve this problem, various methods of lowering the temperature of the solar panel have been studied. The various cooling technologies for PV panels are shown in Figure 1 [5]. According to the heat transfer method, the cooling technology of the PV panels can be classified into three types: convection, conduction, and radiation. In general, it has been proposed that a panel cooling system should utilize convection and conduction. Among these, liquid convection cooling showed the highest efficiency improvement at 22%, with phase change materials improving efficiency by up to 21.2%, air convection cooling improving efficiency by 20%, and radiation cooling improving efficiency by up to 2.6%.
Therefore, many convection heat rejection solutions have been proposed to improve the efficiency of BIPVs. Koyunbaba et al. proposed an air-cooling-based BIPV thermal (BIPVT) system with a trombe wall system. An analysis based on experiments and computational fluid dynamics (CFD) calculations showed that the average electrical and thermal efficiencies of this system could reach 4.52% and 27.2%, respectively [3]. Kaiser et al. studied a BIPV module system in a forced convection condition. This study experimentally analyzed the influence of the air gap size and the forced convection ventilation system. Under a duct velocity of 6 m/s, the power generation increased by 19% relative to the natural ventilation case [6]. In addition, some studies focused on water-cooling BIPVT systems. Kim et al. experimentally analyzed the energy performance of a water-cooled BIPVT integrated on a roof. According to the experimental results, it was found that the average thermal and electrical efficiencies of the BIPVT were 30% and 17%, respectively [7].
However, there are disadvantages in that additional power sources are required (pump, valve, etc.), and the system becomes complicated when fluid is used. In addition, most solar heat removed from the PV is discharged back to the outside air of the city; therefore, it increases the urban heat island effect.
In the case of BIPVs, installation and maintenance are more complex than conventional PV panels because it is installed on the exterior of a building. Therefore, the use of fluid makes it difficult to apply practically because using fluid can often cause problems, such as leakage. Therefore, research was conducted on the BIPV system using a phase change material (PCM) and thermoelectric generator (TEG) to increase efficiency via a passive method. According to previous research, using PCM is an efficient passive cooling method for PV panels [8,9,10,11,12]. Hasan et al. experimentally and numerically analyzed the PV–PCM system in a hot climate. It was found that PCM can decrease the temperature of the PV panel by 13 °C at peak time, and the PV panel’s average energy efficiency increased by 5.9% every year relative to that of an existing panel combined with PCMs [13]. Sharma et al. analyzed the paraffin wax on a building-integrated concentrated photovoltaic (BICPV) system. A lap-scale experiment was conducted to examine the cooling effect of the PCM under different levels of xenon lamp irradiation (500 W/m2, 750 W/m2, and 1200 W/m2). The experiment results show that the electrical efficiency increased by 1.15%, 4.2%, and 6.8%, respectively, and that the PV panel surface temperature reduced to 3.8 °C [14]. Stropnik and Stritih, in experiments and simulations using TRNSYS software, analyzed how much the PV panel efficiency increased with a PCM. The experimental results show that the PV with the PCM could maintain the PV panel temperature 35.6 °C lower than the PV panel without the PCM, and that annually it could produce 7.3% more electricity [15].
In order to reduce the panel temperature and produce additional renewable energy simultaneously, studies have been conducted on a hybrid system in which thermoelectric generators (TEGs) are integrated onto PV panels. The TEG is a semiconductor that can generate electric power with a temperature difference based on the Seeback effect. Therefore, the TEG can easily adjust the sizing. There is no need for other combustion or moving parts during the power generation process; therefore, it can be used semi-permanently without noise and have good durability.
Different PV–TEG hybrid system configurations were analyzed in many previous studies [16,17,18]. Moreover, the research showed that the PV–TEG hybrid system could increase efficiency by 1–16% compared with the conventional PV panel system. Makki proposed a heat-pipe-based PV–TEG hybrid system and investigated it numerically and experimentally. This study shows that a further overall system efficiency development of approximately 5% was possible using a TEG [19]. In addition, Cotfas et al. analyzed the three types of TEG material for the PV–TEG hybrid system. Finally, the simulation results showed that the PV–TEG hybrid system could produce approximately 7% more electric power and increase the overall system efficiency by 18.93% more than the conventional PV panel [20].
In the case of the previously proposed PV–TEG hybrid system, a cooling source, such as air or water, is required on the cold side of the TEG. However, most convection methods require additional power sources to circulate the fluids. Therefore, studies using phase change material (PCM) to cool the cold side of the TEG passively have been proposed [21,22,23]. Darkwa et al. analyzed the PV–TEG–PCM system numerically and experimentally. The results showed that the PV–TEG–PCM system could achieve 9.5% more electric power output than the standalone PV and PV–TEG hybrid system [4]. Ko and Jeong suggest a BIPV–TEG–PCM system and analyzed the power generation performance of the proposed system. The proposed system could generate 3.05 kWh from the TEG per year, with respective generation improvements of 0.91%, −1.32%, 2.25%, and 3.16% each season from spring to winter [24]. Cui et al. conducted a simulation study for concentrating a PV–PCM–TE system. Their results showed that the total daily efficiency of the PV–PCM–TE system was higher than the standalone PV system by 1%.
In preceding studies, only the possibility and energy performance analysis of a system combining PVs, TEGs, and PCM were conducted. However, previous research on an appropriate design for maximum efficiency is still insufficient. Therefore, a numerical analysis was conducted to find the optimal design for the manufacture of the proposed BIPV–TEG–PCM, which uses microencapsulated phase change material (mPCM) to harvest solar/thermal energy wasted from the building envelope. Finally, different heat fin spacing, the melting temperature of the PCM, and the TEG arrangement were studied using a computational fluid dynamics (CFD) heat transfer analysis to derive an appropriate thermal structure.

2. System Overview

2.1. Building-Integrated Photovoltaic with TEG and PCM (BIPV–TEG–PCM)

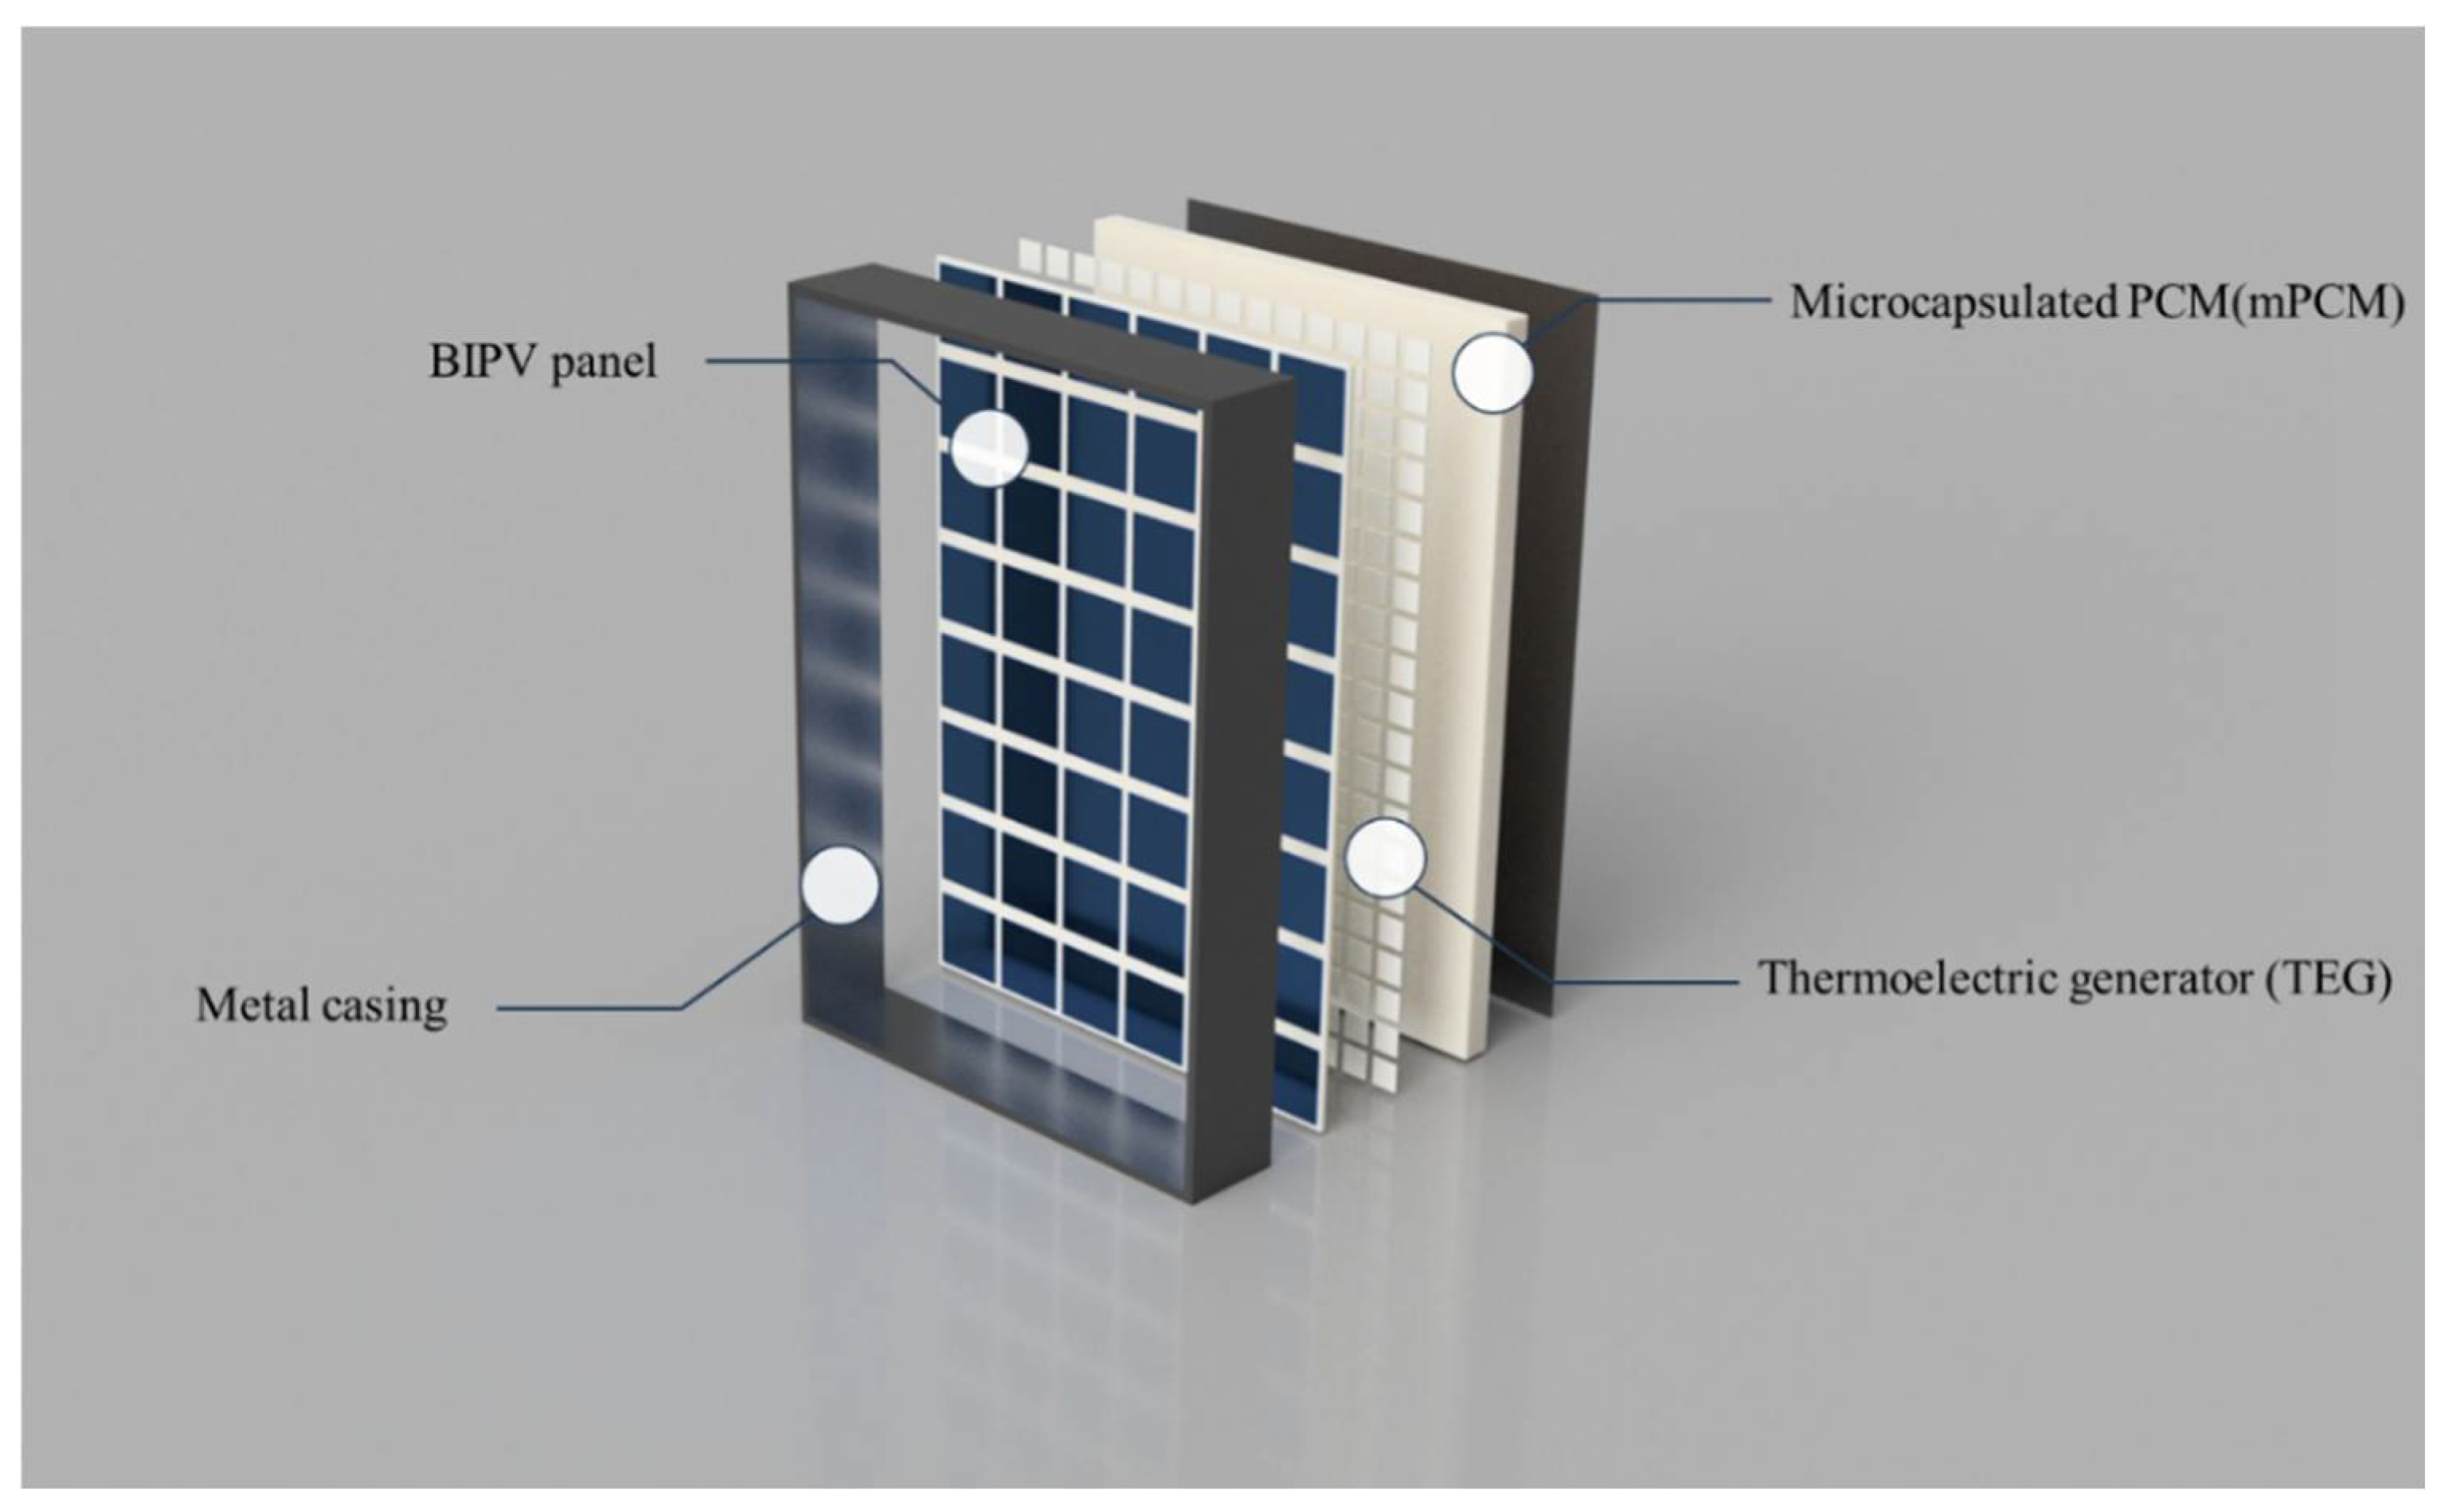
The building-integrated photovoltaic system with a thermoelectric generator and phase change material (BIPV–TEG–PCM) is installed on the exterior wall of the building. It consists of a PV panel, a TEG, and a PCM container (Figure 2). The PV panel is installed at the outermost part to recover the sunlight wasted from the exterior wall. In addition, a PCM container is installed between the exterior wall of the building and the BIPV panel to reduce the temperature rise of the BIPV module. The TEG layer is located between the BIPV module and the PCM container to recover and generate electricity from the temperature difference between the BIPV and the PCM during the heat transfer process. The hot side of the TEG layer is installed on the backside of the PV panel, and aluminum heat fins are installed on the cold side to improve heat transfer with the PCM. The aluminum heat fin improves the low thermal conductivity of the PCM and keeps the temperature of the cold side of the TEG low.
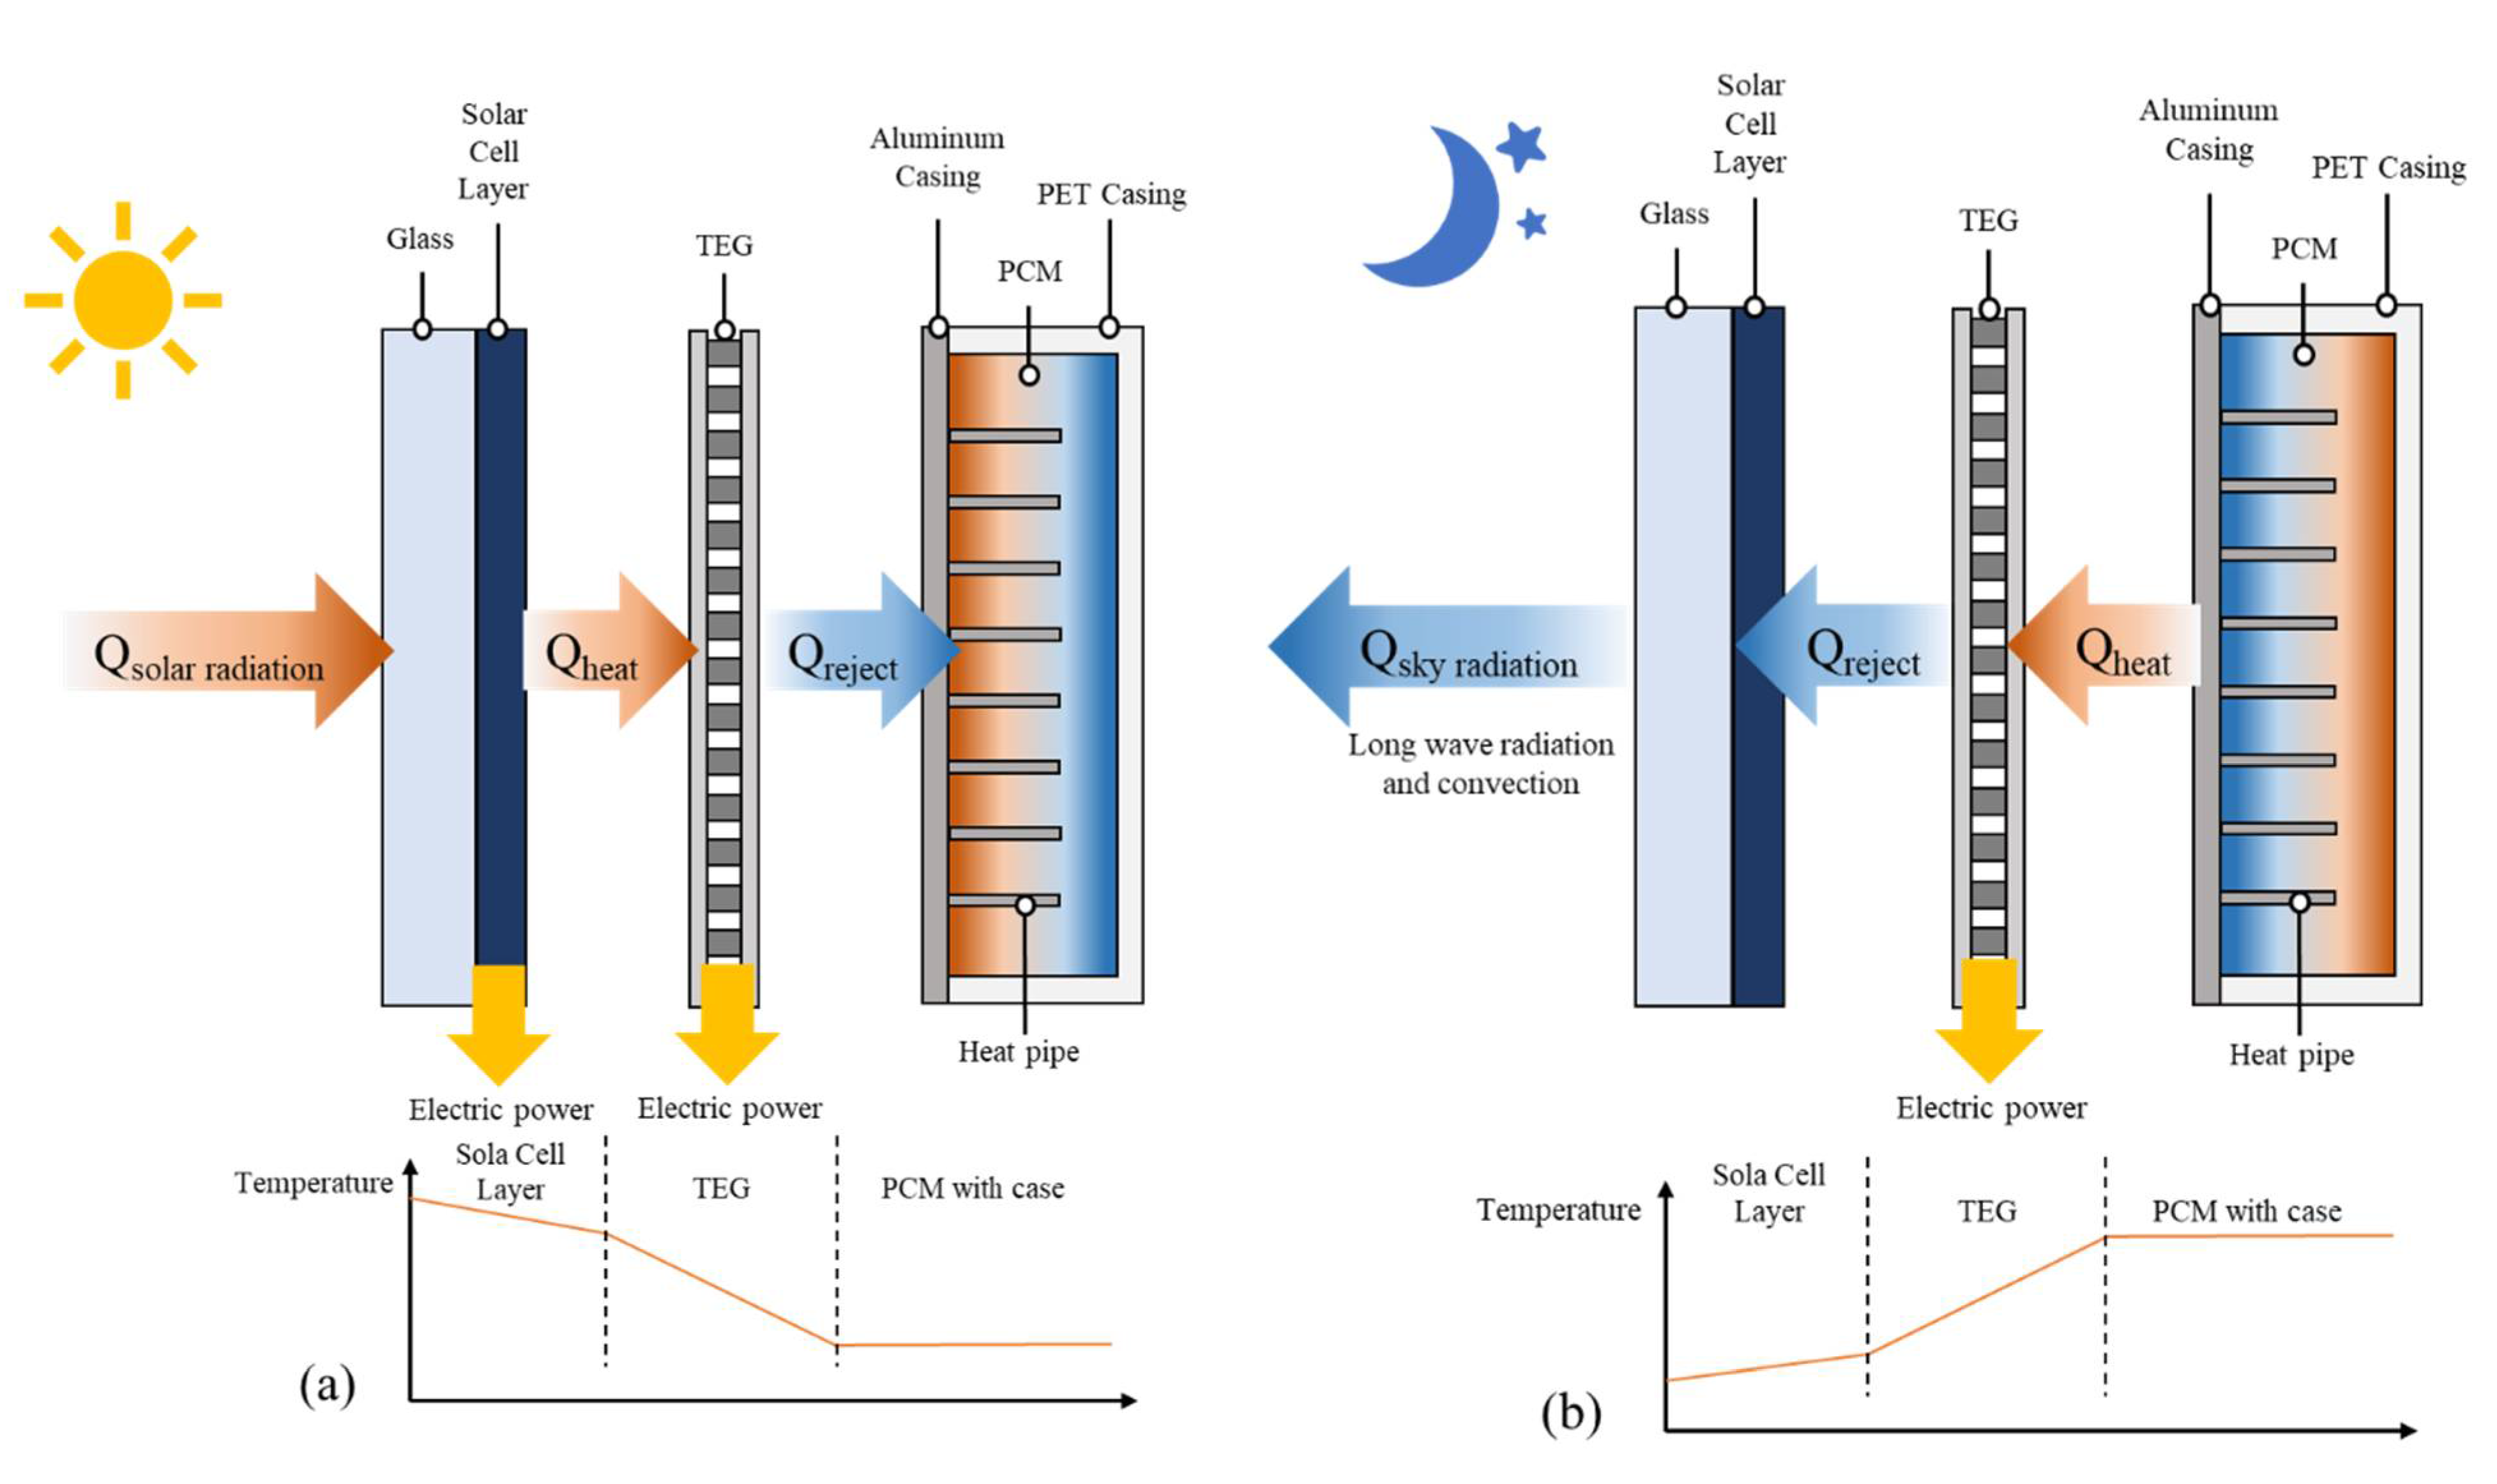
The proposed system is a PVT system that utilizes both sunlight and solar heat to generate electricity. Unlike the conventional PVT system, the BIPV–TEG–PCM does not produce hot water, using solar heat to produce electricity. The power generation process is shown in Figure 3 below. During the daytime, electricity is first generated from the PV panel through sunlight. While the power is generated, the PV surface temperature rises due to solar heat. The solid-state mPCM absorbs the PV panel heat, decreasing the PV panel surface temperature and preventing the decrease in PV panel efficiency. In this absorbing process, a temperature gradient is created at both sides of the TEG, and the TEG generates the electric power based on the temperature gradient. Therefore, dual power generation is possible using solar heat (Figure 3a).
Conversely, during the night, the phase change material is regenerated through longwave sky radiation cooling that occurs between the surface of the PV panel and the sky. In this case, the PV panel is the cooling source, and the PCM is the heat source for the TEG. Therefore, the hot and cold sides of the TEG are reversed (Figure 3b). Thus, the BIPV–TEG–PCM, unlike the conventional PVT system that cannot produce hot water in the absence of the sun, is able to produce electricity even at night.

2.2. Microencapsulated Phase Change Material (mPCM)

A phase change material (PCM) can store energy without changing temperature by storing energy in latent heat. PCMs have been used for energy storage or heat dissipation [25,26,27,28]. However, the regular PCM is the liquid state PCM, and the particles are small. Therefore, it causes leakage problems and reactivity with the external environment. If packing is neglected, leakage occurs when used for a long time, and if a defect occurs in the casing, leakage can occur very quickly [29]. To solve these problems of the conventional PCM, many studies were proposed. The microencapsulation technique is a promising technology for overcoming the shortcomings of this thermal storage system. The microencapsulation phase change material (mPCM) is made in such a way that the organic or inorganic materials can cover PCM droplets smaller than 1000 µm. Therefore, the shortcomings of the regular PCM, such as the low thermal conductivity and leakage problems, can be overcome by increasing the surface-to-volume ratio of the PCM and covering the liquid PCM surface [30].
Therefore, this study selected a microencapsulated PCM (mPCM) to construct a practical BIPV–TEG–PCM system. Due to the fact that BIPVs are installed on exterior walls, simple maintenance is possible for commercialization, and stability must be maintained even after long-term use. Therefore, the leakage problem was eliminated using an mPCM. It is easy to manufacture and has good structural stability.
The mPCM used in this simulation was chosen with reference to data from previous studies. The physical properties of the mPCM used in this simulation are shown in Table 1. Based on the results of the experiments in a preceding study [31], a 6:4 ratio of PCM to tetrabutyl titanate (TBT) was selected for the mPCM. In general, the physical properties of an mPCM are slightly affected by the phase change temperature. However, the previous study did not show a significant difference in the properties of the mPCM. Therefore, the mPCM properties were fixed, and only the phase change temperature was varied in the simulations (25 °C to 45 °C).

3. Numerical Analysis Method

In this study, the photovoltaic (PV) panel surface temperature of the BIPV–TEG–PCM was simulated using finite volume discretization based on the computational fluid dynamics (CFD) Ansys Fluent R1. The solution for the governing equations and their specific boundary conditions was based on a fixed-grid computational domain. This study analyzed the melting temperature of the phase change material (PCM), the heat fin spacing, and the thermoelectric generator (TEG) arrangement for the largest temperature difference in the TEG while lowering the panel surface temperature. Ansys Fluent is the CFD most commonly used to analyze the PCM effect for the system scale. For example, Diarce et al. and Darzi et al. used Ansys Fluent to analyze PCM ventilation systems [32,33].
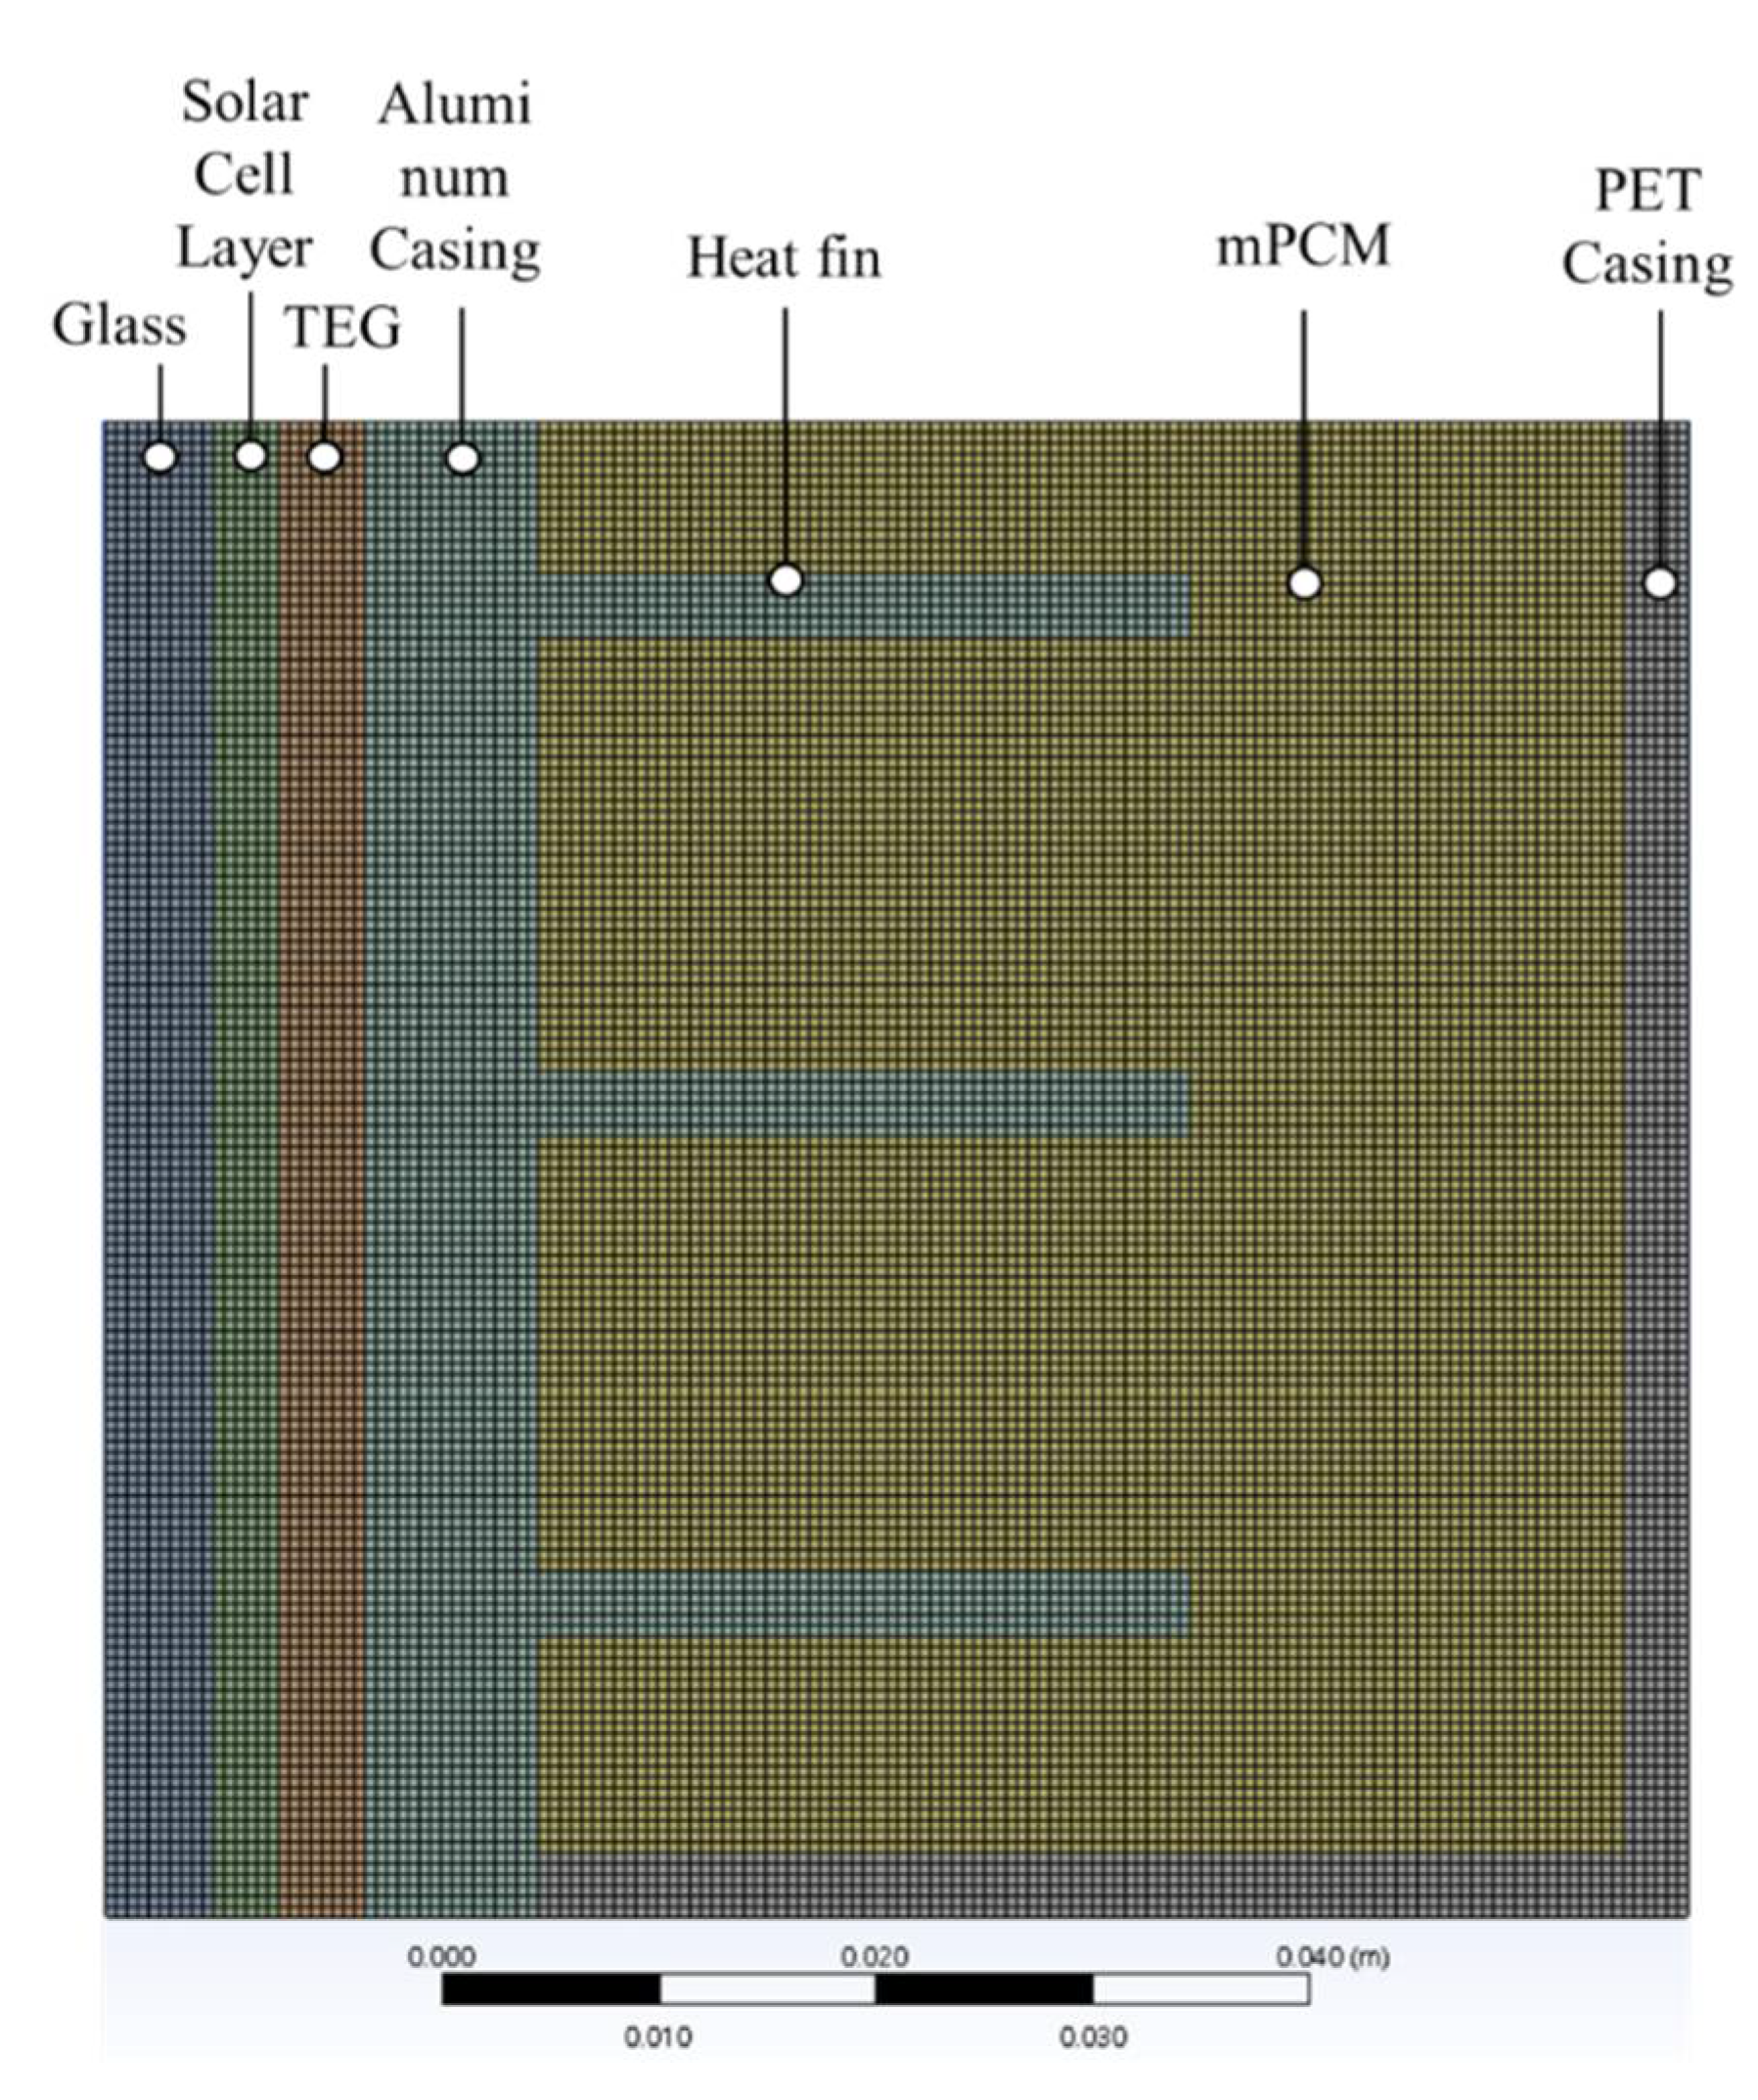
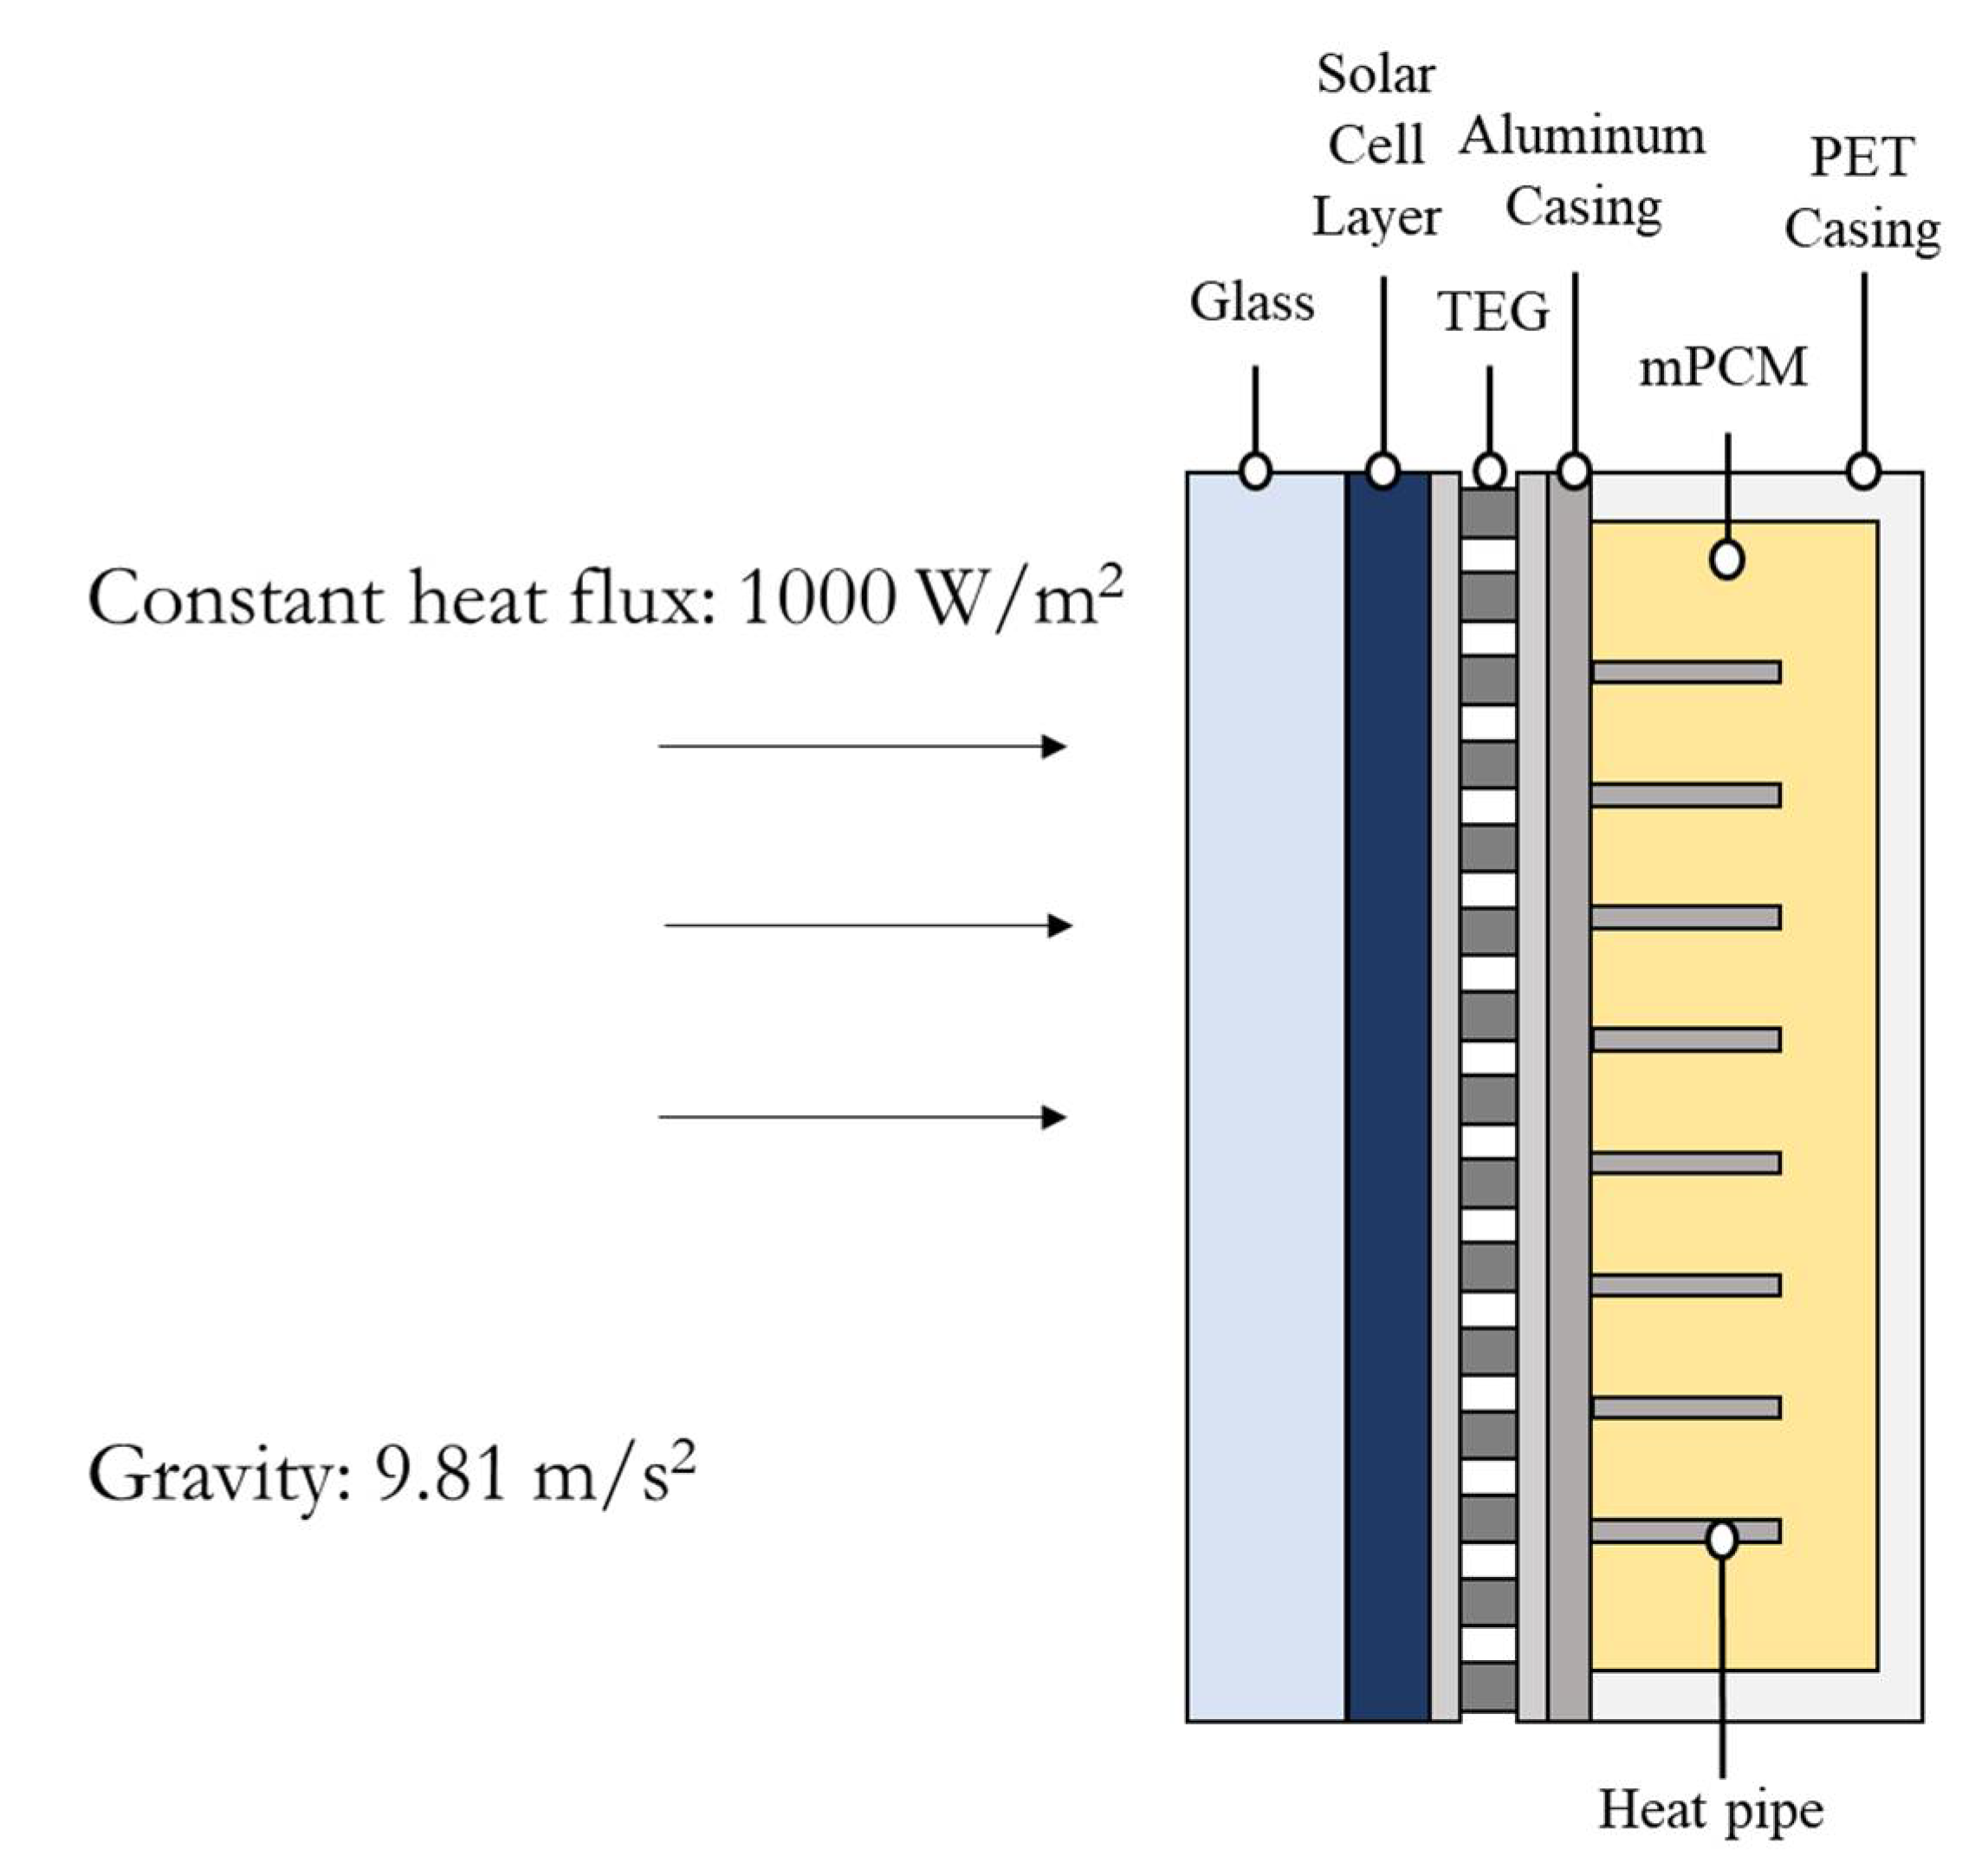
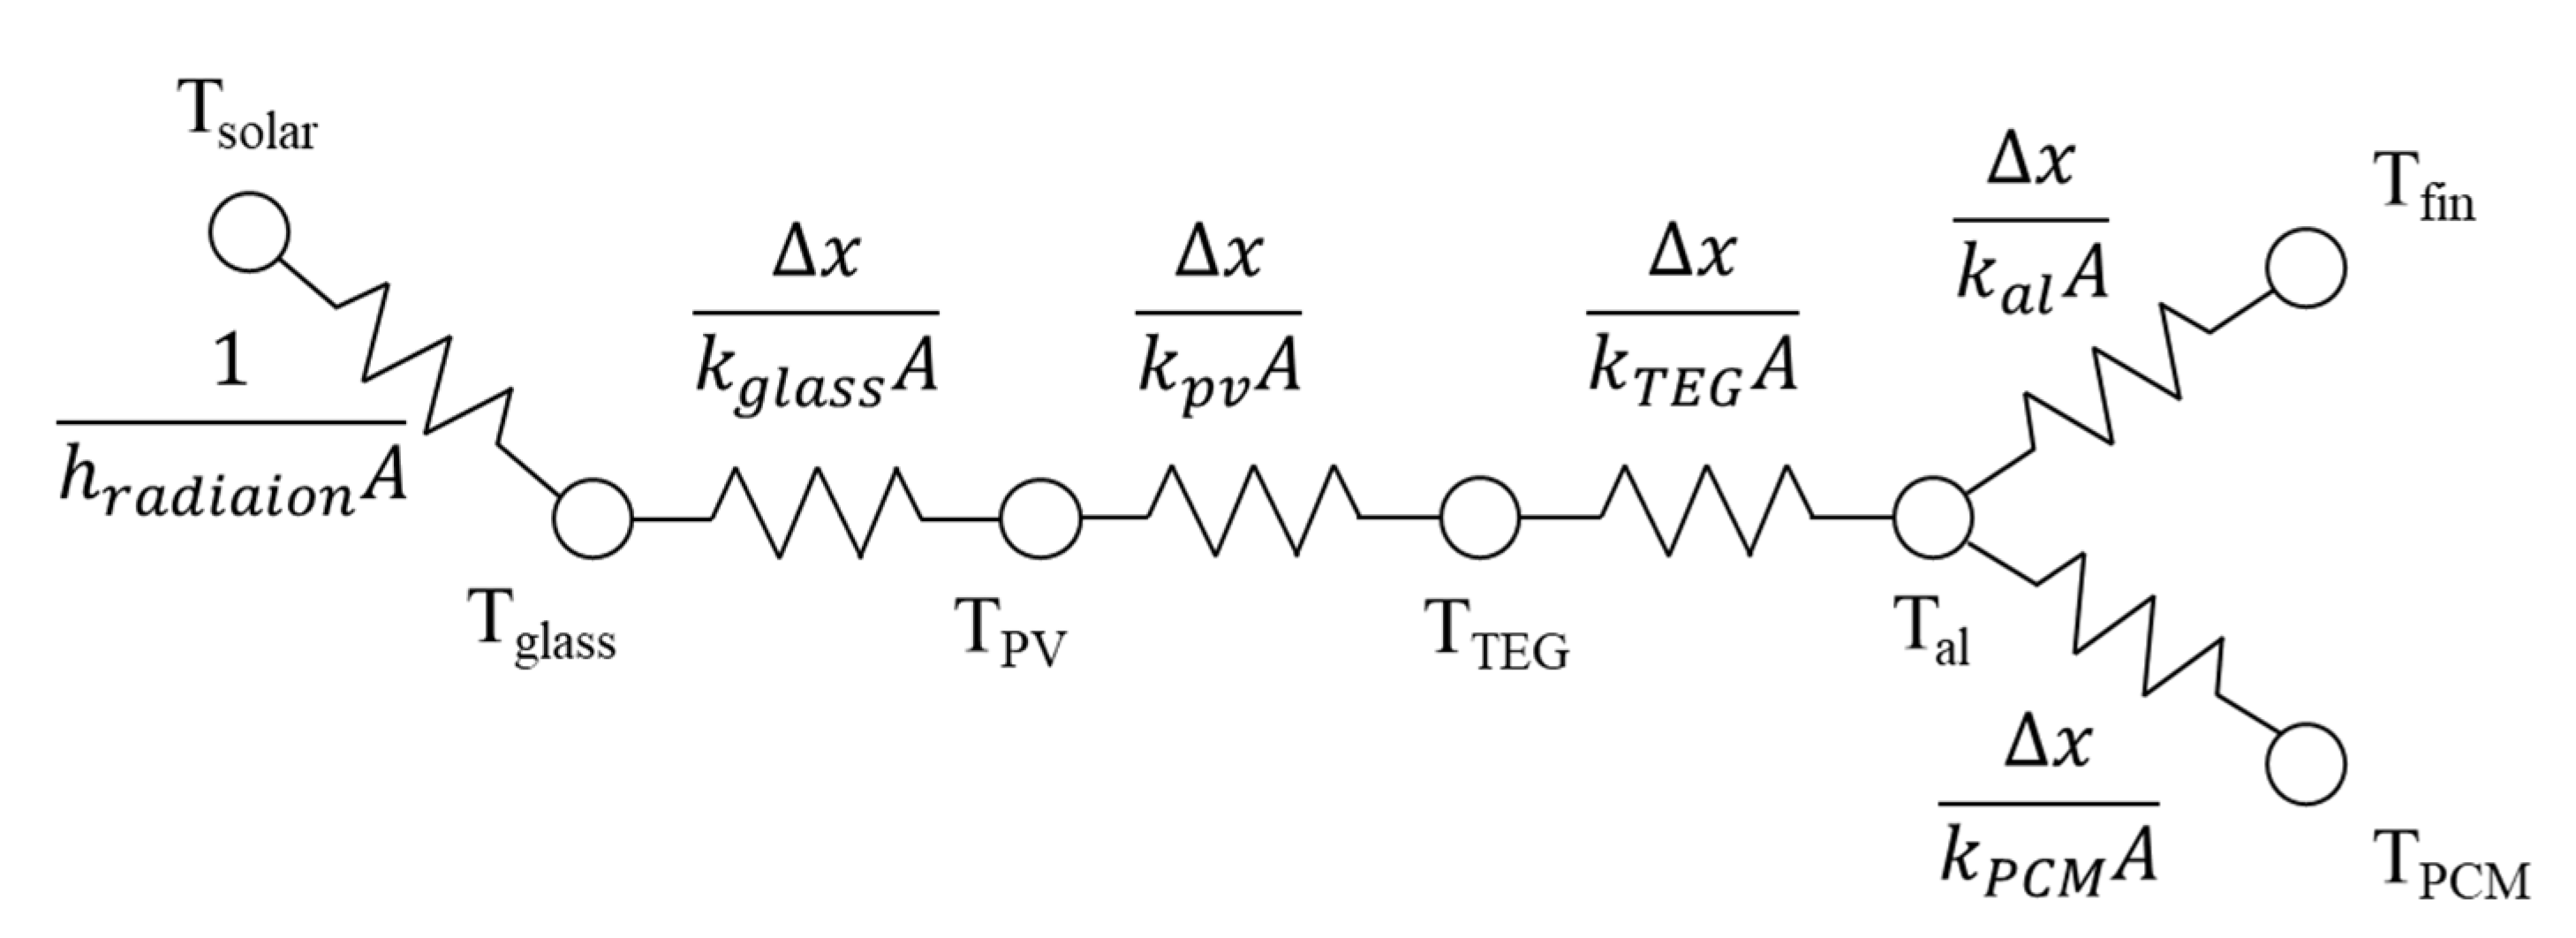
A transient heat transfer analysis was performed through Ansys Fluent with 2D geometry. As is shown in Figure 4, using Ansys meshing, only the hexa-mesh was created, and the total number of nodes was about 54,800. The time step was set to 1 s, and the total simulation time was 4 h (14,400 s). The simulation analysis was performed using the standard test condition (STC) of the PV panel as the initial condition (the initial temperature was 25 °C). Therefore, the boundary conditions for CFD are shown in Figure 5. Except for the glass surface, the rest of the outer surfaces were in an adiabatic condition, and 1000 W/m2 of solar radiation was received through the glass surface (Figure 5). Therefore, in convective terms, turbulence did not occur in the mPCM. Therefore, laminar flow was assumed to reflect the character of the mPCM. The used physical properties of the BIPVT-EG-PCM are shown in Table 1 and Table 2 below [34,35,36]. Figure 6 show the heat transfer process of the CFD under the STC condition.
The energy equations in the Ansys models are shown below in Equations (1)–(5). In Ansys Fluent, the method suggested by Voller and Swaminathan was used to update the liquid fraction Equations (1)–(5).
The enthalpy of the material is computed as the sum of the sensible enthalpy, h, and the latent heat, ΔH.
H = h + Δ H
where
h = h r e f + T r e f T c p d T
where href is reference enthalpy, Tref is reference temperature, and cp is specific heat at constant pressure.
For solidification/melting problems, the energy equation is written as
t ( ρ H ) +   · ( ρ v H ) =   · ( ρ H ) + S
where H is the enthalpy, ρ is the density, v is the fluid velocity, and S is the source term.
The liquid fraction, β, can be defined as
β = 0   i f   T < T s o l i d u s
β = 1   i f   T > T l i q u i d u s
β = T T s o l i d u s T l i q u i d u s T s o l i d u s     i f   T s o l i d u s   < T < T l i q u i d u s
Δ H = β L

4. Results and Discussion

This study selected the melting temperature of the PCM, the heat fin interval for the PCM container, and the TEG arrangement to derive an appropriate BIPV–TEG–PCM design. In addition, this simulation study was conducted as a parametric analysis to produce a design that satisfies the minimum PV surface temperature and maximum TEG temperature difference at the same time.

4.1. Effects of PCM Melting Temperature

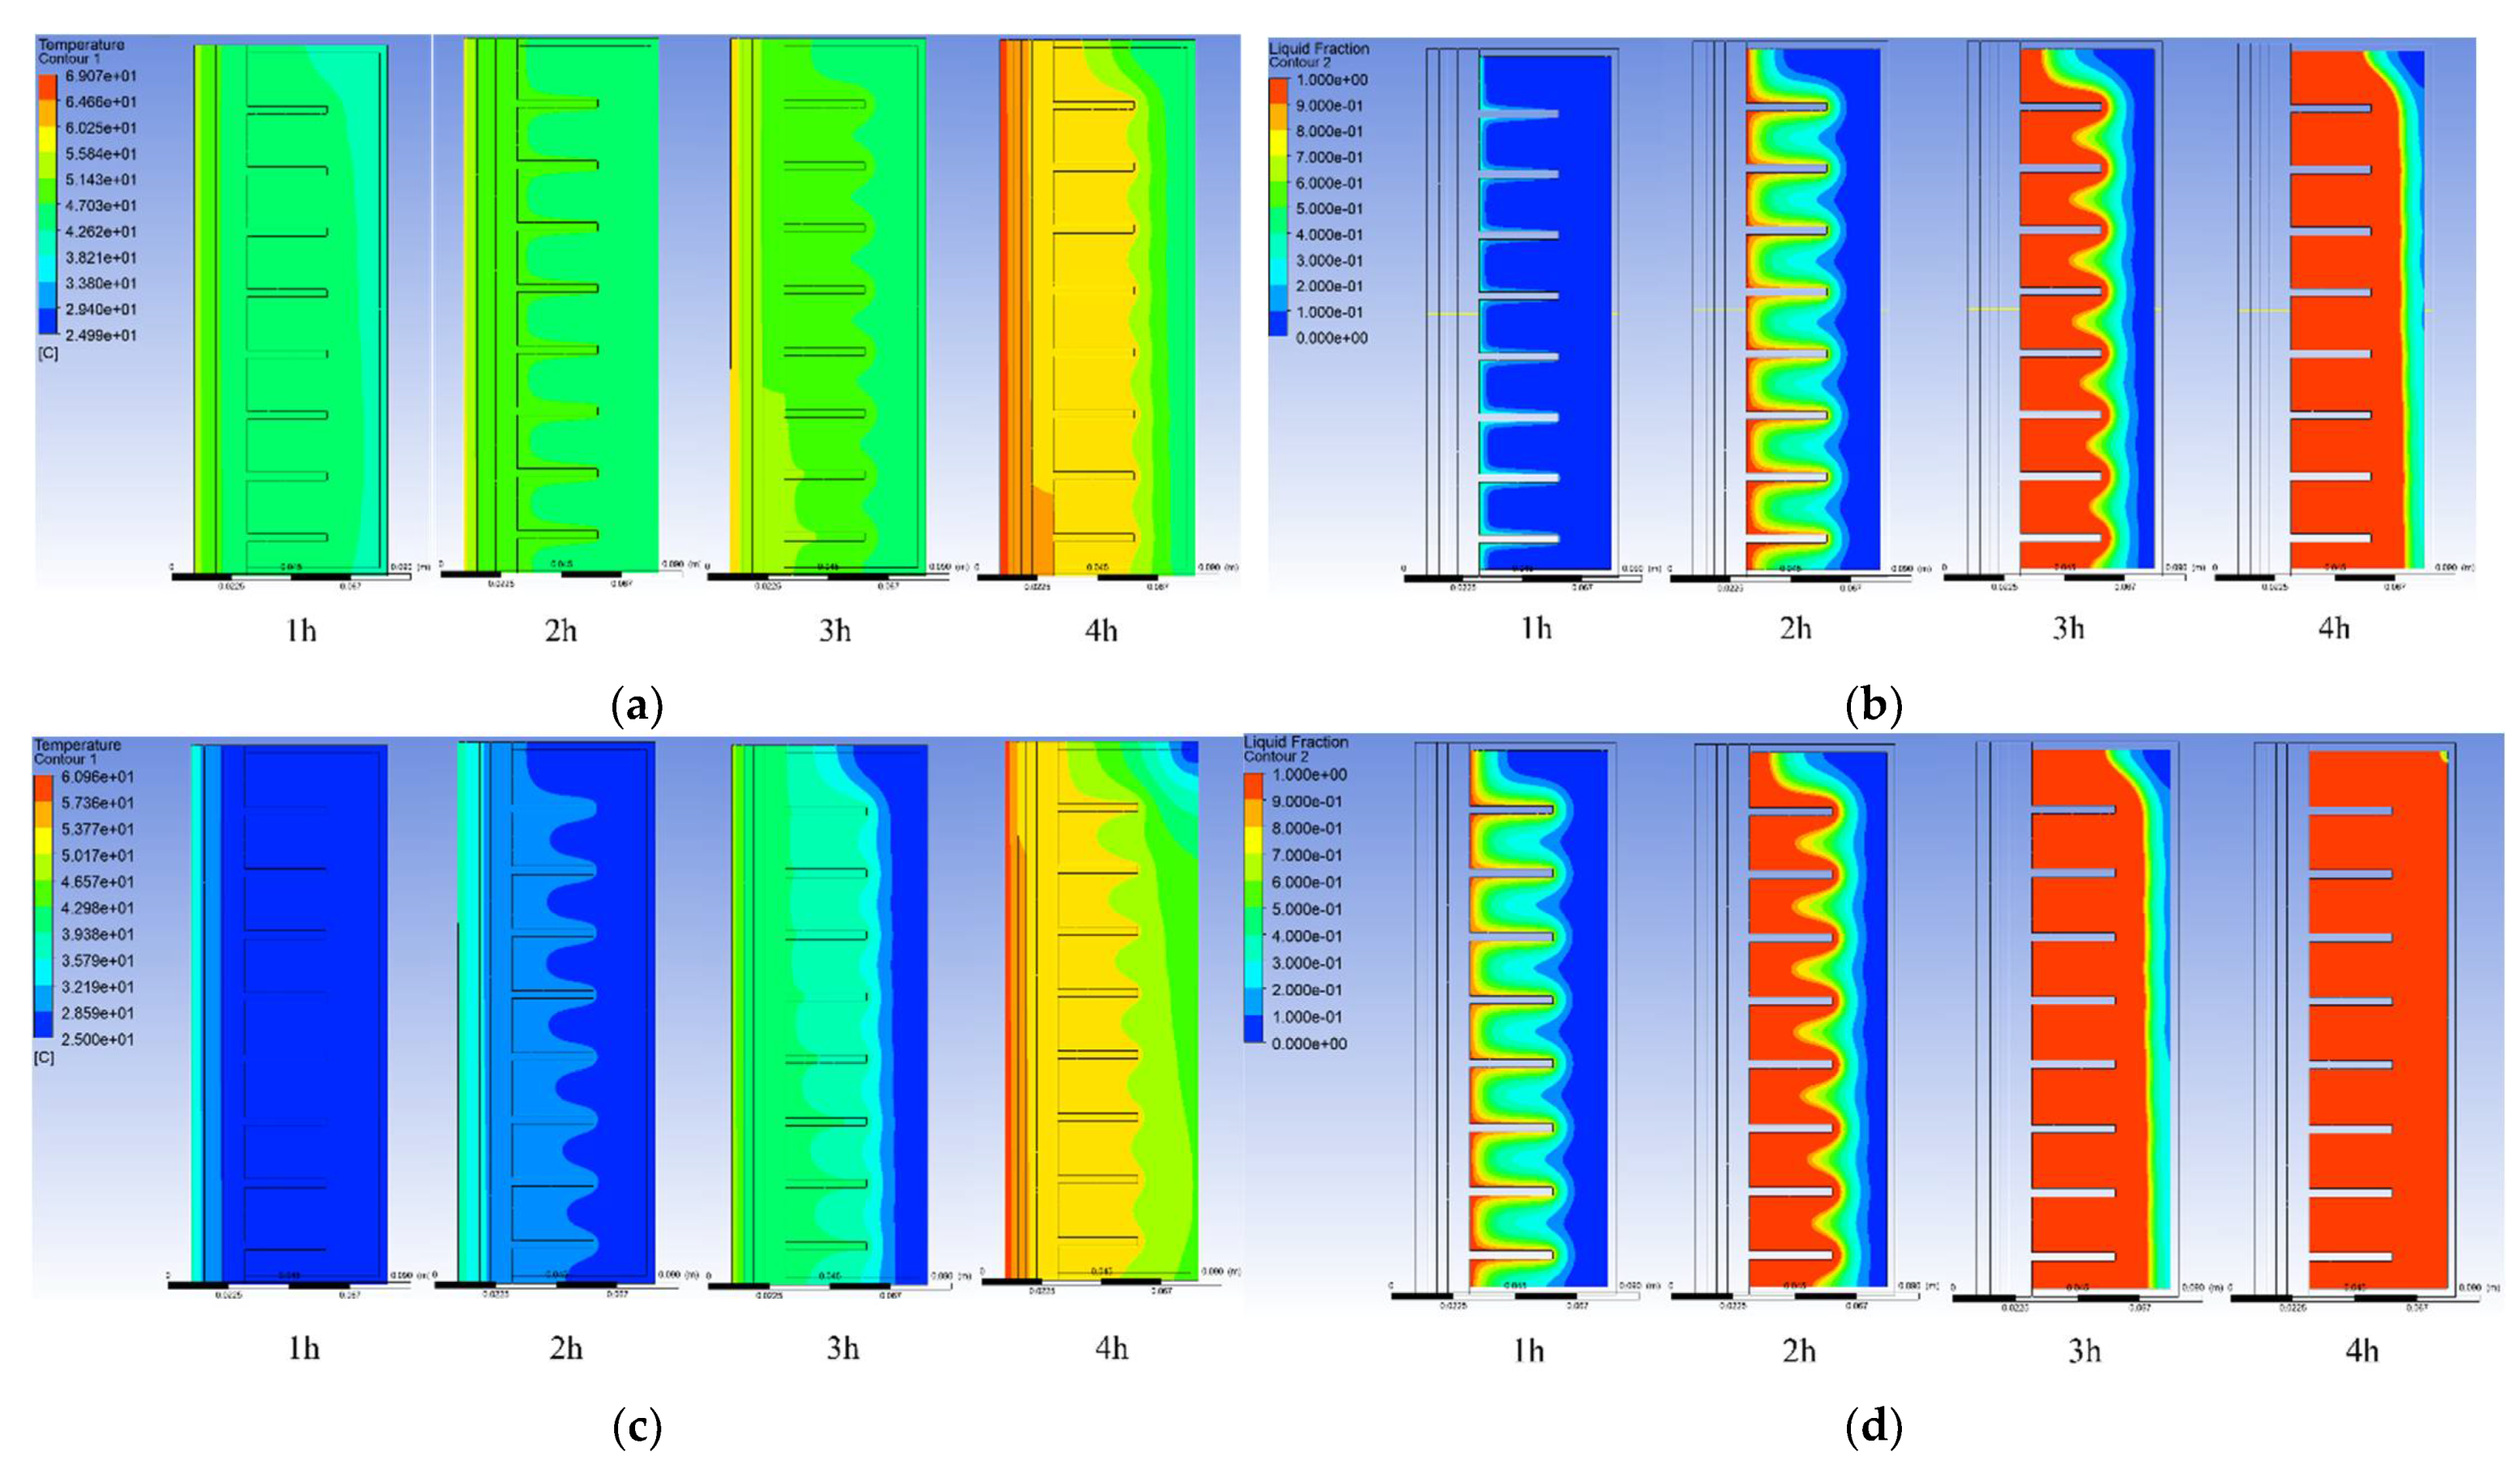
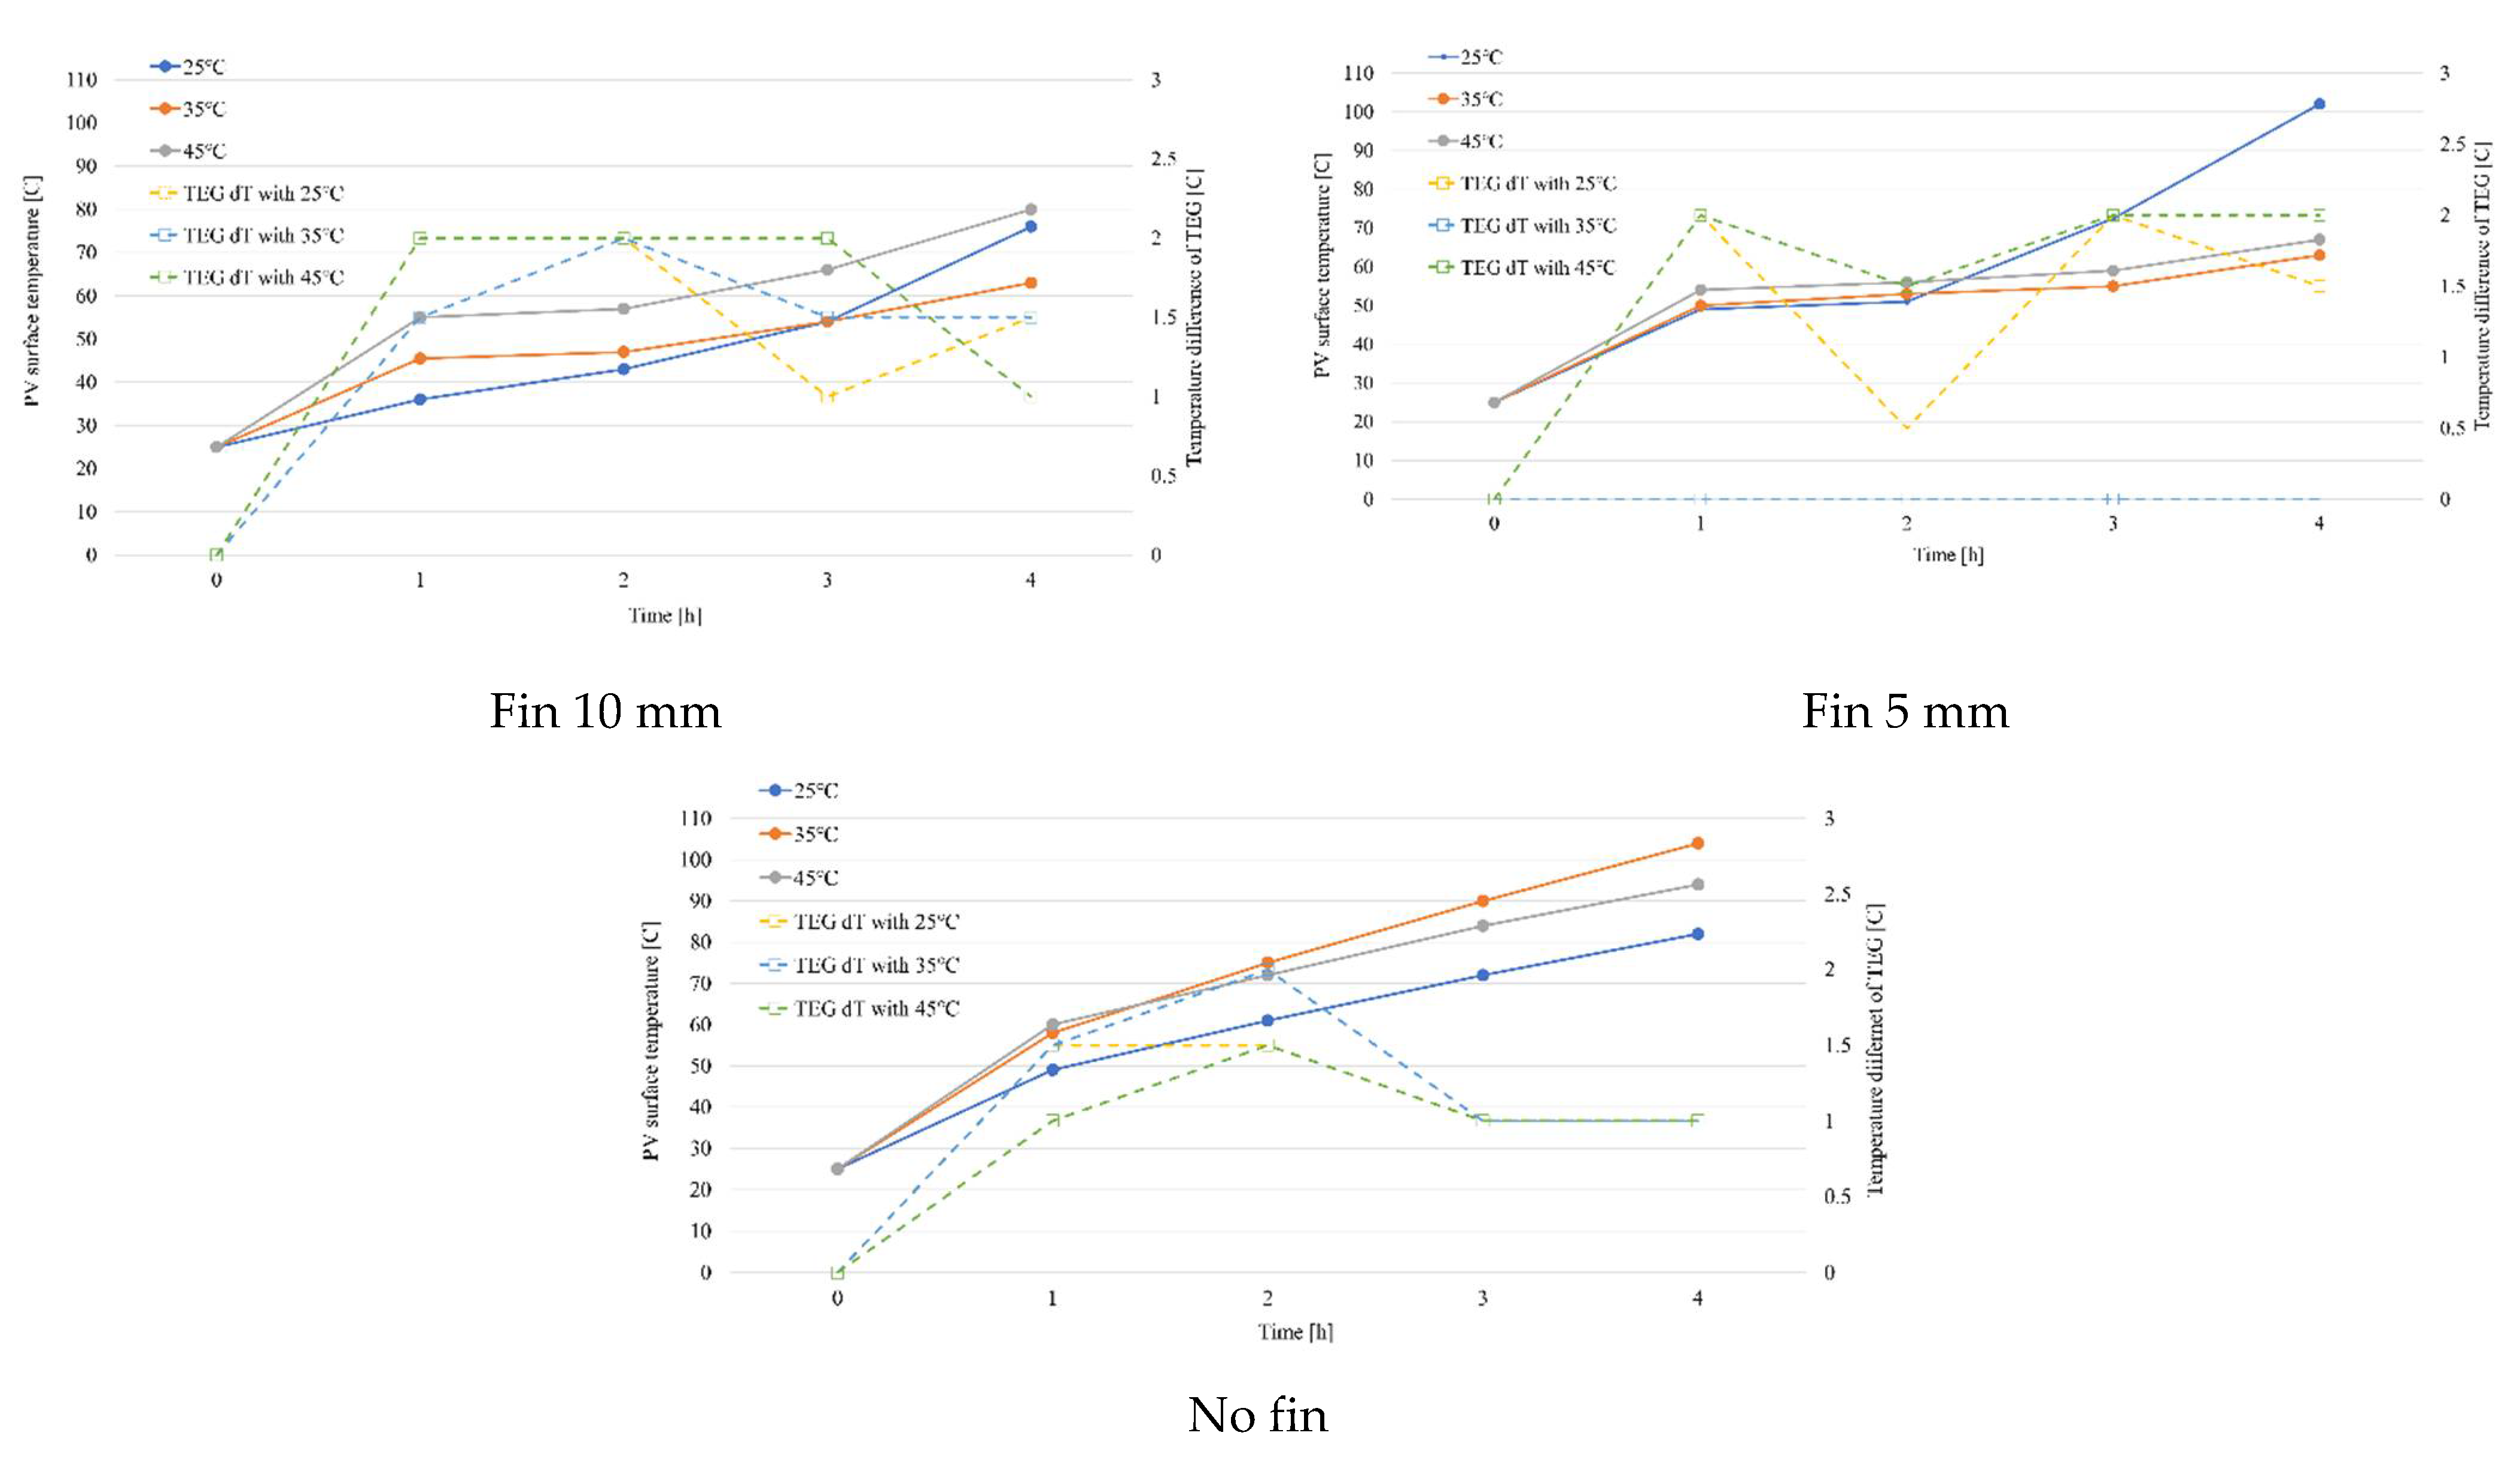
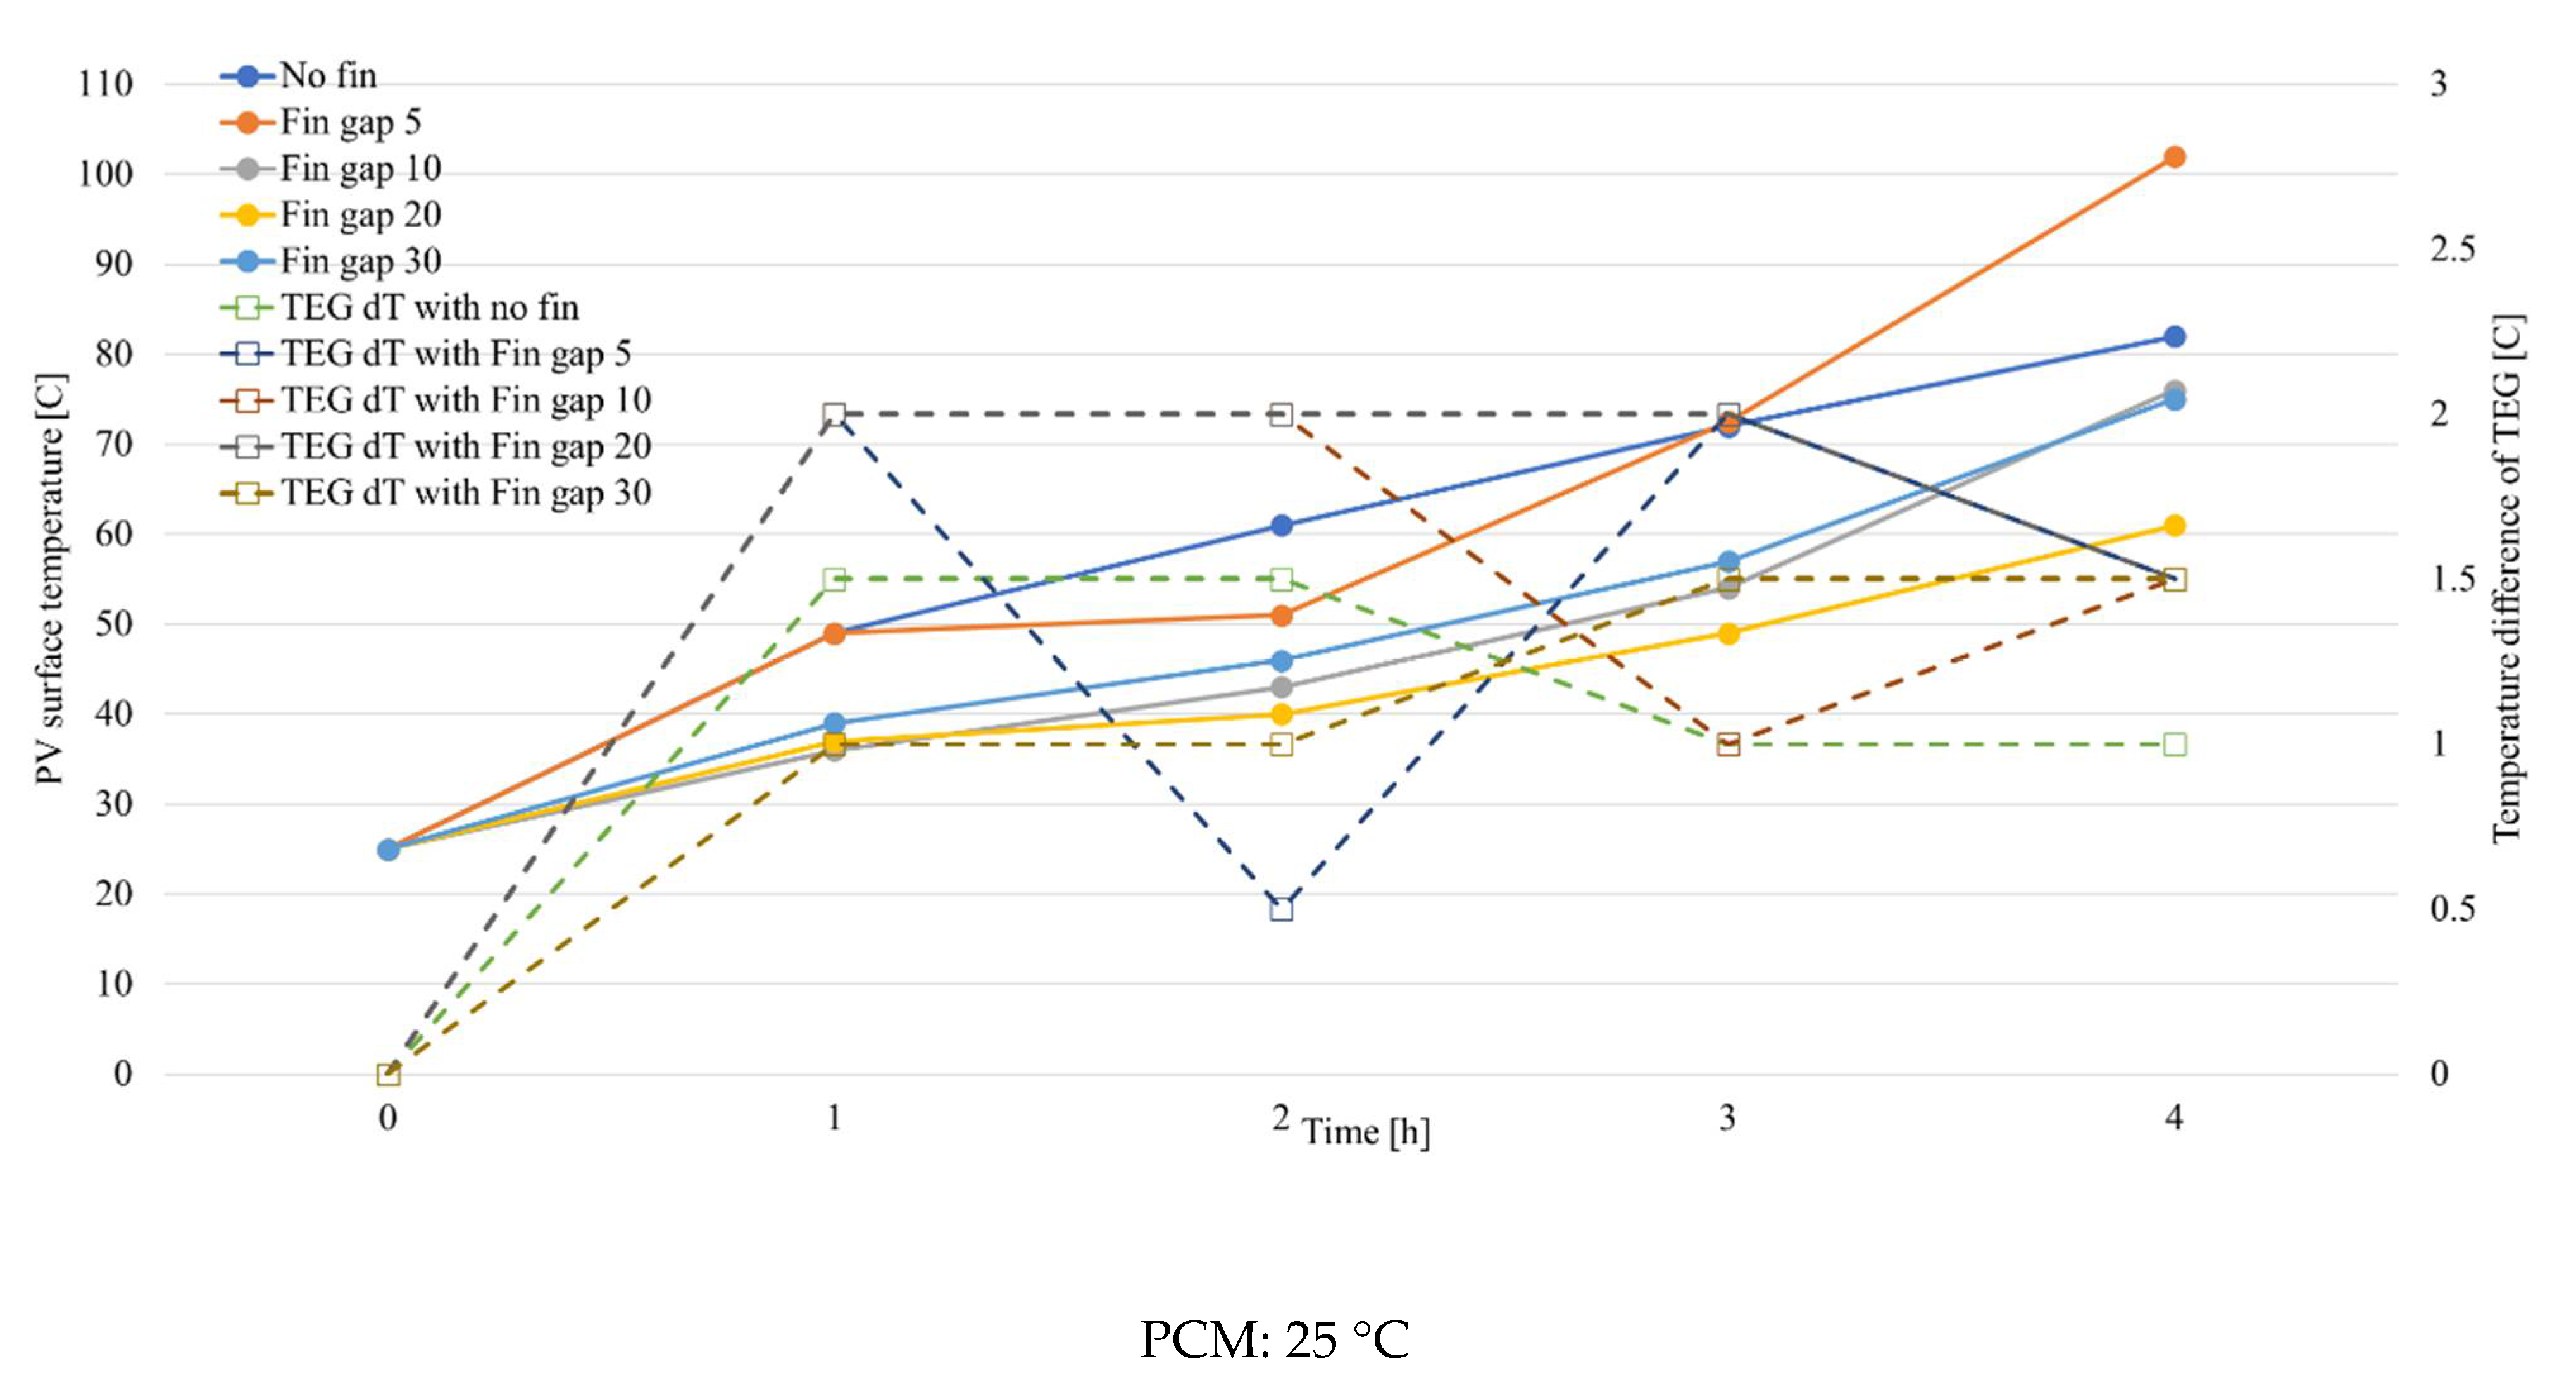
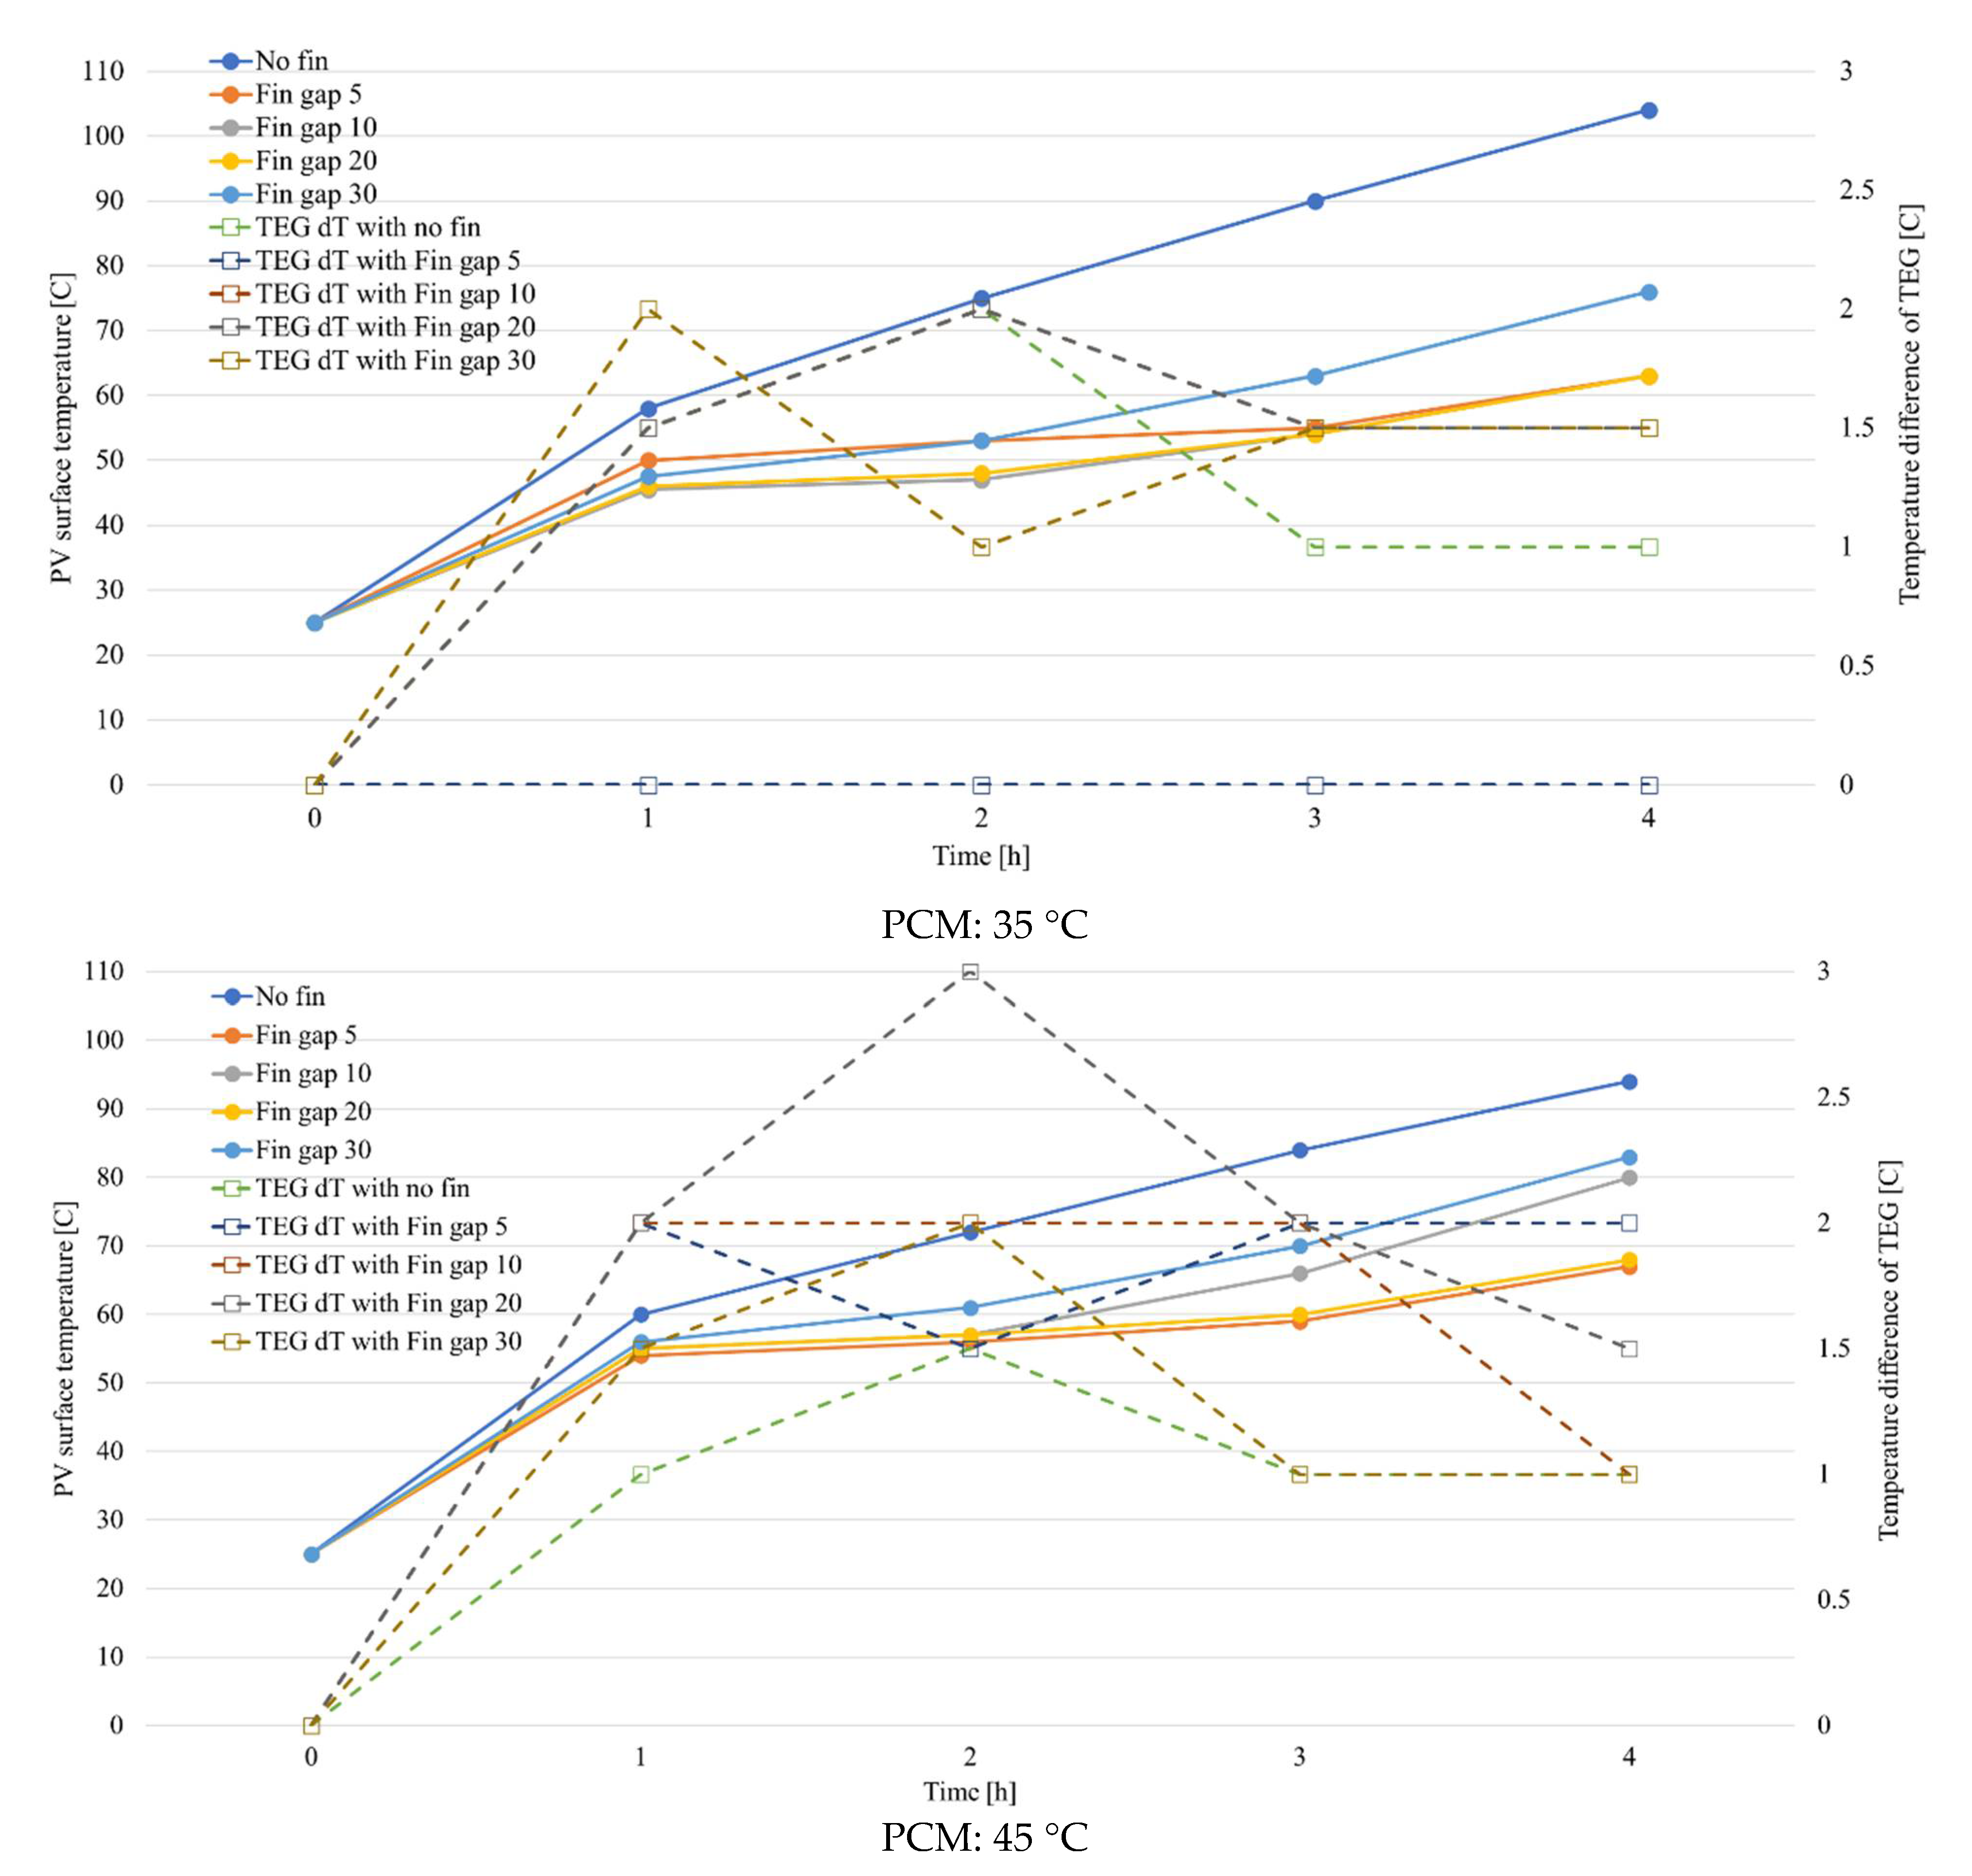
The PCM melting temperature was compared in each heat fin interval to derive the appropriate melting temperature of the PCM. Moreover, Figure 7 contrasts the system temperature distribution and the melting fraction for the high and low melting temperature cases. According to the results of the simulation, the PCM melting temperature of 25 °C showed the best performance for the low PV surface temperature in each case (Figure 8). However, in the cases of close interval heat fin spacing of 5 mm and 10 mm with a PCM melting temperature of 25 °C, it was kept low for the first two hours, and after two hours showed a steeper temperature rise as the phase change progressed. This phenomenon occurs because the amount of PCM and heat transfer rate through the heat fin is not in balance. As the number of fins increases, heat transfer becomes faster. However, as the amount of PCM decreases, the total amount of energy stored is thereby reduced.
On the other hand, the close interval heat fin spacing of 5 mm and 10 mm with melting temperatures of 35 °C and 45 °C showed a lower PV surface temperature after 2 h. The high phase change temperature delayed the forming of the melting region. Therefore, the PV surface temperature rose quickly at the beginning because of the low solid specific heat capacity of the PCM. However, it could be kept lower than the melting temperature of 25 °C at the overall average. The high melting temperature of the PCM showed a similar pattern of increasing gradually at 35 °C and 45 °C. The cases using the 45 °C PCM were maintained at about 1–5 °C higher than the 35 °C PCM. However, there was no pattern of substantial difference.
In the case of the temperature difference of the TEG, there was not much difference in the overall case. The reason is that the TEG is a semiconductor and has a higher thermal conductivity than the PCM, leading to a lower temperature difference. On the contrary, it was found that a larger temperature difference occurred in the case where the PCM was 35 °C and 45 °C due to heat accumulation in the PV panel. However, as the efficiency of the PV panel is still better than that of the TEG, a PCM that can lower the surface temperature of the PV panel is preferred. Finally, it was confirmed that 25 °C is the optimal temperature for the PCM to facilitate the heat dissipation of the PV panel. However, if the efficiency of the TEG were improved, it would be necessary to optimize the appropriate melting temperature of the PCM.

4.2. Effects of Heat Fin Interval

Figure 9 shows the temperature distribution and liquid fraction of the BIVP–TEG–PCM system. Furthermore, the results for the PV surface temperature distribution and temperature difference of the TEG with different heat fin spacings is shown in Figure 10 below. This study analyzed five heat fin spacings: no fin, 5 mm, 10 mm, 20 mm, and 30 mm. The surface temperature of the PV panel and the temperature difference of the TEG in each heat fin spacing case were compared for each PCM melting temperature (i.e., 25 °C, 35 °C, and 45 °C). As a result of the simulation, it was found that the 20 mm heat fin spacing could maintain the lowest panel surface temperature, regardless of the PCM melting temperature. When the fin spacing was dense, heat transfer to the PCM was improved. However, due to the decreased amount of the PCM, the melting area of the PCM was crated faster than in the case of wide fin spacing and a low melting temperature of the PCM. On the contrary, a high melting temperature of the PCM can be secured, which shows better results than when the PCM has a low phase change temperature.
In addition, for the temperature difference of the TEG, the heat fin interval of 20 mm showed the best performance. There were cases with similar temperature differences depending on the phase change temperature of the PCM, but the 20 mm spacing showed an above average temperature difference in most cases. These results have determined the most appropriate thermal conductivity in the heat transfer equilibrium described above.

4.3. Arrangement of Thermoelectric Generator (TEG)

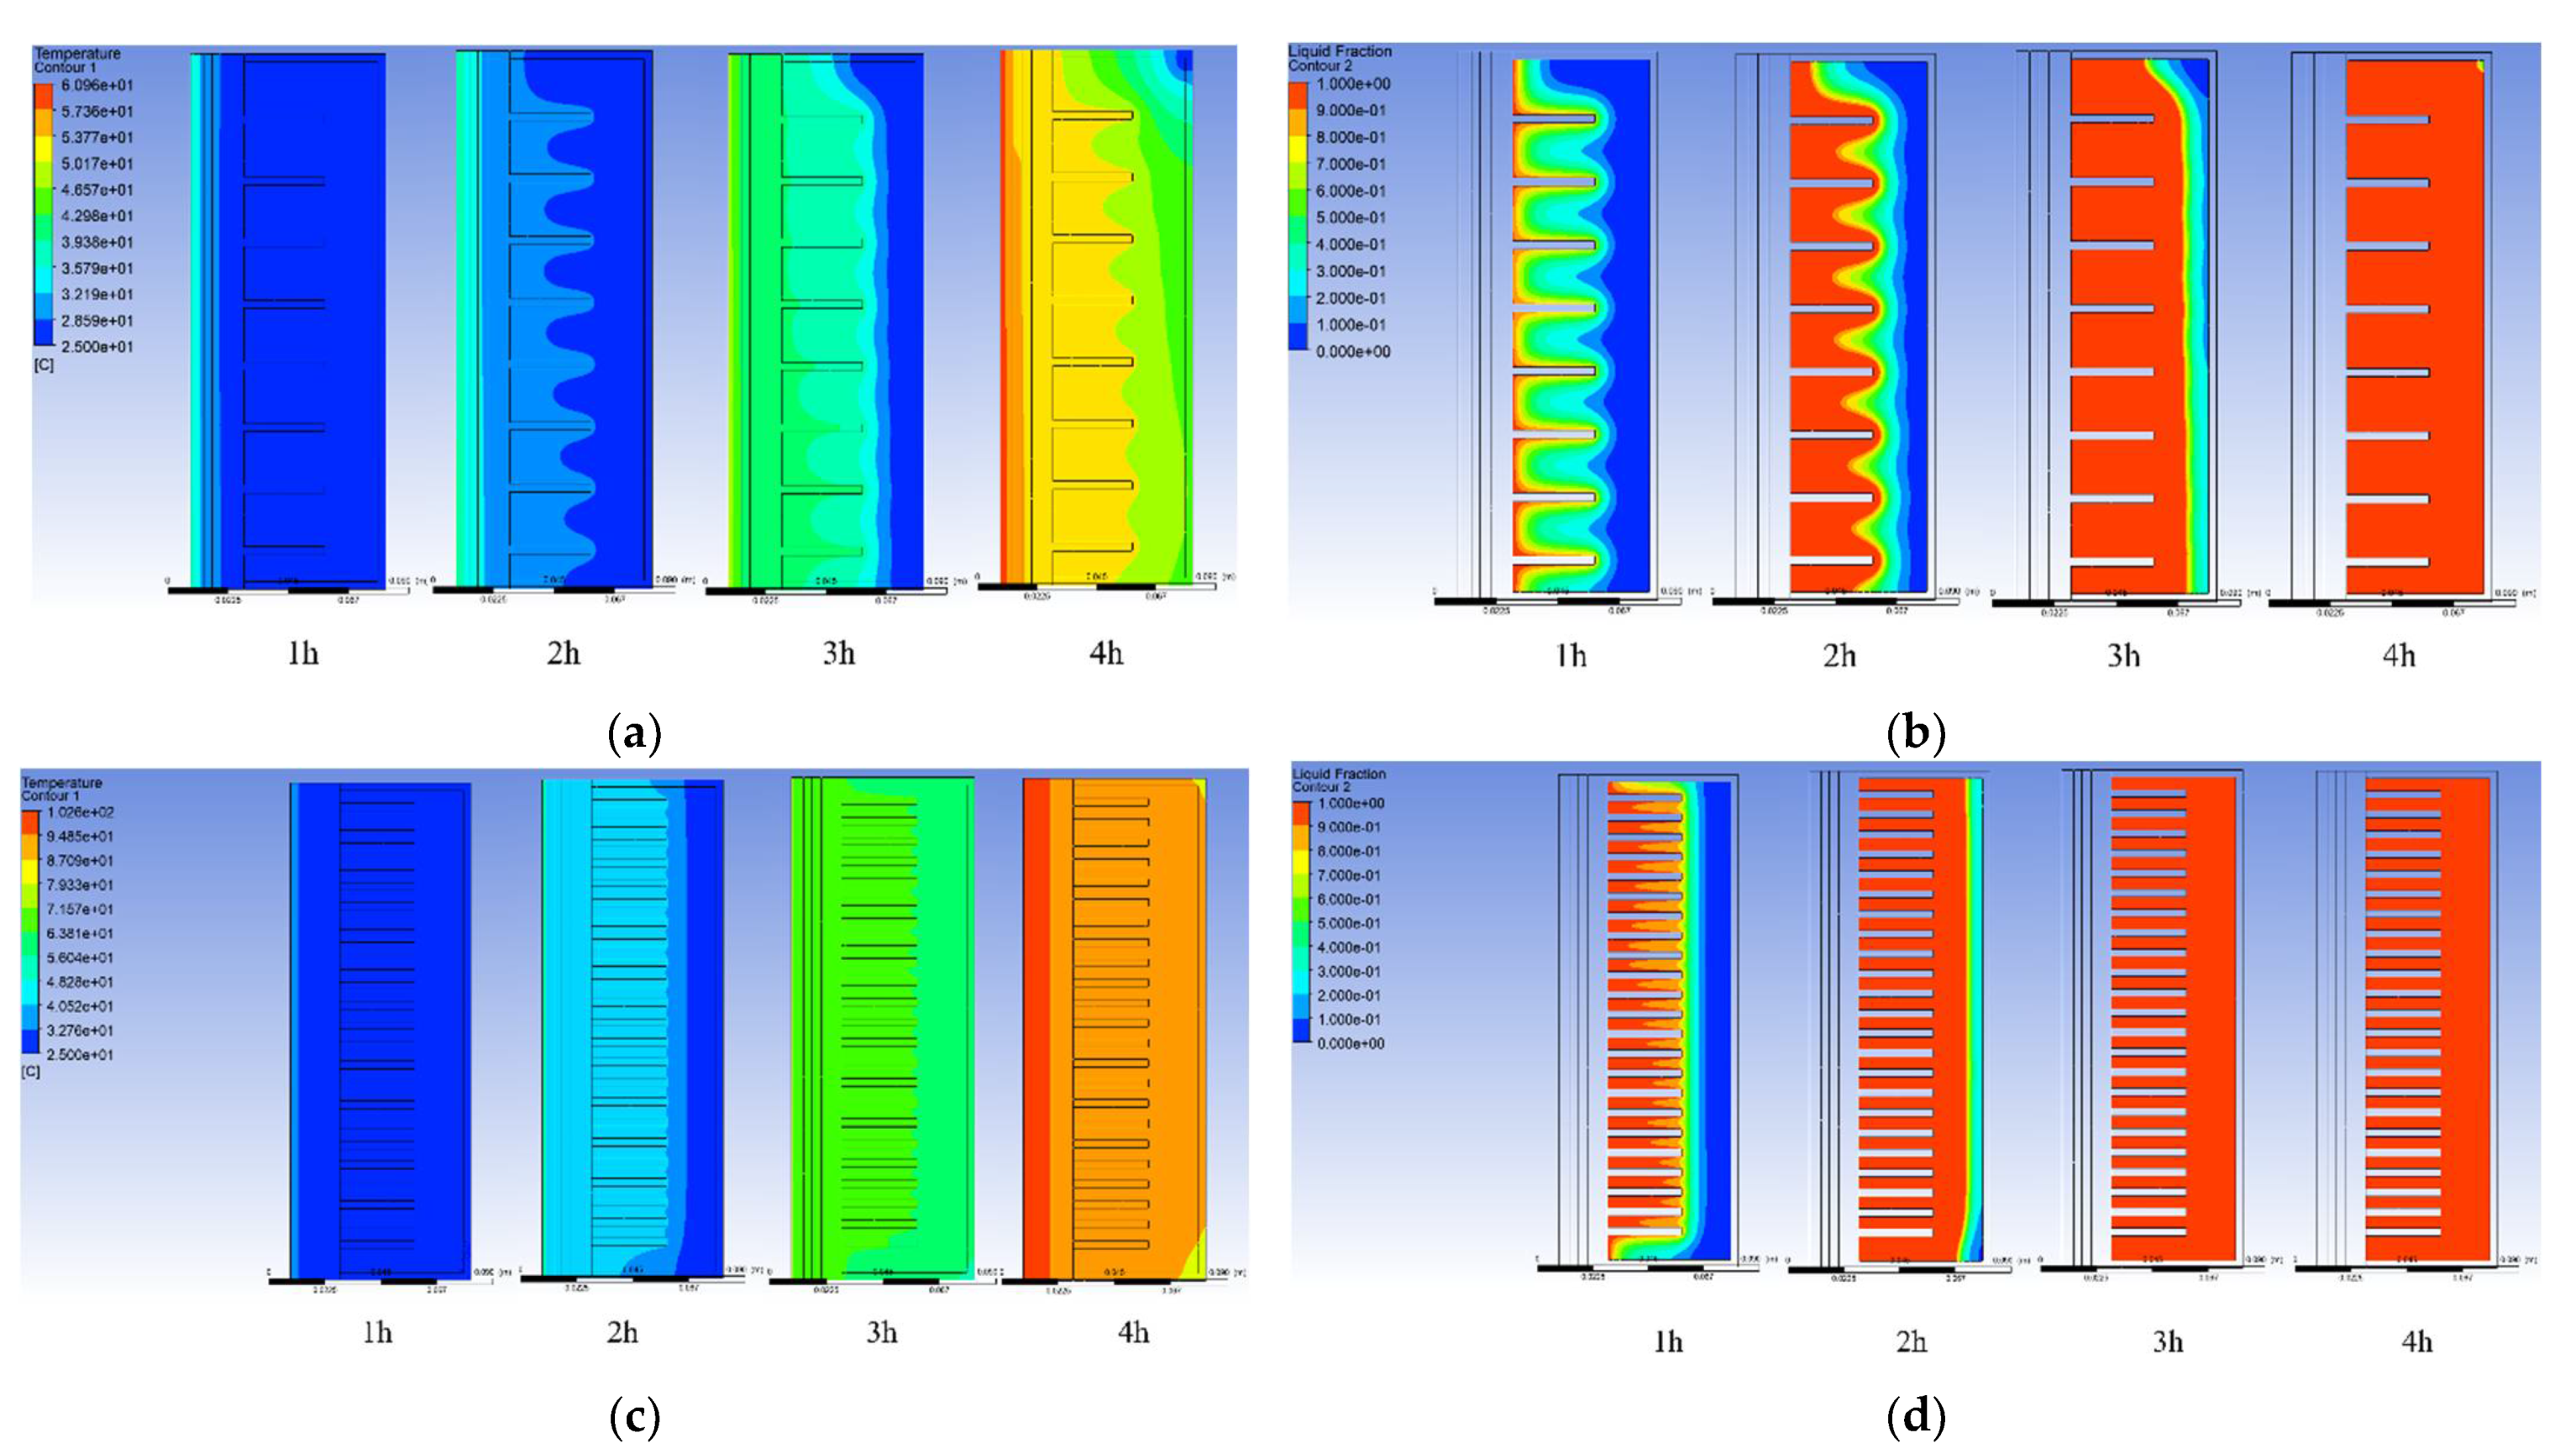
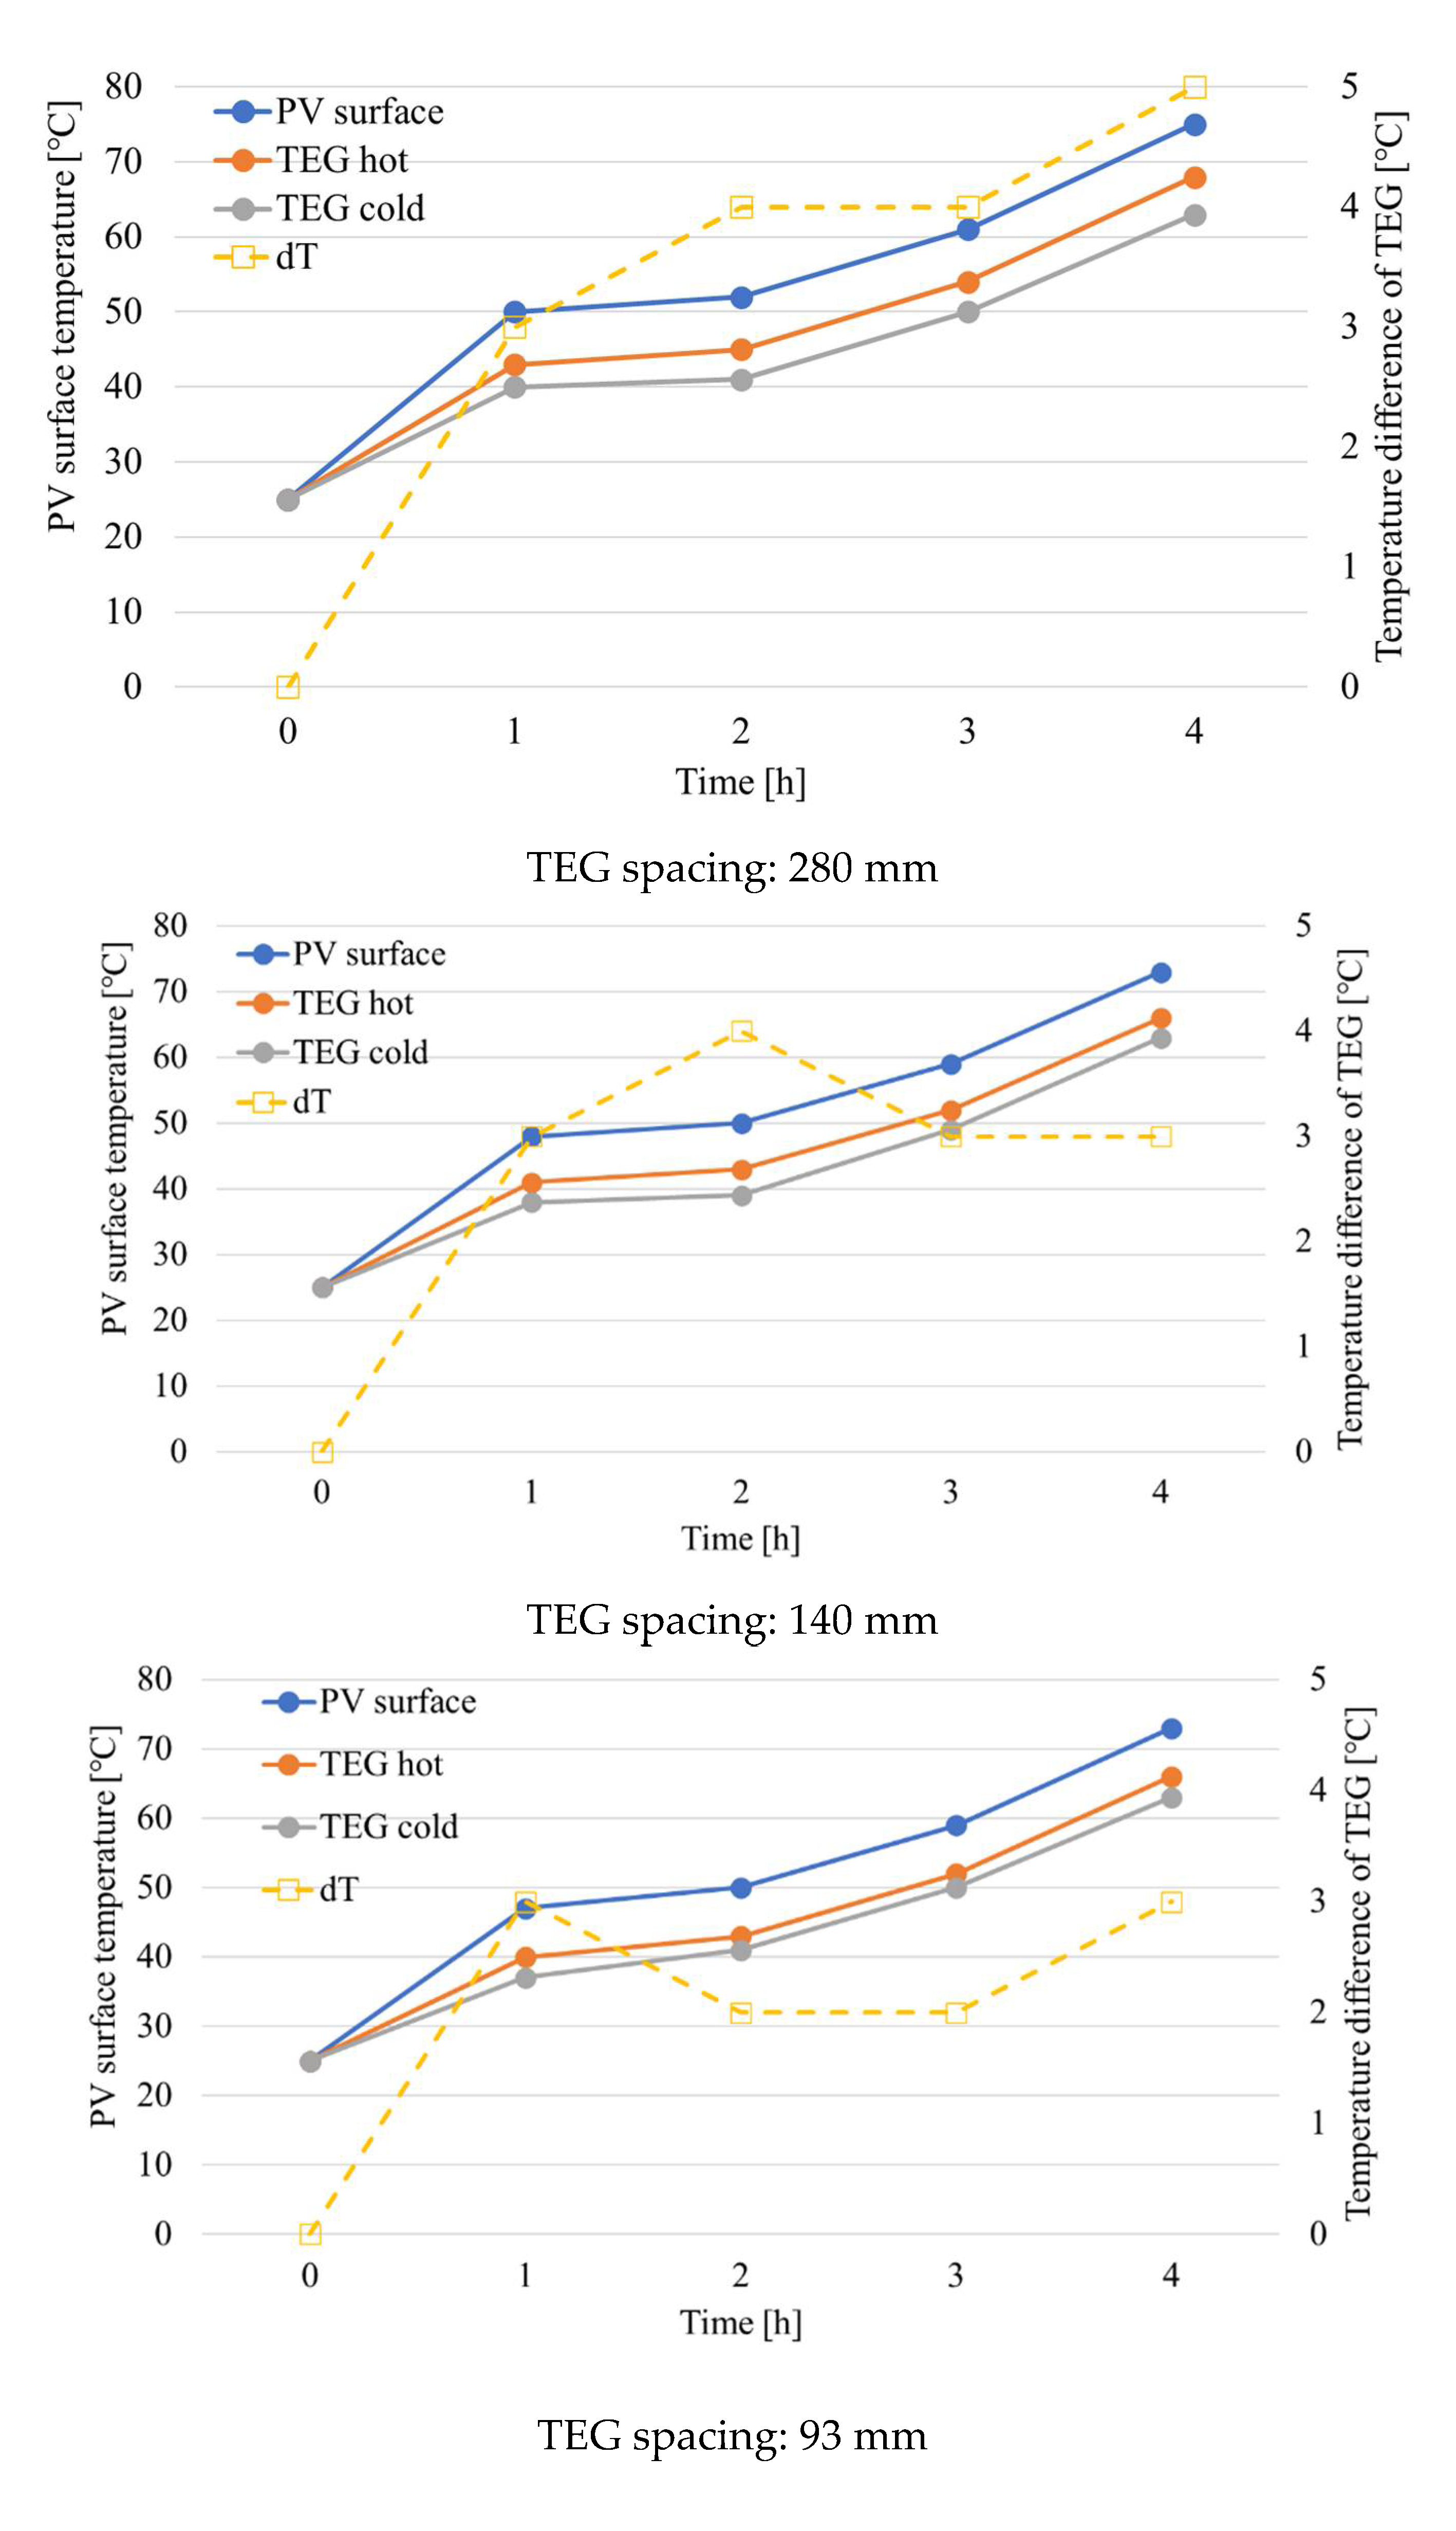
The arrangement of the TEG was selected as the distance of the middle of each TEG. The maximum length of the TEG was referred to in previous studies that showed that the most uniform temperature distribution was achieved when the distance between the middle of the TEG was 280 mm [37]. In addition, the melting temperature of the PCM and the heat fin interval were selected as the middle case of the previous simulation (PCM melting temperature: 35 °C; heat fin interval: 10 mm). By adding the TEGs one by one between the TEGs at both ends based on a 280 mm interval, four TEG intervals were selected for simulation (i.e., 70 mm, 93 mm, 140 mm, and 280 mm). Figure 11 shows the temperature distribution and liquid fraction of the BIVP–TEG–PCM system at 280 mm and 70 mm TEG intervals.
As a result of the TEG spacing simulation (Figure 12), in the case of the solar panel surface temperature, there was a difference of about 0–2 °C depending on the teg spacing, and the highest panel surface temperature appeared at a spacing of 280 mm. In addition, it was confirmed that the maximum temperature difference was up to 5 °C depending on the TEG interval. It was found that the temperature difference between the cold and hot sides of the TEG increased as the TEG interval widened. The TEG interval of 280 mm showed the highest temperature between both sides of TEG. Therefore, a TEG interval of 140 mm was determined to be optimal to create the largest temperature difference of the TEG while lowering the temperature of the PV surface.
As in the previous analysis, it was confirmed that, due to the thermal conductivity of the TEG, the larger the thermoelectric element is, the faster the heat from the PV panel passes and the faster the PCM on the cold side of the TEG is melted. As a result, the temperature difference between the cold and hot sides of the TEG is reduced. However, it was confirmed that limiting the amount of heat transfer through the TEG to a certain extent is a way to increase the efficiency of both the panel and the TEG.
In addition, the panel surface temperature distribution of the remaining cases (except for 280 mm) showed a similar pattern. The largest temperature difference occurred when the TEG was spaced at 140 mm. Therefore, the most appropriate TEG spacing was determined to be 140 mm.
Each parametric study result focused on the solar panel. Therefore, the results focused more on lowering the solar panel’s surface temperature. However, considering usability in the natural environment, if the efficiency of the thermoelectric element is improved, it is judged that there will be an optimal point to obtain the maximum power generation of both the solar panel and the thermoelectric element generator.

5. Conclusions

This study numerically investigated the impact of the heat fin interval, the TEG arrangement, and the phase change temperature on the BIPV–TEG–PCM system through CFD transient simulations. Using the PCM increased the PV efficiency and, at the same time, additional electricity was generated by utilizing the Seebeck effect of the TEG. The simulation was conducted under STC conditions. The results of the simulation show that a low phase change temperature helps inhibit an early temperature rise of the PV panel. However, it has been shown that a high melting temperature of the PCM also maintains similar temperatures for a more extended period if there is a properly designed heat fin interval. Thus, using a suitable PCM melting temperature with the proper heat fin interval can increase the efficiency of the PV panel. Therefore, in conclusion, to keep the surface temperature of the PV panel low and to increase the temperature difference between both ends of the TEG, it was found that a PCM melting temperature of 25 °C and a heat fin interval of 20 mm was most efficient. Additionally, a TEG distance of 140 mm was found to be the most effective. However, since the results in this study were analyzed under STC conditions, a standard test condition for solar panels, it is difficult to see that the results are appropriate for all conditions and climates. Therefore, additional research on the optimal points in each region is needed.
Consequently, the BIPV–TEG–PCM system constitutes a system capable of generating power 24 h a day without additional devices by securing power generation through improved efficiency and the utilization of unused waste heat sources to realize a zero-energy building. We intend in future research to manufacture actual prototypes and verify their performance through field tests.

Author Contributions

Y.-K.K., J.J., M.K., H.-H.L. and J.-W.J. have contributed equally to the work. All authors have read and agreed to the published version of the manuscript.

Funding

This work was supported by the Korea Institute of Energy Technology Evaluation and Planning (KETEP) grant No. 20202020800030.

Institutional Review Board Statement

Not applicable.

Informed Consent Statement

Not applicable.

Data Availability Statement

Not applicable.

Conflicts of Interest

The authors declare no conflict of interest.

References

  1. Ng, E. Designing High-Density Cities for Social & Environmental Sustainability; Routledge: London, UK, 2009. [Google Scholar]
  2. United Nations Environment Programme. 2020 Global Status Report for Buildings and Construction: Towards a Zero-emission, Efficient and Resilient Buildings and Construction Sector. Nairobi. 2020. Available online: https://globalabc.org/sites/default/files/inline-files/2020%20Buildings%20GSR_FULL%20REPORT.pdf (accessed on 2 November 2022).
  3. Koyunbaba, B.K.; Yilmaz, Z.; Ulgen, K. An Approach for Energy Modeling of a Building Integrated Photovoltaic (BIPV) Trombe Wall System. Energy Build. 2013, 67, 680–688. [Google Scholar] [CrossRef]
  4. Darkwa, J.; Calautit, J.; Du, D.; Kokogianakis, G. A Numerical and Experimental Analysis of an Integrated TEG-PCM Power Enhancement System for Photovoltaic Cells. Appl. Energy 2019, 248, 688–701. [Google Scholar] [CrossRef]
  5. Bayrak, F.; Oztop, H.F.; Selimefendigil, F. Experimental Study for the Application of Different Cooling Techniques in Photovoltaic (PV) Panels. Energy Convers. Manag. 2020, 212, 112789. [Google Scholar] [CrossRef]
  6. Kaiser, A.S.; Zamora, B.; Mazón, R.; García, J.R.; Vera, F. Experimental Study of Cooling BIPV Modules by Forced Convection in the Air Channel. Appl. Energy 2014, 135, 88–97. [Google Scholar] [CrossRef]
  7. Kim, J.H.; Park, S.H.; Kang, J.G.; Kim, J.T. Experimental Performance of Heating System with Buildingintegrated PVT (BIPVT) Collector. Energy Procedia 2014, 48, 1374–1384. [Google Scholar] [CrossRef] [Green Version]
  8. Al-najjar, H.M.T.; Mahdi, J.M.; Bokov, D.O.; Ben Khedher, N.; Alshammari, N.K.; Jade, M.; Opulencia, C.; Fagiry, M.A.; Yaïci, W.; Talebizadehsardari, P. Improving the Melting Duration of a PV/PCM System Integrated with Different Metal Foam Configurations for Thermal Energy Management. Nanomaterials 2022, 12, 423. [Google Scholar] [CrossRef] [PubMed]
  9. Akshayveer; Kumar, A.; Singh, A.P.; Singh, O.P. Effect of Novel PCM Encapsulation Designs on Electrical and Thermal Performance of a Hybrid Photovoltaic Solar Panel. Sol. Energy 2020, 205, 320–333. [Google Scholar] [CrossRef]
  10. Duan, J. A Novel Heat Sink for Cooling Concentrator Photovoltaic System Using PCM-Porous System. Appl. Therm. Eng. 2021, 186, 116522. [Google Scholar] [CrossRef]
  11. Khanna, S.; Reddy, K.S.; Mallick, T.K. Optimization of Finned Solar Photovoltaic Phase Change Material (Finned Pv Pcm) System. Int. J. Therm. Sci. 2018, 130, 313–322. [Google Scholar] [CrossRef]
  12. Huang, M.J.; Eames, P.C.; Norton, B.; Hewitt, N.J. Natural Convection in an Internally Finned Phase Change Material Heat Sink for the Thermal Management of Photovoltaics. Sol. Energy Mater. Sol. Cells 2011, 95, 1598–1603. [Google Scholar] [CrossRef]
  13. Hasan, A.; Sarwar, J.; Alnoman, H.; Abdelbaqi, S. Yearly Energy Performance of a Photovoltaic-Phase Change Material (PV-PCM) System in Hot Climate. Sol. Energy 2017, 146, 417–429. [Google Scholar] [CrossRef]
  14. Sharma, S.; Tahir, A.; Reddy, K.S.; Mallick, T.K. Performance Enhancement of a Building-Integrated Concentrating Photovoltaic System Using Phase Change Material. Sol. Energy Mater. Sol. Cells 2016, 149, 29–39. [Google Scholar] [CrossRef] [Green Version]
  15. Stropnik, R.; Stritih, U. Increasing the Efficiency of PV Panel with the Use of PCM. Renew. Energy 2016, 97, 671–679. [Google Scholar] [CrossRef]
  16. Ong, K.S.; Naghavi, M.S.; Lim, C. Thermal and Electrical Performance of a Hybrid Design of a Solar-Thermoelectric System. Energy Convers. Manag. 2017, 133, 31–40. [Google Scholar] [CrossRef]
  17. Yin, E.; Li, Q.; Xuan, Y. Thermal Resistance Analysis and Optimization of Photovoltaic-Thermoelectric Hybrid System. Energy Convers. Manag. 2017, 143, 188–202. [Google Scholar] [CrossRef]
  18. Lin, J.; Liao, T.; Lin, B. Performance Analysis and Load Matching of a Photovoltaic-Thermoelectric Hybrid System. Energy Convers. Manag. 2015, 105, 891–899. [Google Scholar] [CrossRef]
  19. Makki, A. Innovative Heat Pipe-Based Photovoltaic/Thermoelectric (PV/TEG) Generation System. Ph.D. Thesis, University of Nottingham, Nottingham, UK, 2017. [Google Scholar]
  20. Cotfas, D.T.; Cotfas, P.A.; Machidon, O.M.; Ciobanu, D. Investigation of the Photovoltaic Cell/ Thermoelectric Element Hybrid System Performance. IOP Conf. Ser. Mater. Sci. Eng. 2016, 133, 012037. [Google Scholar] [CrossRef] [Green Version]
  21. Yin, E.; Li, Q.; Li, D.; Xuan, Y. Experimental Investigation on Effects of Thermal Resistances on a Photovoltaic-Thermoelectric System Integrated with Phase Change Materials. Energy 2019, 169, 172–185. [Google Scholar] [CrossRef]
  22. Motiei, P.; Yaghoubi, M.; GoshtasbiRad, E. Transient Simulation of a Hybrid Photovoltaic-Thermoelectric System Using a Phase Change Material. Sustain. Energy Technol. Assessments 2019, 34, 200–213. [Google Scholar] [CrossRef]
  23. Naderi, M.; Ziapour, B.M.; Gendeshmin, M.Y. Improvement of Photocells by the Integration of Phase Change Materials and Thermoelectric Generators (PV-PCM-TEG) and Study on the Ability to Generate Electricity around the Clock. J. Energy Storage 2021, 36, 102384. [Google Scholar] [CrossRef]
  24. Ko, J.; Jeong, J.W. Annual Performance Evaluation of Thermoelectric Generator-Assisted Building-Integrated Photovoltaic System with Phase Change Material. Renew. Sustain. Energy Rev. 2021, 145, 111085. [Google Scholar] [CrossRef]
  25. Virgone, J.; Roux, J. Energetic Efficiency of Room Wall Containing PCM Wallboard: A Full-Scale Experimental Investigation. Energy Build. 2008, 40, 148–156. [Google Scholar] [CrossRef]
  26. Ansuini, R.; Larghetti, R.; Giretti, A.; Lemma, M. Radiant Floors Integrated with PCM for Indoor Temperature Control. Energy Build. 2011, 43, 3019–3026. [Google Scholar] [CrossRef]
  27. Osterman, E.; Tyagi, V.V.; Butala, V.; Rahim, N.A.; Stritih, U. Review of PCM Based Cooling Technologies for Buildings. Energy Build. 2012, 49, 37–49. [Google Scholar] [CrossRef]
  28. Karthick, A.; Kalidasa Murugavel, K.; Ghosh, A.; Sudhakar, K.; Ramanan, P. Investigation of a Binary Eutectic Mixture of Phase Change Material for Building Integrated Photovoltaic (BIPV) System. Sol. Energy Mater. Sol. Cells 2020, 207, 110360. [Google Scholar] [CrossRef]
  29. Byon, Y.S.; Jeong, J.W. Phase Change Material-Integrated Thermoelectric Energy Harvesting Block as an Independent Power Source for Sensors in Buildings. Renew. Sustain. Energy Rev. 2020, 128, 109921. [Google Scholar] [CrossRef]
  30. Huang, X.; Zhu, C.; Lin, Y.; Fang, G. Thermal Properties and Applications of Microencapsulated PCM for Thermal Energy Storage: A Review. Appl. Therm. Eng. 2019, 147, 841–855. [Google Scholar] [CrossRef]
  31. Chai, L.; Wang, X.; Wu, D. Development of Bifunctional Microencapsulated Phase Change Materials with Crystalline Titanium Dioxide Shell for Latent-Heat Storage and Photocatalytic Effectiveness. Appl. Energy 2015, 138, 661–674. [Google Scholar] [CrossRef]
  32. Diarce, G.; Campos-Celador, Á.; Martin, K.; Urresti, A.; García-Romero, A.; Sala, J.M. A Comparative Study of the CFD Modeling of a Ventilated Active Façade Including Phase Change Materials. Appl. Energy 2014, 126, 307–317. [Google Scholar] [CrossRef]
  33. Darzi, A.A.R.; Moosania, S.M.; Tan, F.L.; Farhadi, M. Numerical Investigation of Free-Cooling System Using Plate Type PCM Storage. Int. Commun. Heat Mass Transf. 2013, 48, 155–163. [Google Scholar] [CrossRef]
  34. Liu, X.D.; Park, Y.H. Structure and Transport Properties of (Bi1-XSbx)2Te3 Thermoelectric Materials Prepared by Mechanical Alloying and Pulse Discharge Sintering. Mater. Trans. 2002, 43, 681–687. [Google Scholar] [CrossRef] [Green Version]
  35. Niu, X.; Yu, J.; Wang, S. Experimental Study on Low-Temperature Waste Heat Thermoelectric Generator. J. Power Sources 2009, 188, 621–626. [Google Scholar] [CrossRef]
  36. Kazemian, A.; Salari, A.; Ma, T. A Year-Round Study of a Photovoltaic Thermal System Integrated with Phase Change Material in Shanghai Using Transient Model. Energy Convers. Manag. 2020, 210, 112657. [Google Scholar] [CrossRef]
  37. Lim, H.; Kang, Y.K.; Jeong, J.W. Thermoelectric Radiant Cooling Panel Design: Numerical Simulation and Experimental Validation. Appl. Therm. Eng. 2018, 144, 248–261. [Google Scholar] [CrossRef]
Figure 1. Cooling methods for PV panels.
Sustainability 14 15559 g001
Figure 2. BIPV–TEG–PCM design.
Sustainability 14 15559 g002
Figure 3. (a) BIPV–TEG–PCM operation during the day and (b) BIPV–TEG–PCM operation during the night.
Sustainability 14 15559 g003
Figure 4. Shape and mesh generation for CFD.
Sustainability 14 15559 g004
Figure 5. Geometry and boundary conditions for CFD.
Sustainability 14 15559 g005
Figure 6. Heat transfer process of numerical method.
Sustainability 14 15559 g006
Figure 7. Temperature and liquid fraction contours with different heat fin intervals for mPCM temperatures of 25 °C and 45 °C. (a) Temperature distribution of the mPCM at 45 °C with 20 mm interval. (b) Liquid fraction of the mPCM at 45 °C with 20 mm fin interval. (c) Temperature distribution of the mPCM at 25 °C with 20 mm fin interval. (d) Liquid fraction of the mPCM at 25 °C with 20 mm fin interval.
Sustainability 14 15559 g007
Figure 8. PV surface temperature and temperature difference of TEG distribution with different mPCM melting temperatures.
Sustainability 14 15559 g008aSustainability 14 15559 g008b
Figure 9. PCM liquid fraction change with different heat fin intervals. (a) Temperature distribution of the mPCM at 45 °C with 20 mm fin interval. (b) Liquid fraction of the mPCM at 45 °C with 20 mm fin interval. (c) Temperature distribution of the mPCM at 25 °C with 20 mm fin interval. (d) Liquid fraction of the mPCM at 25 °C with 20 mm fin interval.
Sustainability 14 15559 g009
Figure 10. PV surface temperature and temperature difference of the TEG distribution with different heat fin intervals.
Sustainability 14 15559 g010aSustainability 14 15559 g010b
Figure 11. PCM liquid fraction change with different TEG intervals. (a) Temperature distribution of the mPCM 35 °C, fin 10 mm with 70 mm TEG interval. (b) Liquid fraction of the mPCM at 35 °C, fin 10 mm with 70 mm TEG interval. (c) Temperature distribution of the 35 °C, fin 10 mm with 280 mm TEG interval. (d) Liquid fraction of the mPCM at 35 °C, fin 10 mm with 280 mm TEG interval.
Sustainability 14 15559 g011
Figure 12. PV surface temperature and temperature difference of TEG distribution with different TEG intervals.
Sustainability 14 15559 g012aSustainability 14 15559 g012b
Table 1. Properties of the mPCM.
DescriptionValue
Phase change temperature [°C]25, 35, 45
Latent heat capacity [J/kg]192,660
Specific heat capacity [J/kg]1970
Density   [ kg / m 3 ]946.4
Thermal conductivity [W/mK]0.749
Particle size [μm]10
Table 2. Properties of the BIPV–TEG–PCM.
MaterialDensity [kg/m3]Specific Heat [J/kgK]Thermal Conductivity [W/mK]Thickness [mm]
Glass22008300.765
PV22307001483
Aluminum2719871202.48
PET150012000.23
TEG76701981.614
Heat fin2719871202.43
Publisher’s Note: MDPI stays neutral with regard to jurisdictional claims in published maps and institutional affiliations.