Article

Biodegradation of Cyanide by a New Isolated Aerococcus viridans and Optimization of Degradation Conditions by Response Surface Methodology

College of Life and Health Sciences, Northeastern University, Shenyang 110169, China
*
Author to whom correspondence should be addressed.
Sustainability 2022, 14(23), 15560; https://doi.org/10.3390/su142315560
Submission received: 16 September 2022 / Revised: 9 November 2022 / Accepted: 18 November 2022 / Published: 23 November 2022

Abstract

:
Microbial treatment of cyanide pollution is an effective, economical, and environmentally friendly method compared with physical or chemical approaches. A cyanide-degrading bacterium was isolated from electroplating sludge and identified as Aerococcus viridans (termed A. viridans T1) through an analysis of the biochemical reaction and 16 S rDNA gene sequence. A. viridans T1 showed a maximum resistance to 550 mg L−1 CN. The effect of pH and temperature on cyanide degradation and bacterial growth was evaluated. The highest cyanide removal efficiency and bacterial growth occurred at pH 8 and pH7, respectively. The optimum temperature for cyanide degradation and bacterial growth was 34 °C. In addition, the carbon source and nitrogen source for cyanide degradation were optimized. The optimal carbon source and nitrogen source were glycerol and peptone, respectively. The cyanide degradation experiment indicated that A. viridans T1 was able to remove 84.1% of free cyanide at an initial concentration of 200 mg L−1 CN within 72 h and 86.7% of free cyanide at an initial concentration of 150 mg L−1 CN within 56 h. To improve the cyanide-degrading efficiency of A. viridans T1, eight process variables were further optimized using a response surface methodology. Three significant variables (soybean meal, corn flour, and L-cysteine) were identified using a Plackett–Burman design, and the variable levels were optimized using a central composite design. The optimal values of soybean meal, corn flour, and L-cysteine were 1.11%, 1.5%, and 1.2%, respectively. Under these optimal conditions, the confirmatory experiments showed that the actual degradation rate was 97.3%, which was similar to the predicted degradation rate of 98.87%. Its strong resistance to cyanide and cyanide-degrading activity may allow A. viridans T1 to be a candidate for the bioremediation of cyanide-contaminated environments.

1. Introduction

Cyanide is a highly toxic chemical that is widely used in many industrial processes, including gold and silver extraction, the jewelry industries, electroplating, and plastic production. Discharged cyanide from these industries may cause serious environmental pollution. In addition, some kinds of bacteria, fungi, plants, and animals synthesize cyanide for their self-defense [1]. Cyanide exists in the natural environment in three forms; namely, free cyanide, weak acid-dissociable cyanide, and strong acid-dissociable cyanide. HCN and CN are extremely toxic to almost all living organisms [2]. Therefore, cyanide in drinking water—in particular, class I, II, III, IV, and V surface water—has been limited to no more than 0.05, 0.005, 0.05, 0.2, 0.2, and 0.2 mg L−1 in China.
Cyanide pollution seriously threatens human health, the environment, and the sustainable development of human society. Therefore, wastes or wastewater containing cyanide must be treated to remove it. Various chemical or physical methods, such as oxidation, adsorption, electrolysis, electrocoagulation (EC), electrochemical oxidation, and photoelectrochemical degradation, are applied to eliminate cyanide from contaminated environments or industrial cyanide-containing wastes [3]. However, these methods are often expensive and generate harmful by-products, causing secondary environmental pollution. In contrast, microbial degradation of cyanide is economical, effective, and environmentally friendly [4]. Cyanide-degrading microorganisms (CDMs) can completely degrade cyanide into less or non-toxic products, such as formic acid, ammonia, formamide, carbon dioxide, and methane, through four types of enzymatic reactions; namely, hydrolysis, oxidation, reduction, and substitution/transfer. The hydrolytic reactions are catalyzed by cyanidase or cyanide hydratase, cyanidase degrades cyanide into formic acid and ammonia, and cyanide hydratase processes cyanide into formamide [5]. Cyanide monoxygenase catalyzes oxidative reactions to produce cyanate, which is then transformed into ammonia and carbon dioxide by cyanase. Cyanide dioxygenase directly catalyzes cyanide to carbon dioxide and ammonia [5]. Cyanide can also be degraded into ammonia and methane by nitrogenase in a reductive pathway [1]. Cyanoalanine synthase and cyanide sulfurtransferase catalyze cyanide assimilation in substitution/transfer reactions [6]. In addition, cyanide degradation by Pseudomonas pseudoalcaligenes CECT5344 involves quinone oxidoreductase and an associated cyanide-insensitive electron transfer chain [7].
Some bacteria, fungi, and algal have been reported to be able to biodegrade cyanide, such as Klebsiella pneumoniae [8], Pseudomonas pseudoalcaligenes [9], Pseudomonas putida and Pseudomonas stutzeri [10], Bacillus pumilus [11], Serratia marcescens [12], Exiguobacterium acetylicum, and Bacillus marisflavi [13], Escherichia coli [14], and Scenedesmus obliquus [15]. Cyanide-degrading microbes use their unique enzymic systems and metabolic pathways to degrade cyanide [16]. Therefore, the conditions for microbial degradation of cyanide vary with different species or strains of CDM. Some CDMs can degrade cyanide in neutral or acidic conditions, and some can grow and remove cyanide in alkaline conditions. For example, it was reported that Klebsiella pneumoniae [8], Serretia marcescens RL2b [17], and Rhodococcus UKMP-5M [18] degraded cyanide at pH 7, pH 6, and pH 6.3, respectively. Pseudomonas pseudoalcaligenes CECT5344 [9] and an isolated strain [19] have been shown to be able to grow and degrade cyanide at pH 9.5 and pH 10.3, respectively.
Given that CDMs possess specific cyanide-degrading enzyme systems and distinct cyanide degradation capacities, isolation of new cyanide-degrading strains and exploration of the resources of CDMs are needed for bioremediation of cyanide-contaminated environments and sustainable development of the ecological environment. The main aims of this study were to (1) isolate cyanide-degrading bacteria from electroplating sludge and analyze bacterial cyanide-degrading ability; (2) optimize physical and chemical conditions for cyanide degradation, including pH, temperature, carbon source, and nitrogen source; and (3) identify significant variables and optimize the levels of variables for cyanide degradation by isolated strains using a response surface methodology (RSM).

2. Materials and Methods

2.1. Reagents and Kits

A bacterial genomic DNA extraction kit with a pre-stained 1 kb DNA ladder was obtained from BioTeke Corporation (Beijing, China). The Platinum™ SuperFi II PCR premix GeneJET gel DNA recovery kit was obtained from Thermo Fisher Scientific Inc. (Waltham, MA, USA). Bacterial 16S rDNA primers were synthesized by GENEWIZ Inc. (Tianjin, China). A micro-biochemical identification tube for bacteria was obtained from Hope Bio-Technology Co., Ltd (Qingdao, China).

2.2. Isolation and Screening of Cyanide-Degrading Bacteria

The electroplating sludge used in this study was collected from an electroplating factory in Shenyang, Liaoning province, China. A total of 20 g electroplating sludge was suspended in 100 mL of nutrient broth medium containing 100 mg L−1 CN at pH 9.0 and incubated for 24 h in an incubator shaker at 160 rpm and 30 °C. Afterward, 10 mL of the liquid culture was inoculated into 100 mL of the same fresh medium and incubated under the same condition for another 24 h. Then, 0.2 mL of the liquid culture was spread onto beef extract peptone medium plates containing concentrations of 100 mg L−1 CN. Five plates were incubated at 30 °C for 24 h. A single colony with a different morphology growing on plates was selected for pure culture isolation and evaluation of resistance to cyanide.

2.3. Determination of the Minimal Inhibitory Concentration of Cyanide

The four isolates were inoculated into nutrient broth medium containing different concentrations of CN (300, 350, 400, 450, 500, 550, 600, 650, and 700 mg L−1) and incubated at 30 °C for 24 h. Then, 0.2 mL of the liquid culture was plated onto beef extract peptone medium plates. These plates were incubated at 30 °C for 48 h. The MIC was the lowest concentration of CN at which bacterial growth was completely inhibited. The isolates with high resistance to CN were selected for further study.

2.4. Identification of the Isolated Strain

Among the isolates, the T1 strain was selected for identification through an analysis of the biochemical reaction and 16 S rDNA gene sequence. For the biochemical identification of the T1 strain, a micro-biochemical identification tube for bacteria (Hopebio, China) was used, following the manufacturer’s instructions.
Bacterial genomic DNA was extracted using a bacterial genomic DNA extraction kit according to the instructions and reports published by Nasution et al. [20]. The 16S rDNA gene was amplified via PCR by using universal primers (F: 5′-GAGTTTGATCMTGGCTC AG-3′; R: 5′- ACGGCTACCTTGTTACGACTT-3′). The PCR program was as follows: 94 °C for 3 min, 30 cycles of denaturation at 94 °C for 40 s, annealing at 55 °C for 40 s, extension at 72 °C for 40 s, and, finally, extension at 72 °C for 7 min. PCR products were purified using the GeneJET gel DNA recovery kit (BioTeke, Beijing, China) and sequenced by GENEWIZ Inc. (Beijing, China). Highly similar sequences were searched using NCBI BLAST (http://blast.ncbi.nlm.nih.gov/Blast.cgi (accessed on 15 September 2022)). The phylogenetic tree was constructed using Clustalx and MEGA-7.0 software by using the maximum likelihood and neighbor-joining method.

2.5. Biodegradation of Cyanide by T1 Strain and Measurement of Concentration of Cyanide

Isolated strain T1 was cultured in 30 mL nutrient broth medium at an initial CN concentration of 200 mg L−1 and 30 °C, pH 9, 160 rpm, and 10% (v/v) inoculum or under the indicated degradation conditions. Uninoculated cyanide-containing medium served as control. After incubation for the indicated time, the residual concentration of CN was measured via isonicotinic acid-pyrazolone spectrophotometry. The absorbance of the developed color was measured colorimetrically at 638 nm by using an Lu-T3 ultraviolet visible spectrophotometer (LABOAO, Zhengzhou, China). The amount of cyanide removal by the T1 strain was quantified by calculating the residual concentration of CN difference between the culture solution inoculated and uninoculated with T1 strain. The cyanide removal efficiency was the ratio of the amount of cyanide removal to the initial cyanide content [21]. The experiments were performed in triplicate.

2.6. Effects of Physical and Chemical Conditions on Biodegradation of Cyanide by T1 Strain

The effects of pH value (7 to 11), temperature (22 °C to 38 °C), carbon sources (glucose, sucrose, corn flour, glycerol), and nitrogen sources (peptone, ammonium chloride, ammonium sulphate, soybean flour, soybean meal) were evaluated to optimize cyanide degrading conditions. The buffer solution (each liter of buffer solution contained 2.5 g Na2HPO4, 2.0 g KH2PO4, 0.5 g MgSO4·7H2O, 30 mg FeSO4·7H2O, and 60 mg CaCl2, pH 9) [17] contained 1% glucose or 1% beef extract and was used for optimizing nitrogen or carbon sources, respectively.

2.7. Optimization of Process Variables with Response Surface Methodology

2.7.1. Plackett–Burman Design

A Plackett–Burman design (PBD) was used to identify the important variables for cyanide degradation [22]. A total of 30 mL of nutrient broth medium with a cyanide ion concentration of 200 mg L−1 was used in the experiments. Eight independent factors (i.e., pH, temperature, inoculation amount, corn flour, soybean meal, L-methionine, L-cysteine, and glucose) were used in the experiments. Each factor was set at two levels: high (+1) and low (−1). Design-Expert 8.0.5 was used to develop the design matrix and perform statistical analysis.

2.7.2. Central Composite Design

The important variables identified by the PBD were selected and further optimized using a central composite design (CCD) method to obtain the optimum levels of these variables [22]. Design-Expert 8.0.5 was used for statistical analysis. A total of 30 mL of nutrient broth medium with cyanide ion concentration of 200 mg L−1 was used in the experiments. Each variable was studied at five different levels. Twenty experiments were performed. The behavior of the system was explained using the following equation:
Y = β 0 + β i X i + β i i X i 2 + β i j X i X j
where Y represents the response variables; β0 is the intercept coefficient; and βi, βii, and βij are coefficients of the linear, quadratic, and interaction effects, respectively.

2.8. Statistical Analysis

Design-Expert 8.0.5 was used for ANOVA of PBD and CCD data. Excel 2010 was used for data statistics and Origin 2019 software was used for graphing analysis. A p value of ≤0.05 was considered to be statistically significant.

3. Results

3.1. Isolation of Cyanide-Degrading Bacteria

Four bacteria strains (named T1–T4) were isolated based on the differences in their colony morphologies from electroplating sludge on beef extract peptone medium plates containing concentrations of 100 mg L−1 CN. Among the four isolates, the T1 strain showed the highest resistance to cyanide with the minimal inhibitory concentration (MIC) of CN of up to 550 mg L−1. Therefore, the T1 strain was selected for further study.

3.2. Identification of Cyanide-Degrading Bacteria Strain T1

To identify the isolated bacteria T1, we performed Gram staining, morphological observation, and biochemical identification. The results showed that the isolated bacteria T1 was Gram-positive and spherical, and the biochemical characters of T1 (Table 1) were consistent with Aerococcus viridans. Therefore, the T1 strain was initially identified as Aerococcus viridans according to Bergey’s Manual of Systematic Bacteriology.
The 16S rDNA gene sequence of the T1 strain contained 1547 bp. The analysis of sequence similarity showed that the T1 strain presented 99% sequence identity with three strains of A. viridans (sequence IDs: NR118723.2, NR104708.1, and NR043443.1). The phylogenetic tree was constructed based on 16S rDNA sequence. Combined with the above biochemical characteristics (Table 1), the isolated strain T1 was identified as A. viridans (termed A. viridans T1).

3.3. Cyanide-Degrading Experiment

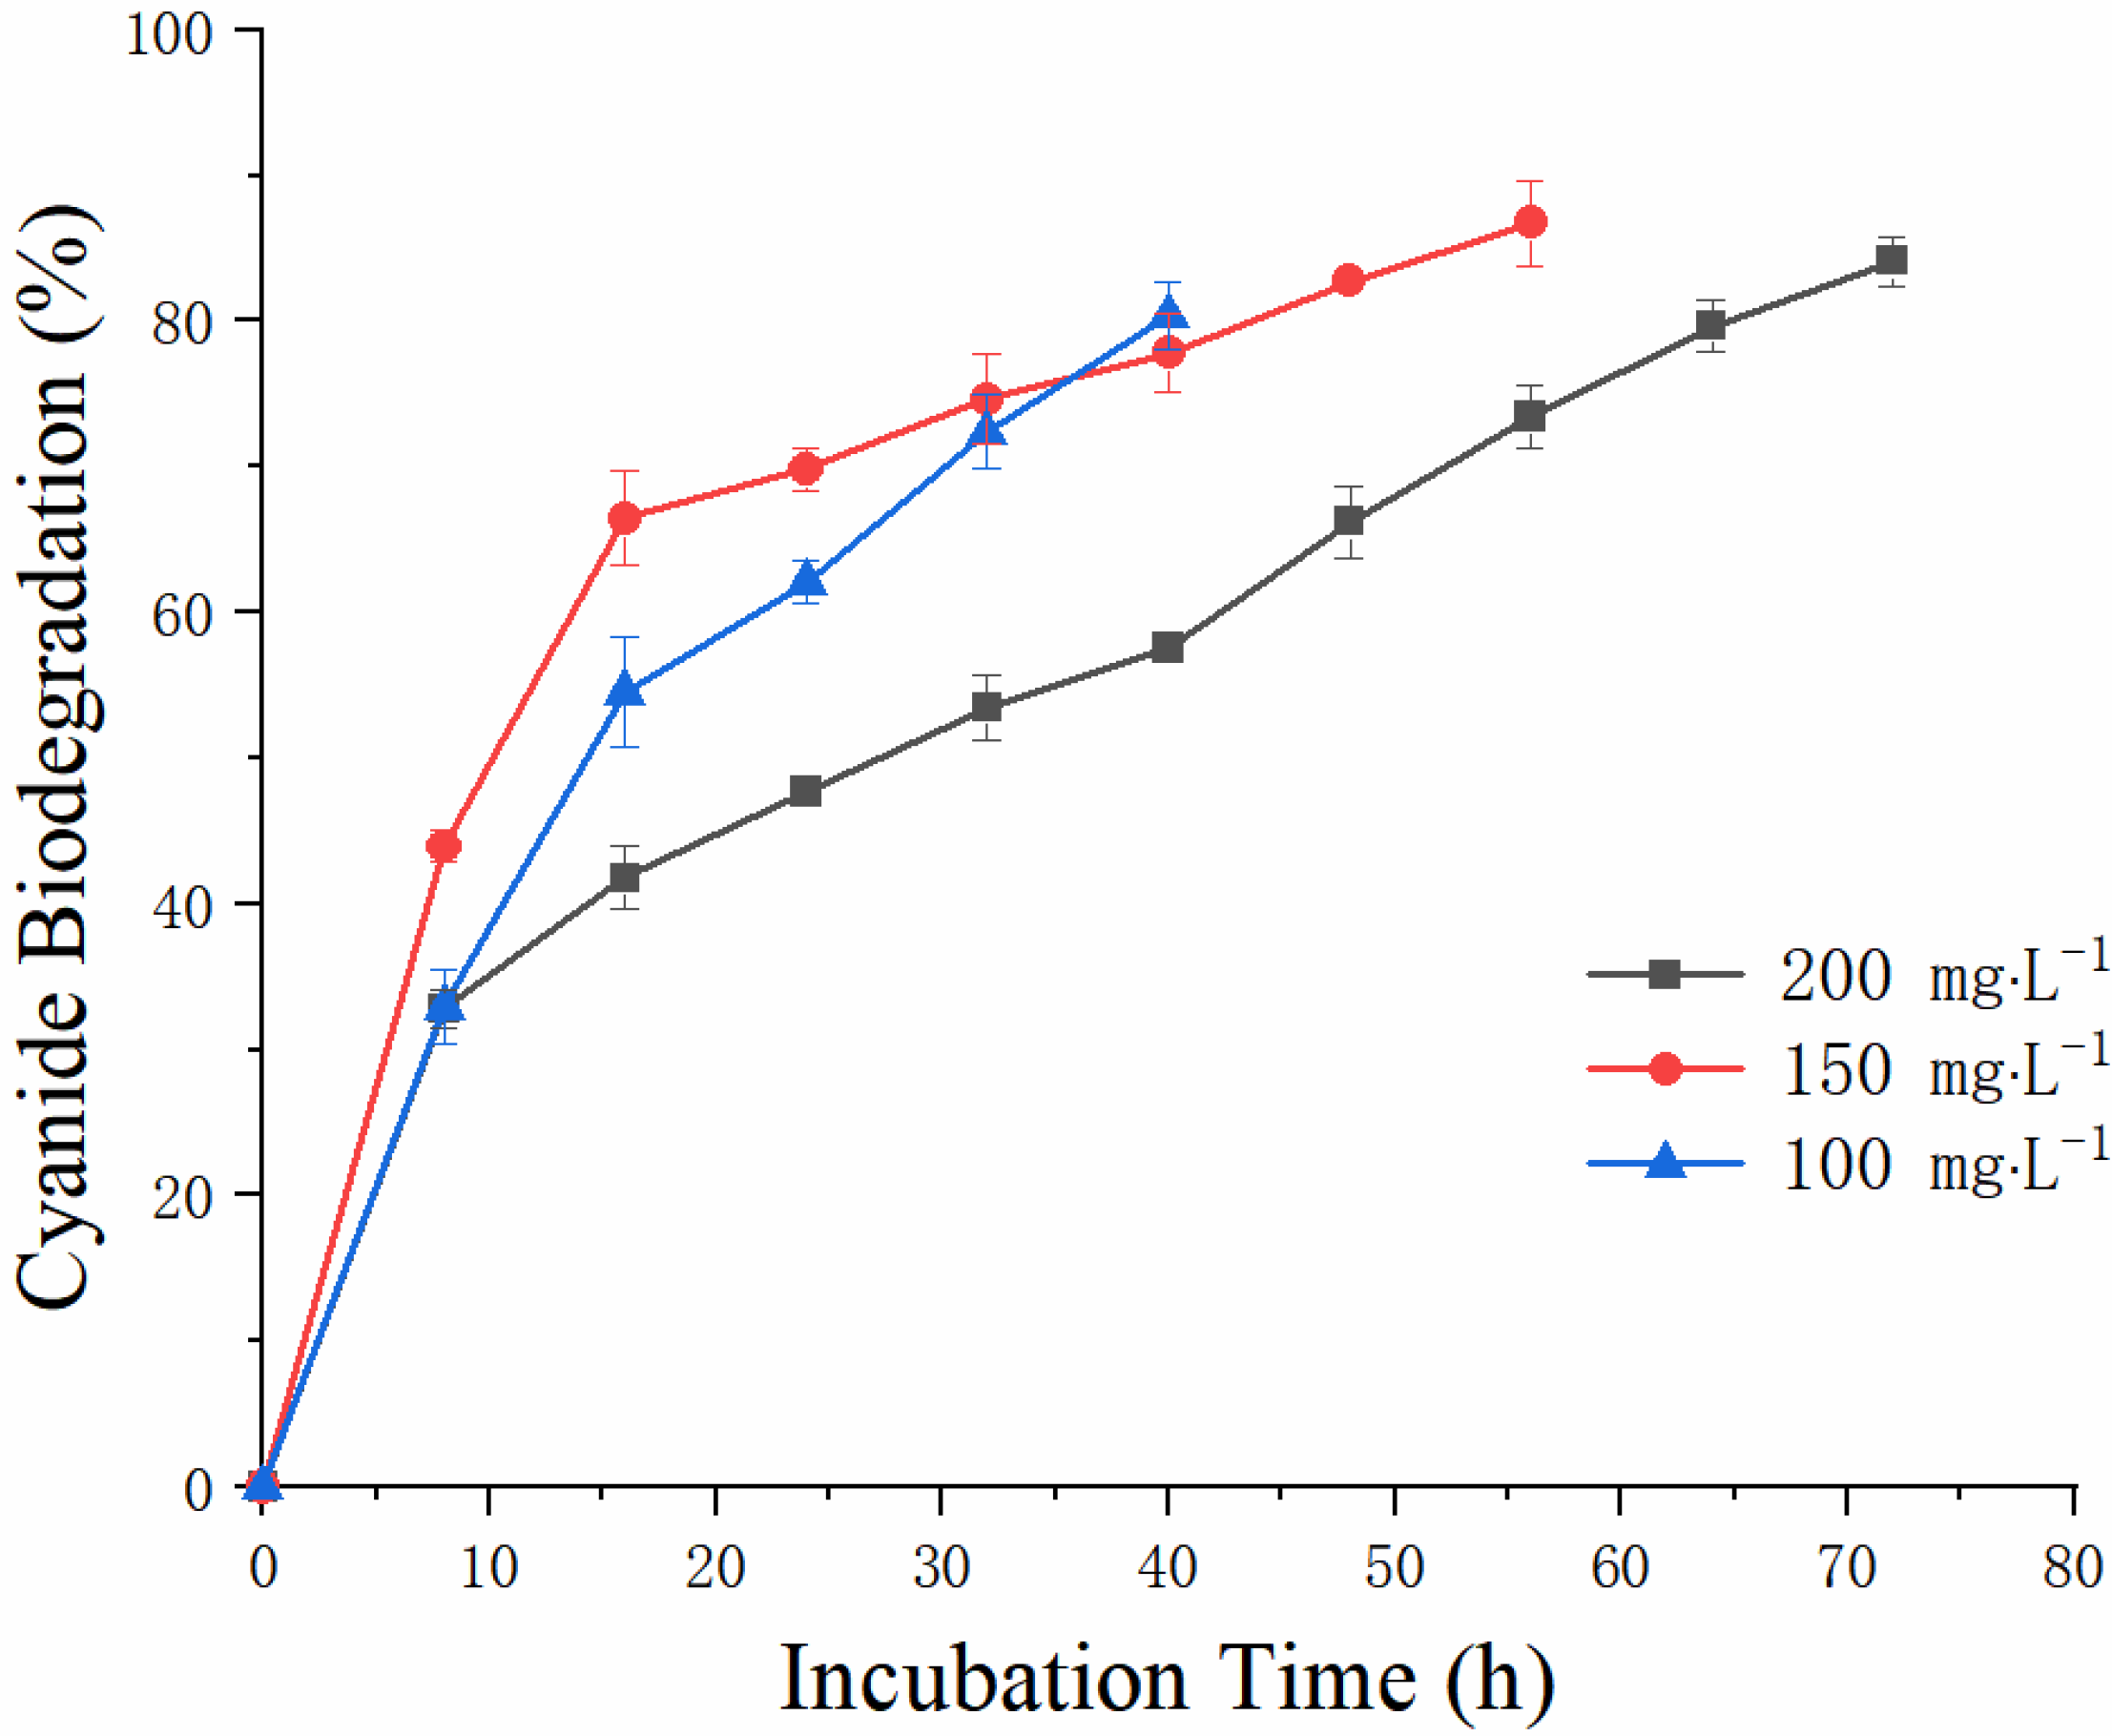
3.3.1. Cyanide Removal Efficiency of A. viridans T1

The cyanide-degrading ability of the isolated strain A. viridans T1 was investigated at pH 9, 30 °C, 160 rpm, and initial CN concentrations of 100, 150, and 200 mg/L, respectively. The residual CN concentrations in culture solution inoculated or uninoculated with the A. viridans T1 strain were monitored at indicated time points, and the removal efficiency of CN was calculated following the protocol described in the Materials and Methods” section (Section 2.5). The results indicated that A. viridans T1 was able to remove 84.1% of free cyanide at an initial CN concentration of 200 mg L−1 in 72 h and 86.7% of free cyanide at an initial CN concentration of 150 mg L−1 in 56 h (Figure 1).

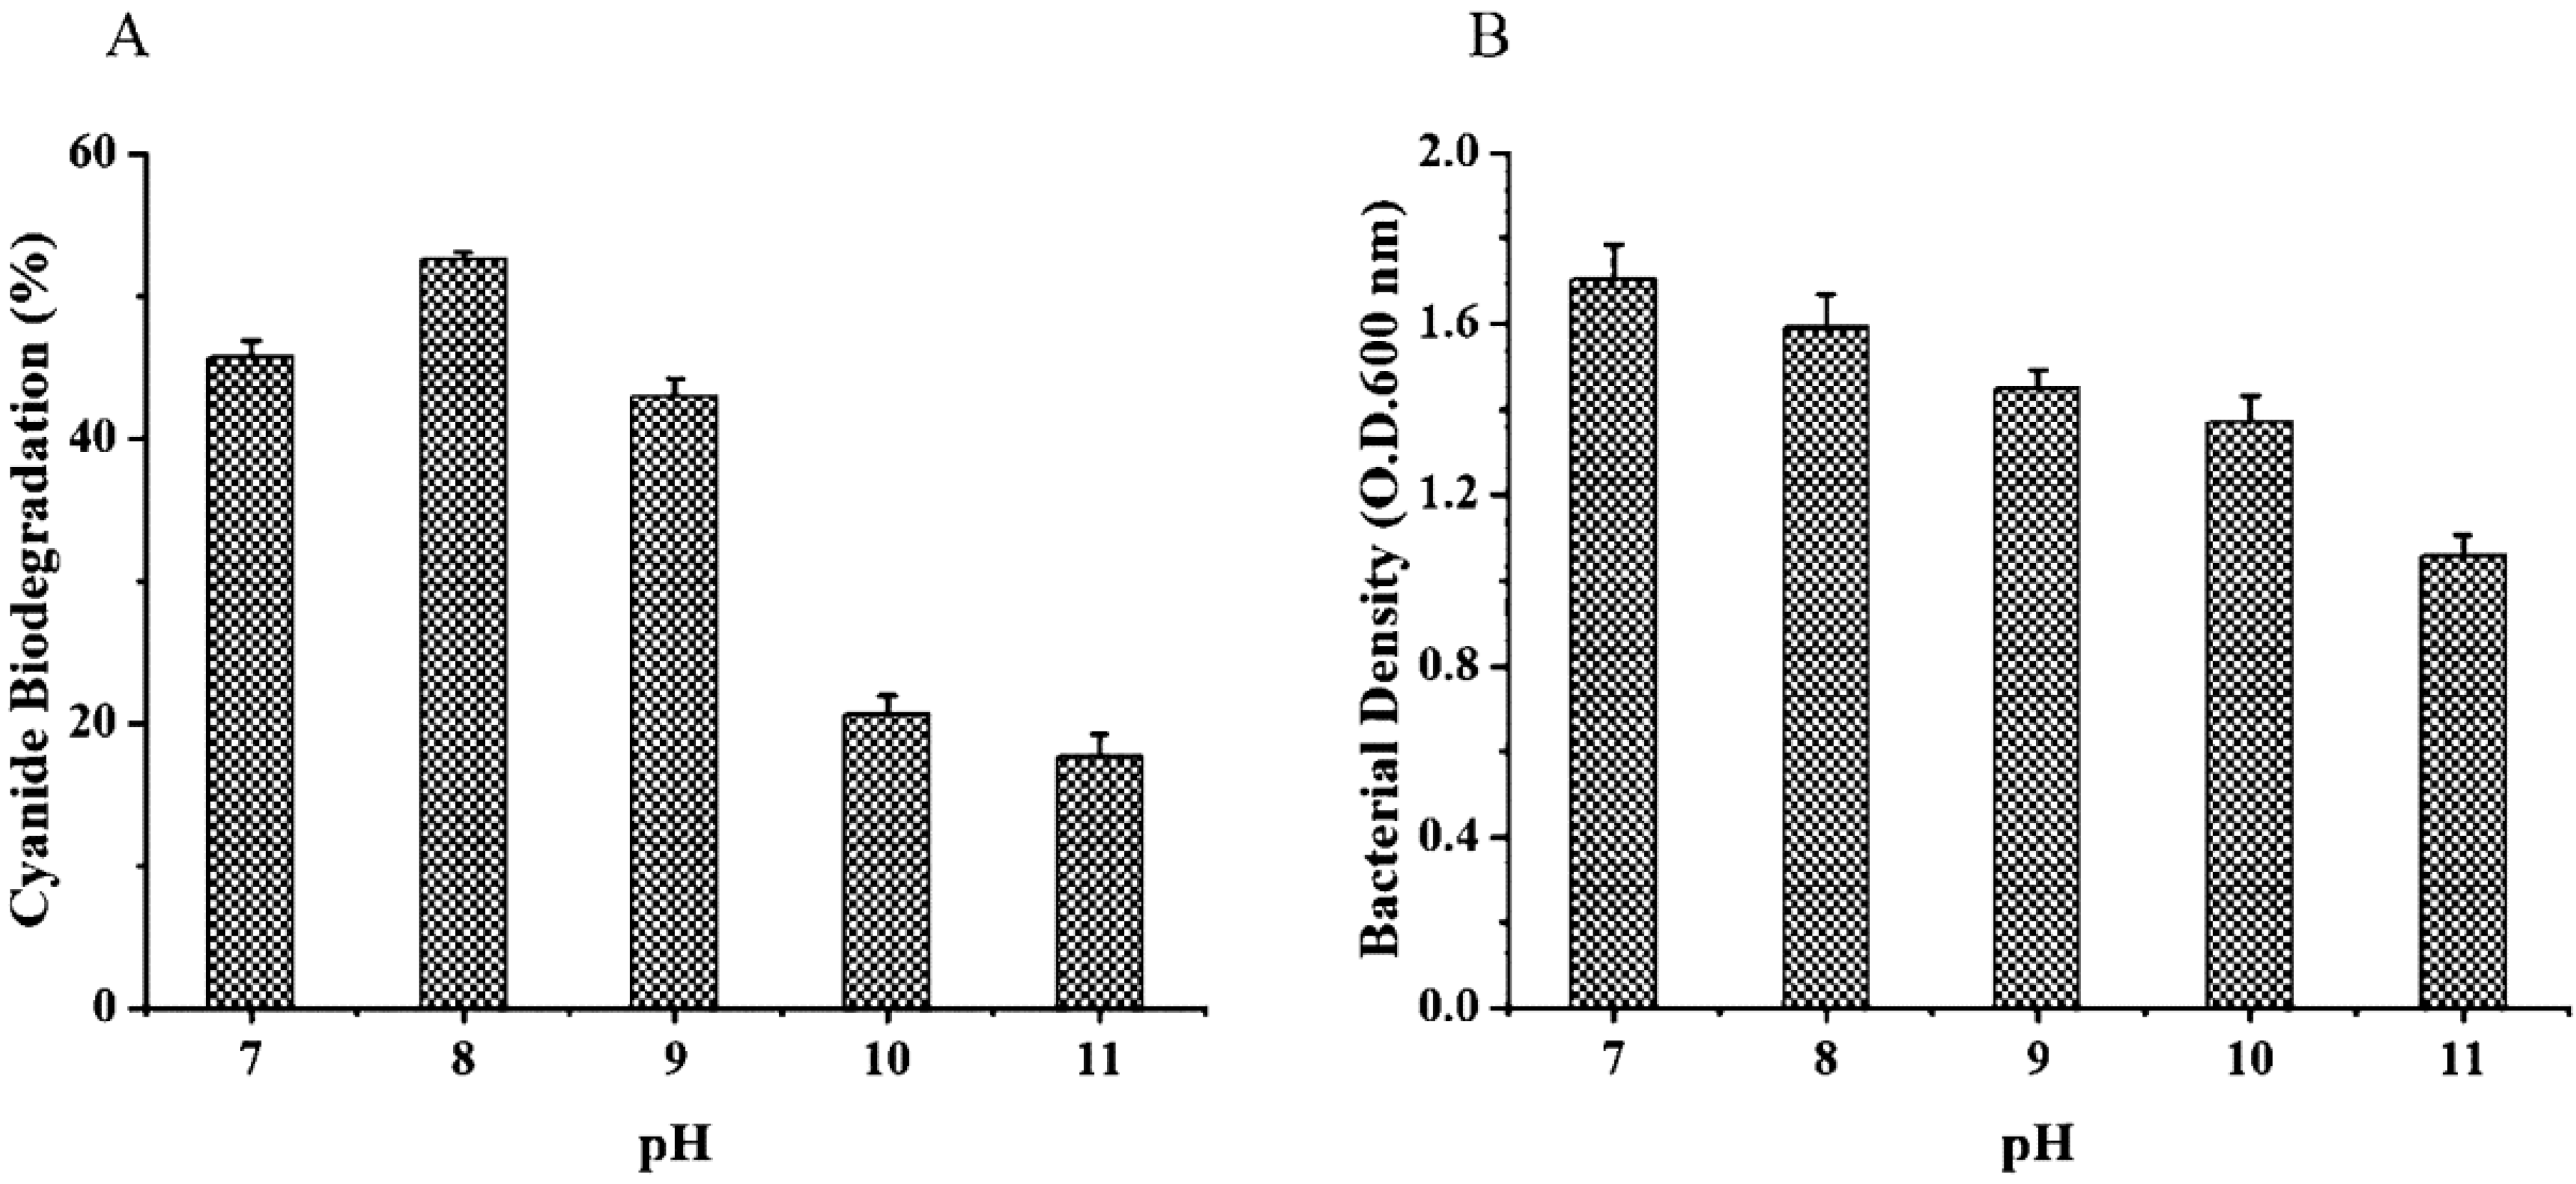
3.3.2. Effects of Temperature and pH on Cyanide Biodegradation and Growth of A. viridans T1

After incubation for 16 h, the cyanide removal efficiency of A. viridans T1 and bacterial growth were measured at the indicated pH and temperature. The highest cyanide removal efficiency (Figure 2A) and bacterial growth (Figure 2B) were observed at 34 °C. The optimum pH for cyanide degradation (Figure 3A) and bacterial growth (Figure 3B) were 8.0 and 7, respectively.

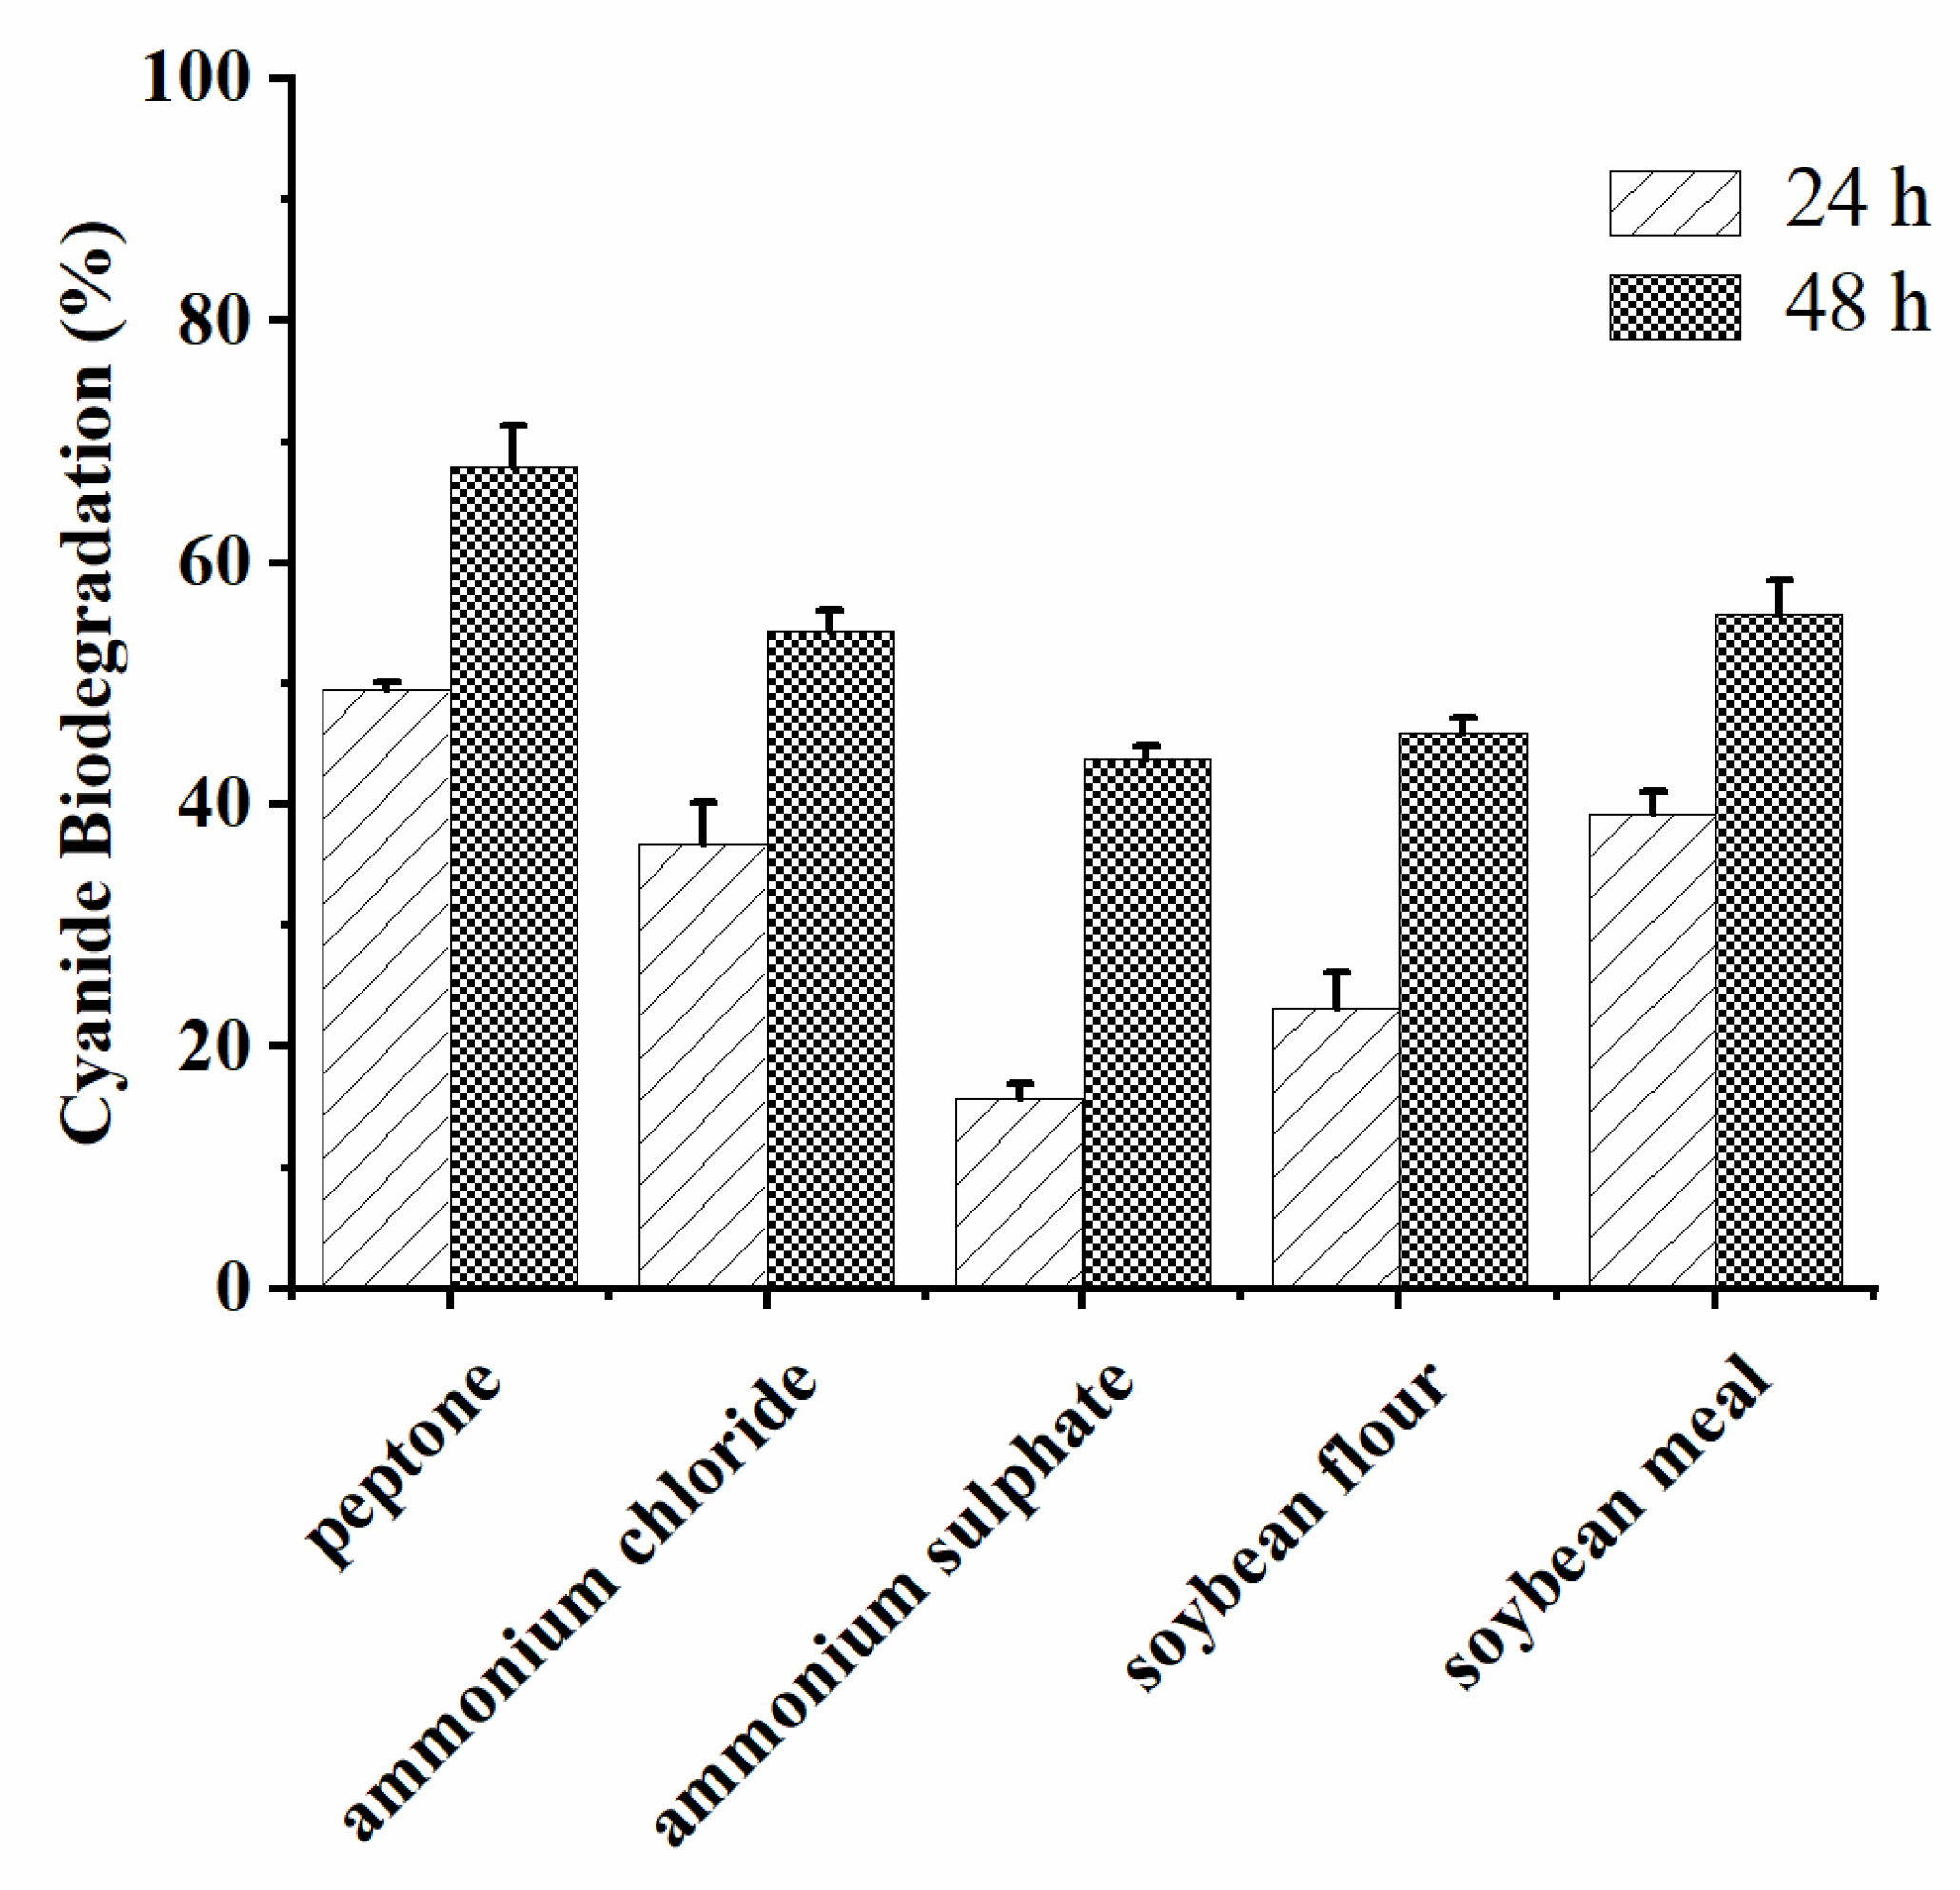
3.3.3. Effects of Carbon Source and Nitrogen Source on Cyanide Biodegradation by A. viridans

As shown in Figure 4, the carbon sources glycerol, glucose, corn flour, and sucrose presented cyanide degradation efficiencies up to 71.78%, 68.04%, 63.77%, and 47.46% in 48 h, respectively. Figure 5 shows that the nitrogen sources peptone, ammonium chloride, ammonium sulphate, soybean flour, and soybean meal demonstrated 67.96%, 54.32%, 43.84%, 45.97%, and 55.81% cyanide removal efficiencies in 48 h, respectively. Considering the economic costs, corn flour and soybean meal were selected as the respective carbon source and nitrogen source for further optimization.

3.4. Significant Factors Identified by PBD

The significant factors for the biodegradation of cyanide were identified through a 12 run PBD. The CN degradability is shown in Table 2. The data were statistically analyzed using Design-Expert 8.0 software and are shown in Table 3. According to the synergies of these eight factors for CN degradability and the related significant levels, three factors (soybean meal (p = 0.0385), corn flour (p = 0.0147), and L-cysteine (p = 0.0079)) were selected for further optimization to determine their optimal levels. The ranges of these variables are shown in Table 4.

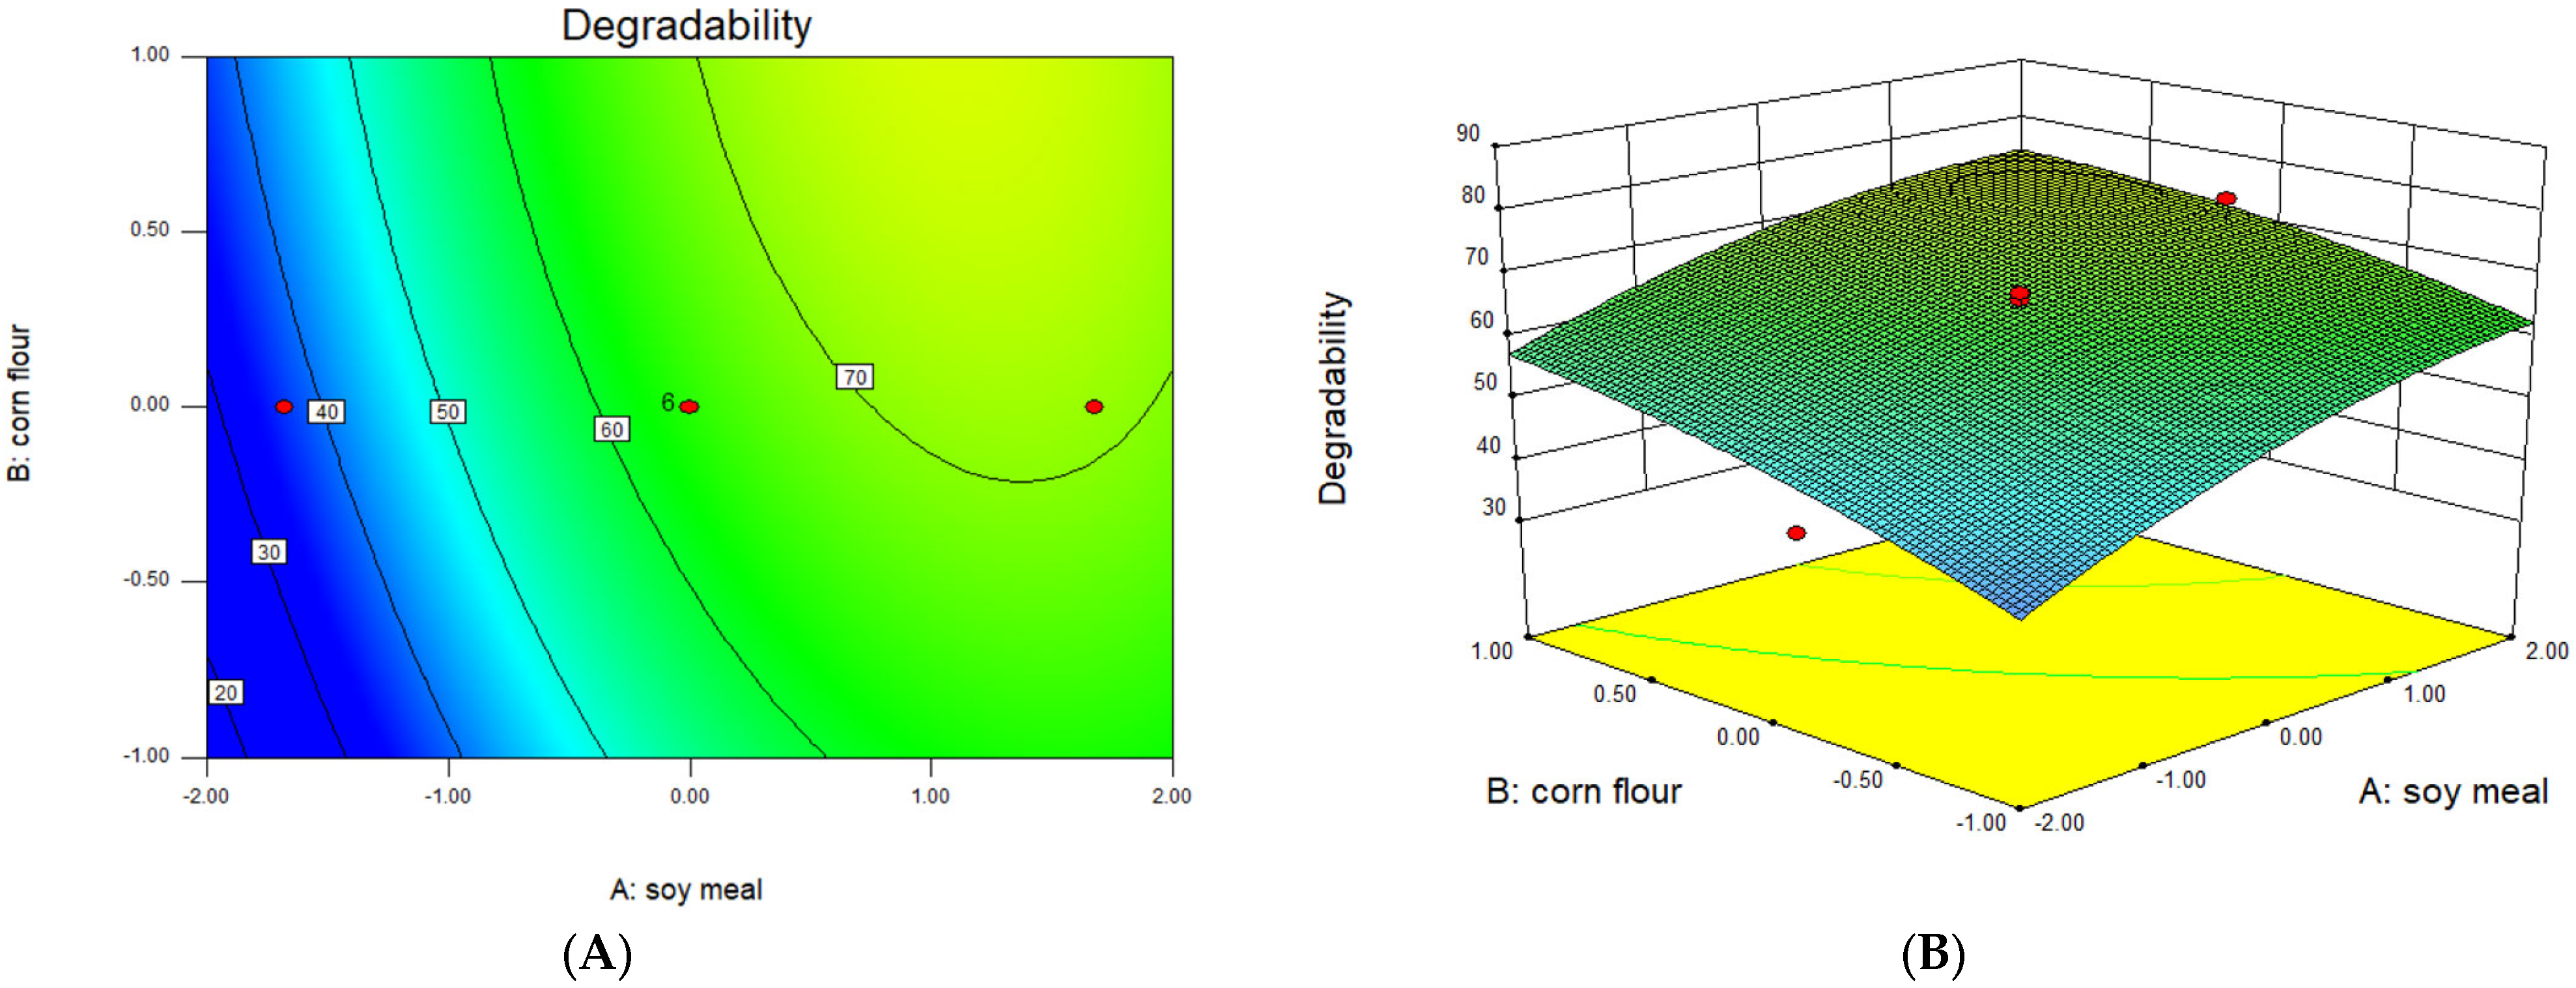
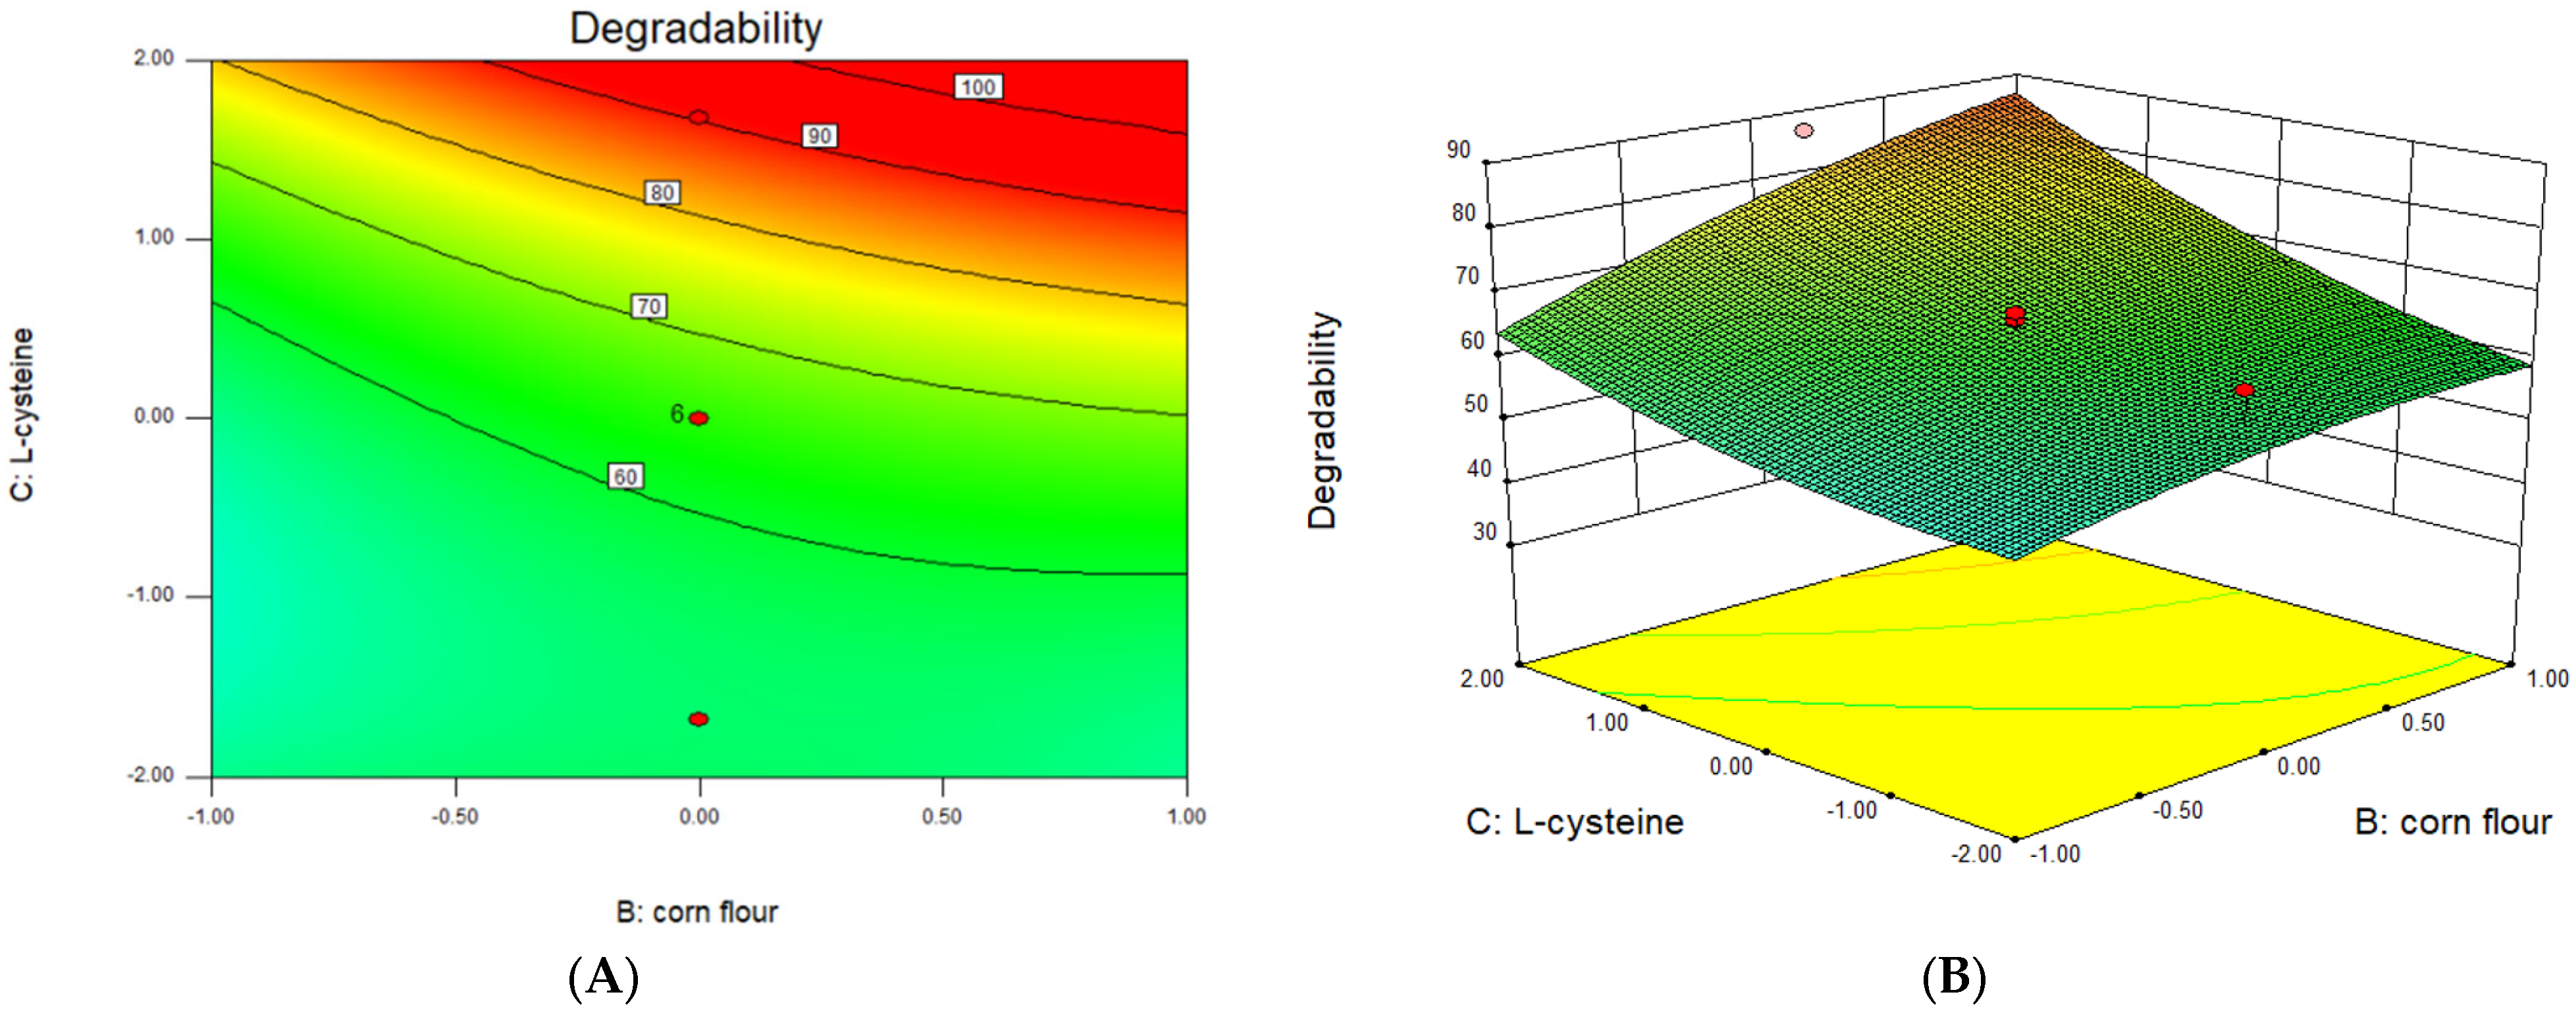
3.5. Optimization of Significant Variables by CCD

A 20-run CCD was applied to determine the optimal levels of soybean meal, corn flour, and L-cysteine. The effects of these variables on CN degradability are shown in Table 5. The quadratic regression model equation of the cyanide degradation rate was obtained by multiple regression fitting of the CCD data. The effects of pH, corn flour, and L-cysteine on CN biodegradability were predicted with the following quadratic model equation:
Y = 64.48664 + 10.18762X1 + 7.59921X2 + 10.14504X3 − 1.60000X1X2 + 0.55000X1X3 + 3.85000X2X3 − 3.82447X12 − 2.35723X22 + 3.14053X32
where Y represents CN degradability; and X1, X2, and X3 refer to soybean meal, corn flour, and L-cysteine, respectively.
Analysis of variance indicated that the model was highly significant and correct, as the values of R2, AdjR2, and PredR2 were equal to 0.9498, 0.9047, and 0.8120, respectively, and the p value was < 0.0001 (Table 6). In the model terms, X1 (p < 0.0001), X2 (p = 0.0001), and X3 (p < 0.0001) were extremely significant, and X2X3 (p = 0.0438) was significant. Other terms were not significant at p > 0.05. Therefore, soybean meal, corn flour, L-cysteine, and the interaction of corn flour with L-cysteine had significant effects on CN degradability (Table 6).
The 3D response surface plot and contour plot for each pair of variables (A: soybean meal, B: corn flour; A: soybean meal, C: L-cysteine; or B: corn flour, C: L-cysteine) are shown in Figure 6, Figure 7 and Figure 8, respectively, indicating the effects of the interaction between independent variables on cyanide degradation. Under the optimized conditions of 1.11% soybean meal, 1.5% corn flour, and 1.2% L-cysteine, the predicted degradation rate was 98.87%. The confirmatory experiment was performed under the optimized conditions, and the actual degradation rate was 97.3% (Table 7).

4. Discussion

Microbial degradation of cyanide is an attractive method. Various bacteria, fungi, and algae have been isolated and shown to be able to biodegrade cyanide. However, A. viridans has not been reported to be able to degrade cyanide. In this study, A. viridans T1 with potent cyanide-degrading ability was isolated from electroplating sludge. A. viridans is a Gram-positive, oxidase, catalase-negative, micro-aerophylic, and non-motile coccus that belongs to the family Aerococcaceae [23]. A. viridans is widely distributed in the environment, such as in air, water, and soil.
The cyanide-degrading ability of A. viridans T1 was investigated. As shown in Figure 1, A. viridans T1 was able to remove 84.1% of 200 mg L−1 free cyanide in 72 h and 86.7% of 150 mg L−1 free cyanide in 56 h. A higher degradation rate occurred in hours 0–16, with 41.75% removal of 200 mg L−1 CN, 66.5% removal of 150 mg L−1 CN, and 54.5% removal of 100 mg L−1 CN (Figure 2), showing higher cyanide removal efficiency compared to some previously reported CDMs. A previous study showed that K. pneumoniae was able to completely degrade 0.5 mM potassium cyanide within three days [17]. Rhodococcus UKMP-5M isolated from petroleum-contaminated soils was able to completely degrade 0.1 mM KCN within 24 h [18]. A strain of pseudomonas putida isolated from goldmine soil was able to remove 93.5% of 200 ppm cyanide within 13 days [24].
In this study, the cyanide degradation conditions of the isolated strain A. viridans T1 were optimized. Similar cyanide removal (43.3–44.25%) and bacterial growth (1.595–1.67 O.D. 600 nm) were observed at 30 °C–38 °C, and the highest removal of cyanide and bacterial growth occurred at 34 °C (Figure 3). Reports have indicated that Klebsiella pneumoniae [8] and Serretia marcescens RL2b [17] present maximum degradation of cyanide at 25 °C and 35 °C, respectively, while the optimum temperature for Rhodococcus UKMP-5M [18] and pseudomonas putida [24] was 30 °C. Isolated A. viridans T1 was able to grow in the pH range of 7–11 and the highest growth yield occurred at pH 7 (Figure 3B), while the maximum degradation of cyanide occurred at pH 8 (Figure 3A). In accordance with this study, pH 6.0–7.8 was determined as the optimal pH range for bacterial or enzymic degradation of cyanide [8,18,25]. In addition, some CDMs can grow and degrade cyanide under alkaline conditions. For example, Pseudomonas aeruginosa STK 03 can grow and degrade free cyanate at pH 10 [16]. Moradkhani et al. showed that the optimum pH for cyanide degradation by Pseudomonas parafulva C3 is 9.95 [24]. These studies indicate that temperature and pH are critical factors for the cyanide removal efficiency of CDMs.
Consistent with our study, glycerol carbon sources were found to result in the highest cyanide removal by Serretia marcescens RL2b [17]. However, Adjei et al. [26] indicated that B. cepacia C-3 could not proliferate and degrade cyanide with glycerol as a carbon source, and the optimal carbon source was fructose. In another study, glucose resulted in the highest cyanide removal by a new isolated strain, followed by fructose [19]. Among the five nitrogen sources tested in this study, peptone was determined as the optimal nitrogen source for cyanide degradation by A. viridans T1, followed by ammonium sulfate and soybean meal (Figure 6). Mirizadeh et al. [19] showed that ammonium sulfate, ammonium nitrate, or urea nitrogen sources inhibited cyanide degradation by a new isolated strain. Similar to this study, tryptone was shown to be the optimum nitrogen source for cyanide degradation by Serretia marcescens [17]. Adjei and Ohta [26] reported that cyanide biodegradation by B.cepacia C-3 increased by about twofold with casein and urea as organic nitrogen compared to that with KCN as sole nitrogen source, while ammonium sulfate and KNO3 as inorganic nitrogen improved the cyanide degradation by about 3–3.5 fold. Maniyam et al. [18] evaluated the effect of glucose and yeast extract on cyanide degradation by Rhodococcus UKMP-5 M. When glucose and yeast were supplemented simultaneously, cyanide removal efficiency was four times greater than that in the presence of yeast extract alone, indicating a significantly higher effect from glucose compared to yeast extract on cyanide degradation. These studies show the difference in the utilization of carbon sources and nitrogen sources by CDMs and indicate that the carbon and nitrogen sources need to be optimized to improve the degradation efficiency of cyanide. In the present study, with the economic costs of practical utilization taken into consideration, corn flour and soybean meal were selected as the carbon source and nitrogen source, respectively, for further optimization.
The RSM is a powerful statistical tool and is often used to explore the effects of several independent variables [27]. In this study, three process variables (corn flour, soybean meal, and L-cysteine) were identified as significant variables for cyanide degradation by A. viridans T1, and the optimal levels of these variables were determined with an RSM. Wu et al. identified inoculum amount, rotary speed, and temperature as significant factors for cyanide biodegradation by Bacillus sp. CN-22 using an RSM, and the optimal variable levels were a rotary speed of 193 rpm, inoculum amount of 2.38%, and temperature of 31 °C [22]. Another study determined temperature, pH, and glucose concentration to be significant variables for cyanide biodegradation by Pseudomonas parafulva, and the optimal variable levels were determined to be a temperature of 32.23 °C, pH 9.95, and glucose concentration of 0.73 gL−1 [24]. These data indicate that the significant variables and variable levels that affect cyanide biodegradation are different for various CDMs.

5. Conclusions

In this study, a new cyanide-degrading bacteria was isolated and identified as A. viridans, its resistance to cyanide and cyanide degradation ability was evaluated, and its cyanide degradation conditions were optimized. A. viridans T1 was able to tolerate CN concentration of 550 mg L−1 and exhibited strong cyanide-degrading ability, with 84.1% cyanide removal at an initial concentration of 200 mg L−1 CN within 72 h. The result showed that the cyanide removal efficiency was highest at pH 8 and 34 °C. Under the conditions optimized by the RSM, the predicted cyanide degradation rate was 98.87%, and the confirmatory experiment showed a cyanide degradation rate of 97.3%. The strong cyanide degradation ability of A. viridans T1 makes it a good candidate for the bioremediation of cyanide-contaminated environments. However, further studies on its cyanide-degrading enzyme, genetic characteristics, and toxicity are needed.

Author Contributions

Conceptualization, W.J., Y.L. and J.S.; Methodology, W.J. and Y.L.; Investigation, W.J., Y.L., P.M. and J.Z.; Formal analysis, H.Y., Z.F. and Y.W.; Writing—original draft preparation, H.Y., Z.F. and Y.W.; Writing—review and editing, J.S.; Supervision, J.S. All authors have read and agreed to the published version of the manuscript.

Funding

This work was supported by the National Key Research and Development Program of China (no. 2018YFC1902002).

Institutional Review Board Statement

Not applicable.

Informed Consent Statement

Not applicable.

Data Availability Statement

Not applicable.

Conflicts of Interest

The authors declare that they have no conflict of interest.

References

  1. Luque-Almagro, V.M.; Cabello, P.; Sáez, L.P.; Olaya-Abril, A.; Moreno-Vivián, C.; Roldán, M.D. Exploring anaerobic environments for cyanide and cyano-derivatives microbial degradation. Appl. Microbiol. Biotechnol. 2018, 102, 1067–1074. [Google Scholar] [CrossRef] [Green Version]
  2. Razanamahandry, L.C.; Andrianisa, H.A.; Karoui, H.; Kouakou, K.M.; Yacouba, H. Biodegradation of free cyanide by bacterial species isolated from cyanide-contaminated artisanal gold mining catchment area in Burkina Faso. Chemosphere 2016, 157, 71–78. [Google Scholar] [CrossRef]
  3. Ojaghi, A.; Shafaie Tonkaboni, S.Z.; Shariati, P.; Doulati Ardejani, F. Novel cyanide electro-biodegradation using Bacillus pumilus ATCC 7061 in aqueous solution. J. Environ. Health Sci. Eng. 2018, 16, 99–108. [Google Scholar] [CrossRef] [PubMed]
  4. Akcil, A.; Karahan, A.G.; Ciftci, H.; Sagdic, O. Biological treatment of cyanide by natural isolated bacteria. Miner. Eng. 2003, 16, 643–649. [Google Scholar] [CrossRef]
  5. Ebbs, S. Biological degradation of cyanide compounds. Curr. Opin. Biotechnol. 2004, 15, 231–236. [Google Scholar] [CrossRef]
  6. Gupta, N.; Balomajumder, C.; Agarwal, V.K. Enzymatic mechanism and biochemistry for cyanide degradation: A review. J. Hazard. Mater. 2010, 176, 1–13. [Google Scholar] [CrossRef] [PubMed]
  7. Luque-Almagro, V.M.; Merchán, F.; Blasco, R.; Igeño, M.I.; Martínez-Luque, M.; Moreno-Vivián, C.; Castillo, F.; Roldán, M.D. Cyanide degradation by Pseudomonas pseudoalcaligenes CECT5344 involves a malate: Quinone oxidoreductase and an associated cyanide-insensitive electron transfer chain. Microbiology 2011, 157, 739–746. [Google Scholar] [CrossRef] [Green Version]
  8. Avcioglu, N.H.; Bilkay, I.S. Biological Treatment of Cyanide by Using Klebsiella pneumoniae Species. Food. Technol. Biotechnol. 2016, 54, 450–454. [Google Scholar] [CrossRef]
  9. Huertas, M.J.; Sáez, L.P.; Roldán, M.D.; Luque-Almagro, V.M.; Martínez-Luque, M.; Blasco, R.; Castillo, F.; Moreno-Vivián, C.; García-García, I. Alkaline cyanide degradation by Pseudomonas pseudoalcaligenes CECT5344 in a batch reactor. Influence of pH. J. Hazard. Mater. 2010, 179, 72–78. [Google Scholar] [CrossRef]
  10. Singh, U.; Arora, N.K.; Sachan, P. Simultaneous biodegradation of phenol and cyanide present in coke-oven effluent using immobilized Pseudomonas putida and Pseudomonas stutzeri. Braz. J. Microbiol. 2018, 49, 38–44. [Google Scholar] [CrossRef]
  11. Meyers, P.R.; Gokool, P.; Rawlings, D.E.; Woods, D.R. An efficient cyanide-degrading Bacillus pumilus strain. J. Gen. Microbiol. 1991, 137, 1397–1400. [Google Scholar] [CrossRef] [PubMed] [Green Version]
  12. Karamba, K.I.; Ahmad, S.A.; Zulkharnain, A.; Yasid, N.A.; Ibrahim, S.; Shukor, M.Y. Batch growth kinetic studies of locally isolated cyanide-degrading Serratia marcescens strain AQ07. 3 Biotech 2018, 8, 11. [Google Scholar] [CrossRef] [PubMed]
  13. Mekuto, L.; Alegbeleye, O.O.; Ntwampe, S.K.; Ngongang, M.M.; Mudumbi, J.B.; Akinpelu, E.A. Co-metabolism of thiocyanate and free cyanide by Exiguobacterium acetylicum and Bacillus marisflavi under alkaline conditions. 3 Biotech 2016, 6, 173. [Google Scholar] [CrossRef] [PubMed] [Green Version]
  14. Figueira, M.M.; Ciminelli, V.S.; de Andrade, M.C.; Linardi, V.R. Cyanide degradation by an Escherichia coli strain. Can. J. Microbiol. 1996, 42, 519–523. [Google Scholar] [CrossRef] [PubMed]
  15. Gurbuz, F.; Ciftci, H.; Akcil, A. Biodegradation of cyanide containing effluents by Scenedesmus obliquus. J. Hazard. Mater. 2009, 162, 74–79. [Google Scholar] [CrossRef] [PubMed]
  16. Mahendran, R.; Bs, S.; Thandeeswaran, M.; kG, K.; Vijayasarathy, M.; Angayarkanni, J.; Muthusamy, G. Microbial (Enzymatic) degradation of cyanide to produce pterins as cofactors. Curr. Microbiol. 2020, 77, 578–587. [Google Scholar] [CrossRef]
  17. Kumar, V.; Kumar, V.; Bhalla, T.C. In vitro cyanide degradation by Serretia marcescens RL2b. Int. J. Environ. Sci. 2013, 3, 1969–1979. [Google Scholar]
  18. Maniyam, M.N.; Sjahrir, F.; Ibrahim, A.; Cass, A.G. Biodegradation of cyanide by Rhodococcus UKMP-5 M. Biologia 2013, 68, 177–185. [Google Scholar] [CrossRef]
  19. Mirizadeh, S.; Yaghmaei, S.; Ghobadi Nejad, Z. Biodegradation of cyanide by a new isolated strain under alkaline conditions and optimization by response surface methodology. J. Environ. Health Sci. Eng. 2014, 12, 85. [Google Scholar] [CrossRef] [Green Version]
  20. Nasution, F.; Theanhom, A.A.; Sukartini; Bhuyar, P.; Chumpookam, J. Genetic diversity evaluation in wild Muntingia calabura L. based on Random Amplified Polymorphic DNA (RAPD) markers. Gene Rep. 2021, 25, 101335. [Google Scholar] [CrossRef]
  21. Mekuto, L.; Ntwampe, S.K.O.; Kena, M.; Golela, M.T.; Amodu, O.S. Free cyanide and thiocyanate biodegradation by Pseudomonas aeruginosa STK 03 capable of heterotrophic nitrification under alkaline conditions. 3 Biotech 2016, 6, 6. [Google Scholar] [CrossRef] [PubMed]
  22. Wu, C.F.; Xu, X.M.; Zhu, Q.; Deng, M.C.; Feng, L.; Peng, J.; Yuan, J.P.; Wang, J.H. An effective method for the detoxification of cyanide-rich wastewater by Bacillus sp. CN-22. Appl. Microbiol. Biotechnol. 2014, 98, 3801–3807. [Google Scholar] [CrossRef] [PubMed]
  23. Williams, R.E.; Hirch, A.; Cowan, S.T. Aerococcus, a new bacterial genus. J. Gen. Microbiol. 1953, 8, 475–480. [Google Scholar] [CrossRef] [PubMed] [Green Version]
  24. Moradkhani, M.; Yaghmaei, S.; Nejad, Z.G. Biodegradation of cyanide under alkaline conditions by a srain of Pseudomonas putida isolated from gold mine soil and optimization of process variables through response surface methodology (RSM). Period Polytech-Chem. 2018, 63, 265–273. [Google Scholar]
  25. Jandhyala, D.M.; Willson, R.C.; Sewell, B.T.; Benedik, M.J. Comparison of cyanide-degrading nitrilases. Appl. Microbiol. Biotechnol. 2005, 68, 327–335. [Google Scholar] [CrossRef]
  26. Adjei, M.D.; Ohta, Y. Factors affecting the biodegradation of cyanide by Burkholderia cepacia strain C-3. J. Biosci. Bioeng. 2000, 89, 274–277. [Google Scholar] [CrossRef]
  27. Myers, R.H.; Montgomery, D.C.; Adweson-Cook, C.M. Response Surface Methodology: Process and Product Optimization Using Designed Experiments; John Wiley and Sons, Inc.: New York, NY, USA, 2008. [Google Scholar]
Figure 1. Cyanide biodegradation efficiency of A. viridans T1 at different initial concentrations (initial CN concentration of 200 mg L−1, 30 °C, pH 9, 160 rpm rotation speed).
Sustainability 14 15560 g001
Figure 2. Effects of temperature on cyanide biodegradation (A) and bacterial growth (B) (initial CN concentration of 200 mg L−1, pH 9, 16 h incubation time, 160 rpm rotation speed).
Sustainability 14 15560 g002
Figure 3. Effects of pH on cyanide biodegradation (A) and bacterial growth (B) (initial CN concentration of 200 mg L−1, 30 °C, 16 h incubation time, 160 rpm rotation speed).
Sustainability 14 15560 g003
Figure 4. Effects of carbon sources on cyanide removal (initial CN concentration of 200 mg L−1, 30 °C, pH 9, 160 rpm rotation speed).
Sustainability 14 15560 g004
Figure 5. Effects of nitrogen sources on cyanide removal (initial CN concentration of 200 mg L−1, 30 °C, pH 9, 160 rpm rotation speed).
Sustainability 14 15560 g005
Figure 6. Contour plot (A) and response surface plots (B) showing the effects of the interaction between soy meal and corn flour on CN degradation.
Sustainability 14 15560 g006
Figure 7. Contour plot (A) and response surface plots (B) showing the effects of the interaction between soy meal and L-cysteine on CN degradation.
Sustainability 14 15560 g007
Figure 8. Contour plot (A) and response surface plots (B) showing the effects of the interaction between corn flour and L-cysteine on CN degradation.
Sustainability 14 15560 g008
Table 1. Biochemical reactions of isolate T1.
CharacteristicsPropertiesCharacteristicsProperties
Glucosesemi-solidagar+Melibiose
OrnithinedecarboxylaseRaffinose
LysinedecarboxylaseGlucose+
Ureaenzyme+Sucrose+
HydrogensulfideXylose+
V-Ptest+Escin+
PhenylalanineRhamnose+
Mannitol+Argininedihydrolysis
Sorbose+Nitratereduction
Sorbitol+Gramstaining+
Table 2. Experimental design using PBD for screening of effective factors for cyanide degradation.
RunVariablesDegradability
(%)
ABCDEFGH
1+1+1−1+1+1+1−1−195.7
2−1+1+1−1+1+1+1−159
3+1−1+1+1−1+1+1+180.8
4−1+1−1+1+1−1+1+172.1
5−1−1+1−1+1+1−1+187.7
6−1−1−1+1−1+1+1−163.5
7+1−1−1−1+1−1+1+150.6
8+1+1−1−1−1+1−1+157.5
9+1+1+1−1−1−1+1−143.3
10−1+1+1+1−1−1−1+167
11+1−1+1+1+1−1−1−196.2
12−1−1−1−1−1−1−1−137.1
A: pH at 10 (−1) and 8 (+1), B: inoculum amount at 6 (−1) and 10% (+1), C: L-methionine at 0.6 (−1) and 1% (+1), D: L-cysteine at 0.6 (−1) and 1% (+1), E: corn flour at 0.75 (−1) and 1.25% (+1), F: soy meal at 0.75 (−1) and 1.25% (+1), G: soy flour at 0.75 (−1) and 1.25% (+1), H: glucose at 0.75 (−1) and 1.25% (+1).
Table 3. Analysis of variance of Plackett–Burman design experiments.
VariablesCoefficientF Valuep ValueRanking
pH3.142.930.18566
Inoculum amount −1.770.930.40507
L-methionine4.796.810.07975
L-cysteine 11.6840.430.00791 **
Corn flour9.3425.880.01472 *
Soy meal 6.4912.500.03853 *
Soy flour −5.9910.650.04704 *
Glucose1.740.900.41288
* p < 0.05, ** p < 0.01.
Table 4. Ranges of the variables as analyzed by CCD.
FactorVariablesRange
Examined
Levels
−α−10+1
X1Soy meal (%)0.5–1.50.50.7511.251.5
X2Corn flour (%)0.5–1.50.50.7511.251.5
X3L-cysteine (%)0.4–1.20.40.60.81.01.2
Table 5. Experimental design and results for the optimization of the cyanide degradation conditions using a central composite design.
RunSoy Meal (%) Corn Flour (%)L-Cysteine (%)Degradability (%)
10.750.750.633.7
21.250.750.651.9
30.751.250.643.4
41.251.250.661.2
50.750.751.045.9
61.250.751.072.3
70.751.251.077
81.251.251.091
90.510.837.7
101.510.875
1110.50.850.1
1211.50.870.9
13110.463.4
14111.288.7
15110.863
16110.867
17110.863
18110.860
19110.866
20110.867
Table 6. Analysis of variance for the fitted quadratic polynomial model.
Term ModelSum of SquaresDFMean SquareF Valuep Value
Model4221.619469.0721.04<0.0001
X11417.4111417.4163.57<0.0001
X2788.661788.6635.370.0001
X31405.5911405.5963.04<0.0001
X12210.791210.799.450.0117
X2280.08180.083.590.0873
X32142.141142.146.370.0301
X1X220.48120.480.920.3605
X1X32.4212.420.110.7486
X2X3118.581118.585.320.0438
Residual222.981022.30
Lack of fit183.65536.734.670.580
Pure error39.3357.87
Cor. total4444.6019
Table 7. CN degradation efficiency of A. viridans T1 under the optimal conditions.
Soybean Meal (%)Corn Flour (%)L-Cysteine (%)CN Degradation (%)
1.111.51.297.3 ± 2.56
Publisher’s Note: MDPI stays neutral with regard to jurisdictional claims in published maps and institutional affiliations.

