
Identification of Machine Learning Relevant Energy and Resource Manufacturing Efficiency Levers


Abstract
:1. Introduction
1.1. Motivation
1.2. Approach and Objective
1.3. Current State of Research
2. Energy and Resource Efficiency Levers
2.1. Energy and Resource Efficiency Levers Table
2.2. Deep Dive on Each of the Levers
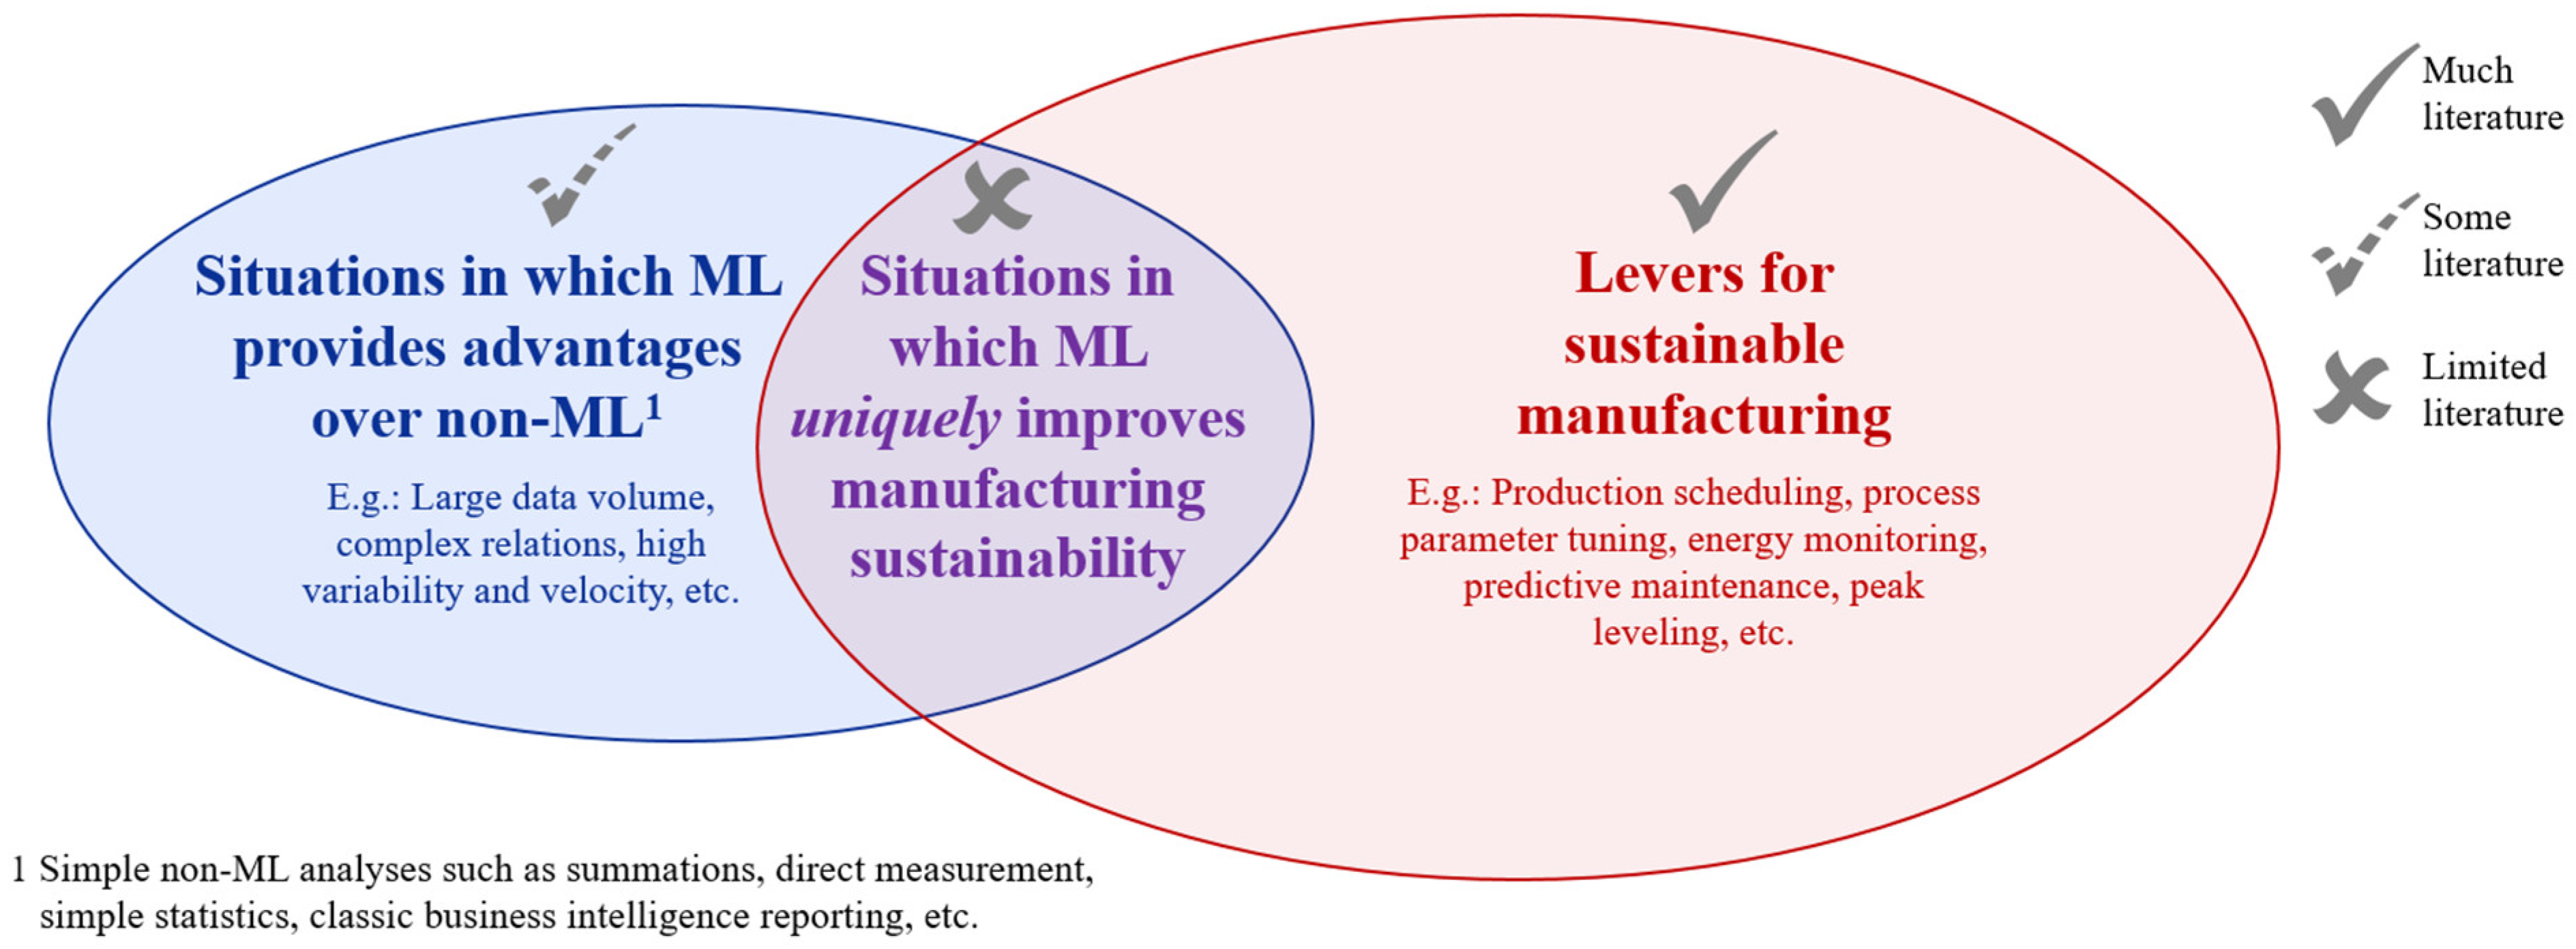
3. Pro-ML Situations
3.1. List of Pro-ML Manufacturing Situations
- High dimensional data: Problems and datasets with many features, i.e., the data to be analyzed has high variety.
- Highly dynamic data: When conditions are continuously changing and the system requires adaptation, i.e., the data to be analyzed has high velocity.
- Complex interactions: When output quality and quantity have high variability due to complex interactions of production parameters and these interactions need to be interpreted, i.e., when the system to be analyzed contains complex interactions.
- Correlation not explanation: When process and parameter correlations need to be determined but not necessarily explained or fundamentally understood, i.e., if the goal is to identify and model patterns in a dataset, rather than to create an explicit formula or deterministic model.
- Difficult to capture features: When interesting process or product features cannot feasibly be captured with conventional sensors principles, i.e., when process can only be observed visually or acoustically, and further processing is needed in order to gain useful insights.
- Self-learning: When existing data are to be analyzed without specific requirements or instructions, i.e., when the analysis should learn on its own.
- High dimensional data: Problems and datasets with many features, i.e., the data to be analyzed have high variety.
- 2.
- Highly dynamic data: When conditions are continuously changing and the system requires adaptation, i.e., the data to be analyzed has high velocity.
- 3.
- Complex interactions: When output quality and quantity have high variability due to complex interactions of production parameters and these interactions need to be interpreted, i.e., when the system to be analyzed contains complex interactions.
- 4.
- Correlation not explanation: When process and parameter correlations need to be determined but not necessarily explained or fundamentally understood, i.e., if the goal is to identify and model patterns in a dataset, rather than to create an explicit formula or deterministic model.
- 5.
- Difficult to capture data: When interesting process or product features cannot feasibly be captured with conventional sensors principles, i.e., when processes can only be observed visually or acoustically, and further processing is needed in order to gain useful insights.
- 6.
- Self-learning: When existing data are to be analyzed without specific requirements or instructions, i.e., when the analysis should learn on its own.
4. Results—Situations in Which ML Can Improve Manufacturing Energy and Resource Efficiency
4.1. Methodology Explanation
4.2. Results and Discussion
4.2.1. Operation Parameters and Input Material Optimization
4.2.2. Intelligent Maintenance
4.2.3. Production Scheduling and In- and Outbound Logistics Optimization
4.2.4. Comparison with Existing Studies
5. Conclusions
5.1. Summary
5.2. Implications of the Study
5.3. Limitations
5.4. Future Research Activities
Author Contributions
Funding
Institutional Review Board Statement
Informed Consent Statement
Data Availability Statement
Conflicts of Interest
Appendix A

| Manufacturing Domain | ID | Energy and Resource (E&R) Efficiency Lever | Conditions for Machine Learning | Literature Used for Count |
|---|---|---|---|---|
| Count | ||||
| Product Design | 1 | E&R efficient design (optimized for production, use, or end-of-life) | 3 | [10,63,64,65] |
| 2 | Integrated product life cycle data management for strategic E&R decision support | 0 | ||
| Manufacturing Systems | 3 | Operation parameters optimization to improve process E&R efficiency | 5 | [53,63] |
| 4 | Input materials optimization (use less materials or use sustainable materials) | 5 | [46,52] | |
| 5 | E&R consumption monitoring | 1 | [54,66] | |
| 6 | Waste heat utilization/energy recovery systems | 0 | ||
| 7 | Quality control for wasted material and scrap | 4 | [39,54,67,68] | |
| 8 | Energy product tags for holistic value chain improvements | 1 | [69] | |
| 9 | Advanced automation and controls for process precision and stability | 1 | [70] | |
| Logistics | 10 | E&R efficient production scheduling | 4 | [61,71] |
| 11 | Efficient shop floor layout to minimize transport and waiting | 1 | [72] | |
| 12 | In- and outbound logistics timing to optimize E&R efficiency of production and product delivery | 4 | [73] | |
| Maintenance | 13 | Intelligent maintenance to avoid downtime and extend equipment lifetime | 6 | [54,55,74] |
| 14 | Remote services to avoid travel | 0 | ||
| Plant Energy and Resource Mgmt. | 15 | Renewable energy sources | 1 | [75] |
| 16 | Optimized technical building services (TBS) | 0 | ||
| 17 | Capture and controlled disposal of waste, hazardous substances, and emissions | 0 | ||
| Recycling | 18 | Remanufacturing | 0 |
References
- IEA. Tracking Industry 2020. Available online: https://www.iea.org/reports/tracking-industry-2020 (accessed on 17 March 2021).
- Rathi, R.; Sabale, D.B.; Antony, J.; Kaswan, M.S.; Jayaraman, R. An Analysis of Circular Economy Deployment in Developing Nations’ Manufacturing Sector: A Systematic State-of-the-Art Review. Sustainability 2022, 14, 11354. [Google Scholar] [CrossRef]
- Rathi, R.; Kaswan, M.S.; Garza-Reyes, J.A.; Antony, J.; Cross, J. Green Lean Six Sigma for improving manufacturing sustainability: Framework development and validation. J. Clean. Prod. 2022, 345, 131130. [Google Scholar] [CrossRef]
- Lago, J.; De Ridder, F.; De Schutter, B. Forecasting spot electricity prices: Deep learning approaches and empirical comparison of traditional algorithms. Appl. Energy 2018, 221, 386–405. [Google Scholar] [CrossRef]
- Makridakis, S.; Spiliotis, E.; Assimakopoulos, V. Statistical and Machine Learning forecasting methods: Concerns and ways forward. PLoS ONE 2018, 13, e0194889. [Google Scholar] [CrossRef] [PubMed] [Green Version]
- Bzdok, D.; Altman, N.; Krzywinski, M. Statistics versus machine learning. Nat. Methods 2018, 15, 233–234. [Google Scholar] [CrossRef]
- Máša, V.; Stehlík, P.; Touš, M.; Vondra, M. Key pillars of successful energy saving projects in small and medium industrial enterprises. Energy 2018, 158, 293–304. [Google Scholar] [CrossRef]
- Kenett, R.S.; Zonnenshain, A.; Fortuna, G. A road map for applied data sciences supporting sustainability in advanced manufacturing: The information quality dimensions. Procedia Manuf. 2018, 21, 141–148. [Google Scholar] [CrossRef]
- Renna, P.; Materi, S. A Literature Review of Energy Efficiency and Sustainability in Manufacturing Systems. Appl. Sci. 2021, 11, 7366. [Google Scholar] [CrossRef]
- Luque, A.; Heras, A.D.L.; Ávila-Gutiérrez, M.J.; Zamora-Polo, F. ADAPTS: An Intelligent Sustainable Conceptual Framework for Engineering Projects. Sensors 2020, 20, 1553. [Google Scholar] [CrossRef] [Green Version]
- Cioffi, R.; Travaglioni, M.; Piscitelli, G.; Petrillo, A.; De Felice, F. Artificial Intelligence and Machine Learning Applications in Smart Production: Progress, Trends, and Directions. Sustainability 2020, 12, 492. [Google Scholar] [CrossRef]
- Jamwal, A.; Agrawal, R.; Sharma, M.; Kumar, A.; Kumar, V.; Garza-Reyes, J.A.A. Machine learning applications for sustainable manufacturing: A bibliometric-based review for future research. J. Enterp. Inf. Manag. 2021, 35, 566–596. [Google Scholar] [CrossRef]
- Cooper, W.W.; Leavitt, H.J. New Perspectivies in Organization Research; Wiley: New York, NY, USA, 1964. [Google Scholar]
- May, G.; Stahl, B.; Taisch, M. Energy management in manufacturing: Toward eco-factories of the future—A focus group study. Appl. Energy 2016, 164, 628–638. [Google Scholar] [CrossRef]
- Penty, J. Product Design and Sustainability: Strategies, Tools, and Practice, 1st ed.; Routledge: London, UK, 2019. [Google Scholar]
- Garetti, M.; Taisch, M. Sustainable manufacturing: Trends and research challenges. Prod. Plan. Control. 2012, 23, 83–104. [Google Scholar] [CrossRef]
- Omar, M.; Qilun, Z.; Lujia, F.; Ali, A.A.; Lahjouji, D.; Khraisheh, M. A hybrid simulation approach for predicting energy flows in production lines. Int. J. Sustain. Eng. 2015, 9, 25–34. [Google Scholar] [CrossRef]
- ISO 50006. Energy Management Systems. Measuring Energy Performance Using Energy Baselines (EnB) and Energy Performance Indicators (EnPI): General Principles and Guidance 27.015 Energy Efficiency. Energy Conservation in General. International Organization for Standardization: Geneva, Switzerland, 2014.
- Mori, M.; Fujishima, M.; Inamasu, Y.; Oda, Y. A study on energy efficiency improvement for machine tools. CIRP Ann. 2011, 60, 145–148. [Google Scholar] [CrossRef]
- Duflou, J.R.; Sutherland, J.W.; Dornfeld, D.; Herrmann, C.; Jeswiet, J.; Kara, S.; Hauschild, M.Z.; Kellens, K. Towards energy and resource efficient manufacturing: A processes and systems approach. CIRP Ann. 2012, 61, 587–609. [Google Scholar] [CrossRef] [Green Version]
- Abele, E.; Panten, N.; Menz, B. Data Collection for Energy Monitoring Purposes and Energy Control of Production Machines. Procedia CIRP 2015, 29, 299–304. [Google Scholar] [CrossRef]
- Energy.gov. Waste Heat Recovery Resource Page. 2022. Available online: https://www.energy.gov/eere/amo/articles/waste-heat-recovery-resource-page (accessed on 17 January 2022).
- Forni, D.; Di Santo, D.; Vescovo, R.; Baresi, M. Industrial excess heat exploitation in energy intensive industries. ECEEE Ind. Summer Study Proc. 2016, 2016, 543–553. [Google Scholar]
- Batayneh, M.; Marie, I.; Asi, I. Use of selected waste materials in concrete mixes. Waste Manag. 2007, 27, 1870–1876. [Google Scholar] [CrossRef]
- Singh, S.; Ramakrishna, S.; Gupta, M.K. Towards zero waste manufacturing: A multidisciplinary review. J. Clean. Prod. 2017, 168, 1230–1243. [Google Scholar] [CrossRef]
- Gahm, C.; Denz, F.; Dirr, M.; Tuma, A. Energy-efficient scheduling in manufacturing companies: A review and research framework. Eur. J. Oper. Res. 2016, 248, 744–757. [Google Scholar] [CrossRef]
- Fahad, M.; Naqvi, S.A.A.; Atir, M.; Zubair, M.; Shehzad, M.M. Energy Management in a Manufacturing Industry through Layout Design. Procedia Manuf. 2017, 8, 168–174. [Google Scholar] [CrossRef]
- Wehner, J. Energy Efficiency in Logistics: An Interactive Approach to Capacity Utilisation. Sustainability 2018, 10, 1727. [Google Scholar] [CrossRef] [Green Version]
- Kaczmarek, M.-J.; Gola, A. Maintenance 4.0 Technologies for Sustainable Manufacturing—An Overview. IFAC-PapersOnLine 2019, 52, 91–96. [Google Scholar] [CrossRef]
- Schulz, J.; Leinmüller, D.; Misik, A.; Zaeh, M. Renewable On-Site Power Generation for Manufacturing Companies—Technologies, Modeling, and Dimensioning. Sustainability 2021, 13, 3898. [Google Scholar] [CrossRef]
- Deutscher Industrie- und Handelskammertag e.V. Energiewende-Barometer 2021 der IHK-Organisation: Unterneh-Mensumfrage zur Umsetzung der Energiewende; Deutscher Industrie- und Handelskammertag e. V.: Berlin, Germany, 2021. [Google Scholar]
- Bons, M.; Creutzburg, P.; Schlemme, J. Energiewende in der Industrie: Potenziale und Wechselwirkungen mit dem Ener-Giesektor. Identifikation neuer Anforderungen aus Zukünftigem; Navigant Energy Germany GmbH: Köln, Germany, 2020. [Google Scholar]
- Gao, K.; Huang, Y.; Sadollah, A.; Wang, L. A review of energy-efficient scheduling in intelligent production systems. Complex Intell. Syst. 2020, 6, 237–249. [Google Scholar] [CrossRef] [Green Version]
- Hall, F.; Greeno, R. Building Services Handbook, 9th ed.; Routledge: London, UK, 2017. [Google Scholar]
- Chadderton, D.; Chadderton, D.V. Building Services Engineering; Routledge: London, UK, 2004. [Google Scholar]
- Banerjee, R.; Gong, Y.; Gielen, D.J.; Januzzi, G.; Maréchal, F.; McKane, A.T.; Rosen, M.A.; van Es, D.; Worrell, E. Chapter 8—Energy End Use: Industry; Cambridge University Press: Cambridge, UK, 2012. [Google Scholar]
- Energetics, Inc. Energy Loss Reduction and Recovery in Industrial Energy Systems: Technology Roadmap. For the U.S. Department of Energy of Renewable Energy, Industrial Technologies Program; Energetics, Inc.: Columbia, MD, USA, 2004. [Google Scholar]
- Posselt, G.; Fischer, J.; Heinemann, T.; Thiede, S.; Alvandi, S.; Weinert, N.; Kara, S.; Herrmann, C. Extending Energy Value Stream Models by the TBS Dimension—Applied on a Multi Product Process Chain in the Railway Industry. Procedia CIRP 2014, 15, 80–85. [Google Scholar] [CrossRef] [Green Version]
- Wuest, T.; Weimer, D.; Irgens, C.; Thoben, K.-D. Machine learning in manufacturing: Advantages, challenges, and applications. Prod. Manuf. Res. 2016, 4, 23–45. [Google Scholar] [CrossRef] [Green Version]
- Cherkassky, V.; Ma, Y. Practical selection of SVM parameters and noise estimation for SVM regression. Neural Netw. 2004, 17, 113–126. [Google Scholar] [CrossRef] [Green Version]
- Amini, M.; Chang, S. A review of machine learning approaches for high dimensional process monitoring. In Proceedings of the IISE Annual Conference and Expo, Orlando, FL, USA, 19–22 May 2018; Volume 3, pp. 1695–1700. [Google Scholar]
- Monostori, L. AI and machine learning techniques for managing complexity, changes and uncertainties in manufacturing. Eng. Appl. Artif. Intell. 2003, 16, 277–291. [Google Scholar] [CrossRef]
- Liu, B. Lifelong machine learning: A paradigm for continuous learning. Front. Comput. Sci. 2017, 11, 359–361. [Google Scholar] [CrossRef]
- Shang, C.; You, F. Data Analytics and Machine Learning for Smart Process Manufacturing: Recent Advances and Perspectives in the Big Data Era. Engineering 2019, 5, 1010–1016. [Google Scholar] [CrossRef]
- Ziekow, H.; Schreier, U.; Gerling, A.; Saleh, A. Interpretable Machine Learning for Quality Engineering in Manufacturing-Importance Measures that Reveal Insights on Errors. In Proceedings of the Upper-Rhine Artificial Intelligence Symposium, UR-AI 2021, Artificial Intelligence-Application in Life Sciences and Beyond, Kaiserslautern, Germany, 27 October 2021; pp. 96–105. [Google Scholar]
- Alvela Nieto, M.T.; Nabati, E.G.; Bode, D.; Redecker, M.A.; Decker, A.; Thoben, K.D. Enabling Energy Efficiency in Manufacturing Environments Through Deep Learning Approaches: Lessons Learned. In Advances in Production Management Systems: Production Management for the Factory of the Future. In Proceedings of the IFIP WG 5.7 International Conference, APMS 2019, Austin, TX, USA, 1–5 September 2019. Part II; Ameri, F., Stecke, K., von Cieminski, G., Kiritsis, D., Eds.; Springer: Cham, Switzerland, 2019; Volume 567, pp. 567–574. [Google Scholar]
- Kubat, M. Unsupervised Learning. In An Introduction to Machine Learning; Springer International Publishing: Cham, Switzerland, 2009; pp. 297–325. [Google Scholar]
- Kubat, M. An Introduction to Machine Learning; Springer International Publishing: Cham, Switzerland, 2009. [Google Scholar]
- Kang, Z.; Catal, C.; Tekinerdogan, B. Machine learning applications in production lines: A systematic literature review. Comput. Ind. Eng. 2020, 149, 106773. [Google Scholar] [CrossRef]
- Saputri, T.R.D.; Lee, S.-W. The Application of Machine Learning in Self-Adaptive Systems: A Systematic Literature Review. IEEE Access 2020, 8, 205948–205967. [Google Scholar] [CrossRef]
- Kubat, M. Deep Learning. In An Introduction to Machine Learning; Springer International Publishing: Cham, Switzerland, 2021; pp. 327–351. [Google Scholar]
- Chiang, L.H.; Braatz, R.D. Process monitoring using causal map and multivariate statistics: Fault detection and identification. Chemom. Intell. Lab. Syst. 2003, 65, 159–178. [Google Scholar] [CrossRef]
- Degot, C.; Hutschinson, R.; Duranton, S.; Lyons, M.; Maher, H. Use AI to Measure Emissions—Exhaustively, Accurately, and Frequently. 2021. Available online: https://www.bcg.com/publications/2021/measuring-emissions-accurately (accessed on 21 January 2022).
- Ge, Z.; Song, Z.; Ding, S.X.; Huang, B. Data Mining and Analytics in the Process Industry: The Role of Machine Learning. IEEE Access 2017, 5, 20590–20616. [Google Scholar] [CrossRef]
- Cinar, Z.M.; Abdussalam Nuhu, A.; Zeeshan, Q.; Korhan, O.; Asmael, M.; Safaei, B. Machine Learning in Predictive Maintenance towards Sustainable Smart Manufacturing in Industry 4.0. Sustainability 2020, 12, 8211. [Google Scholar] [CrossRef]
- Falamarzi, A.; Moridpour, S.; Nazem, M.; Cheraghi, S. Prediction of tram track gauge deviation using artificial neural network and support vector regression. Aust. J. Civ. Eng. 2019, 17, 63–71. [Google Scholar] [CrossRef]
- Sampaio, G.S.; Filho, A.R.D.A.V.; da Silva, L.S.; da Silva, L.A. Prediction of Motor Failure Time Using An Artificial Neural Network. Sensors 2019, 19, 4342. [Google Scholar] [CrossRef] [Green Version]
- Li, Y.; Carabelli, S.; Fadda, E.; Manerba, D.; Tadei, R.; Terzo, O. Machine learning and optimization for production rescheduling in Industry 4.0. Int. J. Adv. Manuf. Technol. 2020, 110, 2445–2463. [Google Scholar] [CrossRef]
- Talbi, E.-G. Metaheuristics: From Design to Implementation; Wiley: Oxford, UK, 2009. [Google Scholar]
- Talbi, E.-G. Machine Learning into Metaheuristics. ACM Comput. Surv. 2022, 54, 1–32. [Google Scholar] [CrossRef]
- Takeda-Berger, S.L.; Frazzon, E.M.; Broda, E.; Freitag, M. Machine Learning in Production Scheduling: An Overview of the Academic Literature. In Dynamics in Logistics; Freitag, M., Haasis, H.D., Kotzab, H., Pannek, J., Eds.; Springer International Publishing: Cham, Switzerland, 2020; pp. 409–419. [Google Scholar]
- Knoll, D.; Prüglmeier, M.; Reinhart, G. Predicting Future Inbound Logistics Processes Using Machine Learning. Procedia CIRP 2016, 52, 145–150. [Google Scholar] [CrossRef] [Green Version]
- D’Amico, B.; Myers, R.; Sykes, J.; Voss, E.; Cousins-Jenvey, B.; Fawcett, W.; Richardson, S.; Kermani, A.; Pomponi, F. Machine Learning for Sustainable Structures: A Call for Data. Structures 2019, 19, 1–4. [Google Scholar] [CrossRef]
- Wisthoff, A.; Ferrero, V.; Huynh, T.; DuPont, B. Quantifying the Impact of Sustainable Product Design Decisions in the Early Design Phase Through Machine Learning. In Proceedings of the 21st Design for Manufacturing and the Life Cycle Conference; 10th International Conference on Micro- and Nanosystems: Presented at ASME 2016 International Design Engineering Technical Conferences and Computers and Information in Engineering Conference, Charlotte, NC, USA, 21–24 August 2016; The American Society of Mechanical Engineers: New York, NY, USA, 2016. [Google Scholar]
- DeRousseau, M.; Kasprzyk, J.; Srubar, W. Computational design optimization of concrete mixtures: A review. Cem. Concr. Res. 2018, 109, 42–53. [Google Scholar] [CrossRef]
- Kadlec, P.; Gabrys, B.; Strandt, S. Data-driven Soft Sensors in the process industry. Comput. Chem. Eng. 2009, 33, 795–814. [Google Scholar] [CrossRef] [Green Version]
- Monostori, L.; Hornyák, J.; Egresits, C.; Viharos, Z.J. Soft computing and hybrid AI approaches to intelligent manufacturing. In Tasks and Methods in Applied Artificial Intelligence. In Proceedings of the 11th International Conference on Industrial and Engineering Applications of Artificial Intelligence and Expert Systems IEA-98-AIE, Benicássim, Spain, 1–4 June 1998; Del Pobil, A.P., Mira, J., Ali, M., Eds.; Springer: New York, NY, USA, 1998; Volume 1416, pp. 765–774. [Google Scholar]
- Pham, D.T.; Afify, A.A. Machine-learning techniques and their applications in manufacturing. Proc. Inst. Mech. Eng. Part B J. Eng. Manuf. 2005, 219, 395–412. [Google Scholar] [CrossRef]
- Adisorn, T.; Tholen, L.; Götz, T. Towards a Digital Product Passport Fit for Contributing to a Circular Economy. Energies 2021, 14, 2289. [Google Scholar] [CrossRef]
- Saadallah, A.; Finkeldey, F.; Morik, K.; Wiederkehr, P. Stability prediction in milling processes using a simulation-based Machine Learning approach. Procedia CIRP 2018, 72, 1493–1498. [Google Scholar] [CrossRef]
- Zhang, J.; Ding, G.; Zou, Y.; Qin, S.; Fu, J. Review of job shop scheduling research and its new perspectives under Industry 4.0. J. Intell. Manuf. 2019, 30, 1809–1830. [Google Scholar] [CrossRef]
- Tayal, A.; Kose, U.; Solanki, A.; Nayyar, A.; Saucedo, J.A.M. Efficiency analysis for stochastic dynamic facility layout problem using meta-heuristic, data envelopment analysis and machine learning. Comput. Intell. 2020, 36, 172–202. [Google Scholar] [CrossRef]
- Govindaiah, S.; Petty, M.D. Applying Reinforcement Learning to Plan Manufacturing Material Handling Part 1. In Proceedings of the 2019 ACM Southeast Conference, Kennesaw, GA, USA, 18–20 April 2019; Lo, D., Ed.; ACM: New York, NY, USA, 2019; pp. 168–171. [Google Scholar]
- Yan, J.; Meng, Y.; Lu, L.; Li, L. Industrial Big Data in an Industry 4.0 Environment: Challenges, Schemes, and Applications for Predictive Maintenance. IEEE Access 2017, 5, 23484–23491. [Google Scholar] [CrossRef]
- Dietrich, B.; Walther, J.; Weigold, M.; Abele, E. Machine learning based very short term load forecasting of machine tools. Appl. Energy 2020, 276, 115440. [Google Scholar] [CrossRef]
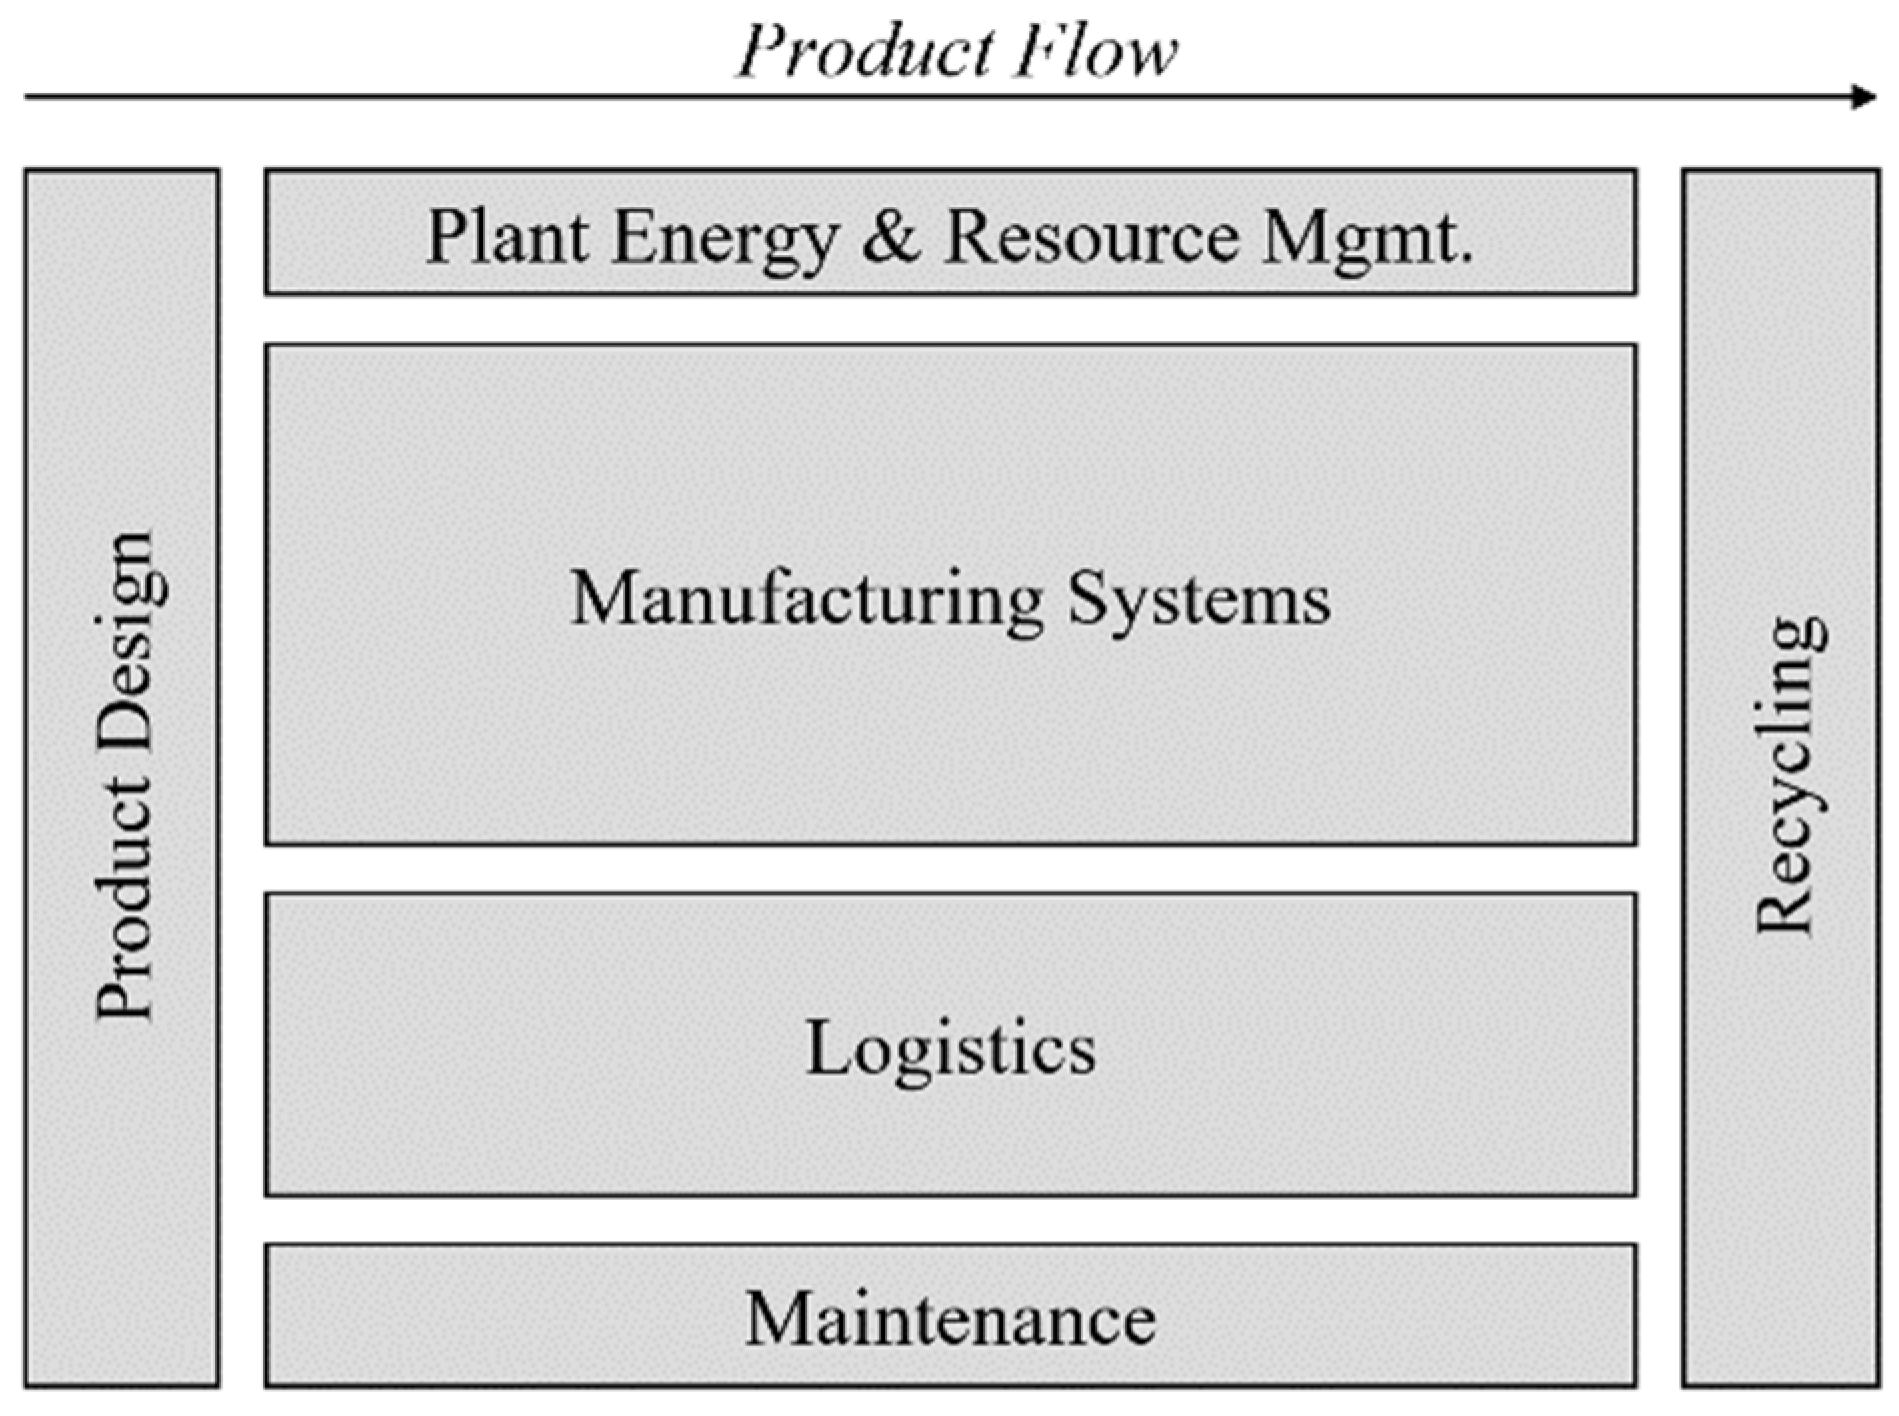
| Manufacturing Domain | Domain Description | ID | Energy and Resource (E&R) Efficiency Lever |
|---|---|---|---|
| Product Design | Designing the product is the first step in the production process. This domain includes all activities associated with product design, such as determining functionality, form factor, and materials. | 1 | E&R efficient design (optimized for production, use, or end-of-life) |
| 2 | Integrated product life cycle data management for strategic E&R decision support | ||
| Manufacturing Systems | The manufacturing systems domain includes all processes and machinery used to manufacture the product. | 3 | Operation parameters optimization to improve process E&R efficiency |
| 4 | Input materials optimization (use less materials or use sustainable materials) | ||
| 5 | E&R consumption monitoring | ||
| 6 | Waste heat utilization/energy recovery systems | ||
| 7 | Quality control for wasted material and scrap | ||
| 8 | Energy product tags for holistic value chain improvements | ||
| 9 | Advanced automation and controls for process precision and stability | ||
| Logistics | The logistics domain consists of the logistics within the plant (shop floor and inventories) as well as at the plant boundaries (incoming and outgoing). | 10 | E&R efficient production scheduling |
| 11 | Efficient shop floor layout to minimize transport and waiting | ||
| 12 | In- and outbound logistics timing to optimize E&R efficiency of production and product delivery | ||
| Maintenance | The maintenance domain includes all maintenance activities within the plant as well as outside of the plant for in-use products. | 13 | Intelligent maintenance to avoid downtime and extend equipment lifetime |
| 14 | Remote services to avoid travel | ||
| Plant Energy and Resource Mgmt. | The plant E&R management domain includes the overall facilitation of energy to the plant, the usage by the building, as well as handling of manufacturing byproducts. | 15 | Renewable energy sources |
| 16 | Optimized technical building services (TBS) | ||
| 17 | Capture and controlled disposal of waste, hazardous substances, and emissions | ||
| Recycling | The recycling domain consists of activities aimed toward incorporating used products and materials back into the production process. | 18 | Remanufacturing |
| Manufacturing Domain | Domain Description | ID | Energy and Resource (E&R) Efficiency Lever | Lever Description |
|---|---|---|---|---|
| Product Design | Designing the product is the first step in the production process. This domain includes all activities associated with product design, such as determining functionality, form factor, and materials. | 1 | E&R efficient design (optimized for production, use, or end-of-life) | Designing a product with E&R efficiency in mind can have significant impact on not only the E&R needed to produce the product but also on that which was consumed during the use and end-of-life stages of the product. Product design plays a major role in the realization of circular economy and upgradeable products, which are two trending topics in industry and academia [2]. Design features can include product form, material, and intended functionality to name a few [15]. |
| 2 | Integrated product life cycle data management for strategic E&R decision support | The integration of product life cycle management software with product sustainability data can give companies a comprehensive decision support platform for product management and business model strategy that takes into account environmental practices [16]. | ||
| Manufacturing Systems | The manufacturing systems domain includes all processes and machinery used to manufacture the product. | 3 | Operation parameters optimization to improve process E&R efficiency | The selection of operating parameters can have significant impact on the E&R efficiency of a process. Examples include setting the cutting conditions (cutting speed, feed rate, and cutting depth) of a mill to reduce energy while maintaining surface quality and tool life or setting the temperature, feed rate, fuel supply, and combustion air of a melting furnace [17,18,19]. The complexity of this lever can vary significantly depending on the amount of significant operating parameters in the processes. |
| 4 | Input materials optimization (use less materials or use sustainable materials) | Optimizing input materials essentially consists of reducing the amount of resource intensive or environmentally harmful inputs, either by using fewer inputs in general or by replacing inputs with more sustainable ones. In discrete machining processes, resources, such as lubricants, compressed air, and processes gases, are consumed and have substantial environmental impact. Duflou et al. list several approaches to reduce lubricant consumption or to use environmentally benign lubricants [20]. Compared to discrete manufacturing, process industries typically deal with higher volumes and variety of input materials. Here, this lever can play a very significant role. | ||
| 5 | E&R consumption monitoring | As Abele et al. point out, monitoring energy and resource consumption data can play a large role in the discovery of significant energy users, identification energy-relevant parameters, and improving the personnel’s overall awareness of energy and resource consumption [21]. Consumption monitoring is often a prerequisite for more advanced data-driven E&R efficiency approaches, as this provides the data basis on which the analyses can be performed. | ||
| 6 | Waste heat utilization/energy recovery systems | Waste heat utilization is an important lever in heat-intensive industries, such as the cement, refractory, glass, steel, and other metallurgy industries. It is estimated that 20 to 50% of industrial energy input is lost as waste heat in the form of hot exhaust gases, cooling water, and heat lost from hot equipment surfaces and heated products, according to the US Office of Energy Efficiency and Renewable Energy [22]. Forni et al. list a variety of methods for heat recovery in different processes. They highlight the challenge that investments to enable this lever typically have very high capital costs [23]. | ||
| 7 | Quality control for wasted material and scrap | This lever includes reduction in and prevention of waste (see waste hierarchy framework by Batayneth et al. [24]. The other two dimensions, “re-use waste” and “recycle waste”, are covered in the recycling lever in this table). Scrap reduction is often a priority of lean and six sigma methods, such as DMAIC (define, measure, analyze, improve, and control). Wasteful processes, such as ones where unnecessary energy and resources are consumed or large numbers of defects and rework occur, are identified and improved. Technological approaches include upgrading machinery so that less scrap is produced. Singh et al. demonstrate a variety of these methods [25]. Improving quality control through technology as well as processes is a way of reducing wasted material due to defects. | ||
| 8 | Energy product tags for holistic value chain improvements | As Garetti et al. point out, tracking the energy consumed to produce individual products along the manufacturing process is a valuable information basis for manufacturers, as well as stakeholders along the entire value chain. With this transparency at the product level, improvements in the energy efficiency of the manufacturing process can be identified more effectively than if energy consumption is only available at a higher granularity level, such as the factory level. Beyond the manufacturer, the energy performance across the value chain can be increased as the transparency enables improved coordination among stakeholders [16]. | ||
| 9 | Advanced automation and controls for process precision and stability | Process precision and stability are desirable characteristics of any manufacturing process since quality and throughput are direct results. This lever is important for E&R especially in combination with the operation parameters optimization lever; even if the operating conditions and settings needed for maximum E&R efficiency are known, improvements can only be realized if the process can be controlled accordingly. Unplanned downtime and other process instabilities are undesirable from an E&R perspective since ramp-up and ramp-down usually reduces efficiency [16]. | ||
| Logistics | The logistics domain consists of the logistics within the plant (shop floor and inventories) as well as at the plant boundaries (incoming and outgoing). | 10 | E&R efficient production scheduling | Gahm et al. differentiate between supply-and-demand-side efficiency improvements through scheduling. For supply side, scheduling is used to influence the provisioning of energy. Examples of methods include time of use, critical peak pricing, real-time pricing, and load curve penalties. For demand side, scheduling is used to reduce the E&R demand. Gahm et al. differentiate between non-processing demand (E&R used without adding value to a product, such as energy demand during idle times) and processing demand (E&R used to directly transform inputs to desired outputs, such as heating a material to transform it). Along the supply-and-demand sides, Gahm et al. also differentiate whether the efficiency gains are external (total E&R demand of the factory is reduced) or internal (total E&R use stays the same, but temporal course of the demand is changed to improve overall efficiency) [26]. |
| 11 | Efficient shop floor layout to minimize transport and waiting | Improving shop floor layout can significantly improve the energy consumption of material flow throughout the factory, as well as reduce manufacturing energy consumption by reducing waiting time in which machines are running idle. For example, Fahad et al. demonstrate a reduction in energy for material flow of over 50% [27]. | ||
| 12 | In- and outbound logistics timing to optimize E&R efficiency of production and product delivery | The inbound and outbound logistics of a factory is a lever that can be difficult to use, since multiple external stakeholders (such as customers, suppliers, and logistics providers) are involved. However, energy consumption of these activities can be significant and can have potential for improvement. Wehner lists several high-level approaches, such as avoiding peak deliveries, pursuing efficient routing, and receiving fewer but fuller delivery trucks [28]. | ||
| Maintenance | The maintenance domain includes all maintenance activities within the plant as well as outside of the plant for in-use products. | 13 | Intelligent maintenance to avoid downtime and extend equipment lifetime | Advanced maintenance technology, especially concepts such as predictive maintenance, can have a variety of benefits that improve the E&R efficiency of a manufacturing system. Improved maintenance can extend equipment lifetime by doing maintenance before irreparable damage occurs. Preemptive maintenance can prevent malfunctions and help avoid unexpected downtime, which usually wastes energy and resource (especially in energy intensive processes). Intelligent maintenance strategies can improve the overall asset performance as well, by diagnosing issues that are reducing efficiency. As Garetti et al. point out, advanced maintenance strategies have clear economic benefits in addition to the environmental ones described above [16]. |
| 14 | Remote services to avoid travel | Though most often a smaller component of a manufacturers E&R footprint, travel to conduct after-sales maintenance in the field is a lever that can save costs while also improving E&R efficiency. When machines are equipped with sufficient sensors, the collected data can allow for diagnosing and troubleshooting faults and failures remotely. Virtual and augmented reality solutions also are increasingly enabling effective remote maintenance. These and further examples are listed by Jasiulewicz-Kaczmarek in his review of maintenance technologies for sustainable manufacturing [29]. | ||
| Plant Energy and Resource Mgmt. | The plant E&R management domain includes the overall facilitation of energy to the plant, the usage by the building, as well as handling of manufacturing byproducts. | 15 | Renewable energy sources | Replacing non-renewable energy sources of a production system with renewable ones does not necessarily improve the E&R efficiency of the manufacturing system; however, it does improve the GHG emissions of the system, which is one, if not the primary, reason for increasing E&R efficiency. Renewable energy can be sourced either by purchasing it from the grid or by producing it locally on-site (i.e., decentral). As Schulz et al. argue, the former is typically prohibitive to manufacturers because premiums are currently charged in the market for renewable energy. The latter is becoming increasingly attractive to manufacturing companies due to rising energy prices and advancements in technology [30]. Currently, however, this lever is not widely adopted; even though over 50% of companies in Germany utilize or plan to invest in self-generation, according to the German Chamber of Commerce and Industry [31], less than 10% of this self-generated energy is renewable [32]. If a manufacturer produces renewable energy on-site and has sufficient flexibility in its production system, the production schedule can be adjusted based on current and expected energy supplies (e.g., weather forecasts), similar to lever 10 [33]. |
| 16 | Optimized technical building services (TBS) | When improving the E&R efficiency of a manufacturing system, the building shell and technical infrastructure (commonly referred to as TSB) in addition to the machinery can also play a significant role. TBS are responsible for tasks, such as temperature regulation (e.g., space and process heat), ventilation and air conditioning (e.g., exhaust air purification, air technology), power engineering (e.g., energy supply, lighting), or water supply and treatment [34,35]. A U.S. Dept. of Energy study found that on average over 45% of manufacturing energy consumption was for TBS (process heating and cooling and facilities) [36,37]. Posselt presents an extended energy value stream modelling approach to identify all TBS energy consumption points in a factory [38]. Of course, other methods, in addition to ones described in some of the levers listed above, can be used to improve the E&R efficiency of TBS. However, in this framework, TBS is highlighted as a separate lever as it is often taken for granted as an overhead cost and largely ignored in efficiency initiatives, as Posselt argues. | ||
| 17 | Capture and controlled disposal of waste, hazardous substances, and emissions | This lever addresses by-products of manufacturing processes, which can be harmful to the environment. Examples include dangerous industrial fluids that are used to stabilize or improve manufacturing processes or to clean surfaces but generate harmful emissions to the air or polluted water. A goal of good resource efficiency should be the minimization of harmful by-products. However, complete elimination is often impossible, and thus an effective management of these hazardous substances is an important lever for maximizing the E&R efficiency of a manufacturing system. Garetti et al. highlight the importance of this lever and call for research on the development of production methods, ICT solutions, and recuperation technologies to enable this lever [16]. | ||
| Recycling | The recycling domain consists of activities aimed toward incorporating used products and materials back into the production process. | 18 | Remanufacturing | This lever includes the recycling and reuse of waste material (see waste hierarchy by Batayneth [24]). As Garetti points out, remanufacturing is becoming an increasingly relevant lever, as growing regulations in many countries are beginning to dictate the implementation of remanufacturing. The optimization of remanufacturing processes is an opportunity to not only reduce the natural and material resource usage of a manufacturing system but can also reduce costs while maintaining quality [16]. Singh et al. provide a literature overview of various recycling approaches, such as mixing used plastics, steel, or ceramics into cement concrete to strengthen it or using centrifugal separation and vacuum pyrolysis for the retrieval of solder and organic materials from used circuit boards [25]. |
| Manufacturing Domain | ID | Energy and Resource (E&R) Efficiency Lever | Conditions for Machine Learning | ||||||
|---|---|---|---|---|---|---|---|---|---|
| 1. High Dimensional Data 1 | 2. Highly Dynamic Data 2 | 3. Complex Interactions 3 | 4. Correlation Not Explanation 4 | 5. Difficult to Capture Features 5 | 6. Self-Learning 6 | Count | |||
| Product Design | 1 | E&R efficient design (optimized for production, use, or end-of-life) | x | x | x | 3 | |||
| 2 | Integrated product life cycle data management for strategic E&R decision support | 0 | |||||||
| Manufacturing Systems | 3 | Operation parameters optimization to improve process E&R efficiency | x | x | x | x | x | 5 | |
| 4 | Input materials optimization (use less materials or use sustainable materials) | x | x | x | x | x | 5 | ||
| 5 | E&R consumption monitoring | x | 1 | ||||||
| 6 | Waste heat utilization/energy recovery systems | 0 | |||||||
| 7 | Quality control for wasted material and scrap | x | x | x | x | 4 | |||
| 8 | Energy product tags for holistic value chain improvements | x | 1 | ||||||
| 9 | Advanced automation and controls for process precision and stability | x | 1 | ||||||
| Logistics | 10 | E&R efficient production scheduling | x | x | x | x | 4 | ||
| 11 | Efficient shop floor layout to minimize transport and waiting | x | 1 | ||||||
| 12 | In- and outbound logistics timing to optimize E&R efficiency of production and product delivery | x | x | x | x | 4 | |||
| Maintenance | 13 | Intelligent maintenance to avoid downtime and extend equipment lifetime | x | x | x | x | x | x | 6 |
| 14 | Remote services to avoid travel | 0 | |||||||
| Plant Energy and Resource Mgmt. | 15 | Renewable energy sources | x | 1 | |||||
| 16 | Optimizing technical building services (TBS) | 0 | |||||||
| 17 | Capture and controlled disposal of waste, hazardous substances, and emissions | 0 | |||||||
| Recycling | 18 | Remanufacturing | 0 | ||||||
Publisher’s Note: MDPI stays neutral with regard to jurisdictional claims in published maps and institutional affiliations. |
© 2022 by the authors. Licensee MDPI, Basel, Switzerland. This article is an open access article distributed under the terms and conditions of the Creative Commons Attribution (CC BY) license (https://creativecommons.org/licenses/by/4.0/).
Share and Cite
Ekwaro-Osire, H.; Bode, D.; Thoben, K.-D.; Ohlendorf, J.-H. Identification of Machine Learning Relevant Energy and Resource Manufacturing Efficiency Levers. Sustainability 2022, 14, 15618. https://doi.org/10.3390/su142315618
Ekwaro-Osire H, Bode D, Thoben K-D, Ohlendorf J-H. Identification of Machine Learning Relevant Energy and Resource Manufacturing Efficiency Levers. Sustainability. 2022; 14(23):15618. https://doi.org/10.3390/su142315618
Chicago/Turabian StyleEkwaro-Osire, Henry, Dennis Bode, Klaus-Dieter Thoben, and Jan-Hendrik Ohlendorf. 2022. "Identification of Machine Learning Relevant Energy and Resource Manufacturing Efficiency Levers" Sustainability 14, no. 23: 15618. https://doi.org/10.3390/su142315618