Article

Slope Stability Analysis for the Phosphogypsum Stockpiles: A Case Study for the Sustainable Management of the Phosphogypsum Stacks in Aqaba Jordan

by
Dima A. Husein Malkawi
1,*,
Abdallah I. Husein Malkawi
2 and
Khaldoon A. Bani-Hani
2
1
Department of Civil and Environmental Engineering, School of Natural Resources Engineering and Management, German Jordanian University, Amman 11180, Jordan
2
Department of Civil Engineering, College of Engineering, Fahad bin Sultan University, On Leave from Jordan University of Science and Technology, Tabuk 47721, Saudi Arabia
*
Author to whom correspondence should be addressed.
Sustainability 2022, 14(23), 15763; https://doi.org/10.3390/su142315763
Submission received: 3 October 2022 / Revised: 4 November 2022 / Accepted: 22 November 2022 / Published: 26 November 2022
(This article belongs to the Section Sustainable Management)

Abstract

:
The process of making phosphates fertilizer involves taking the soft rock phosphate and mixing it with sulphuric acid. This process creates a gypsum by-product (phosphogypsum). Although gypsum is a widely used material in the construction industry, most of the produced phosphogypsum is not processed around the world and is stacked into large piles over the land, especially near coastal areas, which raised concerns about their stability. Such a disposal scheme creates man-made slopes in the surrounding areas which are prone to failure, which represents a common challenge for engineers. A slope failure will lead to a significant risk not only to human lives and activities but to the topographic and geological location of the stacks. In this paper, the geotechnical properties of the phosphogypsum in Aqaba, Jordan are determined and embankment stability analysis is carried out, as the purpose of this study is to evaluate the phosphogypsum stockpiles’ stability, and therefore, avoid any possible environmental disasters. Limit equilibrium methods and finite element methods were utilized in the analysis of this study. The required topographic and geological characteristics were obtained during the site visits and the contour plot of each phosphogypsum pile was produced by the Jordan Phosphate Mines Company (JPMC). Several laboratory tests were conducted to estimate the geotechnical properties of the stacked material due to the limited information on the Jordanian Phosphogypsum characteristics. Based on the results of this study, the above-ground slopes for the stacking of Phosphogypsum in Aqaba were found to be stable under both static and earthquake loading. Therefore, this study proved that the disposal process of the current stockpiles in Aqaba is sustainably managed for providing stable stockpiles and that the process has a generally low environmental risk.

1. Introduction

Phosphogypsum is a chemical solid industrial by-product of mainly calcium sulfate dihydrate (CaSO4·2H2O) created during phosphors acid fertilizer production [1,2]. Phosphoric acid is one of the main constituents of many fertilizers [2]. Phosphogypsum is stacked on either land or in some countries it gets dumped into the sea. According to Cichy et al., 2018, about 100–280 million tons of waste phosphogypsum is produced worldwide each year [3]. About 14% of the phosphogypsum produced is reprocessed and used either in agriculture for soil amendments or as a fertilizer [4,5,6,7,8]. Also, phosphogypsum can be used in the cement industry as a building material [9,10,11,12] or in road construction [13,14]. Besides, 28% of the produced phosphogypsum is dumped into the water and about 58% of the material is stockpiled inland [15,16,17].
In general, most of the phosphogypsum material stockpiled occupies substantial land areas and is exposed to weathering conditions and, therefore, causes environmental damage and a series of safety hazards (e.g., landslide of the stockpile) since phosphogypsum contains a high level of impurities (e.g., fluoride, phosphate, sulfate, and heavy metals) [18]. As a result, phosphogypsum stockpiles pose a threat to the nearby land, water bodies, and atmosphere due to the high risk of slope failure.
A condition assessment was performed on the phosphogypsum stockpiles in Aqaba, Jordan. The phosphate industry in the city of Aqaba Jordan located along the shores of the Red Sea, approximately 15 km south of the port of Aqaba, produces annually about 3 × 10⁵ tons of phosphogypsum [19]. The present phosphogypsum stacks are dry-stacked into stockpiles in a narrow, unlined valley up to a height of 200 m. Such a disposal scheme creates man-made slopes in the surrounding areas that are prone to failure, which would signify a great pollution risk to marine life in Aqaba. Slope stability of natural slopes or human-made slopes is a common challenge for engineers. There are few models developed to study the slope stability and the safety of such slopes. The stability of slopes becomes extremely important when the slope instability results in the sliding of a huge amount of debris or soil to inhabitant areas, as this may cause a disaster.
In general, instability may result due to rainfall, an increase in the groundwater table, and a change in stress conditions [20]. Similarly, natural or man-made slopes that have been stable for many years may suddenly fail due to changes in geometry, external forces, and a loss of shear strength.
Phosphogypsum has been an object of research for many decades. Recently, there has been renewed interest in phosphogypsum usage and recycling, the concentration of trace metals, and the radioactive impurities in phosphogypsum. However, the recent growth of the phosphogypsum waste stockpile has heightened the need for a study that investigates the knowledge gap about the phosphogypsum stockpile stability. Thus, the main objective of this research study is to investigate the geotechnical properties and embankment stability analysis for phosphogypsum stockpiles in Aqaba Jordan, as well as their mechanical and geotechnical characterization. Besides, the geotechnical properties of the Aqaba phosphogypsum are determined as, up to date, Aqaba phosphogypsum properties have not been extensively investigated. The study is performed using two compatible methods. The first method is stability analysis using the limiting equilibrium method; the second will be the finite element method. These methods are used in this study and results are compared and conclusions are drawn.
The lack of evaluation of the phosphogypsum structural stability has existed as a public, environmental, and health problem for many years. A key issue is the safe disposal of phosphogypsum produced in Aqaba due to its strong acidic behavior and its harmful elements. Therefore, this study proved an important engineering management concept in the sustainability management community, as limited research studies have investigated this concept. In the last few decades, there has been a surge of interest in the effects of phosphogypsum stockpiles around the world, as scientists have been interested in the existence of these stockpiles and their environmental impact on adjacent land, water, and air. This study proved that the disposal process of the current stockpiles in Aqaba is sustainably managed to provide stable stockpiles and that low environmental risk may exist.

2. Geometric Configuration

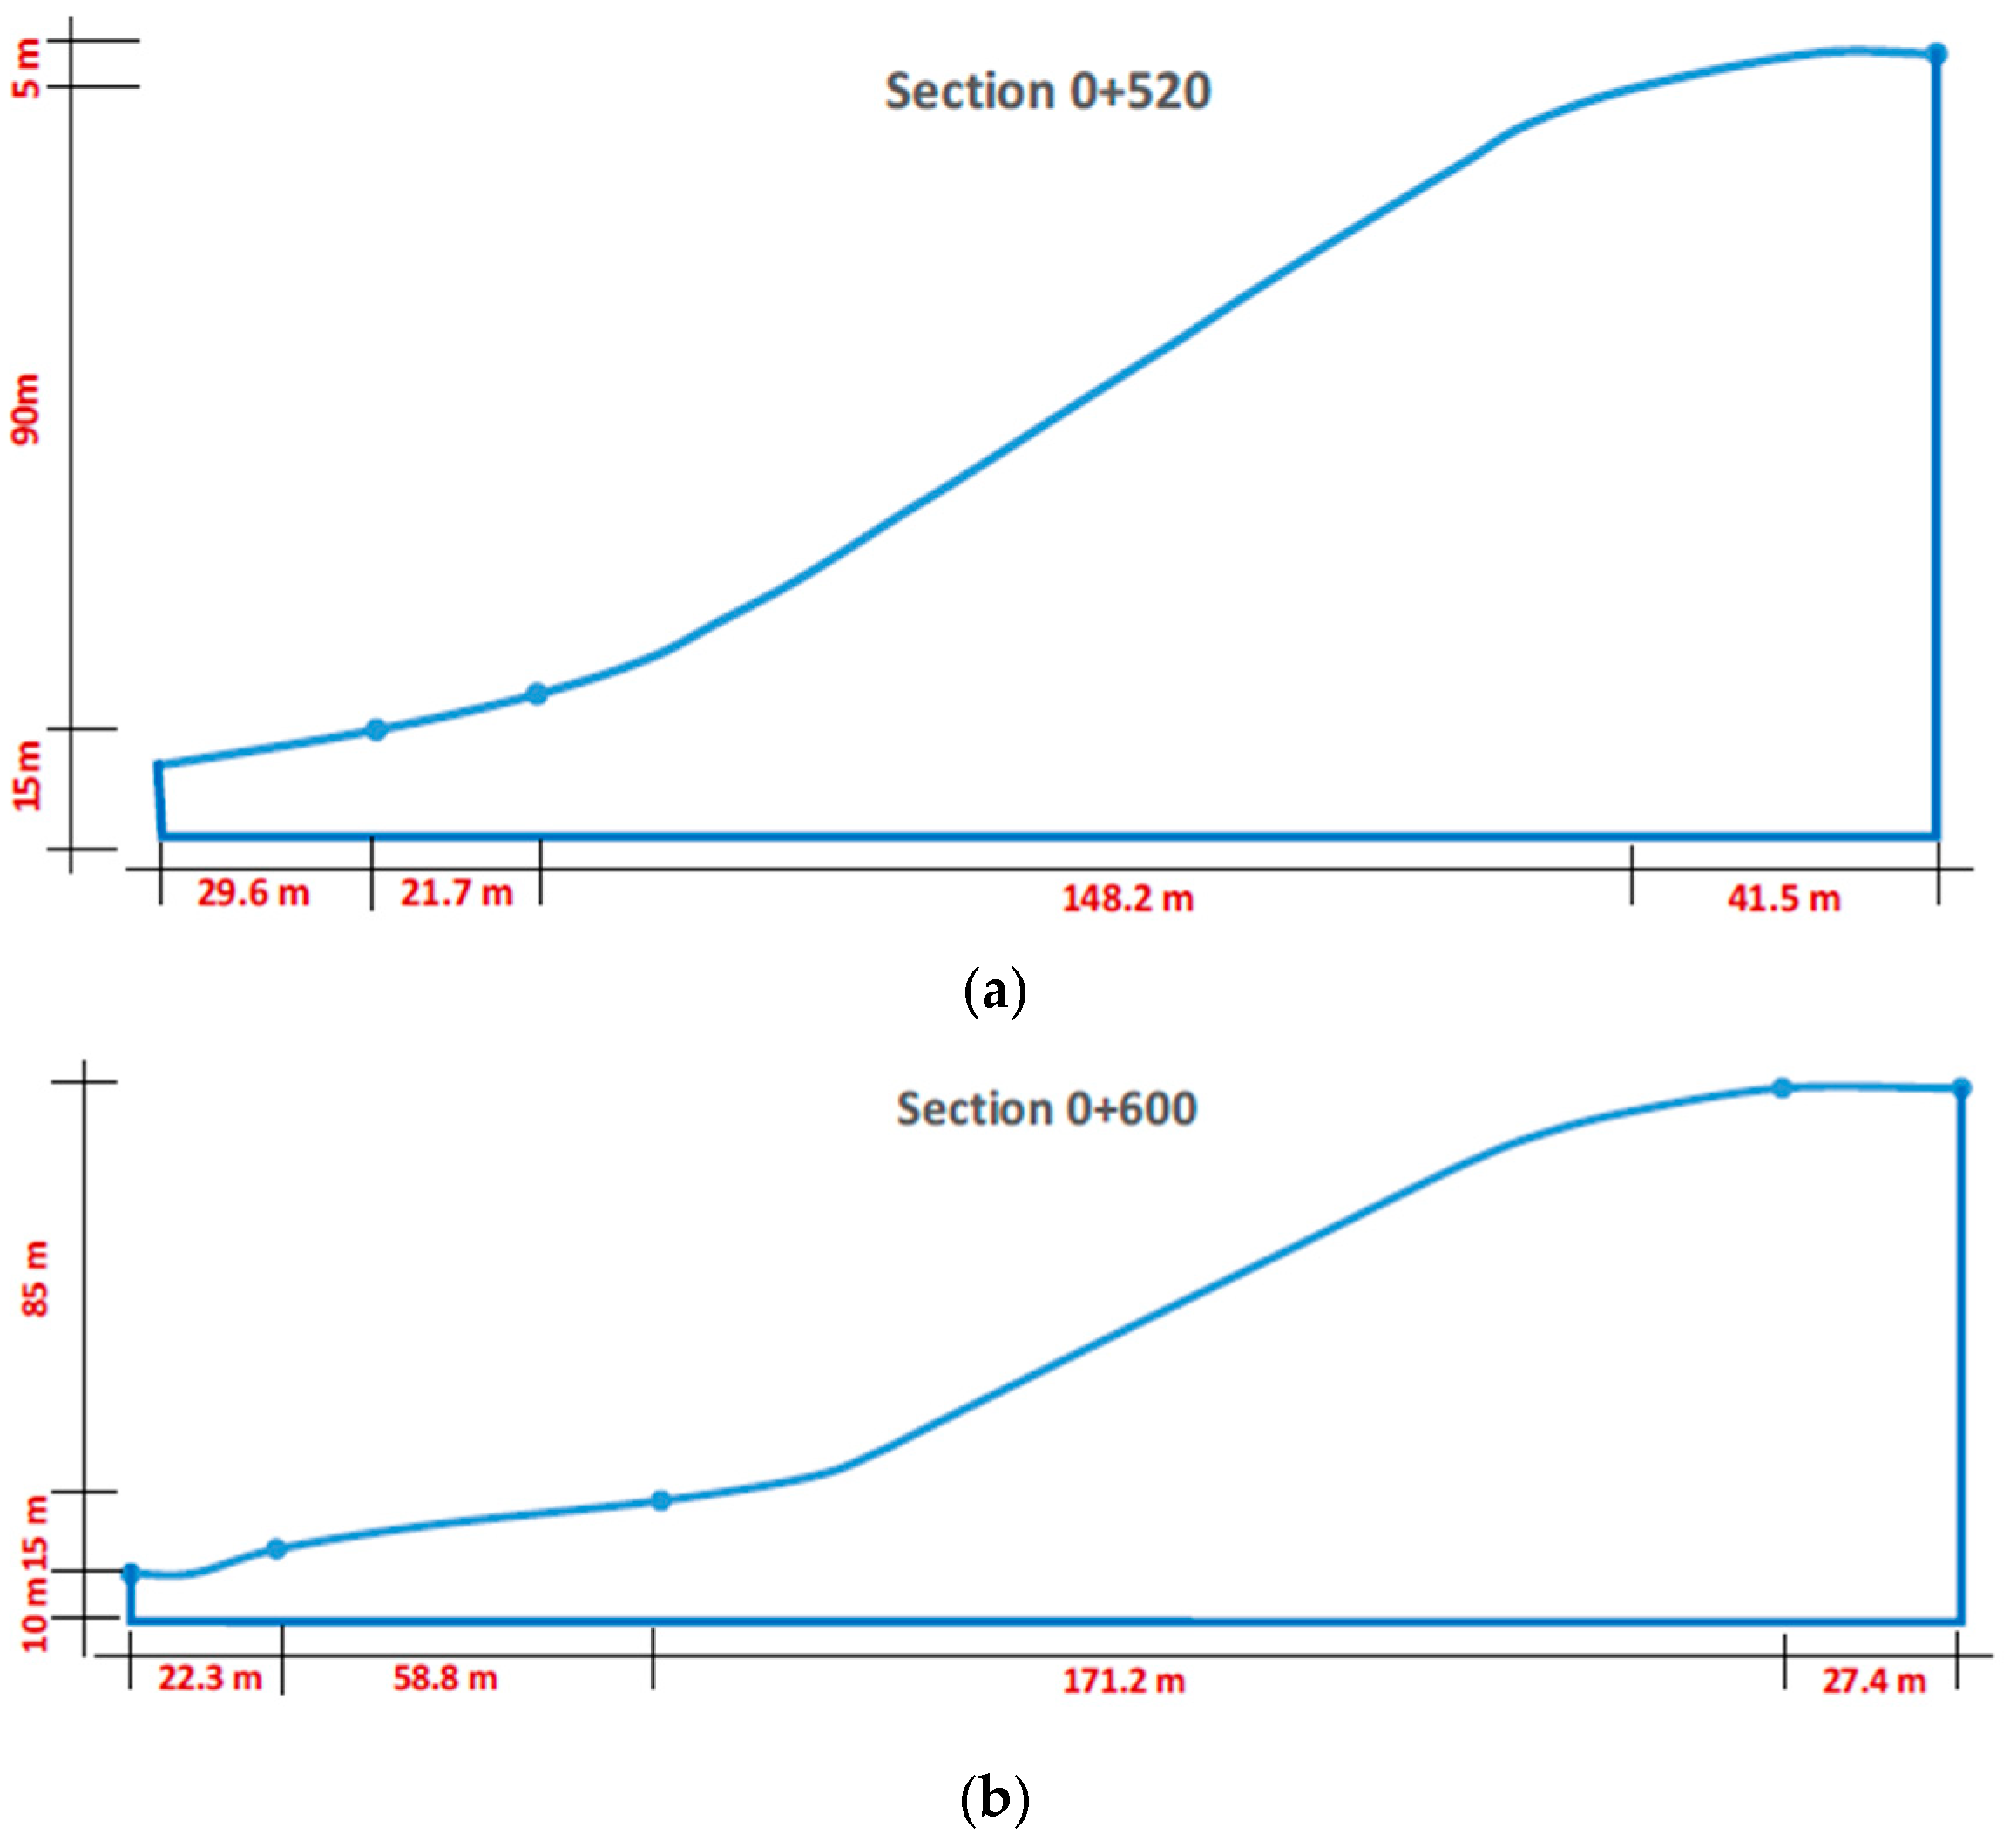
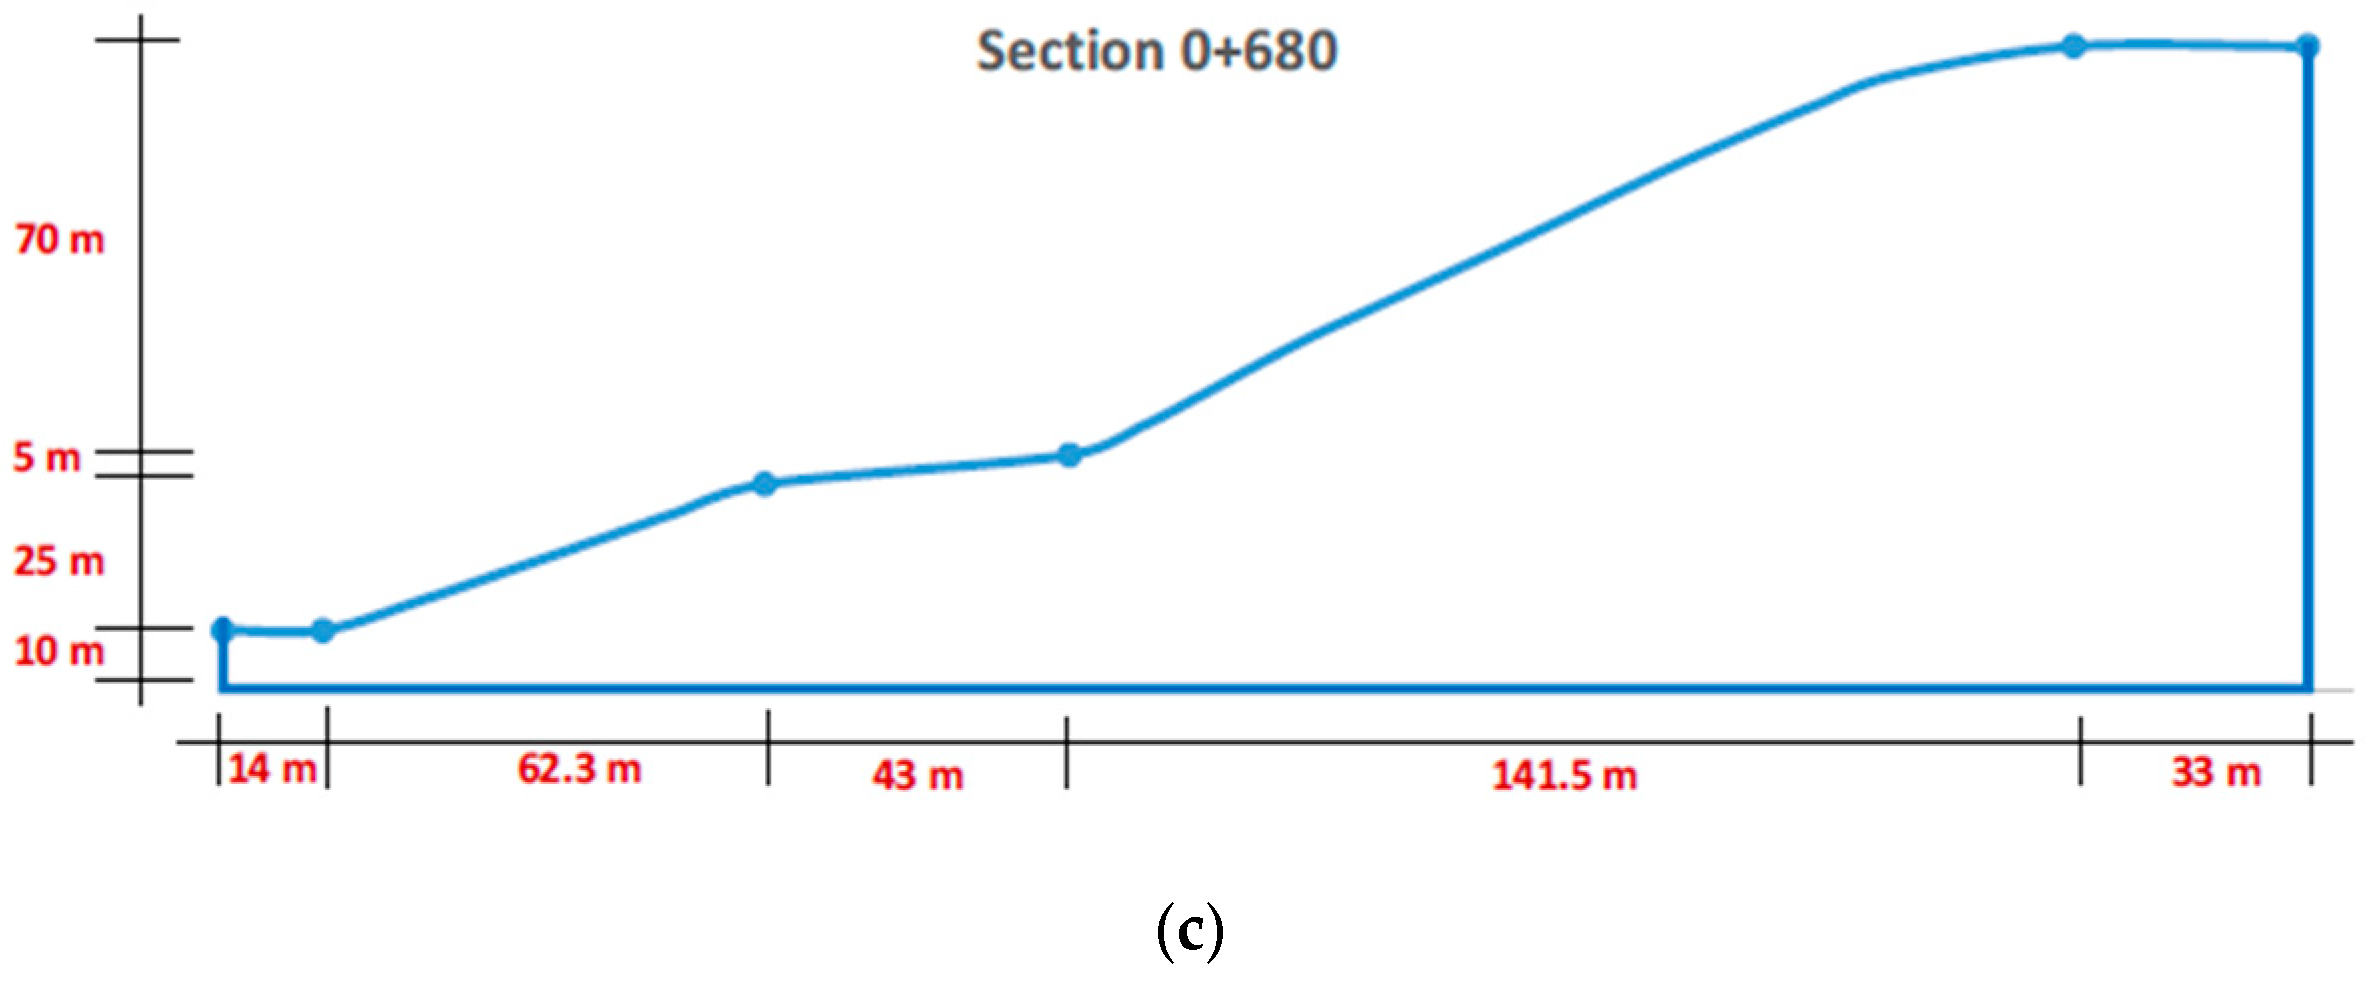
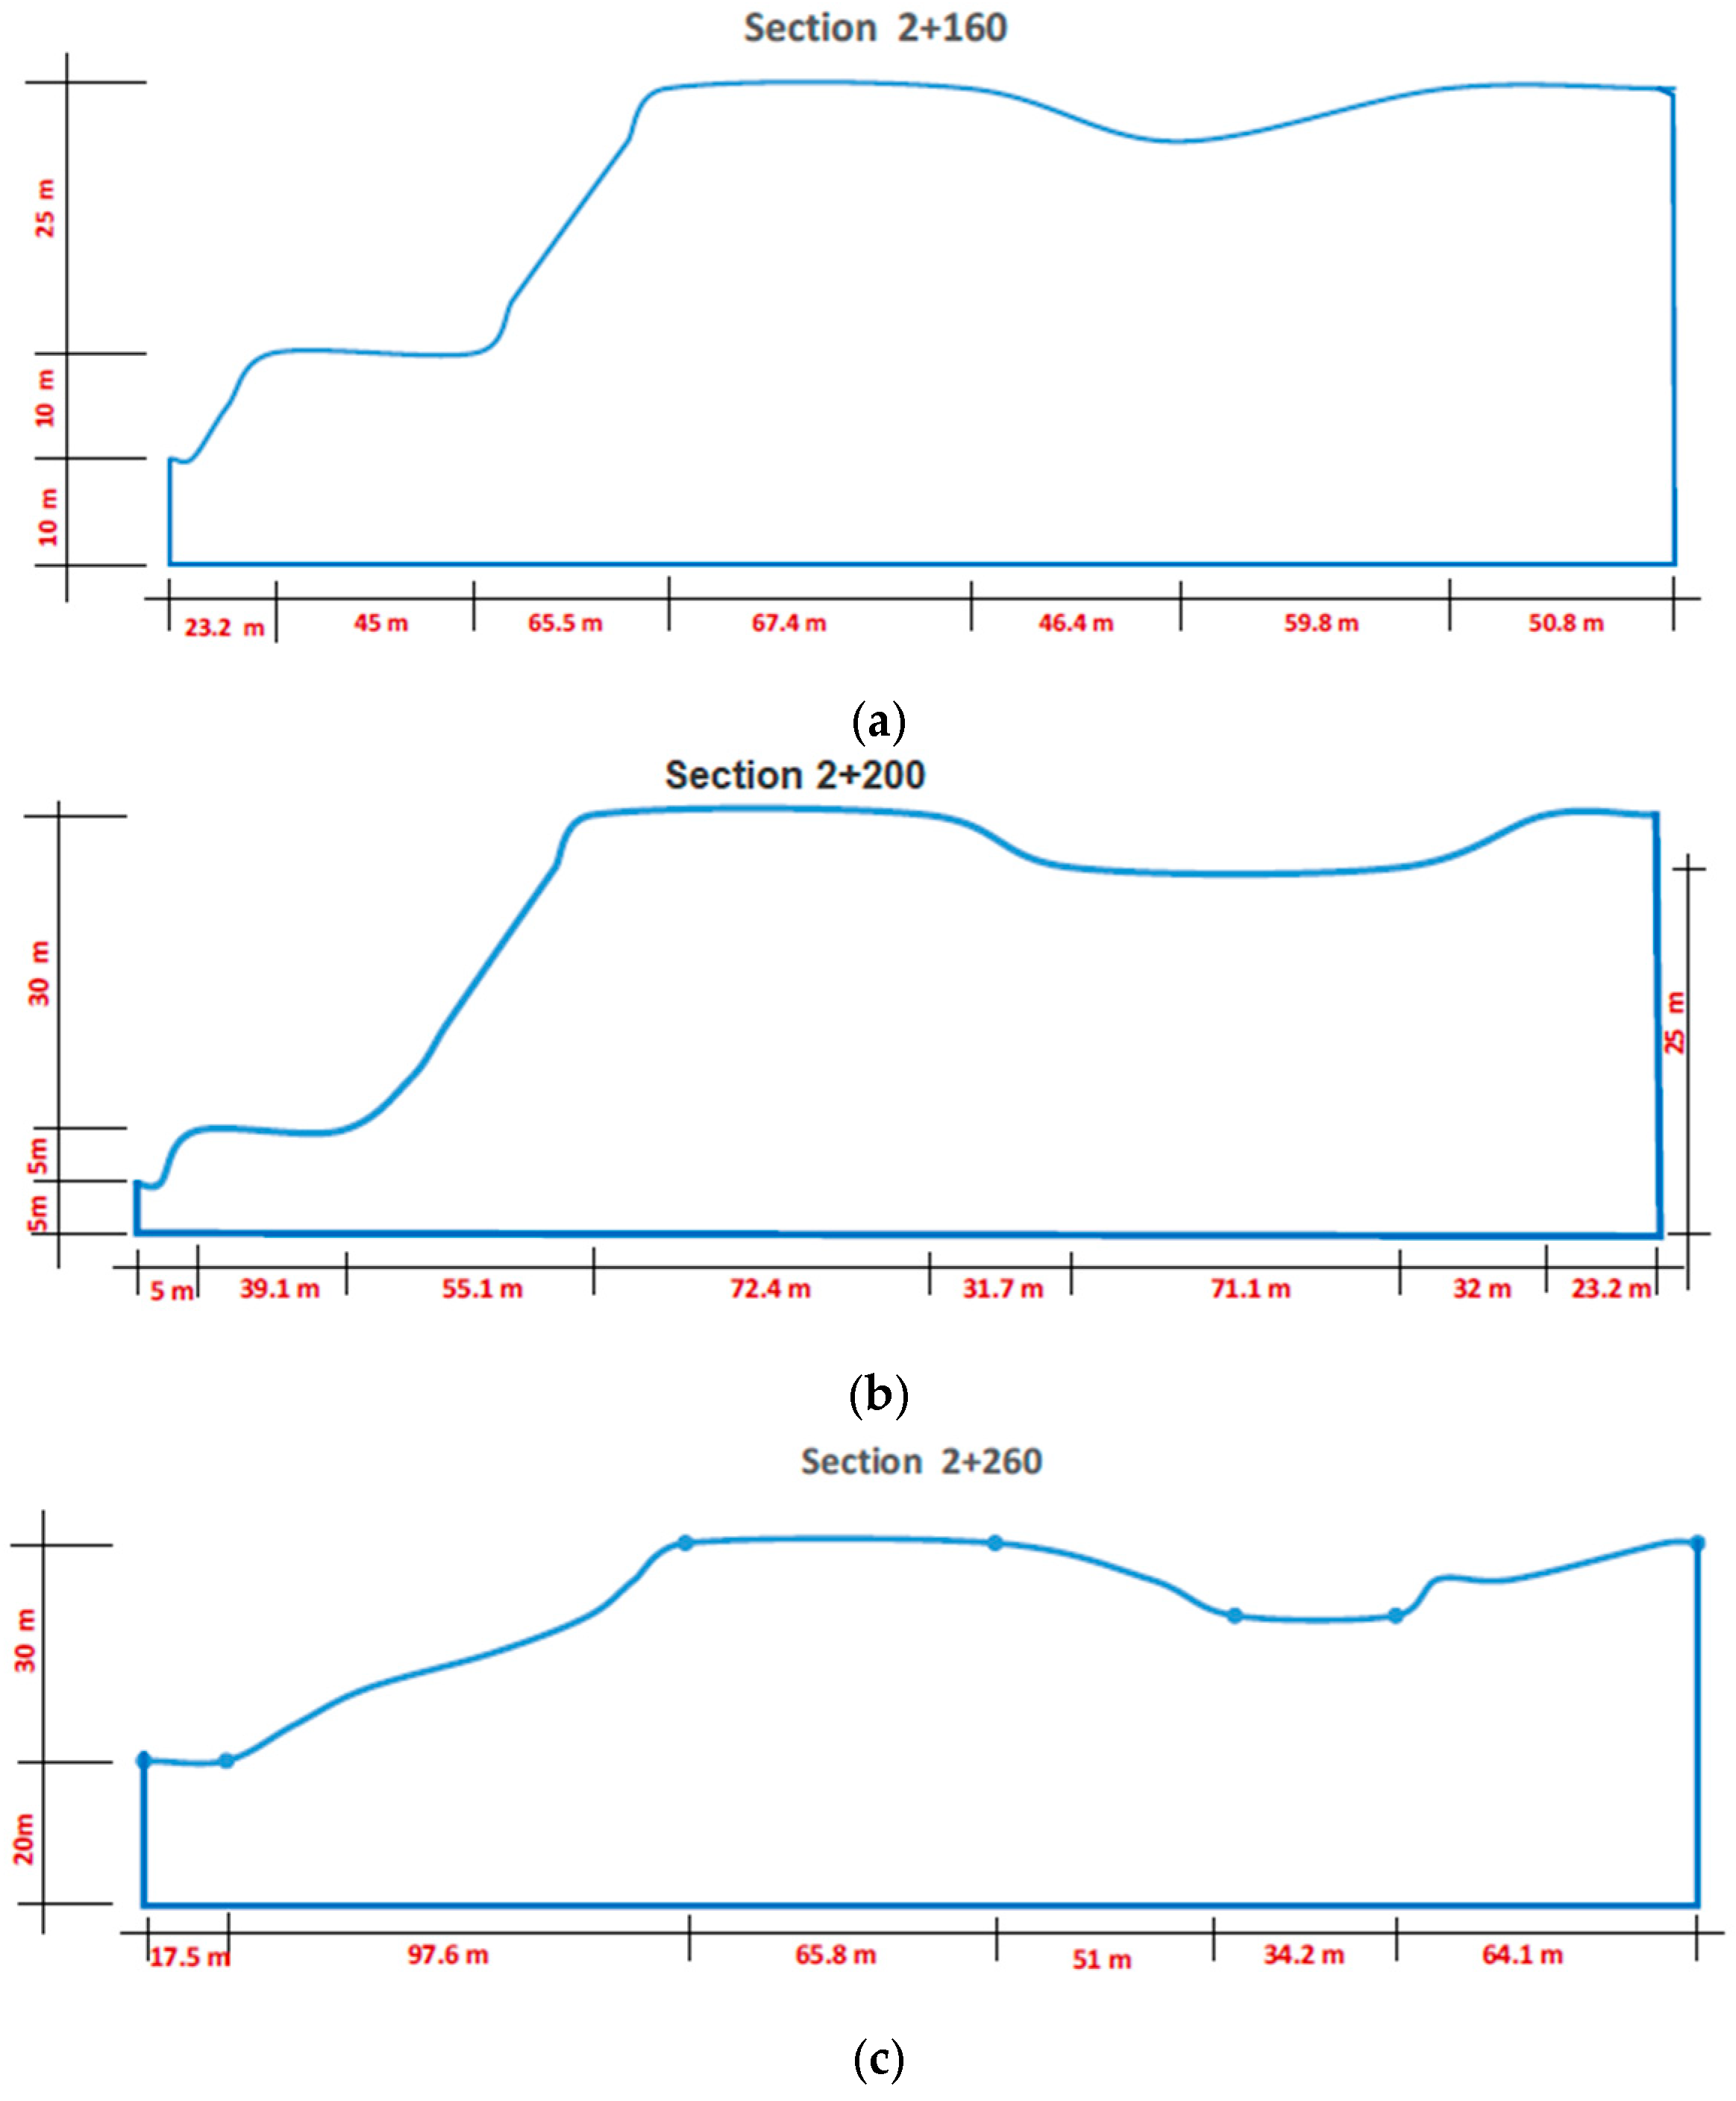
This study highlights the importance of the phosphogypsum stockpiling process, and critically examines the embankment stability of the stacked phosphogypsum in Aqaba, which might be dangerous in case of slope failure. The work performed in this study included slope stability evaluations of existing sections (i.e., South West Sections and East Sections, as shown in Figure 1). For instance, the South West Sections include three piles, piles 0 + 520, 0 + 600, and 0 + 680 (as seen in Figure 2), while the East section included piles 2 + 160, 2 + 200, and 2 + 260 (as seen in Figure 3). All of the sections were analyzed using both the limit equilibrium method and the finite element method. However, only the critical sections will be presented in detail and discussed in this paper.

3. Material Properties

The investigation conducted in this study took the form of a case study, where contemporary samples of the phosphogypsum stacked in Aqaba are characterized for their geotechnical properties. As part of this research, samples were sent to the Arab Center for Engineering Studies labs to be tested. Based on the particle size distribution shown in Figure 4, the phosphogypsum was classified as sandy elastic silt (MH) according to the soil classification system (USCS) (ASTM 2011) with 44% sand, and 55% fines. These results indicate that phosphogypsum is a fine-grain material consisting mainly of silt and sand, with 50–75% of the particles finer than 0.075 mm (sieve 200), and has a maximum size range between 0.5 to 1 mm. Moreover, plasticity characterization showed that phosphogypsum is low plastic with a liquid limit of 57% and a plastic limit of 51%.
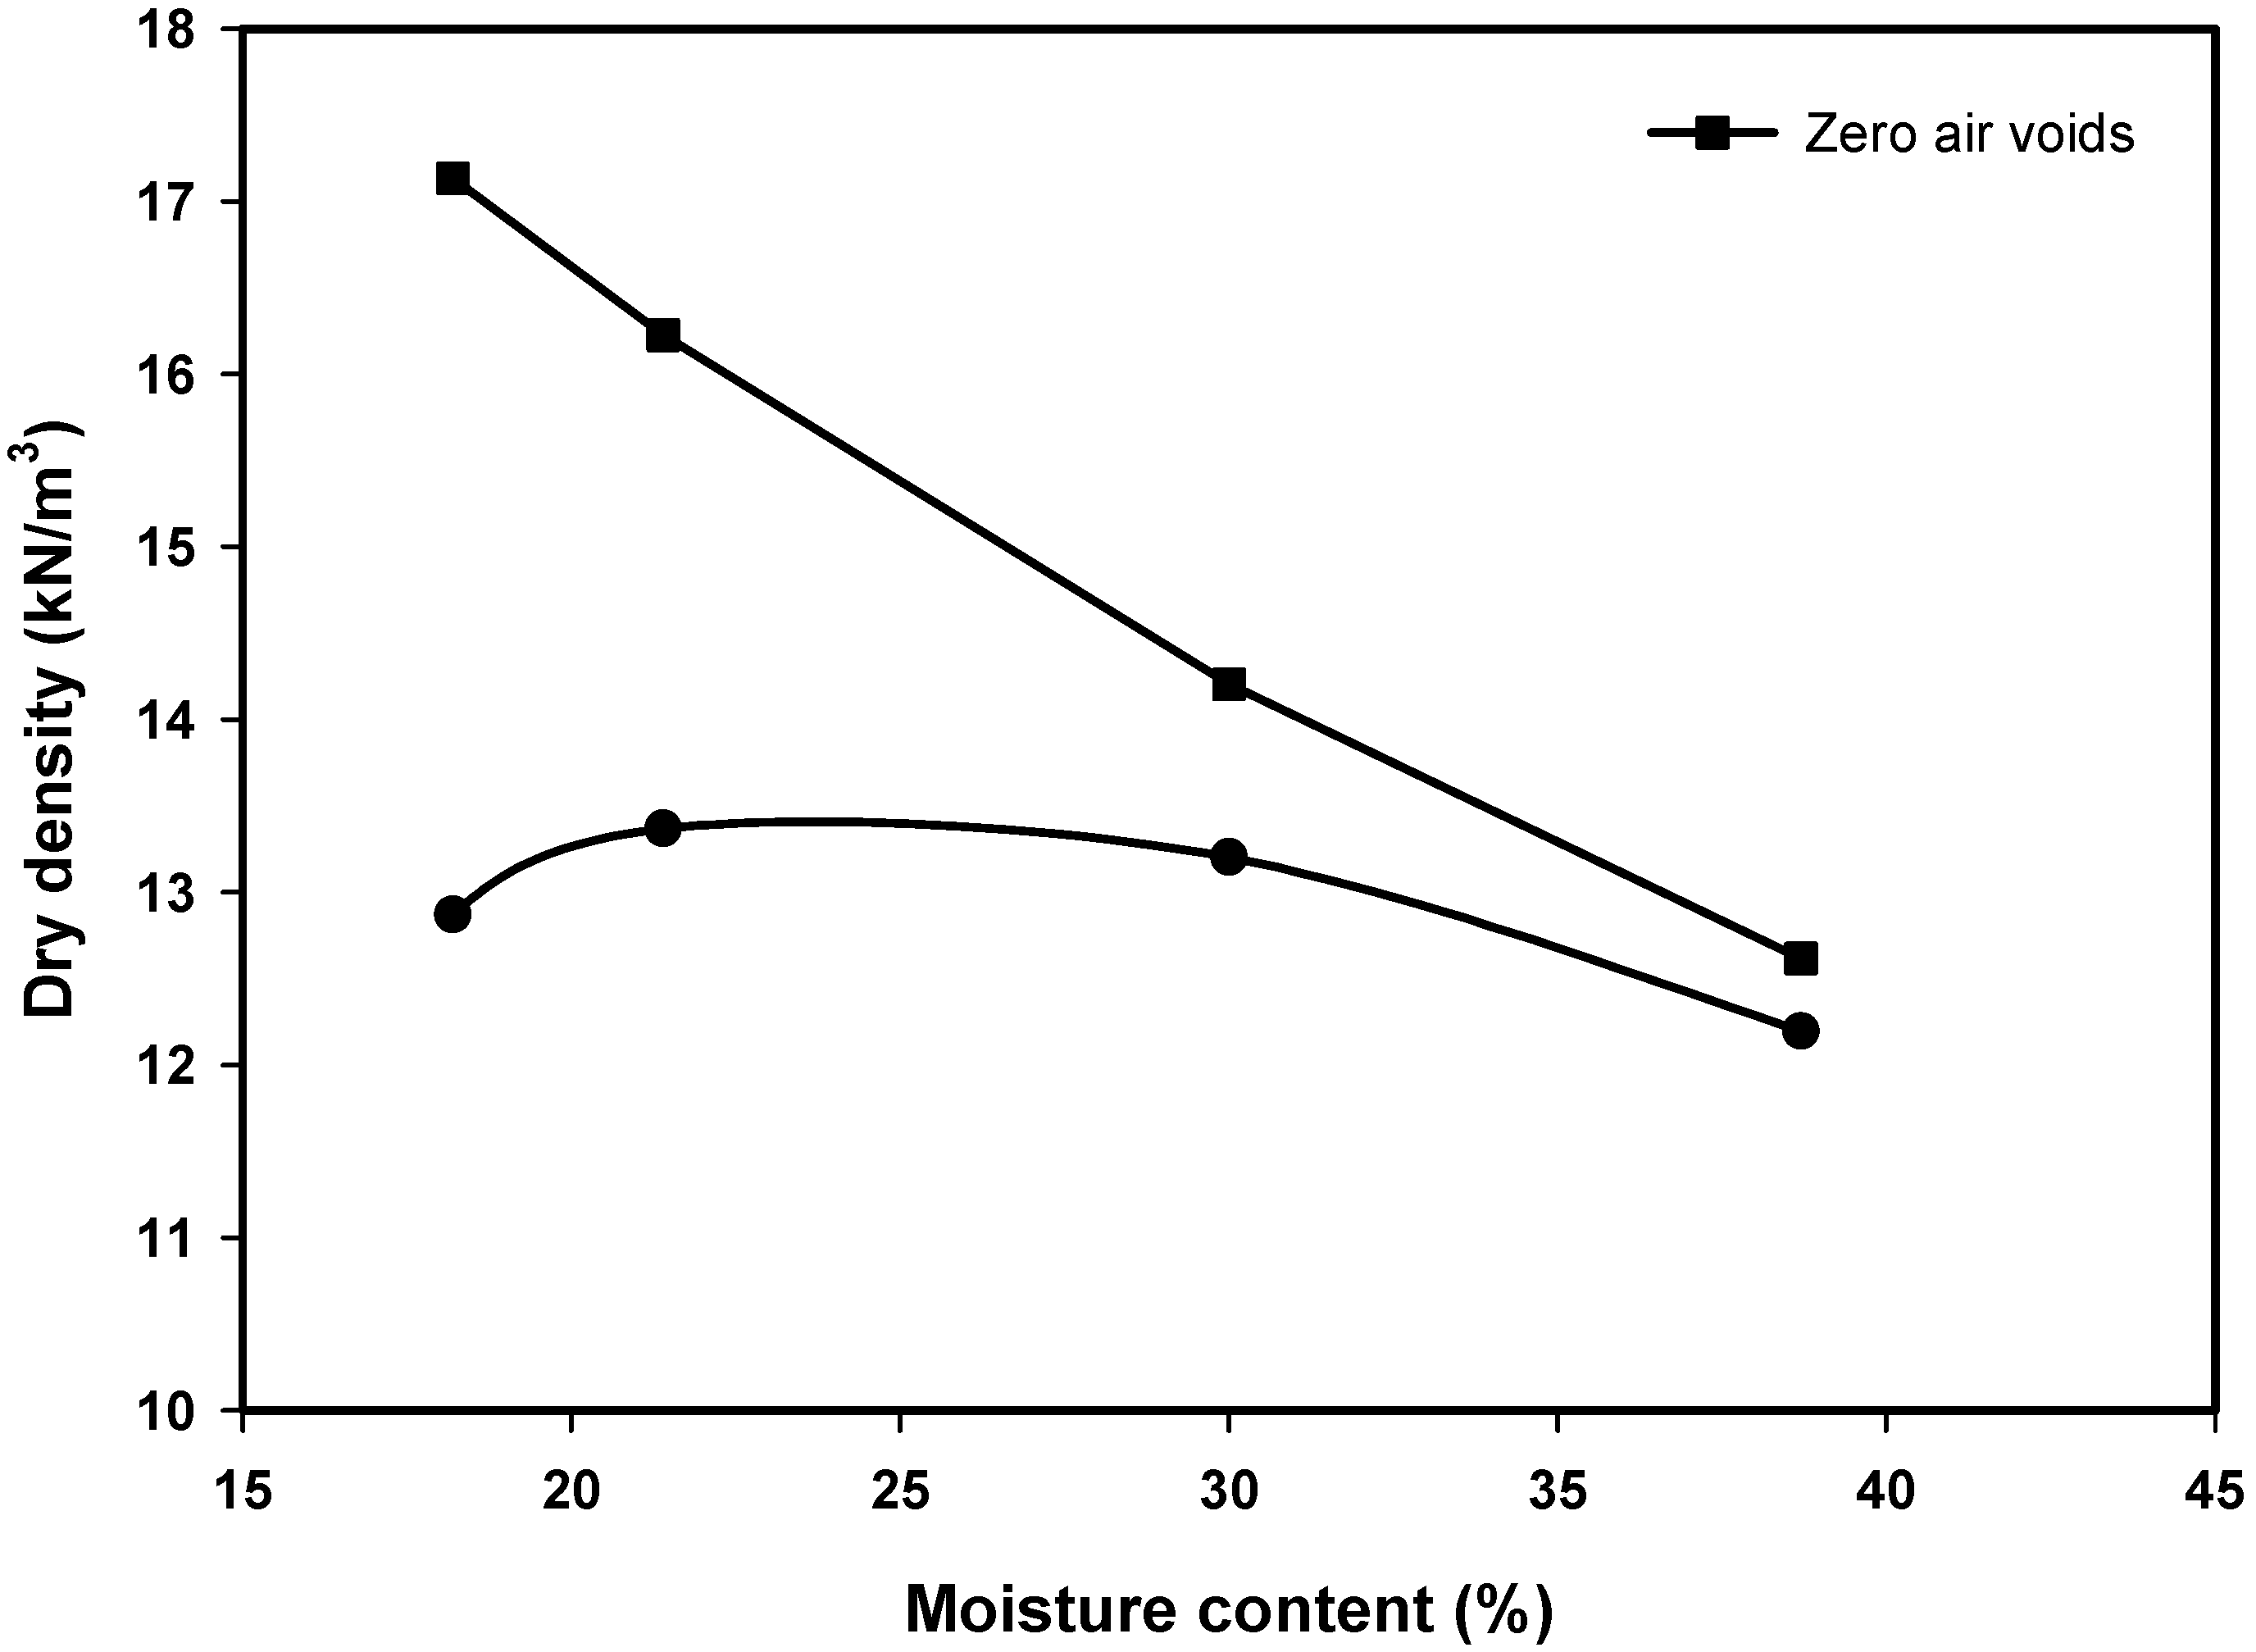
Based on the standard compaction tests performed that follow the ASTM standard D698, the maximum dry density (MDD) and optimum moisture content (OMC) of phosphogypsum were approximately 13.5 kN/m3 and 21%, respectively. These values of MDD and OMC agree with the study conducted by Paige-green and Gerber (2000) who concluded that the MDD of phosphogypsum ranges between 13.2 and 14.5 kN/m3 and that the OMC ranges between 19.5 and 21.9% [21].
The proctor compaction curve and zero air void line are shown in Figure 5. The figure indicates that the compaction curve of phosphogypsum is flat, which signifies that dry density is insensitive to moisture content, which aligns with the observation reported by Havanagi et al. (2018) where he stated that the compaction curve for phosphogypsum is flat in its nature demonstrating that dry density is insensitive to moisture content [22]. The chemical properties of phosphogypsum are summarized in Table 1. The data presented in Table 1 are within the same ranges as the data reported by IAEA, 2013 and Saadaoui, et al., 2017 [8,23].
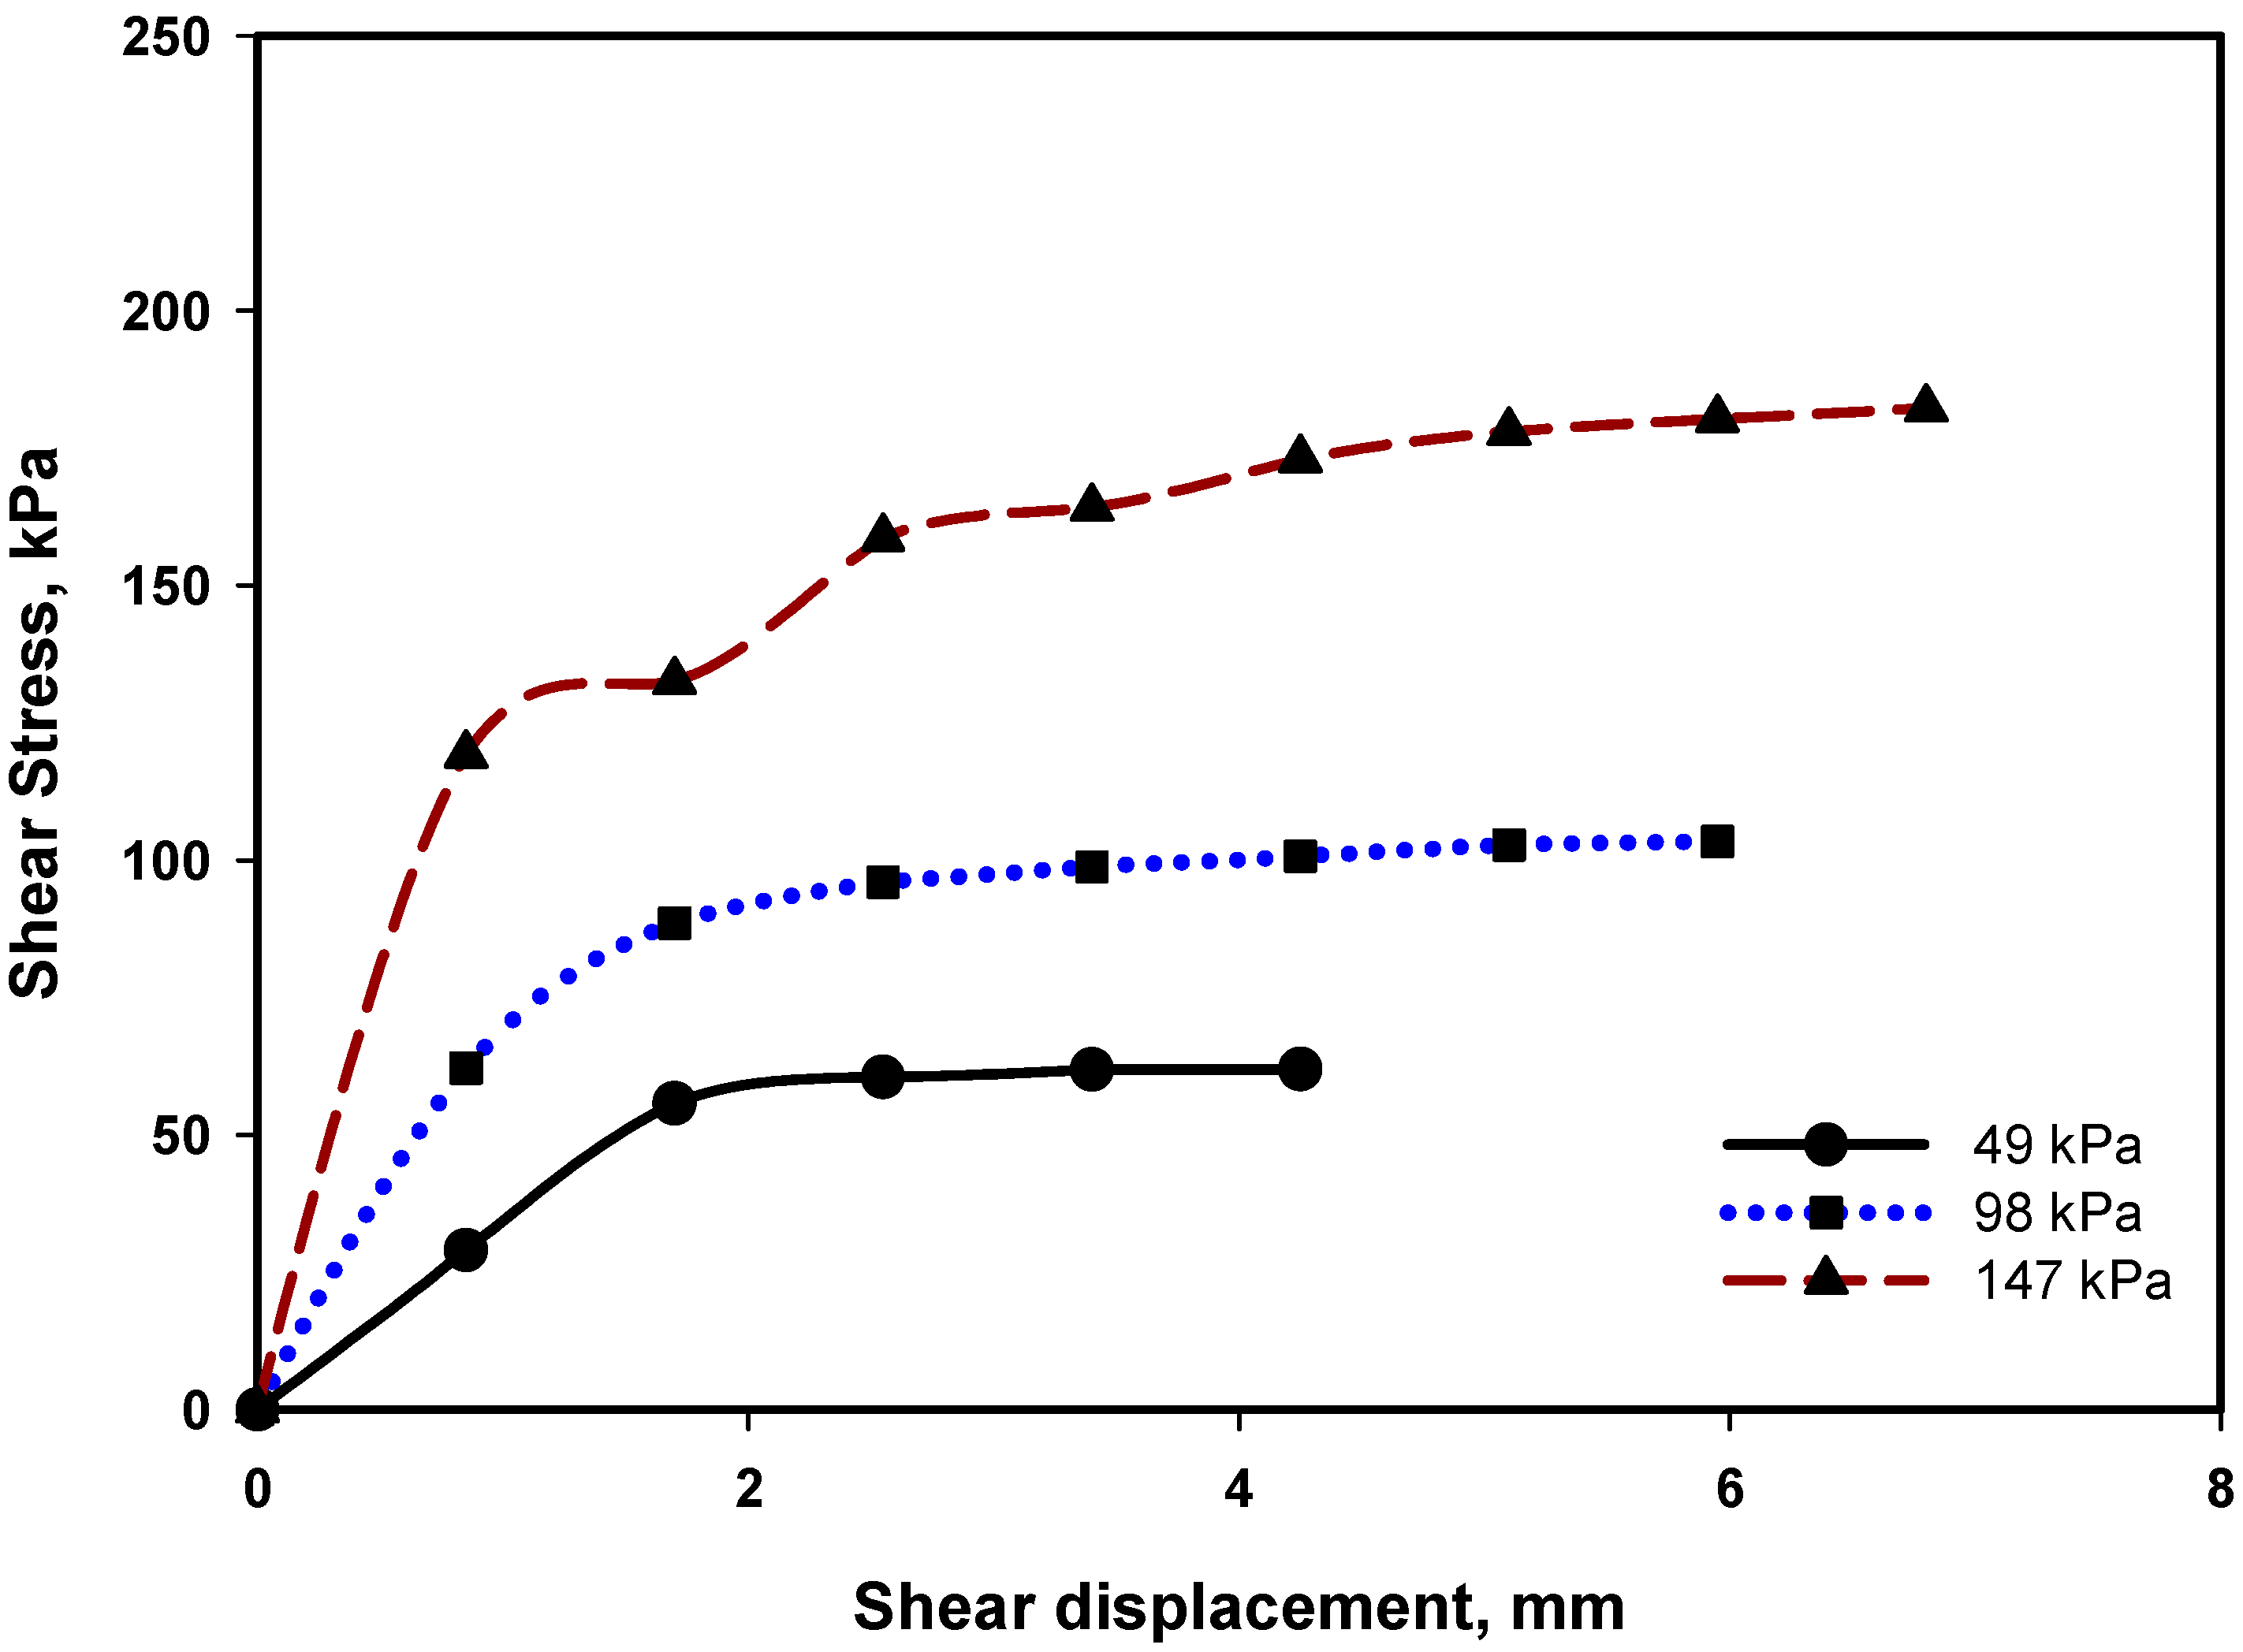
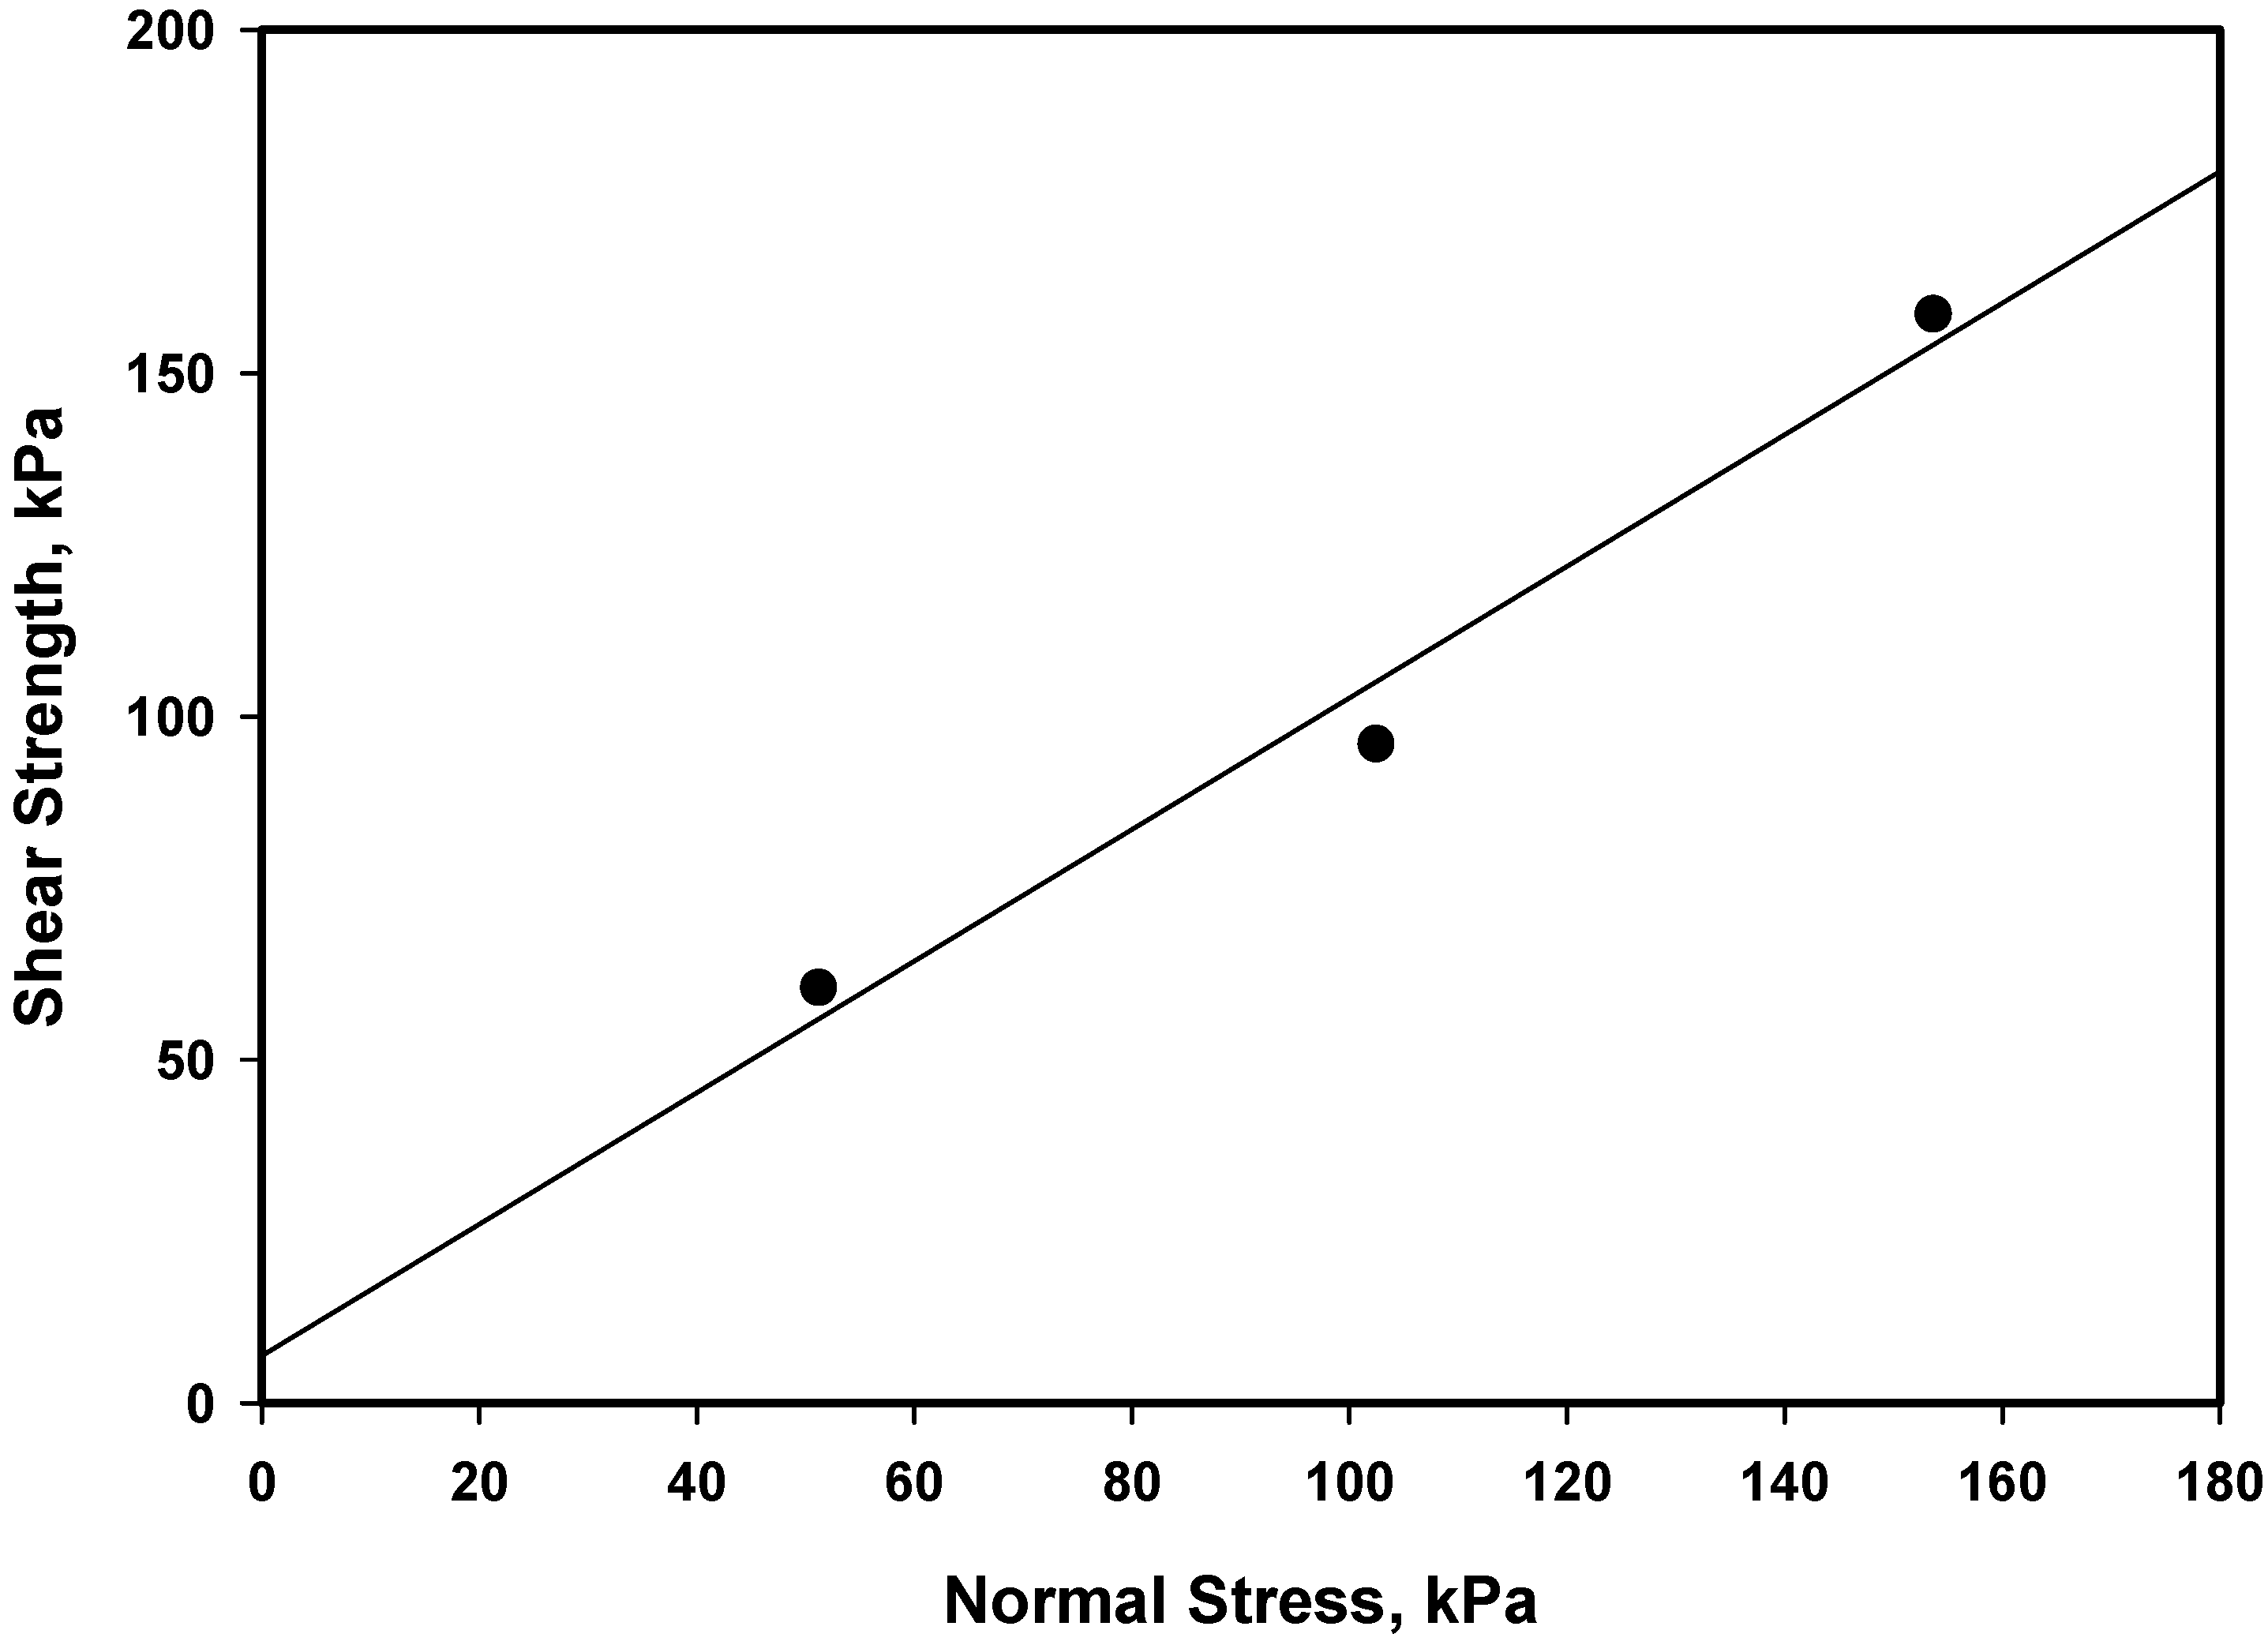
A series of direct shear tests were performed that follow the ASTM standard D3080 to determine the shear strength parameters of the tested phosphogypsum. Preliminary preparation was first conducted, where the tested phosphogypsum was oven-dried and passed through a sieve of 4.75 mm. Then, the specimens were subjected to different normal stresses (e.g., normal stress applied ranges between 50 kPa and 200 kPa). As a result, the shear stress versus shear displacement curves was plotted as shown in Figure 6 using different normal stresses (49, 98, 147 kPa). In addition, the failure envelope (Mohr-Coulomb strength envelope) illustrated in Figure 7 shows that the cohesion and friction angle of the Phosphogypsum specimen was 7 kPa and 44 °C, respectively. Moreover, the volumetric behavior of phosphogypsum during shearing was plotted in Figure 8. In this figure, the phosphogypsum tends to contract at the beginning and dilates subsequently. The dilation of phosphogypsum tends to decrease with increasing normal stresses.

4. Methods of Analysis

A holistic approach is utilized, integrating the limit equilibrium and finite element methods to investigate the stability of Aqaba’s phosphogypsum stockpiles. The limit equilibrium methods used in this study include the ordinary, bishop, and Janbu’s methods [24,25]. Some of these methods satisfy only the overall moment, such as the ordinary and simplified bishop methods, and apply to a circular slip surface. While Janbu’s method satisfies only force equilibrium and applies to any shape. However, all of these methods use the same principle in the analysis which is dividing the failure surface into a number of slices to locate the global critical circular/non-circular slip surface (failure surface) and its associated minimum factor of safety.
To validate the results obtained from the limit equilibrium methods, finite element analysis was used to analyze the stability of the critical sections. Two main approaches are used in the finite element analysis of slope stability. The first approach is to increase the gravity load and the second approach is to reduce the strength characteristics of the soil.

5. Previous Seismicity Studies

The 2006 British Columbia Building Code contains new seismic parameters, one of the new parameters is the reference level of probability of exceedance for seismic design, which has been changed to 2% in 50 years (return period (Rp) = 2475 yrs) from 10% in 50 years (Rp = 475 yrs). However, Geotechnical Slope Stability (Seismic) Regulation still allows the use of the 1998 British Building Code, which calls for the use of 10% in 50 years’ seismic hazard probability level for Slope Stability Assessment Only.
Two different studies were considered in this study, the first study is based on a local attenuation equation developed specifically for Jordan [26]. Based on this attenuation equation the calculated Peak Ground Acceleration (PGA) for the site is about 0.135 g for an Rp = 475 yr. The second study was commissioned by Jordan Atomic Energy Commission (JAEC) to develop a seismic hazard mapping for Jordan to develop a nuclear power plant in Aqaba. The study is carried out by Jiménez, M.J. (2004) [27] and it is based on Ambraseys et al. (1996) attenuation relationships [28], the calculated PGA for the site is about 0.2 g for an Rp = 475 yr (as seen in Figure 9).

6. Result and Discussion

6.1. Stability Analysis Using Limiting Equilibrium Method

Slope stability analyses were carried out using a software package SAS-MCT 4.0, developed by Malkawi, et al. 2001a, 2001b and Malkawi and Waleed, 2003 [29,30,31]. It is based on the limit equilibrium methods and gives a factor of safety as a measure of slope stability. Detailed stability analyses were carried out under both static and dynamic conditions to verify the stability of the slopes for locations and geometry of the investigated sections. Only the results of the critical sections are presented in detail and the results of the other sections are summarized.
For dynamic conditions, the acceleration used is equal to 0.135 g and 0.2 g, which is based on a 475-year return period and a level of probability of 10% of exceedance in 50 years lifetime of the facility. For general slope stability analysis of permanent cuts, fills, and landslide repairs, a minimum safety factor of 1.25 should be kept. Larger safety factors should be used if there is significant uncertainty in the analysis input parameters. For seismic analysis, a minimum safety factor of 1.0 shall be used see Table 2 [32]. For three-dimensional (3-D) analyses, the minimum factor of safety for different loading conditions is presented in Table 3.
Slope stability analyses were performed using the material properties mentioned in the material property section. For each section of the South-West and East section, numerous stability simulation runs were produced to represent the static and dynamic (seismic) conditions. For each run, 10,000 slip surfaces were produced for each of the two-dimensional (2-D) and three-dimensional (3-D) analyses. The goal of these runs is to locate the critical slip surface by considering the other potential slip surfaces. Different limits equilibrium methods are used in the analysis since most problems in slope stability are statically indeterminate and therefore some assumptions are to be made to determine a unique factor of safety. Some of the methods that are utilized in this paper are the ordinary, bishop, and Janbu’s methods. All sections were analyzed using the mentioned methods and assuming both circular and non-circular slip surfaces.
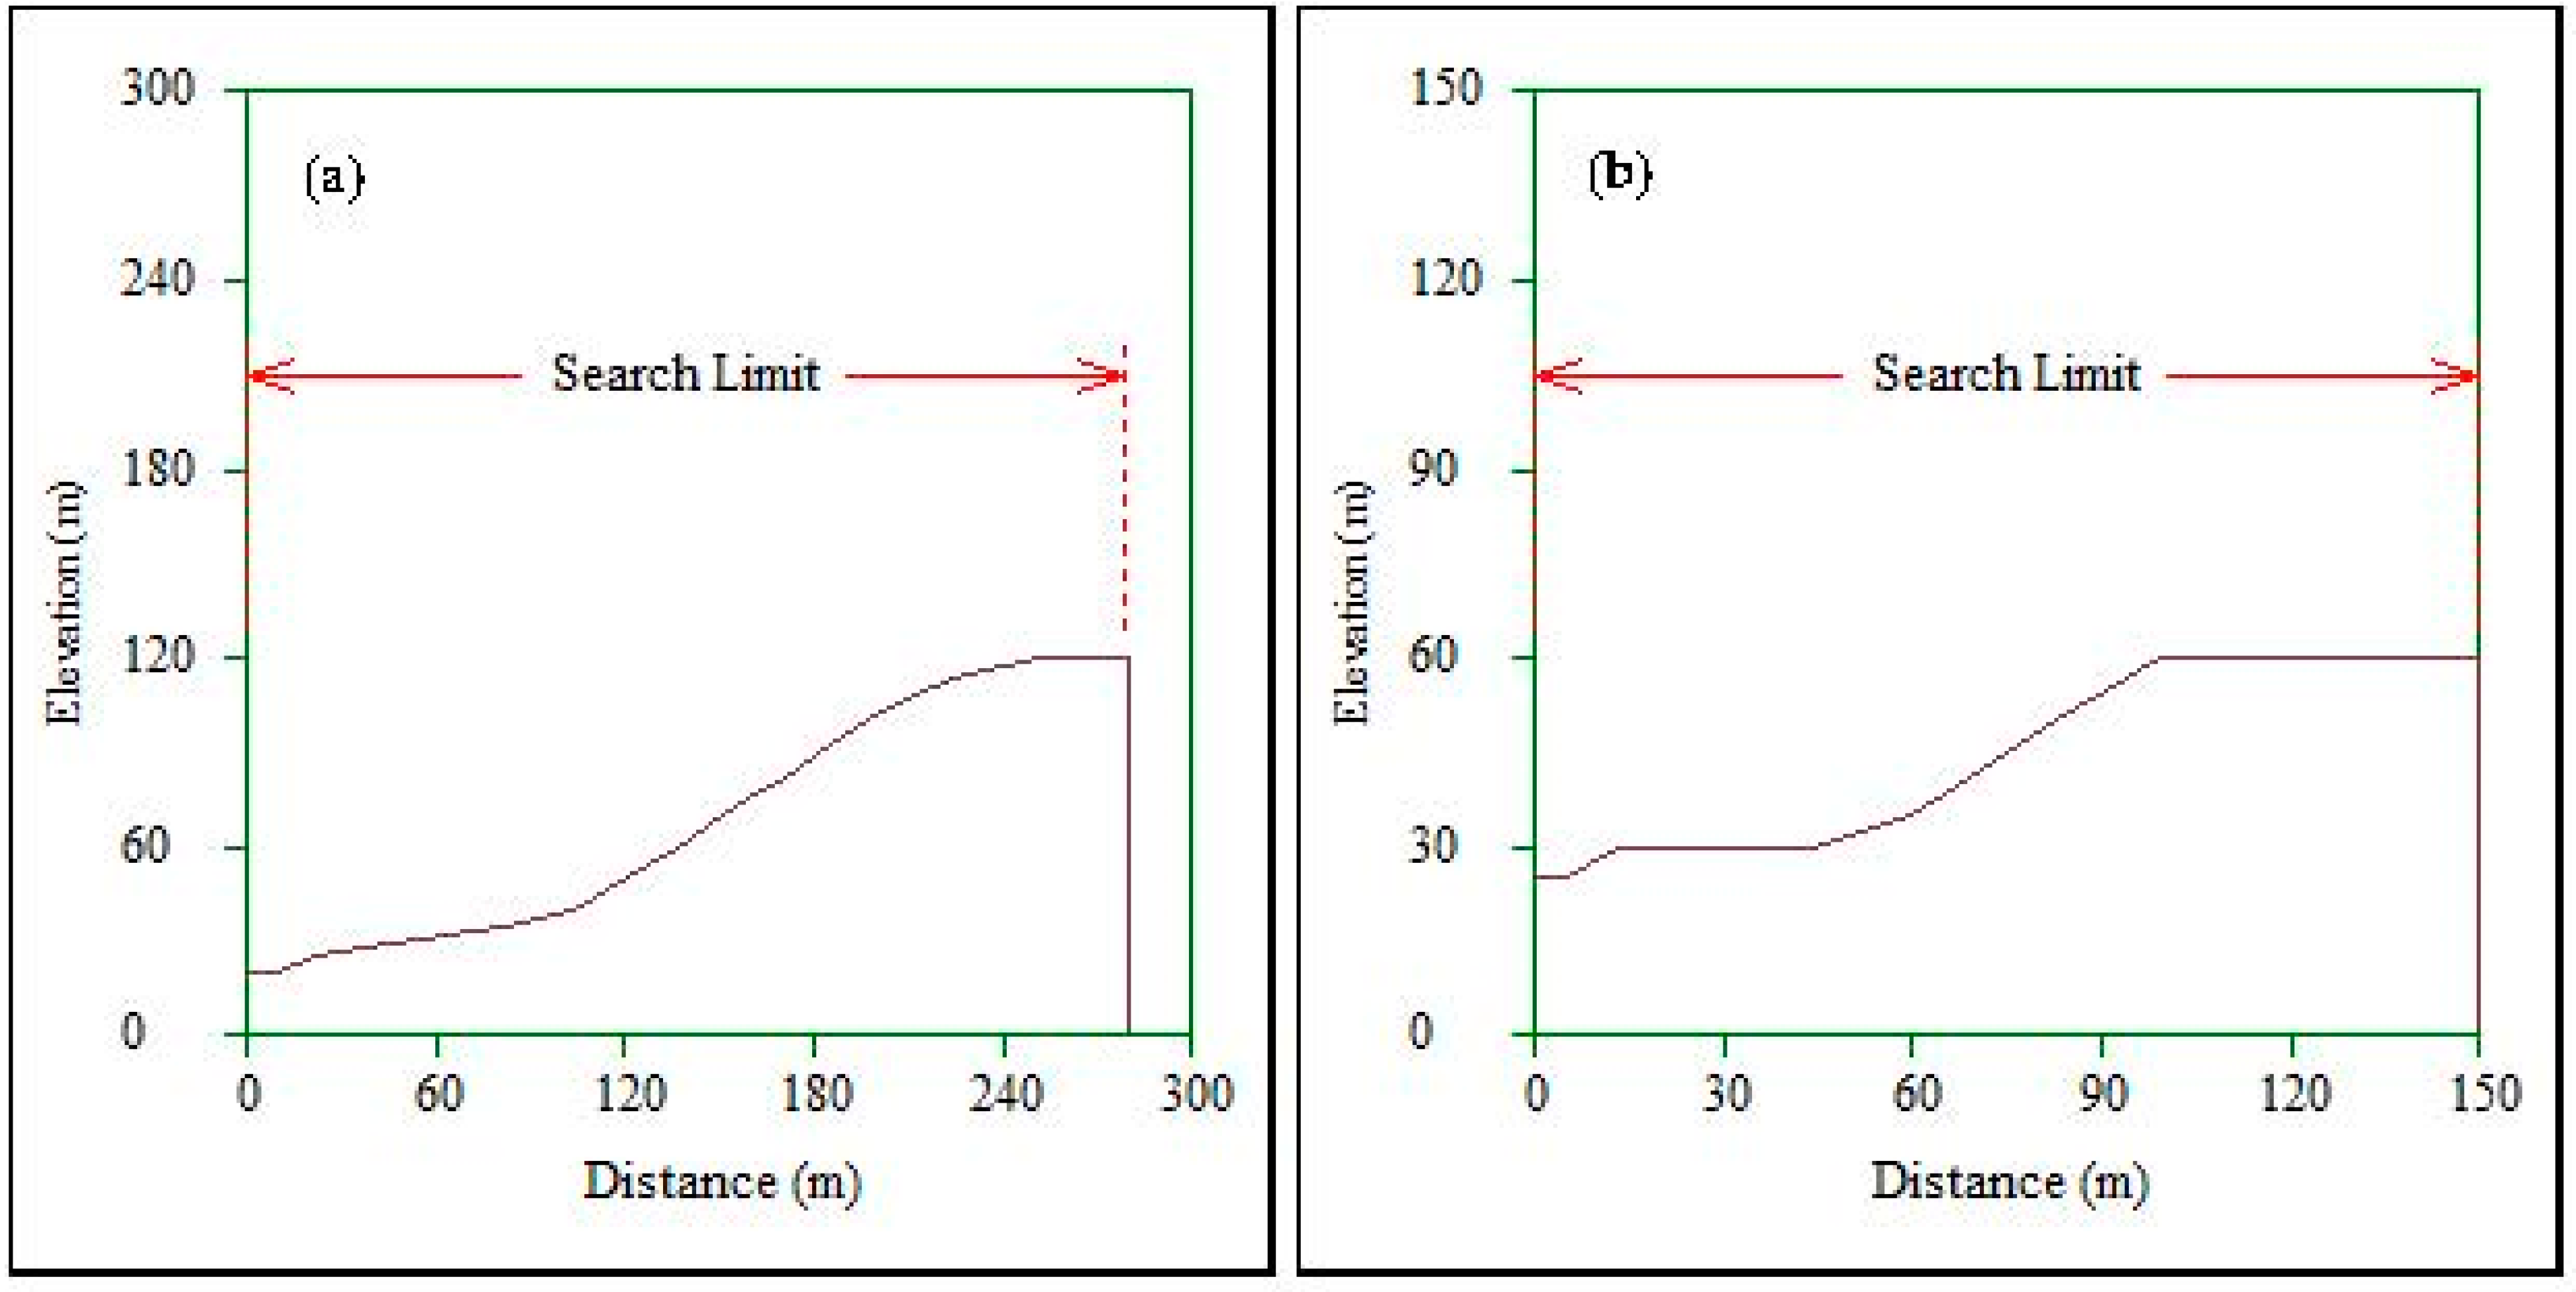
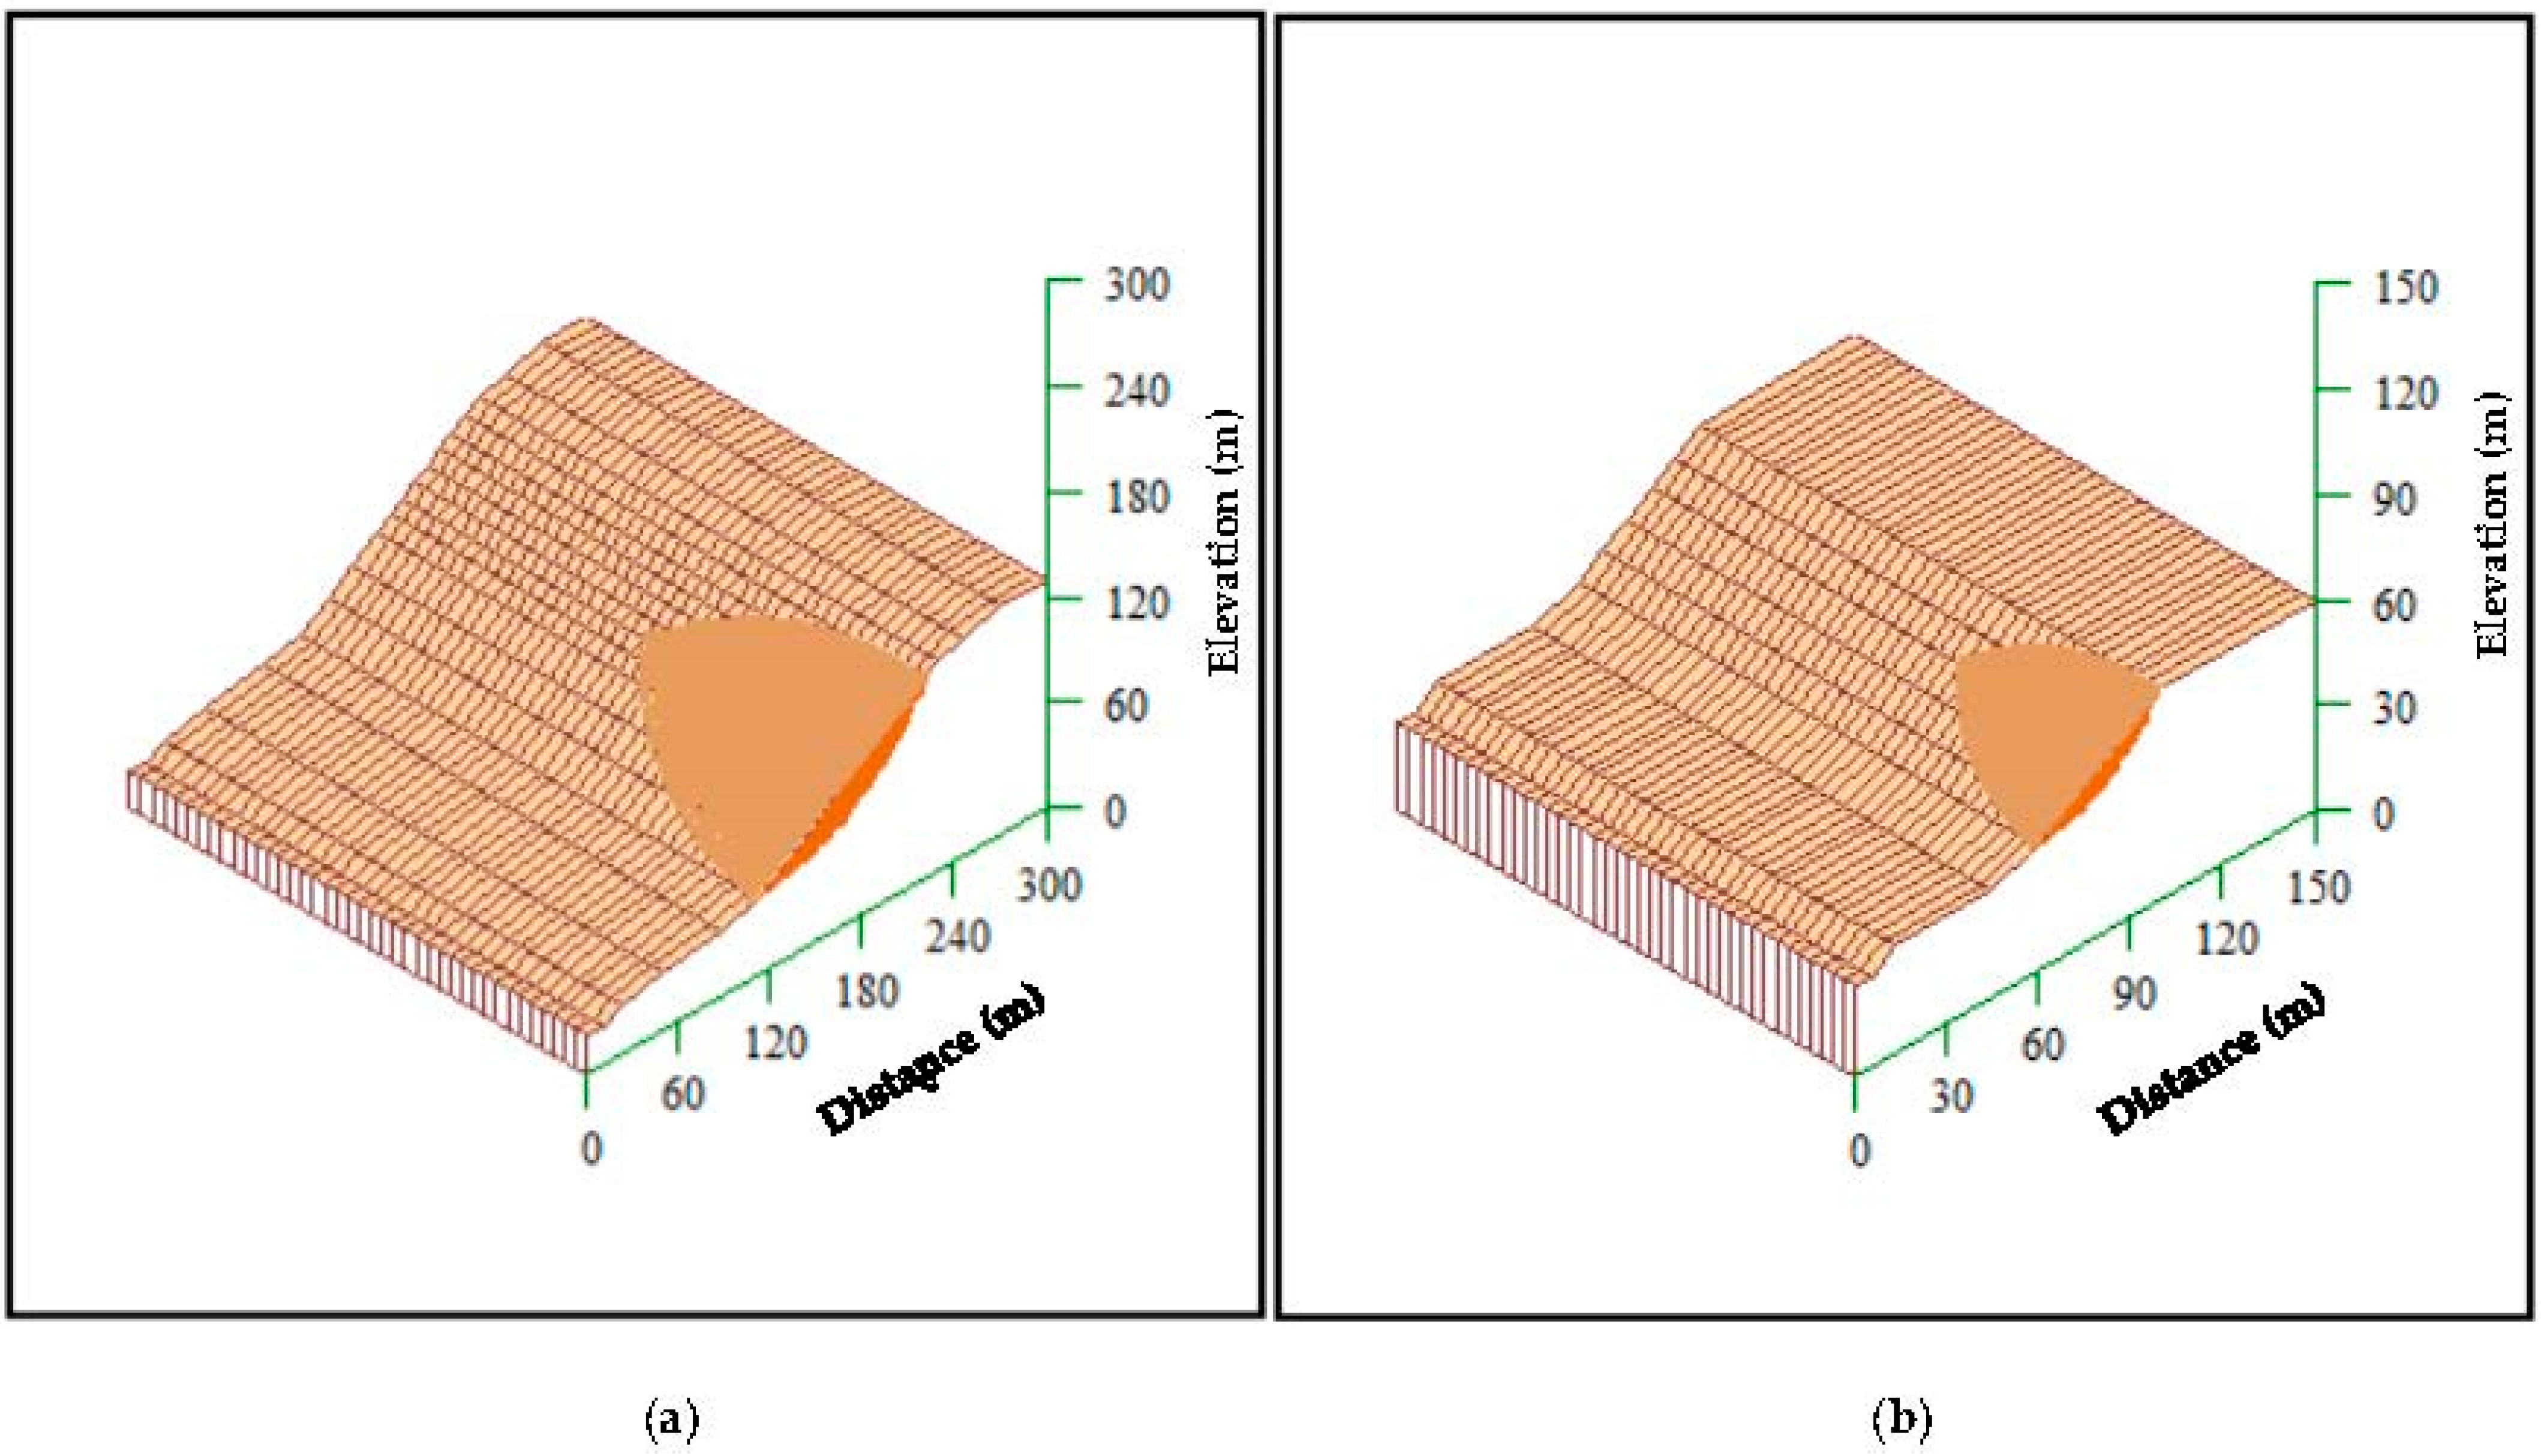
Figure 10 shows the slope geometry for pile 0 + 600 located in the South-West section and pile 2 + 200 located in the East section, the results of those sections are presented in detail as they represent the most critical piles in the studied area. The critical circular slip surface and non-circular slip surface for both piles (0 + 600 and 2 + 200) are presented in Figure 11.
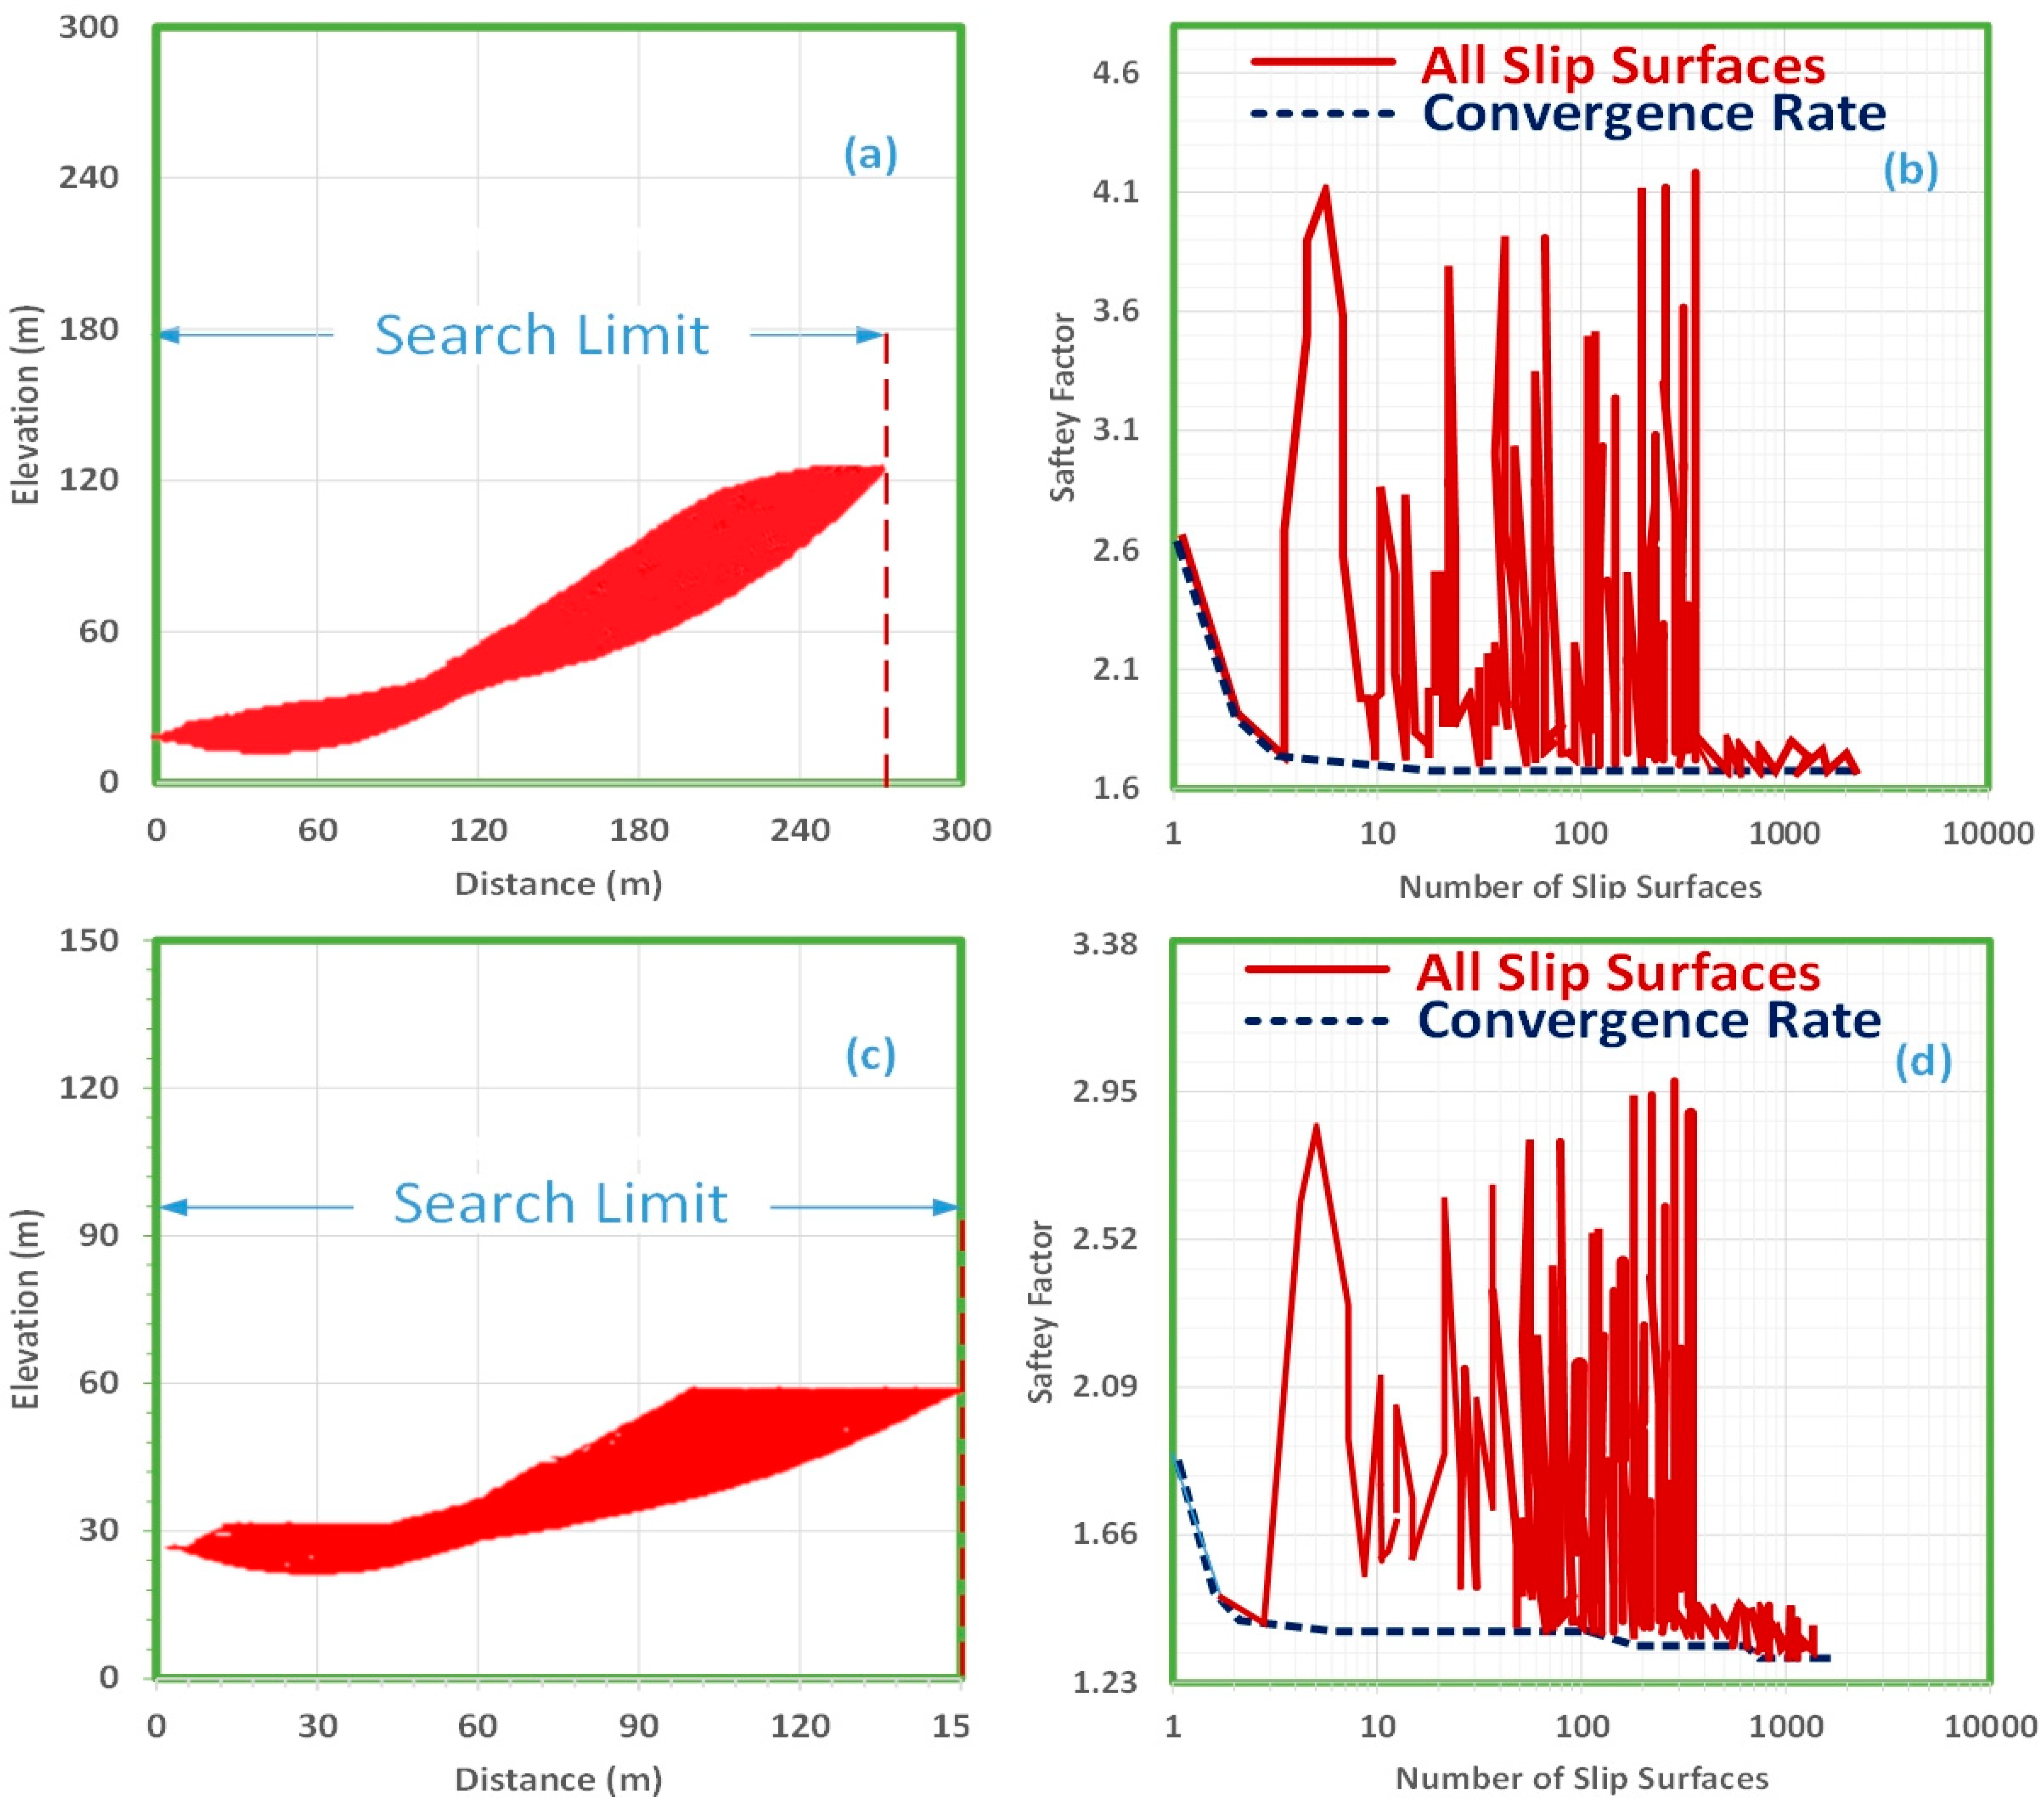
All of the tested circular slip surfaces using jumping and walking methods and the safety factor convergence are shown in Figure 12 for both piles 0 + 600 and 2 + 200. Approximately 1940 slip surfaces were tested before the safety factor converged for pile 0 + 600 (Figure 12a) and around 1812 tested slip surfaces were tested before the safety factor converges for pile 2 + 200 (Figure 12c). The three-dimensional circular slip surface for pile 0 + 600 and pile 2 + 200 is shown in Figure 13 under earthquake loading. In this analysis, the circular slip surface was considered using a 3-D wedge element. The mesh body used 7220 wedge elements. The boundary conditions are pins and rollers in 2-D and 3-D space, this way the bottom of the body layer can stretch with the loading of earthquake and gravity of piles of gypsum, and the far end surface of the body is held from the horizontal movement only.
Summaries of all stability runs (calculated minimum factors of safety) are presented in Table 4 and Table 5 for Pile 0 + 600 in the South-West section and pile 2 + 200 in the East section. The result shows that the safety factor of both piles (0 + 600 and 2 + 200) whether using the ordinary, bishop, or Janbu’s methods has a factor of safety above the minimum required factor of safety as specified in Table 2 and Table 3 for both conditions (statics and dynamics).
It should be stated that the circular slip surface analysis for the South-West section under static conditions using ordinary, bishop, and Janbu’s methods yielded a factor of safety between (1.7–1.9), and above 1.8 for 2-D analysis for pile 0 + 520 and 0 + 680 respectively while the 3-D analysis resulted in a factor of safety of above 1.8, and above 1.9 for pile 0 + 520, and 0 + 680 respectively. The dynamic analysis also showed a factor of safety above 1 for both sections whether using a peak ground acceleration of 0.135 g or 0.2 g using 2-D and 3-D analysis.
The result of the non-circular slip surface analysis for piles 0 + 520 and 0 + 680 under static conditions was generally above 1.7 and under dynamic conditions above 1.2 whether using a peak ground acceleration of 0.135 g or 0.2 g. Furthermore, the circular slip surface analysis of the East Section under static conditions using Ordinary, Bishop, and Janbu’s methods yielded a factor of safety above 2 for 2-D analysis for both piles 2 + 160 and 2 + 260 while the 3-D analysis resulted in a factor of safety of above 2, and above 2.5 for pile 2 + 160, and 2 + 260, respectively. The dynamic analysis also showed a factor of safety above 1 for both sections whether using a peak ground acceleration of 0.135 g or 0.2 g using 2-D and 3-D analysis. The result of the non-circular slip surface analysis for piles 2 + 160 and 2 + 260 under static conditions was generally above 2 and under dynamic conditions above 1.5 whether using a peak ground acceleration of 0.135 g or 0.2 g.

6.2. Stability Analysis Using Finite Element Method

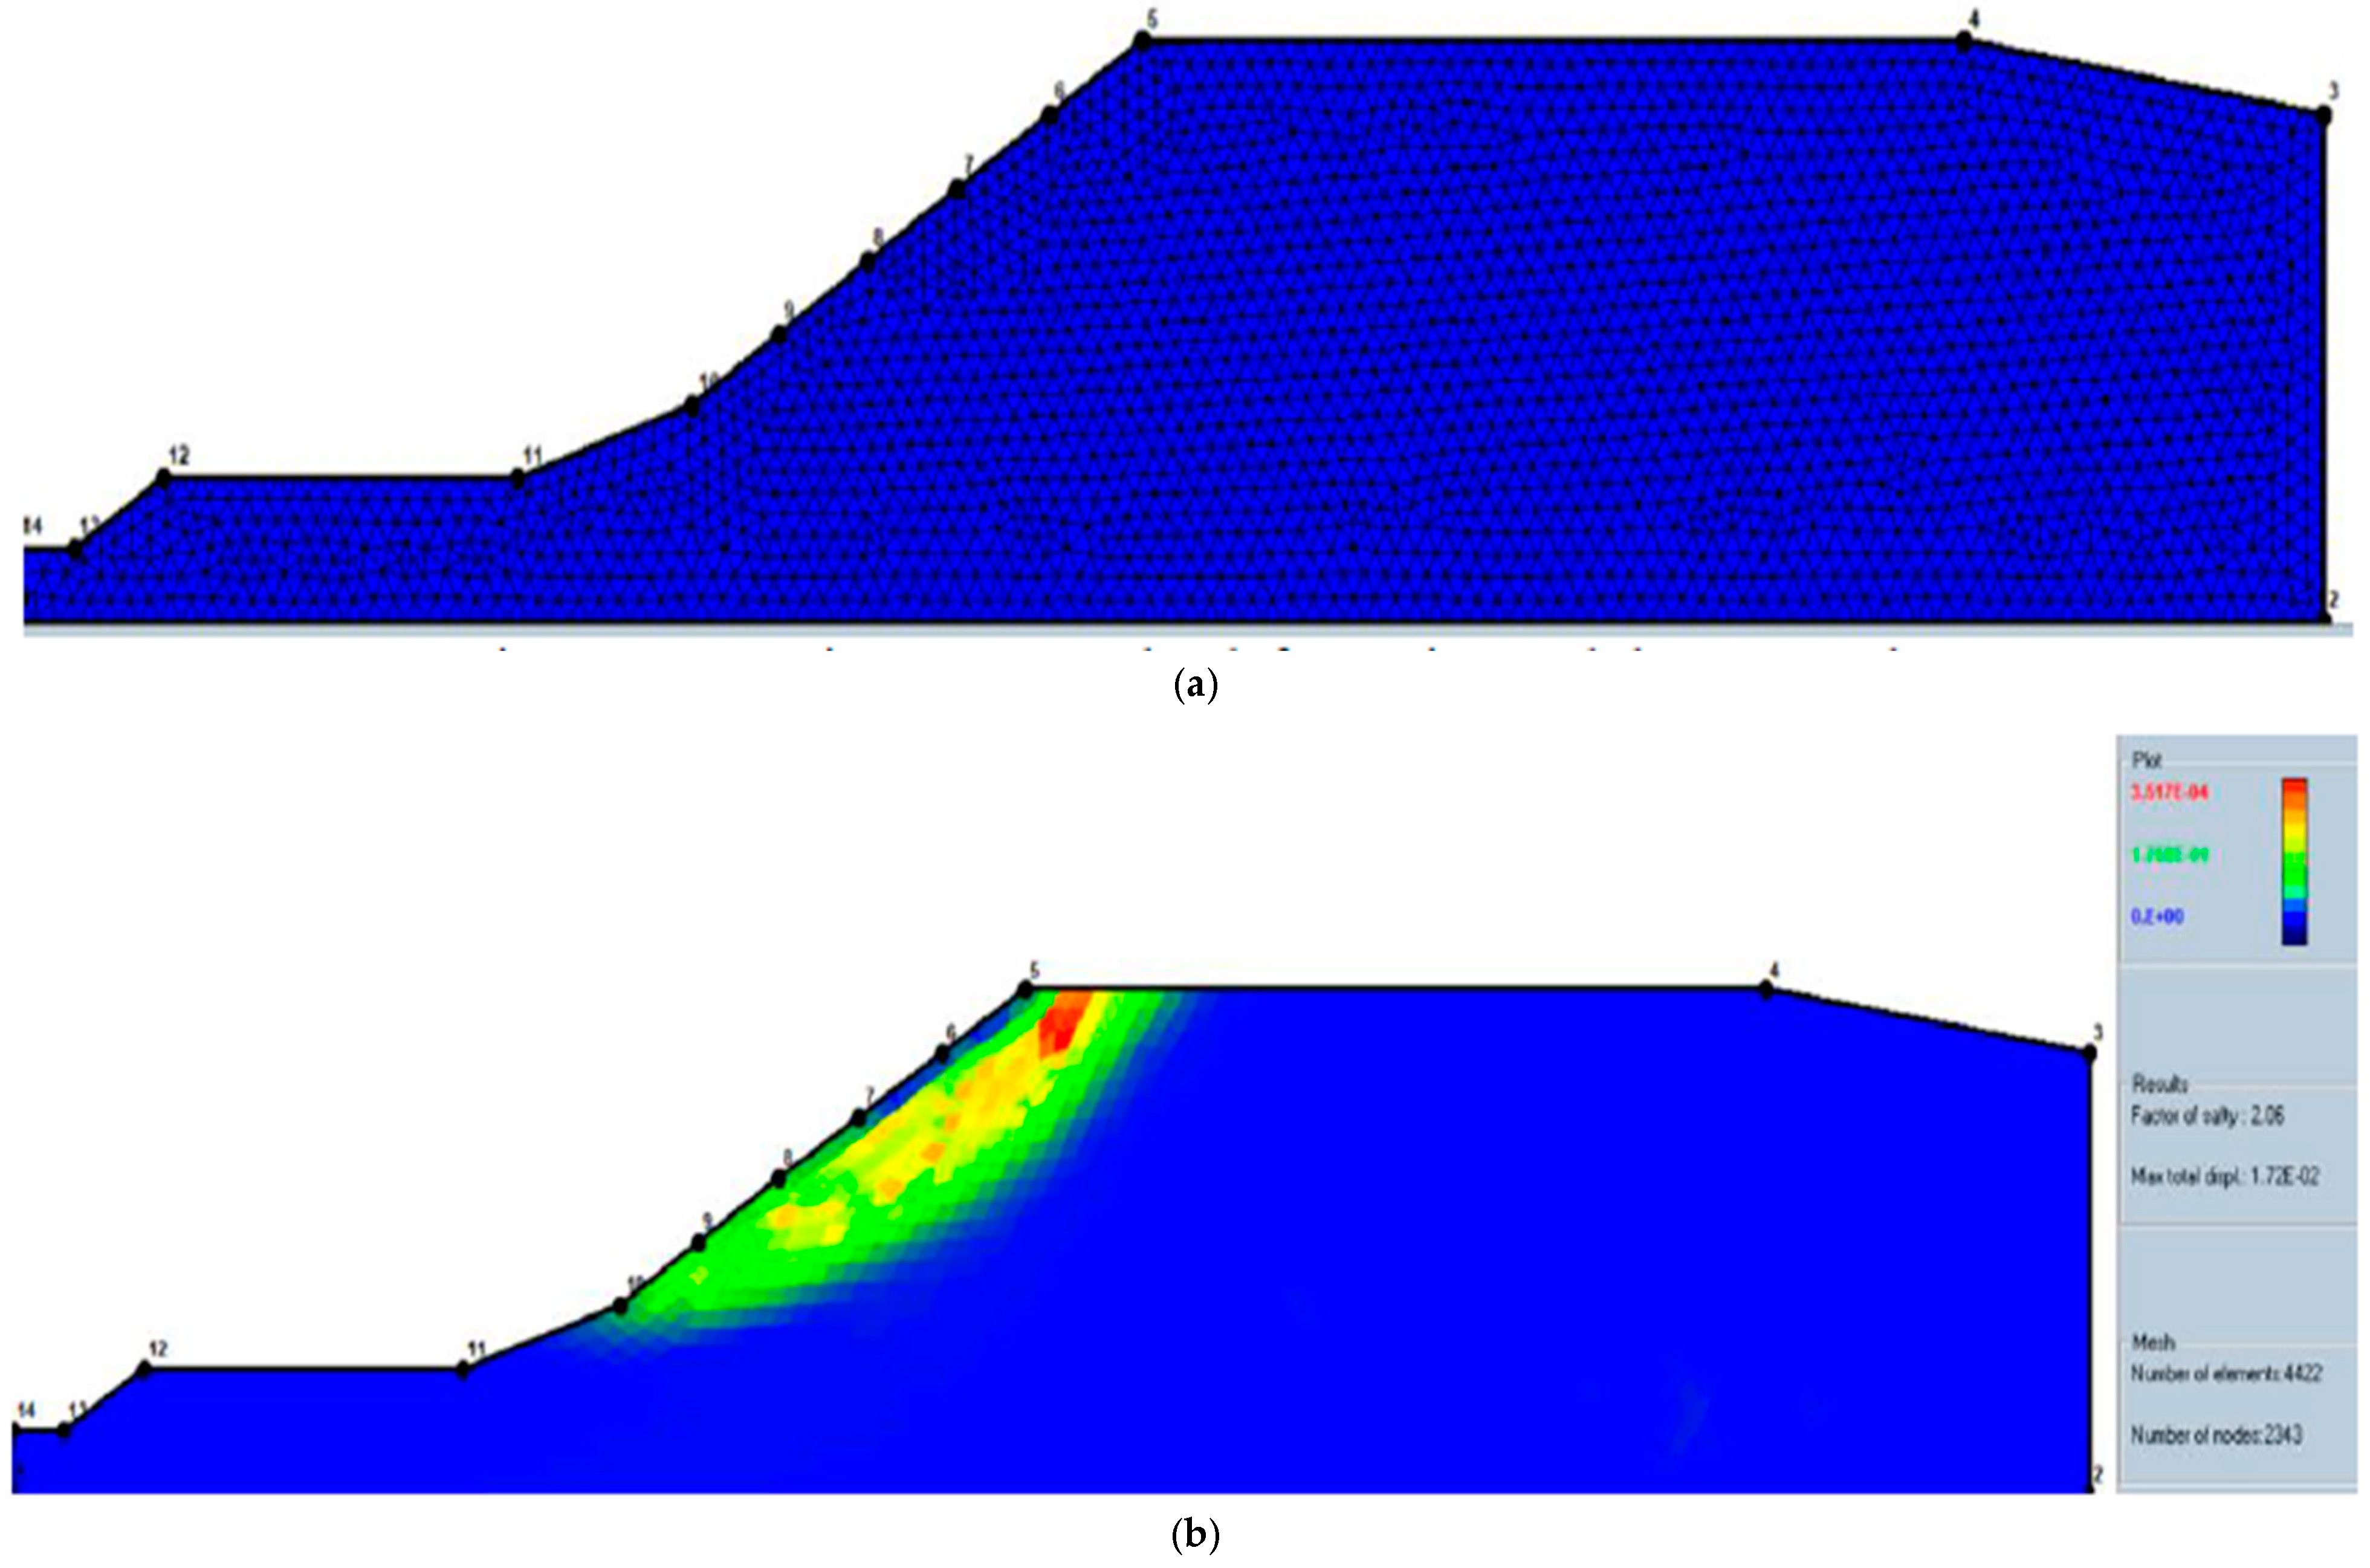
The FE analyses were performed using the SAS-FEM program (stability analysis of slopes using finite element method), a two-dimensional finite element analysis computer program developed by Husein Malkawi and Balakdar, 2007 [34].
In The 2-D and 3-D FEM analysis, the limit equilibrium methods with finite element analysis using the strength reduction method are utilized since it is similar to the limit equilibrium approach more than the gravity increase method. The linear triangular elements (LTE) with 15 nodes were used in the 2-D FEM analysis assuming plane strain settings, and 15-node wedges were used in the 3-D analysis. In the 3-D FEM analysis with a constant width of 100 mm in all cases. Although the linear quadrilateral element (LTQ) showed higher accuracy than the LTE, the linear triangular element is very suitable for its adaptivity to irregular geometry. Figure 13 is a clear example of the 3-D finite element analysis using the 15-node wedges element.
The material model demonstrated in the analysis consists of six parameters: Friction angle (ɸ, Cohesion (c), Dilation (Ψ), Young’s modulus (E), Poisson’s ratio (υ), and Unit weight of soil (γ). Young’s modulus and Poisson’s ratio have little influence on the predicted factor of safety in slope stability analysis as mentioned earlier. However, they have a significant influence on slope deformation. In the present study, the Young’s modulus, Poisson’s ratio, and dilation angle values are estimated for the phosphogypsum to be as follows:
E = 1,350,000 kN/m2
υ = 0.08
Ψ = 0.0
All of the finite element parameters have been chosen for all of the analyzed sections according to the FE practical size. These parameters have been selected to obtain an acceptable accuracy, for that purpose, the slops meshed with fine mesh consist of about 3347 to 4778 constant triangle elements. The maximum number of iterations has taken around 1000 iterations controlled with a tolerance of (0.001–0.0001). The shear reduction factor was applied in small increments equal to 0.01. On the other hand, and as mentioned earlier, the adopted values for the following parameters are dilation Ψ = 0, Young’s modulus E = 13.5 × 10⁵ kN/m2, and Poisson’s ratio υ = 0.08. The soil properties of the slope were 44 °C, 7 kN/m2, and 13.51 kN/m3 for friction angle, cohesion, and the soil’s unit weight respectively. All piles in both sections (South-West and East) were analyzed in detail. However, only the results of the two critical piles (0 + 600 and 2 + 200) are presented in detail.
The analysis for pile 0 + 600 shown in Figure 14a was performed with 4125 triangular elements with 2181 nodes. Figure 14b shows the failure surface for pile 0 + 600. The analysis converged with an iteration limit of 1000 and a tolerance of 0.001, and a factor of safety increment of 0.01 (Figure 15). Moreover, the analysis for Pile 2 + 200 shown in Figure 16a was performed with 4422 triangular elements with 2343 nodes. Figure 16b shows the failure surface for pile 2 + 200. The analysis converged with an iteration limit of 1000 and a tolerance of 0.0001, and a factor of safety increment of 0.01 (Figure 17). Table 6 summarizes the results of the FEM for all of the piles in the South West and East Sections. Based on the results in Table 6, the stability analysis using finite element methods showed that all piles are stable in the studied area.

7. Conclusions

Most of the produced Phosphogypsum is not processed around the world and is stacked into massive piles over the land which raises concerns about their stability. Therefore, this study set out to investigate the stability of the phosphogypsum stockpiles in Aqaba-Jordan after the Jordan Phosphate Mines Company (JPMC) raised some concerns about the stability of their stacks in the surrounding area. The required topographic and geological characteristics were obtained during the site visits, and the contour plot of each pile was produced by JPMC. Several laboratory tests were conducted to estimate the geotechnical properties of the stacked material due to the limited information on the Jordanian phosphogypsum characteristics. The following remarks summarize the essential findings of this study:
  • The Jordanian phosphogypsum is mainly composed of sands and fine-grain material, the plasticity characterization showed that the material is a low-plastic material, and its chemical composition is primarily made up of approximately 87% calcium sulfate (CaSO4).
  • Two sections were singled out as the most critical sections namely the South-West and the East. Furthermore, for each section, three critical piles were selected for analysis and verification.
  • Both the limit equilibrium approach (LEM) and Finite element method (FEM) analysis performed in 2-D and 3-D systems, indicate that the slopes are stable under all loading conditions (Static and Seismic loading), for all sections.
  • The critical pile in the South-West section was 0 + 600 with the steepest slope with a minimum factor of safety in the static condition of 1.695 and in the seismic condition of 1.076, which indicates the stability of the pile.
  • Similarly, the critical section in the East pile (2 + 200) has a minimum factor of safety of 1.896 in static conditions and 1.072 in seismic conditions.
Taken together, these findings suggest that the above-ground slopes for the stacking of phosphogypsum in Aqaba are stable under both static and earthquake loading. Additionally, these findings contribute in several ways to our understanding of the stacking of phosphogypsum behavior, especially in Aqaba where phosphogypsum are stacked into large piles over the massive lands near coastal areas. This new understanding should help JPMC and practitioners to improve their predictions of the phosphogypsum stockpiles impact and of providing a basis for future planning and maintenance practices.

8. Study Limitations and Future Recommendations

This study proposed an analysis that can be used for environmental fragile areas. Thus, this study recommends the use of the proposed analysis by public and private agencies, and such investigation should be even required by the governmental administrations. This study has not investigated the phosphogypsum geochemical and potential radioactivity, and therefore, it is recommended as future research to study the impact of these two factors on the adjacent land area.

Author Contributions

Conceptualization, D.A.H.M.; Methodology, D.A.H.M.; Software, K.A.B.-H., A.I.H.M. and D.A.H.M.; Validation, A.I.H.M. and K.A.B.-H.; Formal analysis, D.A.H.M. and K.A.B.-H.; Investigation, D.A.H.M.; Writing—original draft, D.A.H.M. and K.A.B.-H.; Writing—review & editing, D.A.H.M. and A.I.H.M.; Supervision, A.I.H.M.; Project administration, A.I.H.M. and D.A.H.M. All authors have read and agreed to the published version of the manuscript.

Funding

This research received no external funding.

Institutional Review Board Statement

Not applicable.

Informed Consent Statement

Not applicable.

Data Availability Statement

Data can be supplied by the corresponding author upon plausible demand.

Acknowledgments

The authors would like to acknowledge and thank the Jordan Phosphate Mines for providing the required facilities and materials for this study as this study was inspired by them. Therefore, their support, assistance, and help are greatly acknowledged.

Conflicts of Interest

The authors declare no conflict of interest.

References

  1. Chernysh, Y.; Yakhnenko, O.; Chubur, V.; Roubík, H. Phosphogypsum Recycling: A Review of Environmental Issues, Current Trends, and Prospects. Appl. Sci. 2021, 11, 1575. [Google Scholar] [CrossRef]
  2. Outbakat, M.B.; El Mejahed, K.; El Gharous, M.; El Omari, K.; Beniaich, A. Effect of Phosphogypsum on Soil Physical Properties in Moroccan Salt-Affected Soils. Sustainability 2022, 14, 13087. [Google Scholar] [CrossRef]
  3. Cichy, B.; Kraszewski, C.; Rafalski, L. Geotechnical Properties of Phosphogypsum and Its Use in Road Engineering. In Proceedings of the China-Europe Conference on Geotechnical Engineering, Vienna, Austria, 13–16 August 2018; Springer: Cham, Switzerland, 2018; pp. 1664–1667. [Google Scholar]
  4. Mesić, M.; Brezinščak, L.; Zgorelec, Ž.; Perčin, A.; Šestak, I.; Bilandžija, D.; Trdenić, M.; Lisac, H. The application of phosphogypsum in agriculture. Agric. Conspec. Sci. 2016, 81, 7–13. [Google Scholar]
  5. Abdel-Fattah, M.K.; El-Naka, E.S.A. Empirical approach of leaching curves for determining the efficiency of reclaiming saline-sodic soils in Sahl El-Tina, Sinai, Egypt. Int. J. Plant Soil Sci. 2015, 8, 13–15. [Google Scholar] [CrossRef] [PubMed]
  6. Enamorado, S.; Abril, J.M.; Mas, J.L.; Periáñez, R.; Polvillo, O.; Delgado, A.; Quintero, J.M. Transfer of Cd, Pb, Ra and U from Phosphogypsum Amended Soils to Tomato Plants. Water Air Soil Pollut. 2009, 203, 65–77. [Google Scholar] [CrossRef]
  7. Abril, J.-M.; García-Tenorio, R.; Enamorado, S.M.; Hurtado, M.D.; Andreu, L.; Delgado, A. The cumulative effect of three decades of phosphogypsum amendments in reclaimed marsh soils from SW Spain: 226Ra, 238U and Cd contents in soils and tomato fruit. Sci. Total Environ. 2008, 403, 80–88. [Google Scholar] [CrossRef]
  8. Saadaoui, E.; Ghazel, N.; Ben Romdhane, C.; Massoudi, N. Phosphogypsum: Potential uses and problems—A review. Int. J. Environ. Stud. 2017, 74, 558–567. [Google Scholar] [CrossRef]
  9. Islam, G.S.; Chowdhury, F.H.; Raihan, M.T.; Amit, S.K.S.; Islam, M.R. Effect of Phosphogypsum on the Properties of Portland Cement. Procedia Eng. 2017, 171, 744–751. [Google Scholar] [CrossRef]
  10. Gascó, C.; Alvarez, A.; Navarro, N.; Yagüe, L.; Tayibi, H.; López Gómez, F.A.; Antonio, F.; López-Delgado, A.; Alguacil, F.J. Advantages and disadvantages of using phosphogypsum as building material. In Proceedings of the 1st Spanish National Conference on Advances in Materials Recycling and Eco-Energy, Madrid, Spain, 12–13 November 2009. [Google Scholar]
  11. Ajam, L.; Ben Ouezdou, M.; Felfoul, H.S.; El Mensi, R. Characterization of the Tunisian phosphogypsum and its valorization in clay bricks. Constr. Build. Mater. 2009, 23, 3240–3247. [Google Scholar] [CrossRef]
  12. López, F.A.; Gázquez, M.; Alguacil, F.J.; Bolívar, J.P.; García-Díaz, I.; López-Coto, I. Microencapsulation of phosphogypsum into a sulfur polymer matrix: Physico-chemical and radiological characterization. J. Hazard. Mater. 2011, 192, 234–245. [Google Scholar] [CrossRef] [Green Version]
  13. Amrani, M.; Taha, Y.; Kchikach, A.; Benzaazoua, M.; Hakkou, R. Phosphogypsum recycling: New horizons for a more sustainable road material application. J. Build. Eng. 2020, 30, 101267. [Google Scholar] [CrossRef]
  14. Silva, M.V.; de Rezende, L.R.; dos Anjos Mascarenha, M.M.; de Oliveira, R.B. Phosphogypsum, tropical soil and cement mixtures for asphalt pavements under wet and dry environmental conditions. Resour. Conserv. Recycl. 2019, 144, 123–136. [Google Scholar] [CrossRef]
  15. Rutherford, M.J.; Dudas, P.M.; Samek, R.A. Environmental impacts of phosphogypsum. Sci. Total Environ. 1994, 149, 1–38. [Google Scholar] [CrossRef]
  16. Lysandrou, M.; Pashalidis, I. Uranium chemistry in stack solutions and leachates of phosphogypsum disposed at a coastal area in Cyprus. J. Environ. Radioact. 2008, 99, 359–366. [Google Scholar] [CrossRef]
  17. Al-Hwaiti, M.S.; Al-Khashman, O.A. Potentially Utilizations of Jordan Phosphogypsum: A Review. Int. J. Curr. Res. 2019, 11, 3258–3262. [Google Scholar]
  18. Tayibi, H.; Choura, M.; López, F.A.; Alguacil, F.J.; López-Delgado, A. Environmental impact and management of phosphogypsum. J. Environ. Manag. 2009, 90, 2377–2386. [Google Scholar] [CrossRef] [Green Version]
  19. Al-Hwaiti, M.; Ranville, J.; Ross, P. Bioavailability and mobility of trace metals in phosphogypsum from Aqaba and Eshidiya, Jordan. Geochemistry 2010, 70, 283–291. [Google Scholar] [CrossRef]
  20. Yeh, H.-F.; Huang, T.-T.; Lee, J.-W. Effect of Unimodal and Bimodal Soil Hydraulic Properties on Slope Stability Analysis. Water 2021, 13, 1674. [Google Scholar] [CrossRef]
  21. Paige-Green, P.; Gerber, S. An evaluation of the use of by-product phosphogypsum as a pavement material for roads. In Proceedings of the South African Transport Conference “Action in Transport for the New Millennium”, Pretoria, South Africa, 17–20 July 2000. [Google Scholar]
  22. Havanagi, V.; Sinha, A.K.; Parvathi, G.S. Characterization of Phosphogypsum waste for Road construction. In Proceedings of the Indian Geotechnical Conference, Bengaluru, India, 13–15 December 2018; pp. 13–15. [Google Scholar]
  23. IAEA. Radiation Protection and Management of NORM Residues in the Phosphate Industry. Safety Reports Series. No. 78. 2013. Available online: http://www-pub.iaea.org/MTCD/Publications/PDF/Pub1582_web.pdf (accessed on 25 June 2020).
  24. Janbu, N. Application of composite slip surface for stability analysis. In Proceedings of the European Conference on Stability of Earth Slopes, Stockholm, Sweden, 24–25 September 1954. [Google Scholar]
  25. Janbu, N. Slope stability computations. In Embankment Dam Engineering (Casagrande Memorial Volume); Hirschfield, E., Poulos, S., Eds.; John Wiley: New York, NY, USA, 1973. [Google Scholar]
  26. Husein Malkawi, A.I.; Fahmi, K.J. Locally derived earthquake ground motion attenuation relations for Jordan and conterminous areas. Q. J. Eng. Geol. 1996, 29, 309–319. [Google Scholar] [CrossRef]
  27. Jiménez, M.J. “Jordan Seismic Hazard Mapping” Final Report 20.07.2004; Institute of Earth Sciences “Jaume Almera” prepared for the Jordan Atomic Energy Commission (JAEC); Institute of Earth Sciences “Jaume Almera”: Barcelona, Spain, 2004. [Google Scholar]
  28. Ambraseys, N.N.; Simpson, K.A.; Bommer, J.J. Prediction of horizontal response spectra in Europe. Earthq. Eng. Struct. Dyn. 1996, 25, 371–400. [Google Scholar] [CrossRef]
  29. Malkawi, A.I.H.; Hassan, W.F.; Sarma, S.K. Global Search Method for Locating General Slip Surface Using Monte Carlo Techniques. J. Geotech. Geoenviron. Eng. 2001, 127, 688–698. [Google Scholar] [CrossRef]
  30. Husein Malkawi, A.I.; Hassan, W.F.; Sarma, S.K. An efficient search method for locating circular slip surface using Monte Carlo Technique. Can. Geotech. J. 2001, 38, 1081–1089. [Google Scholar] [CrossRef]
  31. Husein Malkawi, A.I.; Hassan, W.F. SAS-MCT 4.0, Stability Analysis of Slopes Using Monte Carlo Technique. A Software for 2-D and 3-D Slope Stability Analysis with Dynamic Effect, including Non-Circular Slip Surface. Windows Version. 2005. [Google Scholar]
  32. Duncan, J.M.; Wright, S.G.; Brandon, T.L. Soil Strength and Slope Stability, 2nd ed.; John Wiley & Sons: Hoboken, NJ, USA, 2014. [Google Scholar]
  33. Stark, T.D.; Ruffing, D.G. Selecting Minimum Factor of Safety for 3D Slope Stability Analyses. In Proceedings of the Geo-Risk 2017 Conference, Denver, CO, USA, 4–7 June 2017. Geotechnical Special Publication. [Google Scholar]
  34. Husein Malkawi, A.I.; Belakhdar, K. SAS-FEM 5.0, Stability Analysis of Slopes Using Finite Element Method. A Software for Slope Stability Analysis with Dynamic effect, Windows Version. 2008. [Google Scholar]
Figure 1. Contour map showing the critical sections under consideration; South-West sections and East sections.
Sustainability 14 15763 g001
Figure 2. 2-D level view of the South-West sections: (a) pile 0 + 520; (b) pile 0 + 600; (c) pile 0 + 680.
Sustainability 14 15763 g002aSustainability 14 15763 g002b
Figure 3. 2-D level view of the South-West sections: (a) pile 2 + 160; (b) pile 2 + 200; (c) pile 2 + 260.
Sustainability 14 15763 g003
Figure 4. Particle size distribution of the phosphogypsum used.
Sustainability 14 15763 g004
Figure 5. Proctor compaction curve.
Sustainability 14 15763 g005
Figure 6. Shear stress versus shear displacement curves.
Sustainability 14 15763 g006
Figure 7. Failure envelope for phosphogypsum.
Sustainability 14 15763 g007
Figure 8. Volumetric behavior of phosphogypsum.
Sustainability 14 15763 g008
Figure 9. PGA Contours at 10% probability of exceedance in 50 years Rp = 475 yr [27].
Sustainability 14 15763 g009
Figure 10. Slope geometry for (a) Section 0 + 600 and (b) Section 2 + 200.
Sustainability 14 15763 g010
Figure 11. (a) Critical circular slip surface for Section 0 + 600; (b) critical circular slip surface for Section 2 + 200; (c) critical non-circular slip surface for Section 0 + 600; (d) critical non-circular slip Surface for Section 2 + 200.
Sustainability 14 15763 g011
Figure 12. (a) All tested circular slip surfaces using the jumping and walking method for Section 0 + 600; (b) safety factor convergence for Section 0 + 600;(c) all tested circular slip surfaces using the jumping and walking method for Section 2 + 200; (d) safety factor convergence for Section 2 + 200.
Sustainability 14 15763 g012
Figure 13. (a) Three-dimensional circular slip surface for Section 0 + 600; (b) three-dimensional circular slip surface for Section 2 + 200.
Sustainability 14 15763 g013
Figure 14. (a) Deformation and the FE Mesh; (b) failure surface for Section 0 + 600.
Sustainability 14 15763 g014
Figure 15. FOS versus (a) the total deformation; (b) the number of iterations for Section 0 + 600.
Sustainability 14 15763 g015
Figure 16. (a) Deformation and the FE Mesh; (b) failure surface for Section 2 + 200.
Sustainability 14 15763 g016
Figure 17. FOS versus (a) the total deformation; (b) the number of iterations for Section 2 + 200.
Sustainability 14 15763 g017
Table 1. Chemical composition of raw phosphogypsum.
Analysis Unit Results
P2O5%1.87
SO3%51.22
SiO2%9.14
Al2O3%0.26
Fe2O3%0.15
K2O%0.02
Na2O%0.42
F%0.79
Calcium Oxide%35.56
Dry solids at 60 C%96
Dry solids at 250 C%80.52
CIPPm94
PH (1% Solution) 3.340
Table 2. Minimum factor of safety for different loading conditions [32].
ConditionMinimum
1For general slope stability analysis of permanent cut, fill.. etc.1.25 to 1.5
2With earthquake loading in addition (Pseudo-static)1.0
Table 3. Recommended 2-D and 3-D FS for various scenarios [33].
Soil Strength Uncertainty Imminent Threat to Human Life Potential for Major Construction or Environmental Impact Recommended Minimum 2-D FS Minimum 3-D FS
SmallLow Low1.31.4
SmallHigh High1.51.7
SmallLowHigh1.31.5
SmallHighLow1.51.7
LargeLowLow1.51.7
Large HighHigh2.02.3
LargeLowHigh1.51.7
LargeHighLow2.02.3
Table 4. Calculated factor of safety under different loading conditions, Section 0 + 600.
Condition Factor of Safety
Limit Equilibrium Methods (LEA)CircularNon-CircularMinimum Required Factor of Safety
StaticDynamicStaticDynamic
2-D3-D2-D3-D2-D2-D
Present Level (Static)Ordinary Method1.7-----1.25 to 1.5
Bishop1.8141.803----
Janbu1.6951.773--1.82-
With Earthquick Loading
(Pseudo-static)
Ordinary Method--1.408 *
1.30 **
---1.00
Bishop--1.399 *
1.247 **
1.203 *
1.027 **
--
Janbu--1.297 *
1.152 **
1.252 *
1.076 **
-1.372 *
1.228 **
* PGA = 0.135 g Rp = 475 yr; ** PGA = 0.2 g Rp = 475 yr.
Table 5. Calculated factor of safety under different loading conditions, Section 2 + 200.
Condition Factor of Safety
Limit Equilibrium Methods (LEA)CircularNon-CircularMinimum Required Factor of Safety
StaticDynamicStaticDynamic
2-D3-D2-D3-D2-D2-D
Present Level (Static)Ordinary Method1.905-----1.25 to 1.5
Bishop2.0272.073----
Janbu1.8962.018--2.119-
With Earthquick Loading
(Pseudo-static)
Ordinary Method--1.567 *
1.444 **
---1.00
Bishop--1.567 *
1.40 **
1.246 *
1.035 **
--
Janbu--1.452 *
1.291 **
1.292 *
1.072 **
-1.52 *
1.44 **
* PGA = 0.135 g Rp = 475 yr; ** PGA = 0.2 g Rp = 475 yr.
Table 6. FEM Results for All Critical Sections.
Pile ID Finite Element Method (FEM), (Static Analysis)
The Minimum Required Factor of Saftey Is 1.25 to 1.5
Factor of Safety Number of Nodes Number of LST Element Max Displacement, (m)
0 + 5201.84230043720.211
0 + 6001.82218141250.173
0 + 6802.12251547780.246
2 + 1602.18178133470.0204
2 + 2002.06234344220.0172
2 + 2603.3218941540.0268
Publisher’s Note: MDPI stays neutral with regard to jurisdictional claims in published maps and institutional affiliations.