Article

Parametric Study on Steel–Concrete Composite Beams Strengthened with Post-Tensioned CFRP Tendons

1
Department of Civil and Environmental Engineering, University of Missouri, Columbia, MO 65211, USA
2
Department of Structural Engineering, Zagazig University, Zagazig 44519, Egypt
3
Department of Civil Engineering, Southern Illinois University Edwardsville, Edwardsville, IL 62026, USA
*
Author to whom correspondence should be addressed.
Sustainability 2022, 14(23), 15792; https://doi.org/10.3390/su142315792
Submission received: 15 October 2022 / Revised: 13 November 2022 / Accepted: 18 November 2022 / Published: 28 November 2022
(This article belongs to the Section Green Building)

Abstract

:
A sustainable environment can be achieved by strengthening the existing building to avoid new construction and by replacing the construction materials with long-lasting sustainable materials such as a fiber-reinforced polymer (FRP). Using post-tensioned (PT) FRP systems has proven to be an effective technique in strengthening the structure and decreasing cracks and deformability. In this study, a 3-D finite element model was built to investigate the flexural behavior of composite beams strengthened with external PT FRP tendons. Limited research studied the use of FRP tendons to enhance the structural behavior of composite beams. This paper represents a comprehensive study of the effect of several parameters that control the design of the FRP tendons. Parameters such as PT level, tendon material, tendon length, degree of shear connection (DOSC), and tendon profile shape were considered under loading. The 3-D model’s correctness is validated using published experimental data. It was observed that of all FRP materials, carbon FRP is the best type for upgrading the beam strength, and it was recommended to use a 30 to 40% PT level. In addition, applying external PT over the full length of the beam increases the ultimate load capacity significantly. However, due to the difficulty of construction, it was recommended to use 90% of the beam span length since the difference in beam capacity does not exceed 5%. Finally, adding PT tendons with a trapezoidal and parabola profile to composite beams significantly increases the yield load and the beam capacity.

1. Introduction

In terms of sustainability, strengthening using post-tension is a structural method that not only speeds up construction but also significantly decreases CO2 emissions because less concrete is used while rebuilding [1,2,3]. In addition, environmental effects can be reduced by recycling composites and recovering and reusing fibrous materials [4].
The post-tensioning technique has become one of the most popular strengthening technologies during the past 20 years. By reducing deflection and enhancing the stiffness and carrying capacity of the structural elements, this technology allows designers and engineers to use materials more effectively. Several studies investigated this strengthening approach and focused on its effectiveness in improving the behavior of structural elements when exposed to various types of stresses [5,6].
Ayyoub et al. conducted an experimental study on external post-tensioning composite beams (CBs) [7]. It was reported that straight tendon profiles are preferred because they are economical; however, draped tendon profiles fared better in terms of capacity and deflection.
Chen et al. provided experimental results from testing a CB fortified with external post-tensioning tendons under the influence of positive moments [8]. It was found that adding post-tensioning tendons enhanced yield load and ultimate resistance by around 49% and 53%, respectively. It was also found that the ultimate moment of the non-strengthened specimens approximated the plastic moment of the steel section. In addition, the ultimate moment of strengthened beams varied from 1.03 to 1.11 from the yield moment at which the compression flange-initiated yield.
Nie et al. studied both analytical and experimental investigations to look into the behavior of pre-stressed steel–concrete CBs [9]. It was suggested to use a reduced stiffness approach to calculate the deflection, yield, and ultimate moments of pre-stressed CBs. The slip impact on yield moment and deflection was found to greatly improve analytical prediction accuracy. Finally, the following equations could be used to represent the yield moment of the pre-stressed continuous steel–concrete CB:
Mpy = ξ × My
where ξ is the coefficient of slip effect accounted for the pre-stressed continuous steel–concrete CB, and My is the calculated yield moment by transformed section method, and this could be determined from Equation (2);
My = W(ɛi + ɛy)Es
where W is the equivalent section modulus, ɛi is strain at the bottom of steel caused by tendon before casting the concrete slab, and ɛy is the yield strain of the steel beam, respectively. The provided formulae demonstrated a significant agreement with the experimental results, indicating that they may be utilized properly for the design and analysis of pre-stressed CBs.
De Lee et al. carried out an experimental study on three full-scaled non-pre-stressed and pre-stressed CBs with corrugated webs under flexural loads [10]. The test analysis showed that, before compositing with concrete, the accordion effect significantly increased the introduced pre-stress in the top and bottom flanges of the steel beam. The flexural strength and stiffness of the pre-stressed specimens were superior to those of the non-pre-stressed specimens after being composite with concrete.
El-Zohairy et al. created a 3-D finite element (FE) model to simulate the nonlinear flexural behavior of steel–concrete CBs strengthened with post-tensioned tendons [11]. The nonlinear material behavior and geometrical analysis were performed using incremental–iterative load techniques. The results of the FE analysis are compared to experimental results. The overall behavior of the strengthened beam was studied, as well as the effect of external post-tensioning on stiffness, induced stresses, slippage between the concrete slab and steel beam, and shear connector moments. The authors indicated that adding external post-tensioning tendons in the positive moment area of steel–concrete CBs improved their ultimate capacity by 25%, stiffness by 33%, and the overall performance of the bridge structural system significantly improved.
Fiber-reinforced polymer (FRP) materials are made up of two main components: fiber materials and matrix materials. Carbon fiber, glass fiber, and aramid fiber are the most common fiber materials, whereas resins are the most common matrix materials [12]. Glass and carbon fiber have nearly perfect linear failure behavior. Creep deformation becomes increasingly critical in most FRP composites at high-stress levels, high temperatures, or a combination of the two. Creep will not be a significant concern if the structure’s loads are kept within the manufacturer’s suggested stress levels [13]. FRP outperforms metallic materials in terms of fatigue resistance [13]. Although there has been minimal research in bigger structures, fatigue failure in FRP is uncommon except at joints, connections, and anchoring details.
FRPs have recently been popular in civil engineering, especially for structural reinforcement, because of their light weight, high strength, and corrosion resistance [14,15,16]. The use of FRP tendons greatly increased the flexural strength, fatigue life, and serviceability of the beams [17,18,19].
Some researchers studied the shear and flexural performance of reinforced concrete beams reinforced using FRP materials and discovered some interesting reinforcing effects.
Hawileh et al. investigated the influence of externally bonded carbon fiber reinforced polymer (CFRP) sheets on the shear strength of shear-deficient reinforced concrete beams connected to the soffit of the beam [20]. They reported that the shear strength of reinforced concrete beams improved by 10–70% as compared to control specimens. They also reported that the flexural longitudinal reinforcement ratio had an impact on the shear strength of reinforced beams [21,22].
Grace and Abdel-Sayed examined four bridge models under static, repeated, and ultimate loads using internally bonded and externally unbonded draped CFRP tendons [23]. Two of the bridges were right-angle bridges, while the others were skew bridges. None of the externally draped tendons ruptured during testing. The prestressing force in the external tendons increased to almost double the original values at the maximum.
Limited research has studied the use of FRP tendons to enhance the structural behavior of composite beams. This paper represents a comprehensive study of the effect of several parameters that control the design of the FRP tendons. The main objective of this research is to develop a numerical model to simulate the behavior of the steel–concrete CBs, with FRP external post-tension tendons, studying the effects of several parameters such as tendon materials, tendon eccentricity, tendon length, degree of shear connection (DOSC), post-tension level, and tendon profile in the behavior of the CBs. Several tendon materials were used, such as steel, CFRP, aramid fiber-reinforced polymer (AFRP), and glass fiber-reinforced polymer (GFRP) with different post-tensioning (PT) levels. ANSYS FE software (v18.1, Ansys, Canonsburg, PA, USA) was used in this study to create a nonlinear FE model (FEM) for the post-tensioned CBs using CFRP tendons [24]. The FEM was validated by comparing the FEM result with the experimental work.

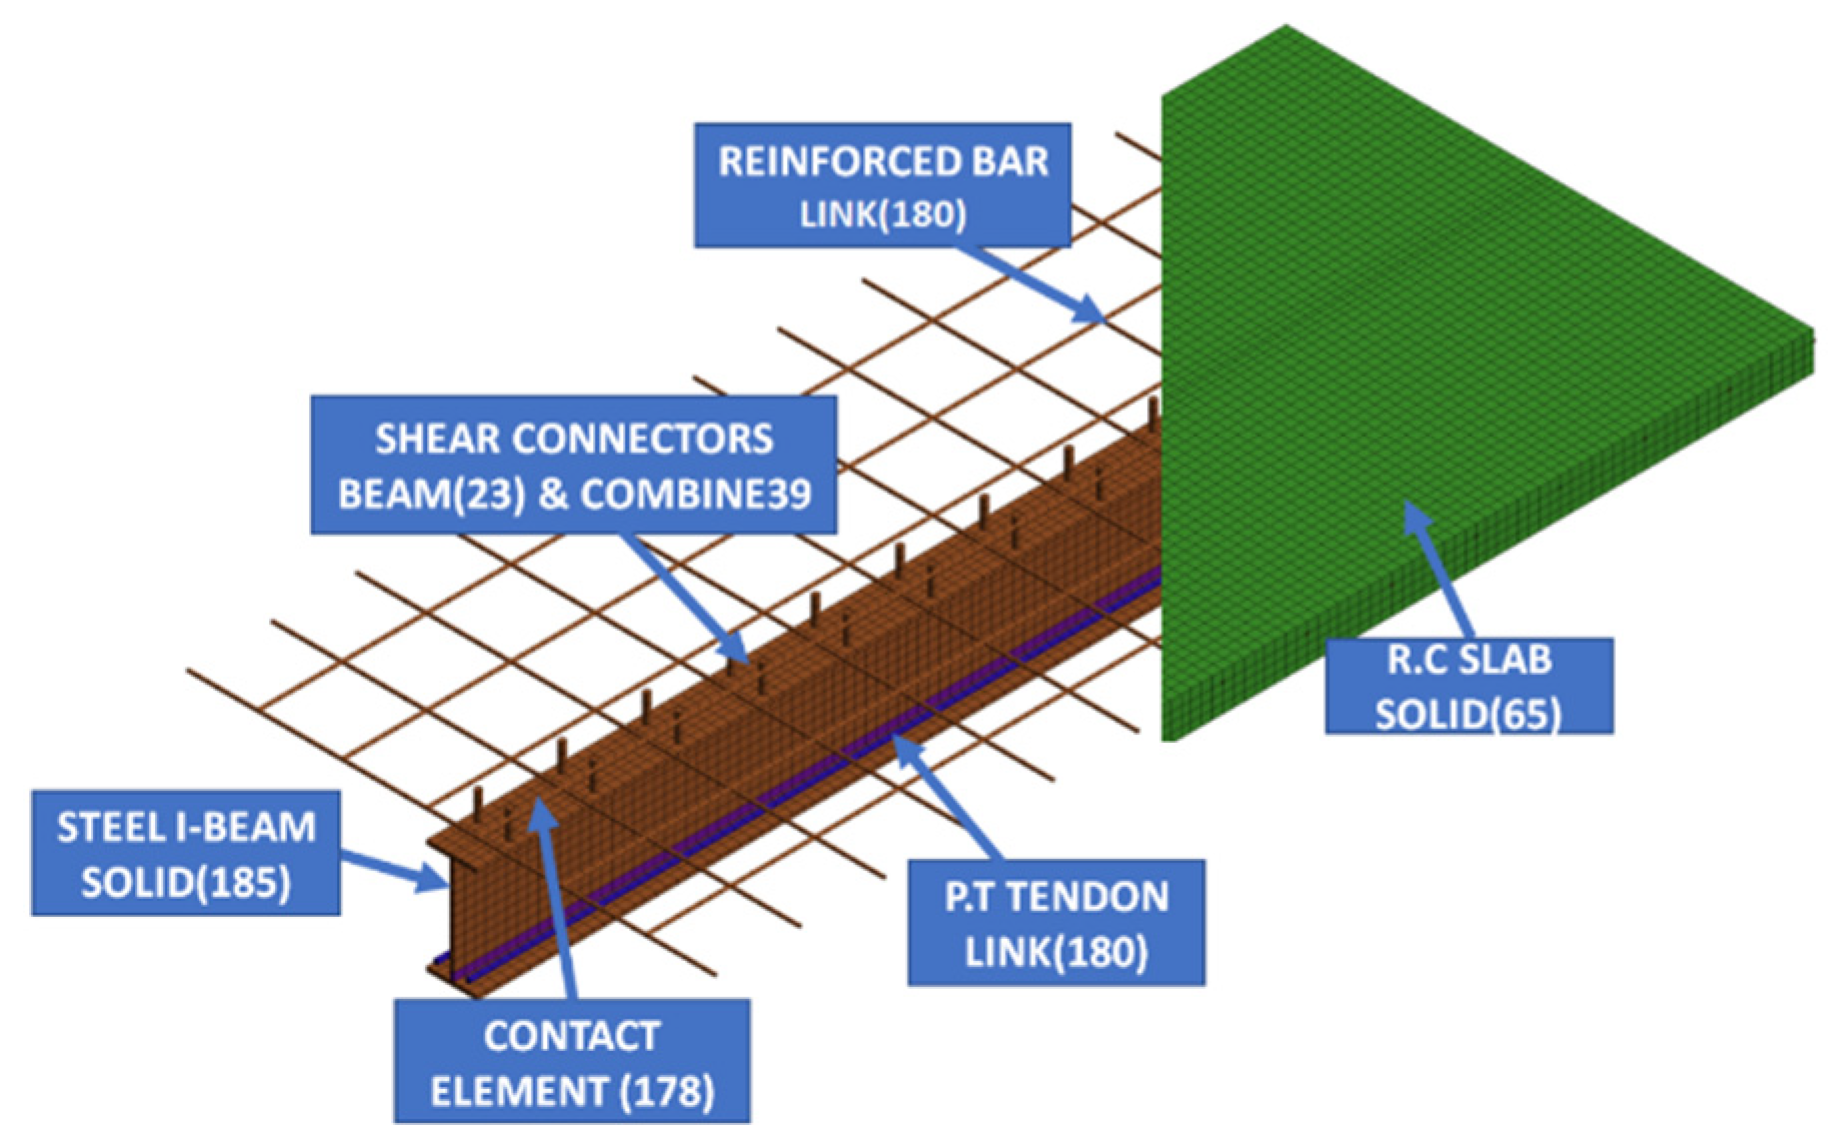
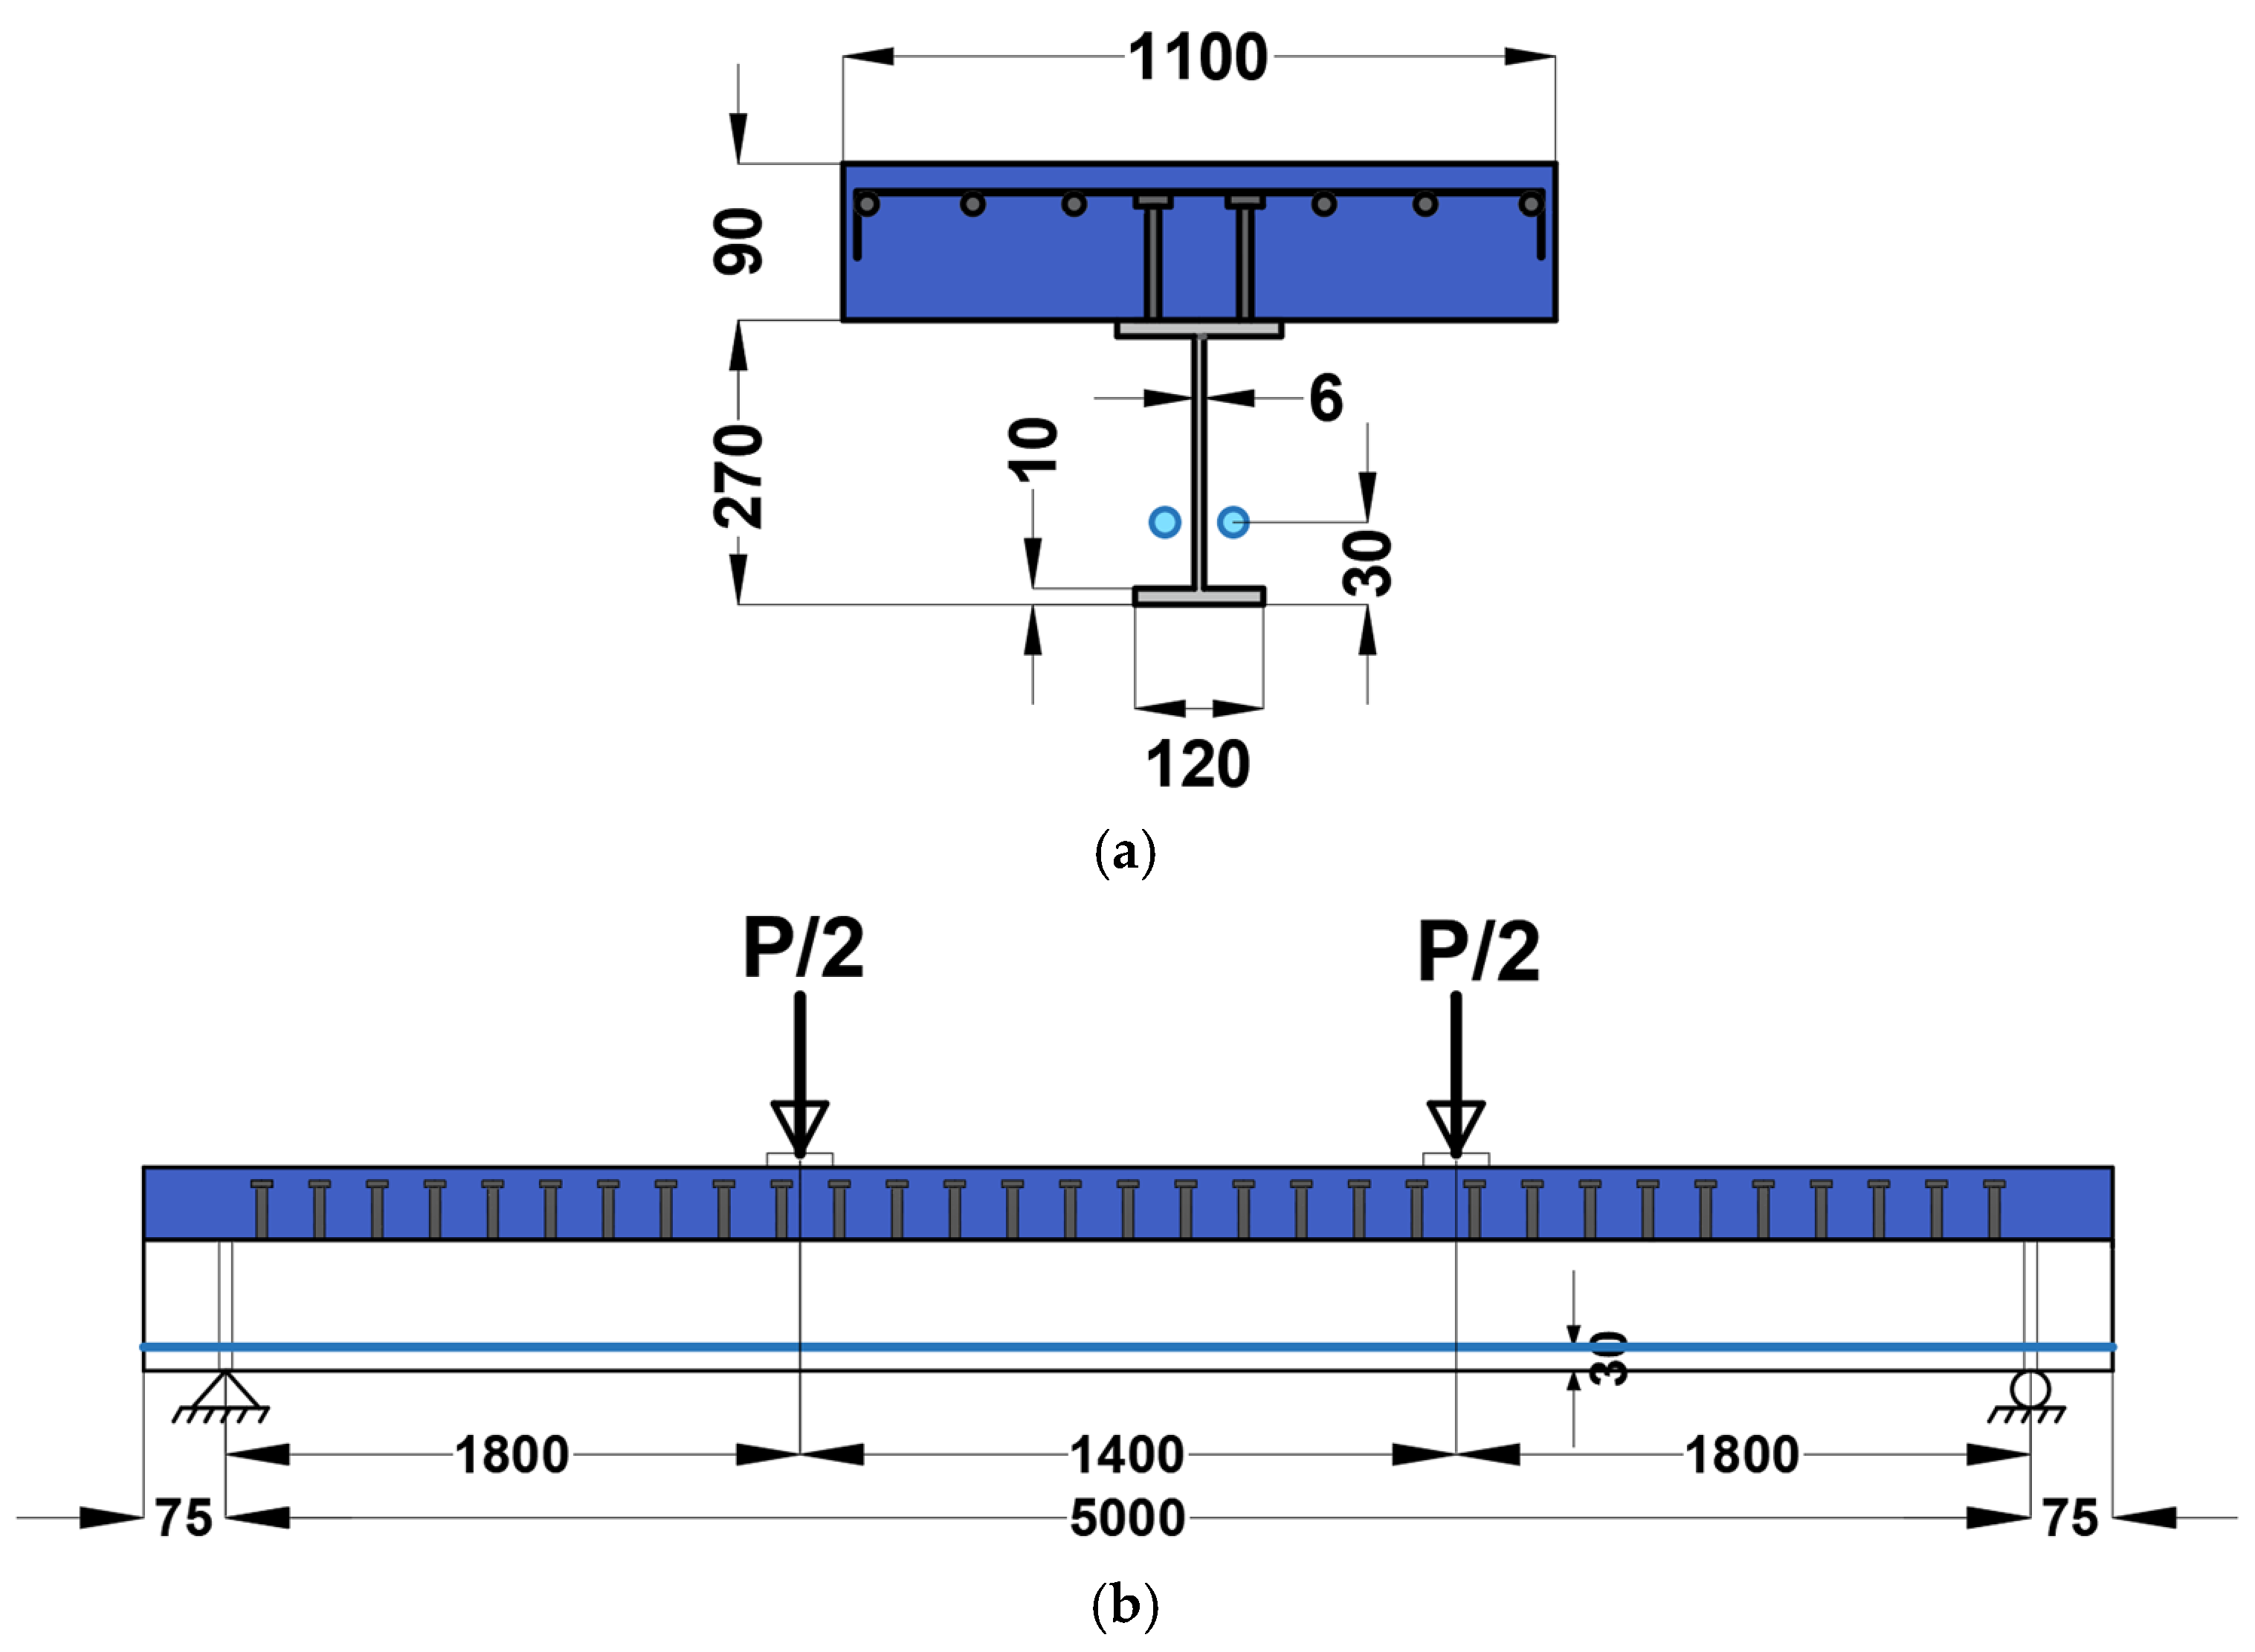
2. Finite Element Model

In this study, the ANSYS FE program was employed. Seven different element types were used to model the concrete slab, steel I-beam, steel reinforcement, shear connectors, the interface between the concrete slab and the steel I-beam, and the external post-tension tendons [24]. Figure 1 shows the FEM mesh of the composite cross-section.
The SOLID65 element was used to model the concrete. This element has eight nodes with three degrees of freedom at each node, i.e., translations in the nodal x, y, and z directions. These elements are capable of developing plastic deformation, cracking in three orthogonal directions, and crushing [25]. The capability of cracking and crushing makes the model able to simulate the post-beak behavior of the concrete by reducing the compressive strength gradually after the peak. LINK180 is a 3-D spar element used to model the reinforcing bars and external post-tensioning tendons. It has two nodes with three degrees of freedom, i.e., translations in the nodal x, y, and z directions [26].
The interface between the upper steel flange and the slab was represented by using surface-to-surface contact; the element consists of 4 nodes [27].
The SOLID185 element was used for steel I-beam and loading plates. It is defined by eight nodes having three degrees of freedom at each node, i.e., translations in the nodal x, y, and z directions. The element has plasticity, hyper-elasticity, stress stiffening, creep, large deflection, and large strain capabilities. The uniaxial beam element, BEAM23, was used to simulate the shank of the shear connector.
The unidirectional spring element, COMBINE39, was used to simulate the shear slippage behavior of the shear connector. The shear-slippage curve of the stud was used as a force deformation relation for the spring element, i.e., ANSYS element real contact.
For the headed studs, the constitutive relationship introduced by Ollgaard et al. [28] was used to generate the shear slippage curve of the shear connector [19,29,30]. The analytical relation between the shear force, Fj, and the slip, Sj, of the generic stud can be found in Equation (3). Reasonable results were obtained with a curve with the values 0.558 and 1.0 of α and β, respectively [30].
Fj = PU (1 − e − β× Sj)α
Fj: Shear force
PU: Ultimate strength of the shear connectors
Sj: Slip between the slab and the steel profile
α & β: Parameters manage the initial slope and the shape of the curve.
Real constants
To simulate the post-tensioning initial force, effect temperature load was used. The initial temperature, which is computed as provided by Equation (4), defines the relationship between the temperature load and the tension force.
Initial temperature = F/αEAp
F: The post-tension force.
E: Tendon modulus of elasticity.
α: Coefficient of thermal expansion.
Ap: Cross section of the tendon.

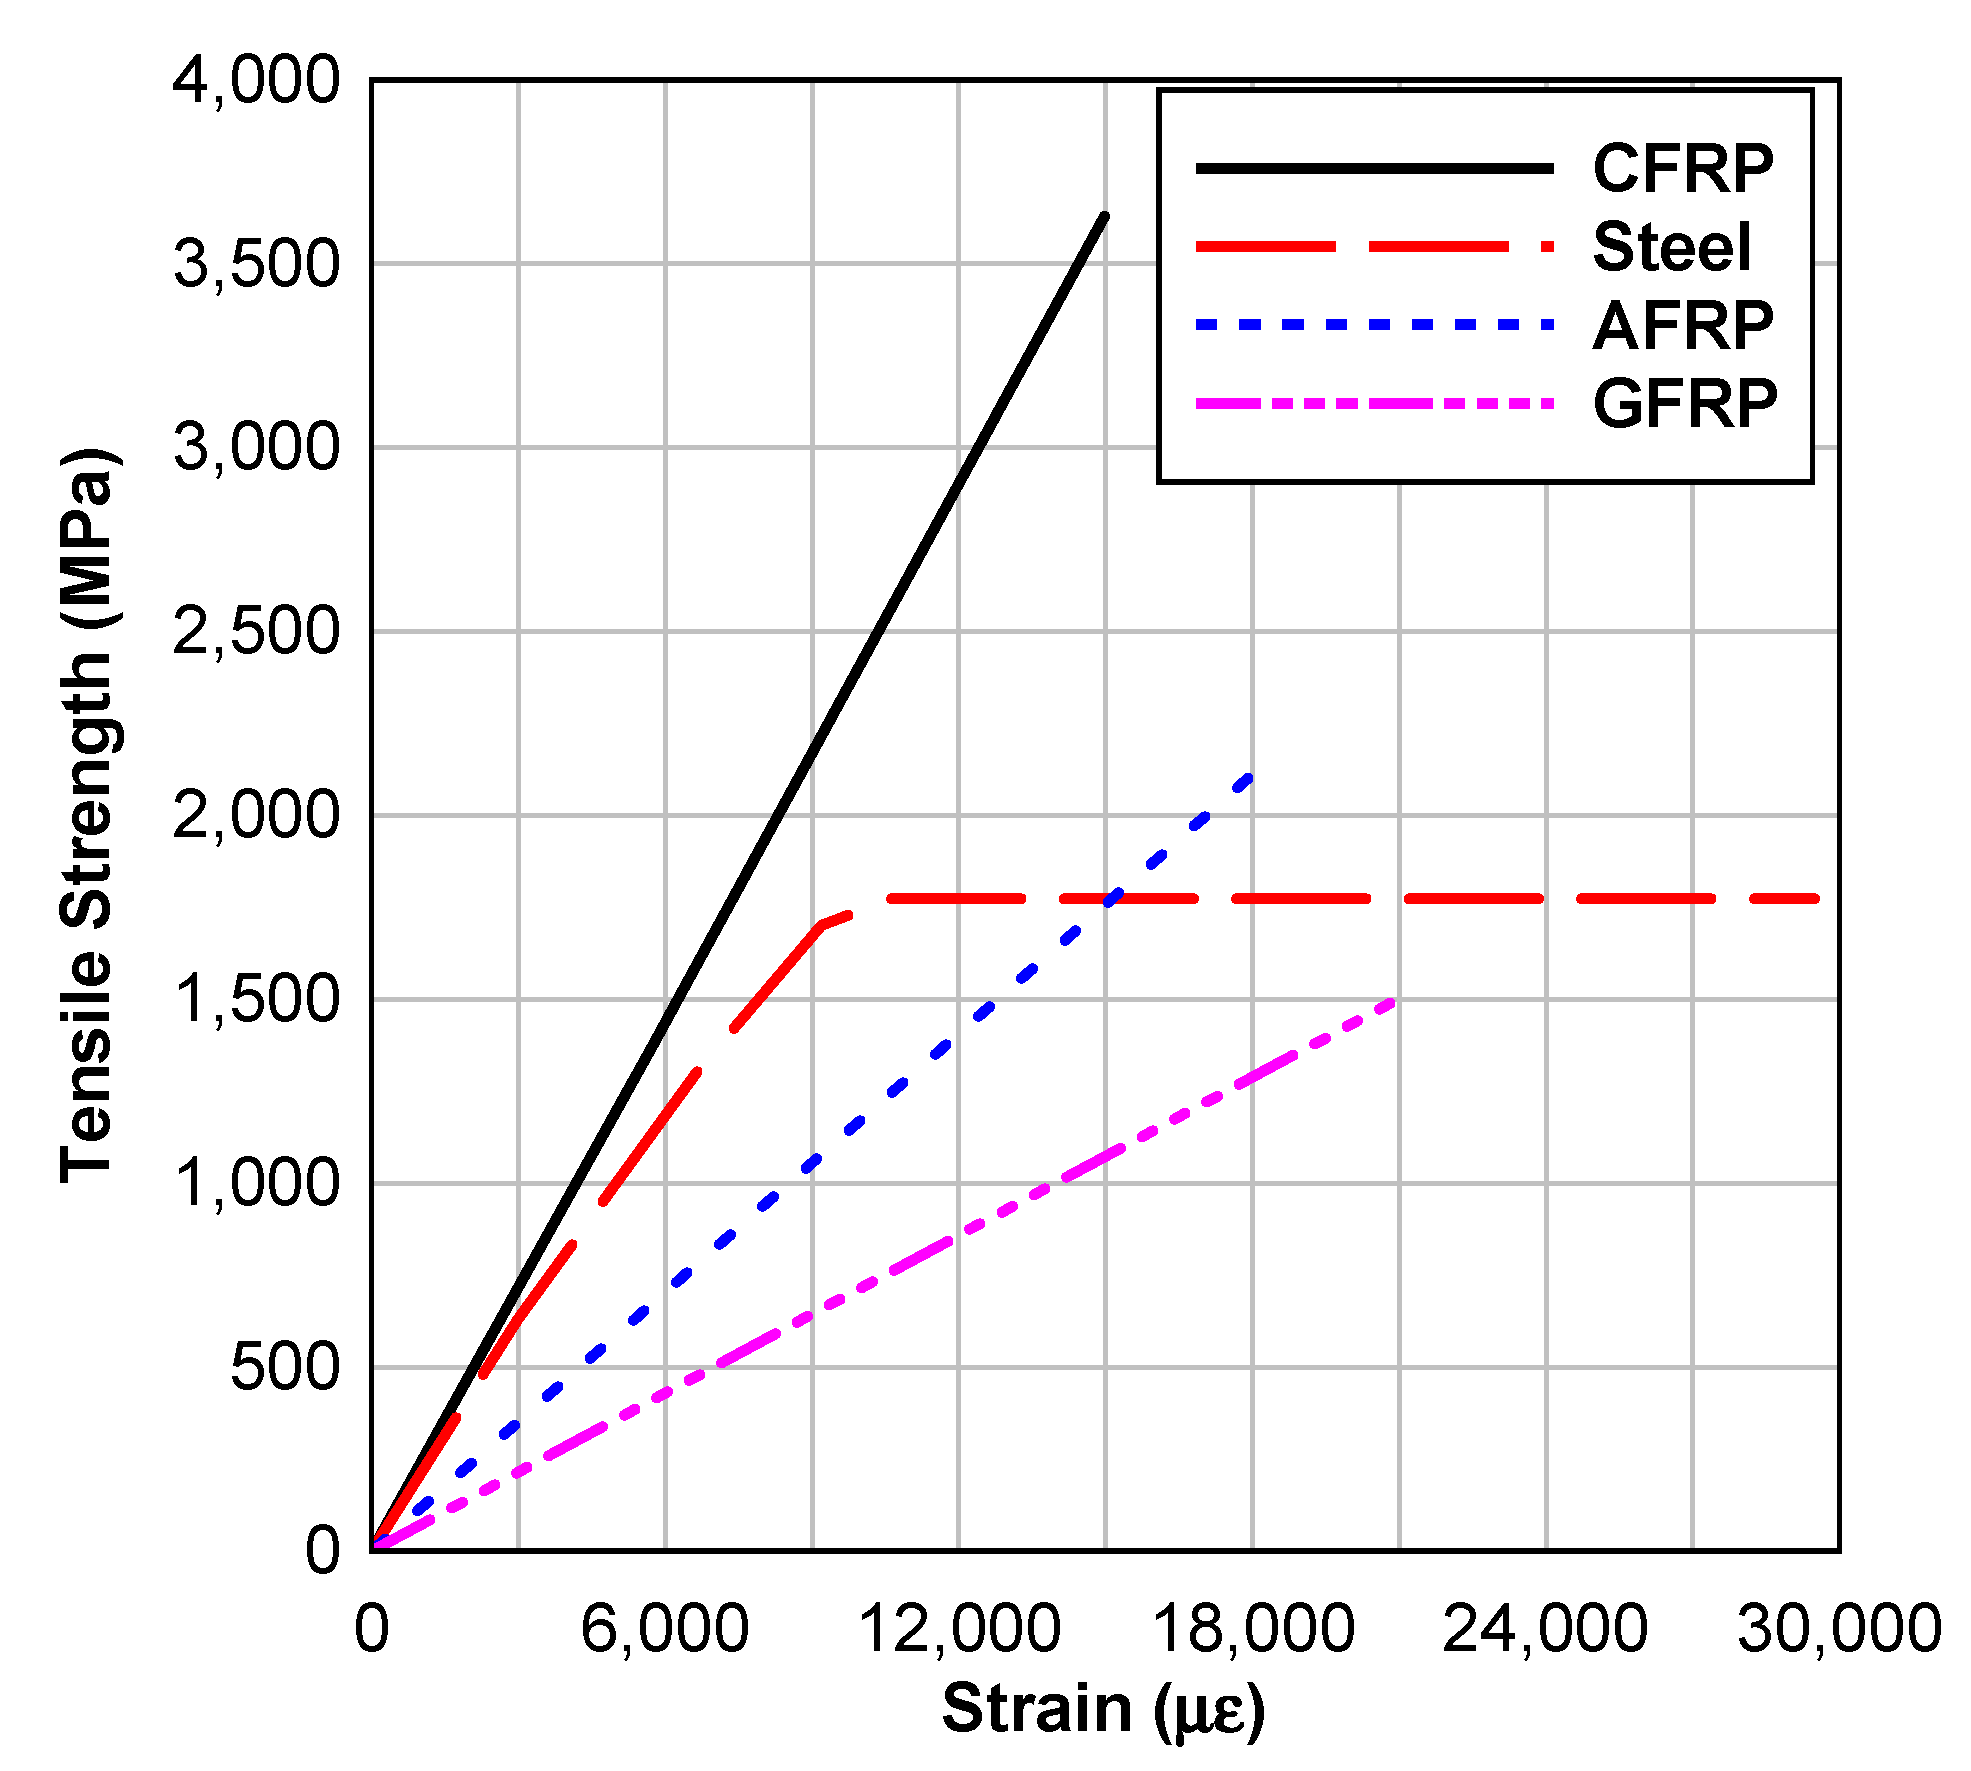
2.1. Material Modeling
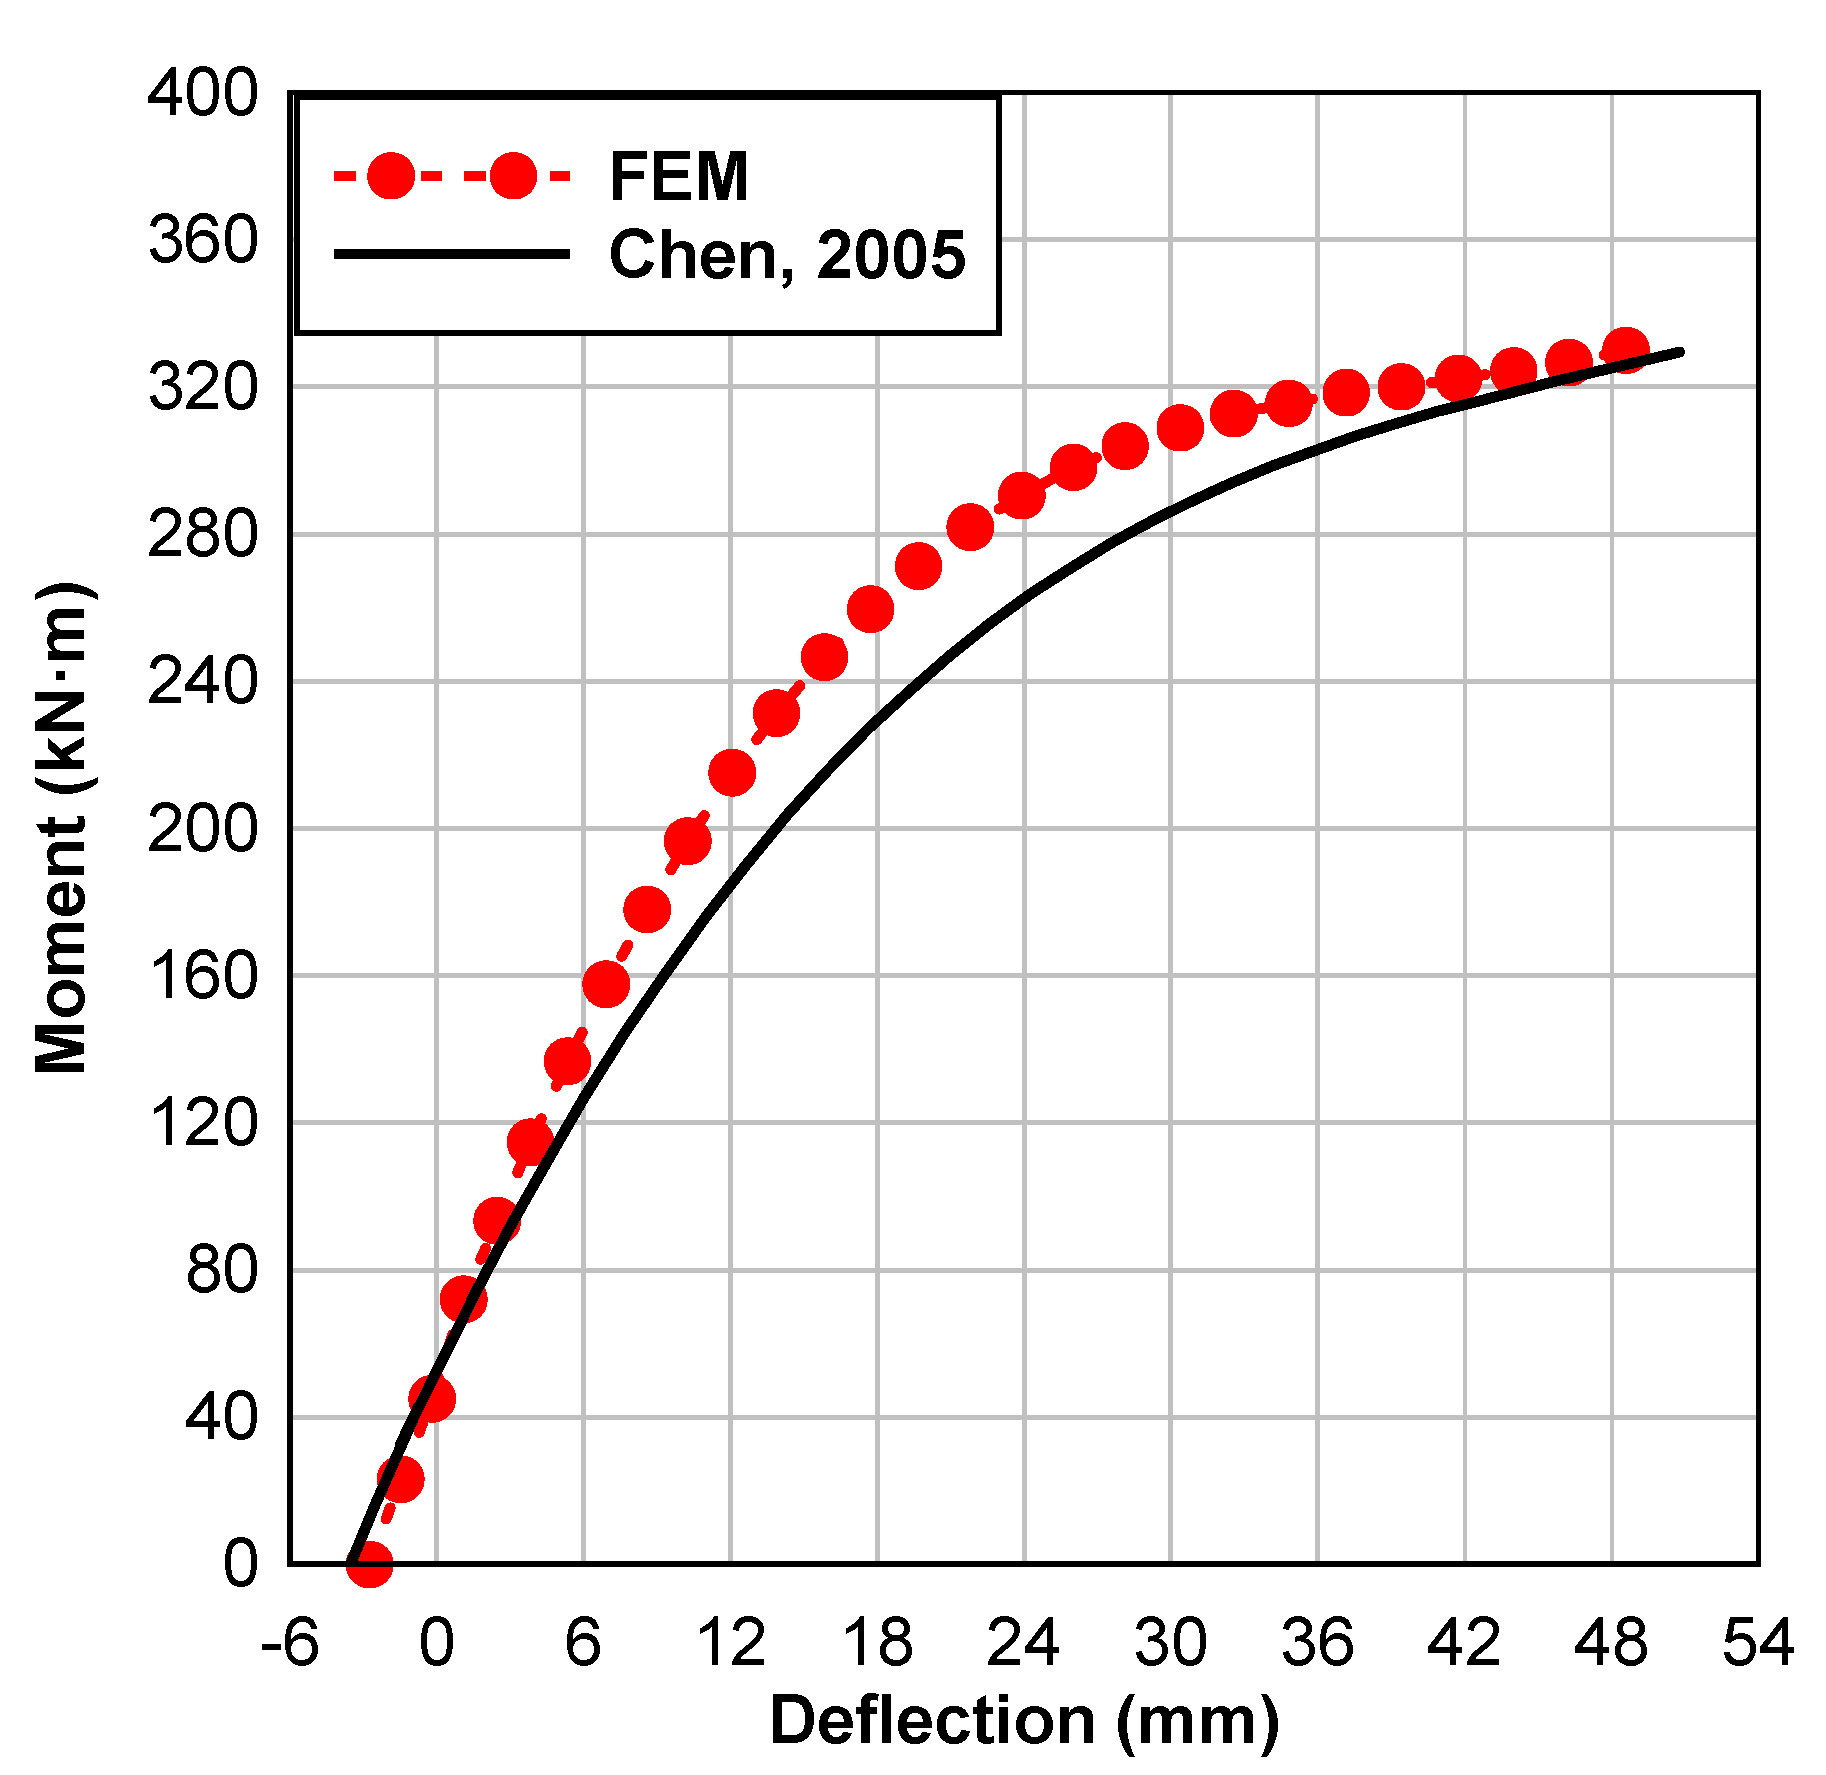
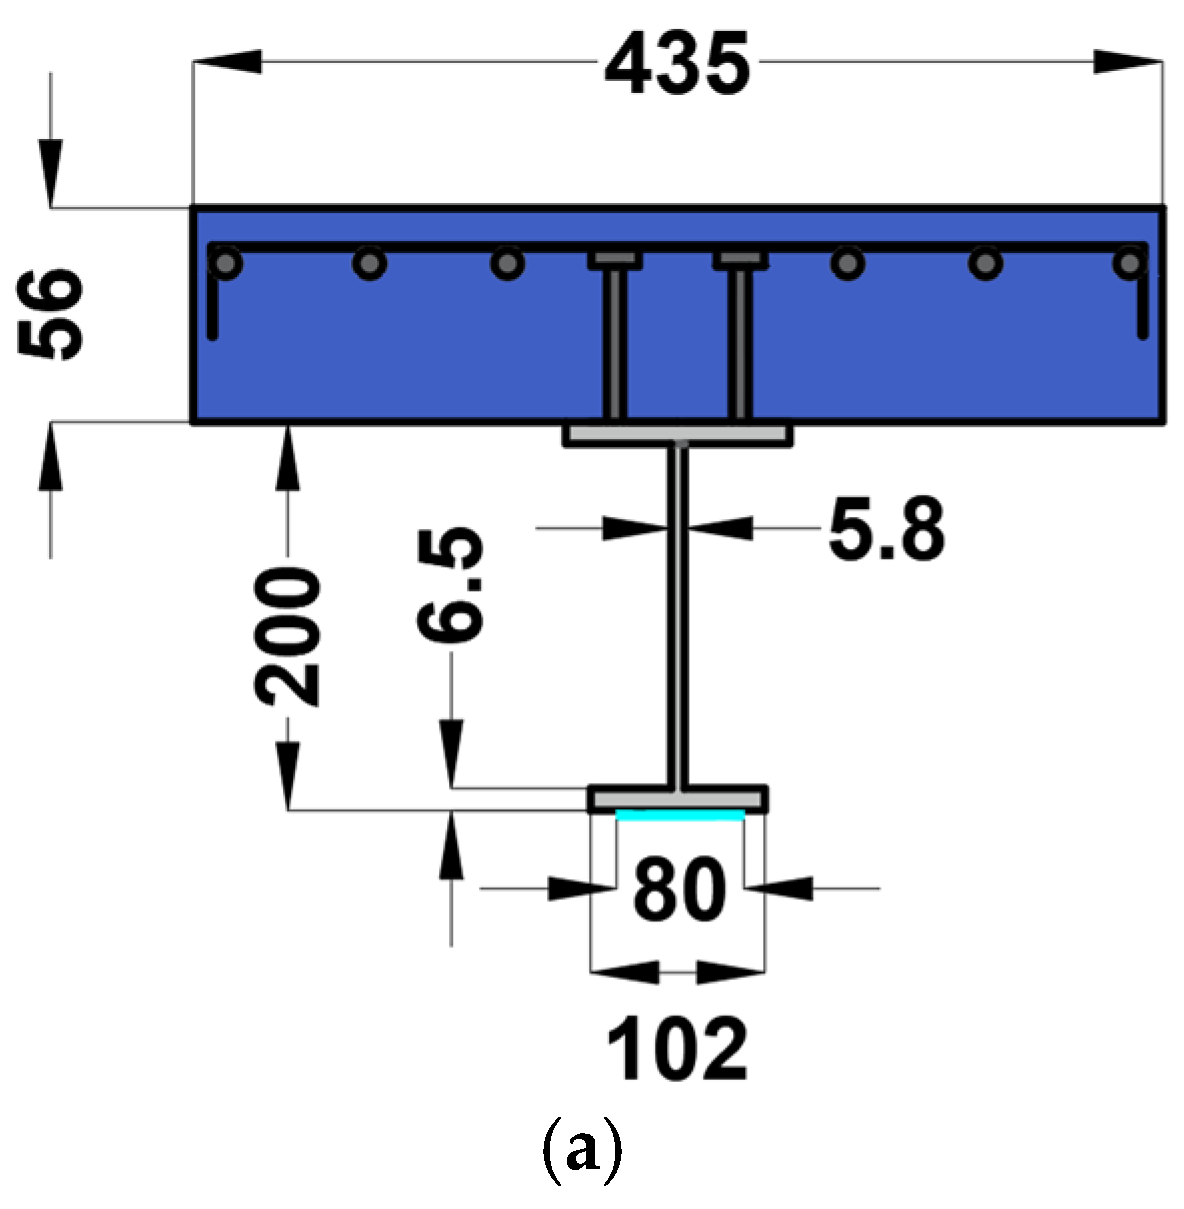
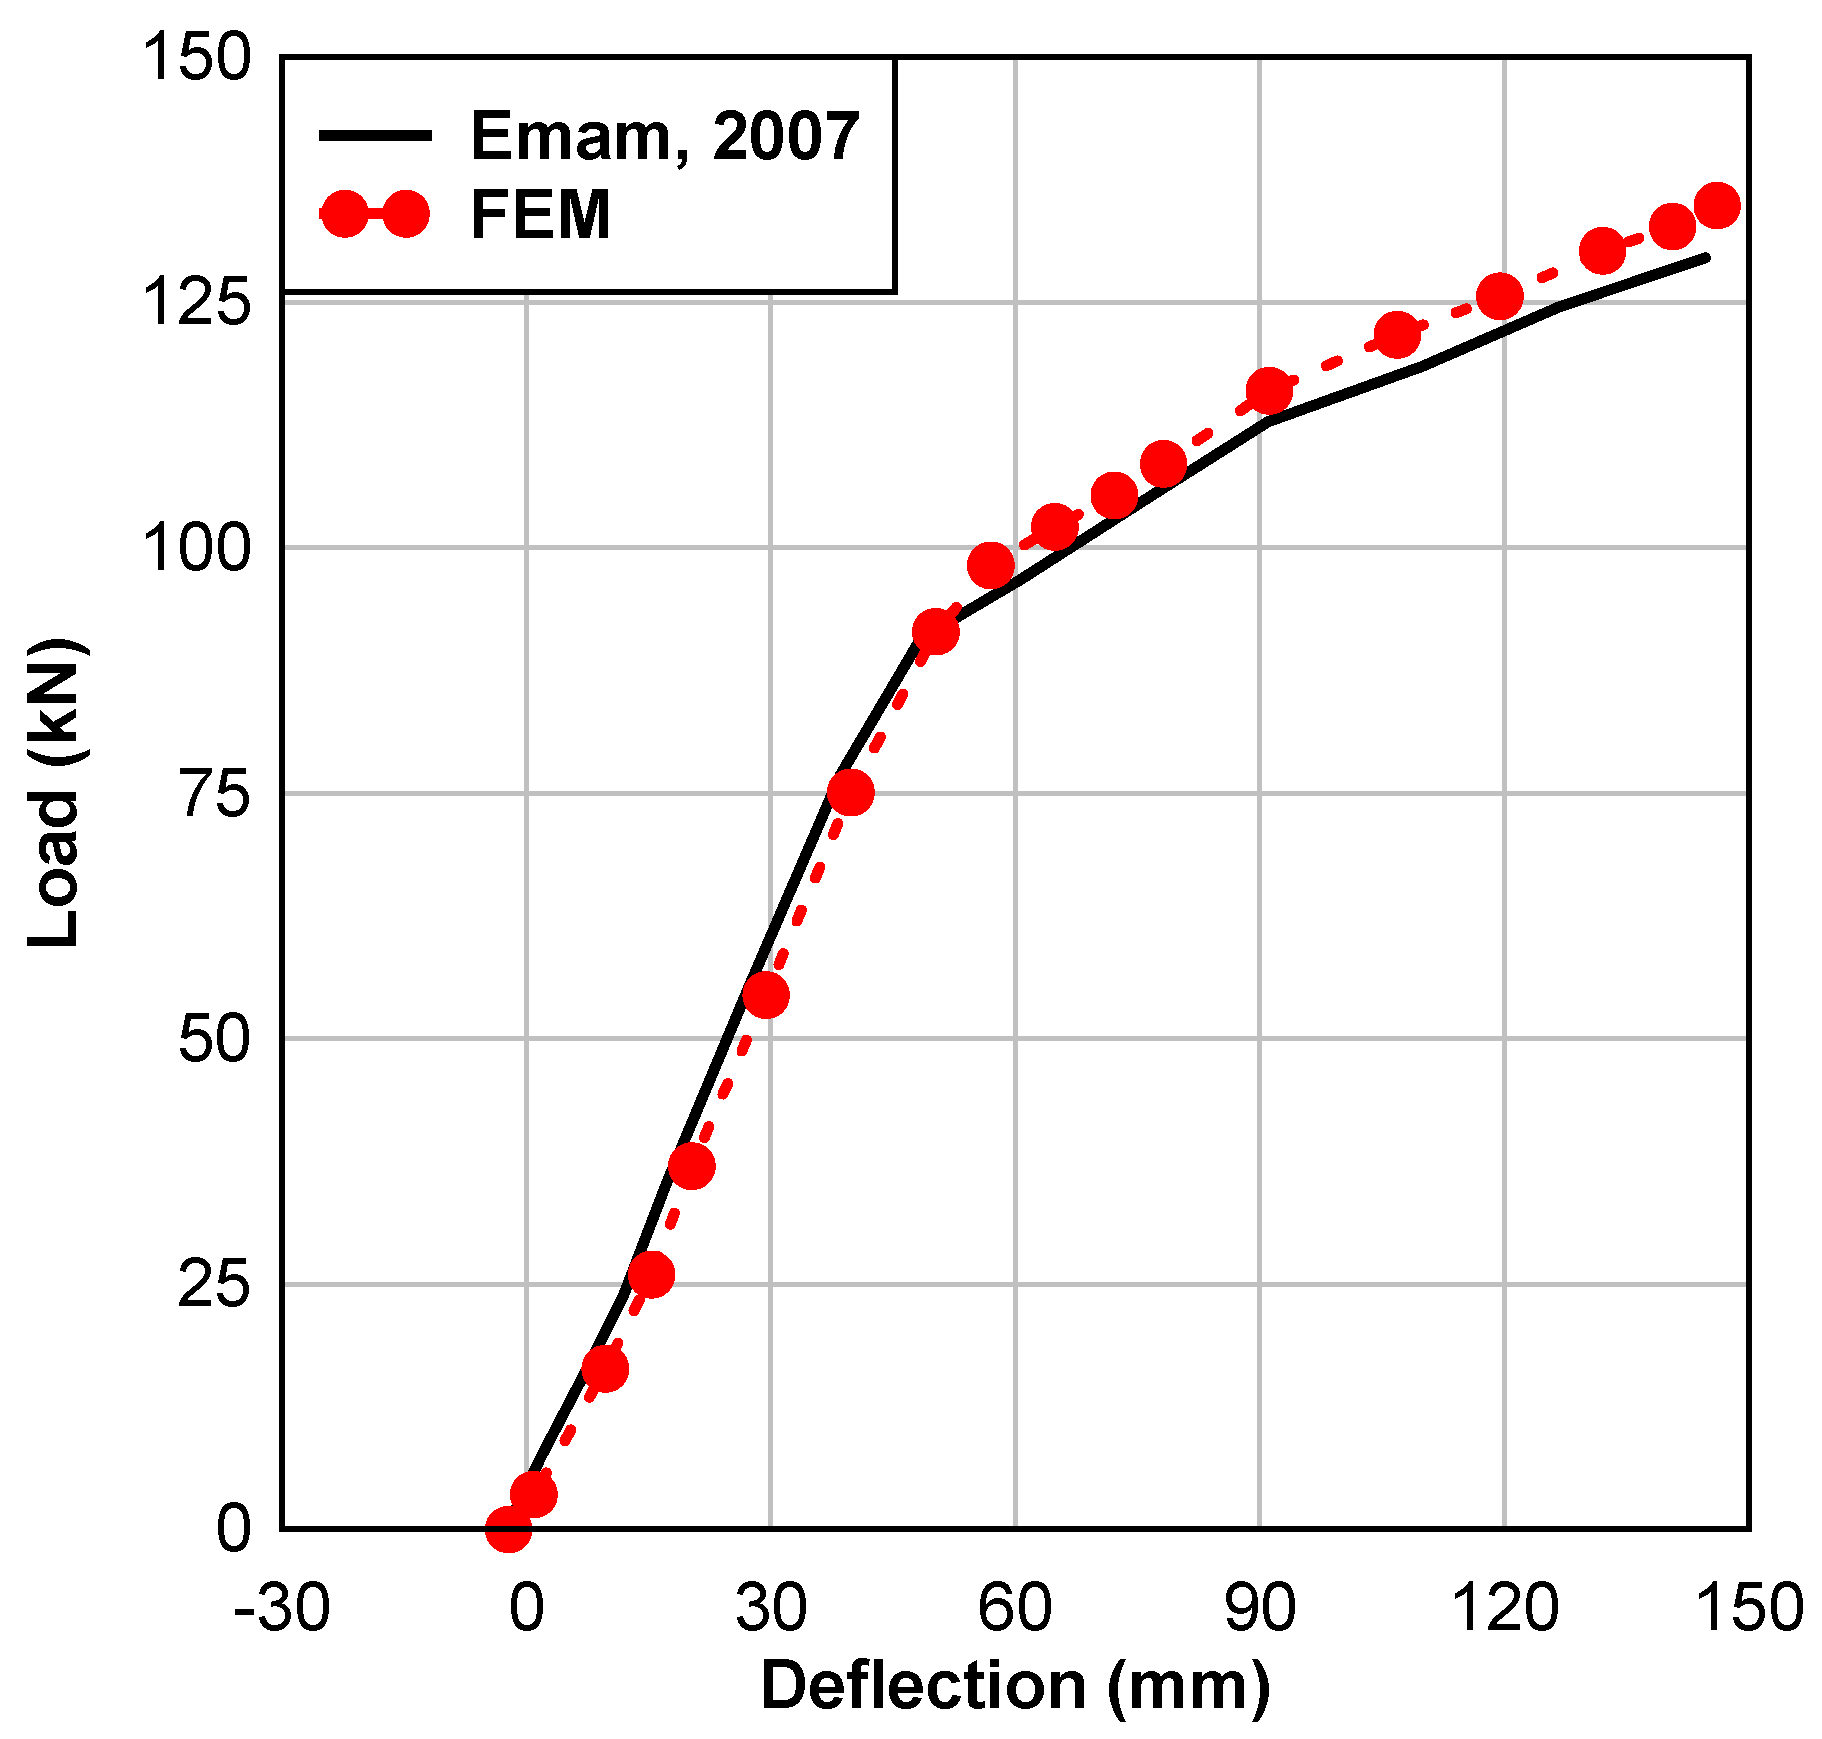
The concrete was modeled to be homogeneous and initially isotropic. ANSYS requires the uniaxial stress–strain curve of the concrete in compression as an input. A multilinear curve was used in which a simplified stress–strain curve was created by connecting nine points, as illustrated in Figure 2a [31,32].
The bilinear isotropic hardening model was used to simulate the nonlinear behavior of the steel beam. The required parameters are the elastic modulus and yield stress which were evaluated experimentally; see Figure 2b.
Because the steel bars and tendons are slender, they may be considered to transfer primarily axial forces only [33,34]. Similar to the steel beam, a bilinear isotropic hardening model was used for the steel rebar.
To simulate the brittle behavior of the FRP tendon, a linear elastic material model was used. The solution was tracked to make sure that the maximum strain of the tendon did not exceed the failure strain. Figure 3 shows the stress–strain relation of the used tendon compared to the stress–strain relation of the steel.

2.2. Verification

Experimental work performed by Chen et al. [8] and Emam [35] was chosen from the literature to validate the FEM. For Chen et al., the dimensions, details, and profiles of the post-tensioned tendons for the investigated beams are shown in Figure 4a,b [8]. The beams under consideration had a total length of 5150 mm with a simply supported span (L) of 5000 mm. The beam height (H) is equal to 200 mm and tendon elevation (He) is equal to 30 mm. They were tested using a four-point bending setup. Two rows of shear studs with an 8 mm radius and 65 mm height were welded to the flange. The transversal spacing between the two rows was 76 mm with a spacing of 200 mm along the beam span. The concrete slabs were reinforced in two orthogonal directions with 8 deformed bars with 8 mm diameters. A straight tendon profile was positioned 30 mm above the bottom flange. The material properties of all the beam elements are listed in Table 1.
As shown in Table 2 and Figure 5, the verification is based on the ultimate moment provided by the model as well as the deformation of the CB.
The comparison between the FEM and experimental results obtained by Chen et al. [8] showed that the FEM was able to predict the experimental results with a 4% difference.
For Emam’s experimental work, the model is a CB with an externally pre-stressed CFRP plate to predict the ultimate flexural response. The dimensions, details, and profiles of the pre-stressed CFRP plate of the beams studied are illustrated in Figure 6a,b. The beam had a total length of 6000 mm and was simply supported over a 5600 mm span. The beam was loaded symmetrically at two points. Two rows of 16 mm diameter by 28.56 mm length shear studs were welded to the top flange, with a transverse spacing of 30 mm and a longitudinal spacing of 90 mm. The concrete slab was reinforced with 4.1 mm diameter bars in two orthogonal directions. The pre-stressed plate consists of one layer attached to the bottom steel flange with a thickness of 1.2 mm with 80 mm width along the full length of the steel I beam. Epoxy, Sikadurr 30 is the adhesive that bonded the plate with the tension flange of steel I beam; its thickness is 1 mm with young’s modulus of 4.5 GPa as shown in Figure 7b. The mechanical properties of the materials used are given in Table 3.
In general, it is observed that the FEM agrees well with the experimental results. In the linear range, the FEM moment–deflection response coincides with that from the experimental results. When the moment–deflection curve transitioned from linear to nonlinear, the yielding of the beam started. After this point, the stiffness of the FEM was slightly higher than the experimental beam, owing to the difference in the behavior of the shear connector between the experimental and theoretical models as shown in Figure 7. The verification of the FEM results was accomplished with a good agreement of 96% with the experimental results of Emam [35] as shown in Table 4.

3. Parametric Study

The model developed to simulate the experimental work performed by Chen et. al. was used to perform the parametric study by changing both the geometric and material characteristics; Figure 4. Twenty-four models divided into six groups were developed in this study to investigate the effect of different parameters, i.e., groups A to F. The details of the parametric study are found in Table 5. The table shows the limitation of this study.
The objective of the first group A is to study the effect of tendon material. Five models were created with the names ST, CT, AT, GT, and WT where various tendon materials were used. Steel, CFRP, AFRP, and GFRP materials were used for the ST, CT, AT, and GT models, respectively. However, no post-tensioning was used in the WT model. The material properties of the used tendons are found in Figure 3. Group B contains models CT1, CT2, CT3, and CT4. Each model has different post-tension levels ranging from 20 to 50% of the ultimate strength of the tendon (PU) as shown in Table 5.
In group C, CH1, CH2, CH3, and CH4 models were created with different tendon positions from the bottom face of the steel I-beam flange, as shown in Table 5. The tendon position was taken as a percent of the steel beam depth. Group D consists of four models with names TL1, TL2, TL3, and TL4. Each model has a different tendon length, as shown in Table 5. In order to study the effect of the DOSC, group E was created. In this group E, four models were built with names D1, D2, D3, and D4. Each model has a different DOSC by changing the number of shear connectors as shown in Table 5.
Group F has three models, i.e., TP1, TP2, and TP3, to study the effect of tendon profile. Models TP1, TP2, and TP3 have straight, trapezoidal, and parabolic tendon profiles as shown in Table 5 and Figure 8a–c.

4. Results

The results of the numerical modeling, including mid-span moment–deflection curves and load-slippage relationships will be reviewed in this part.

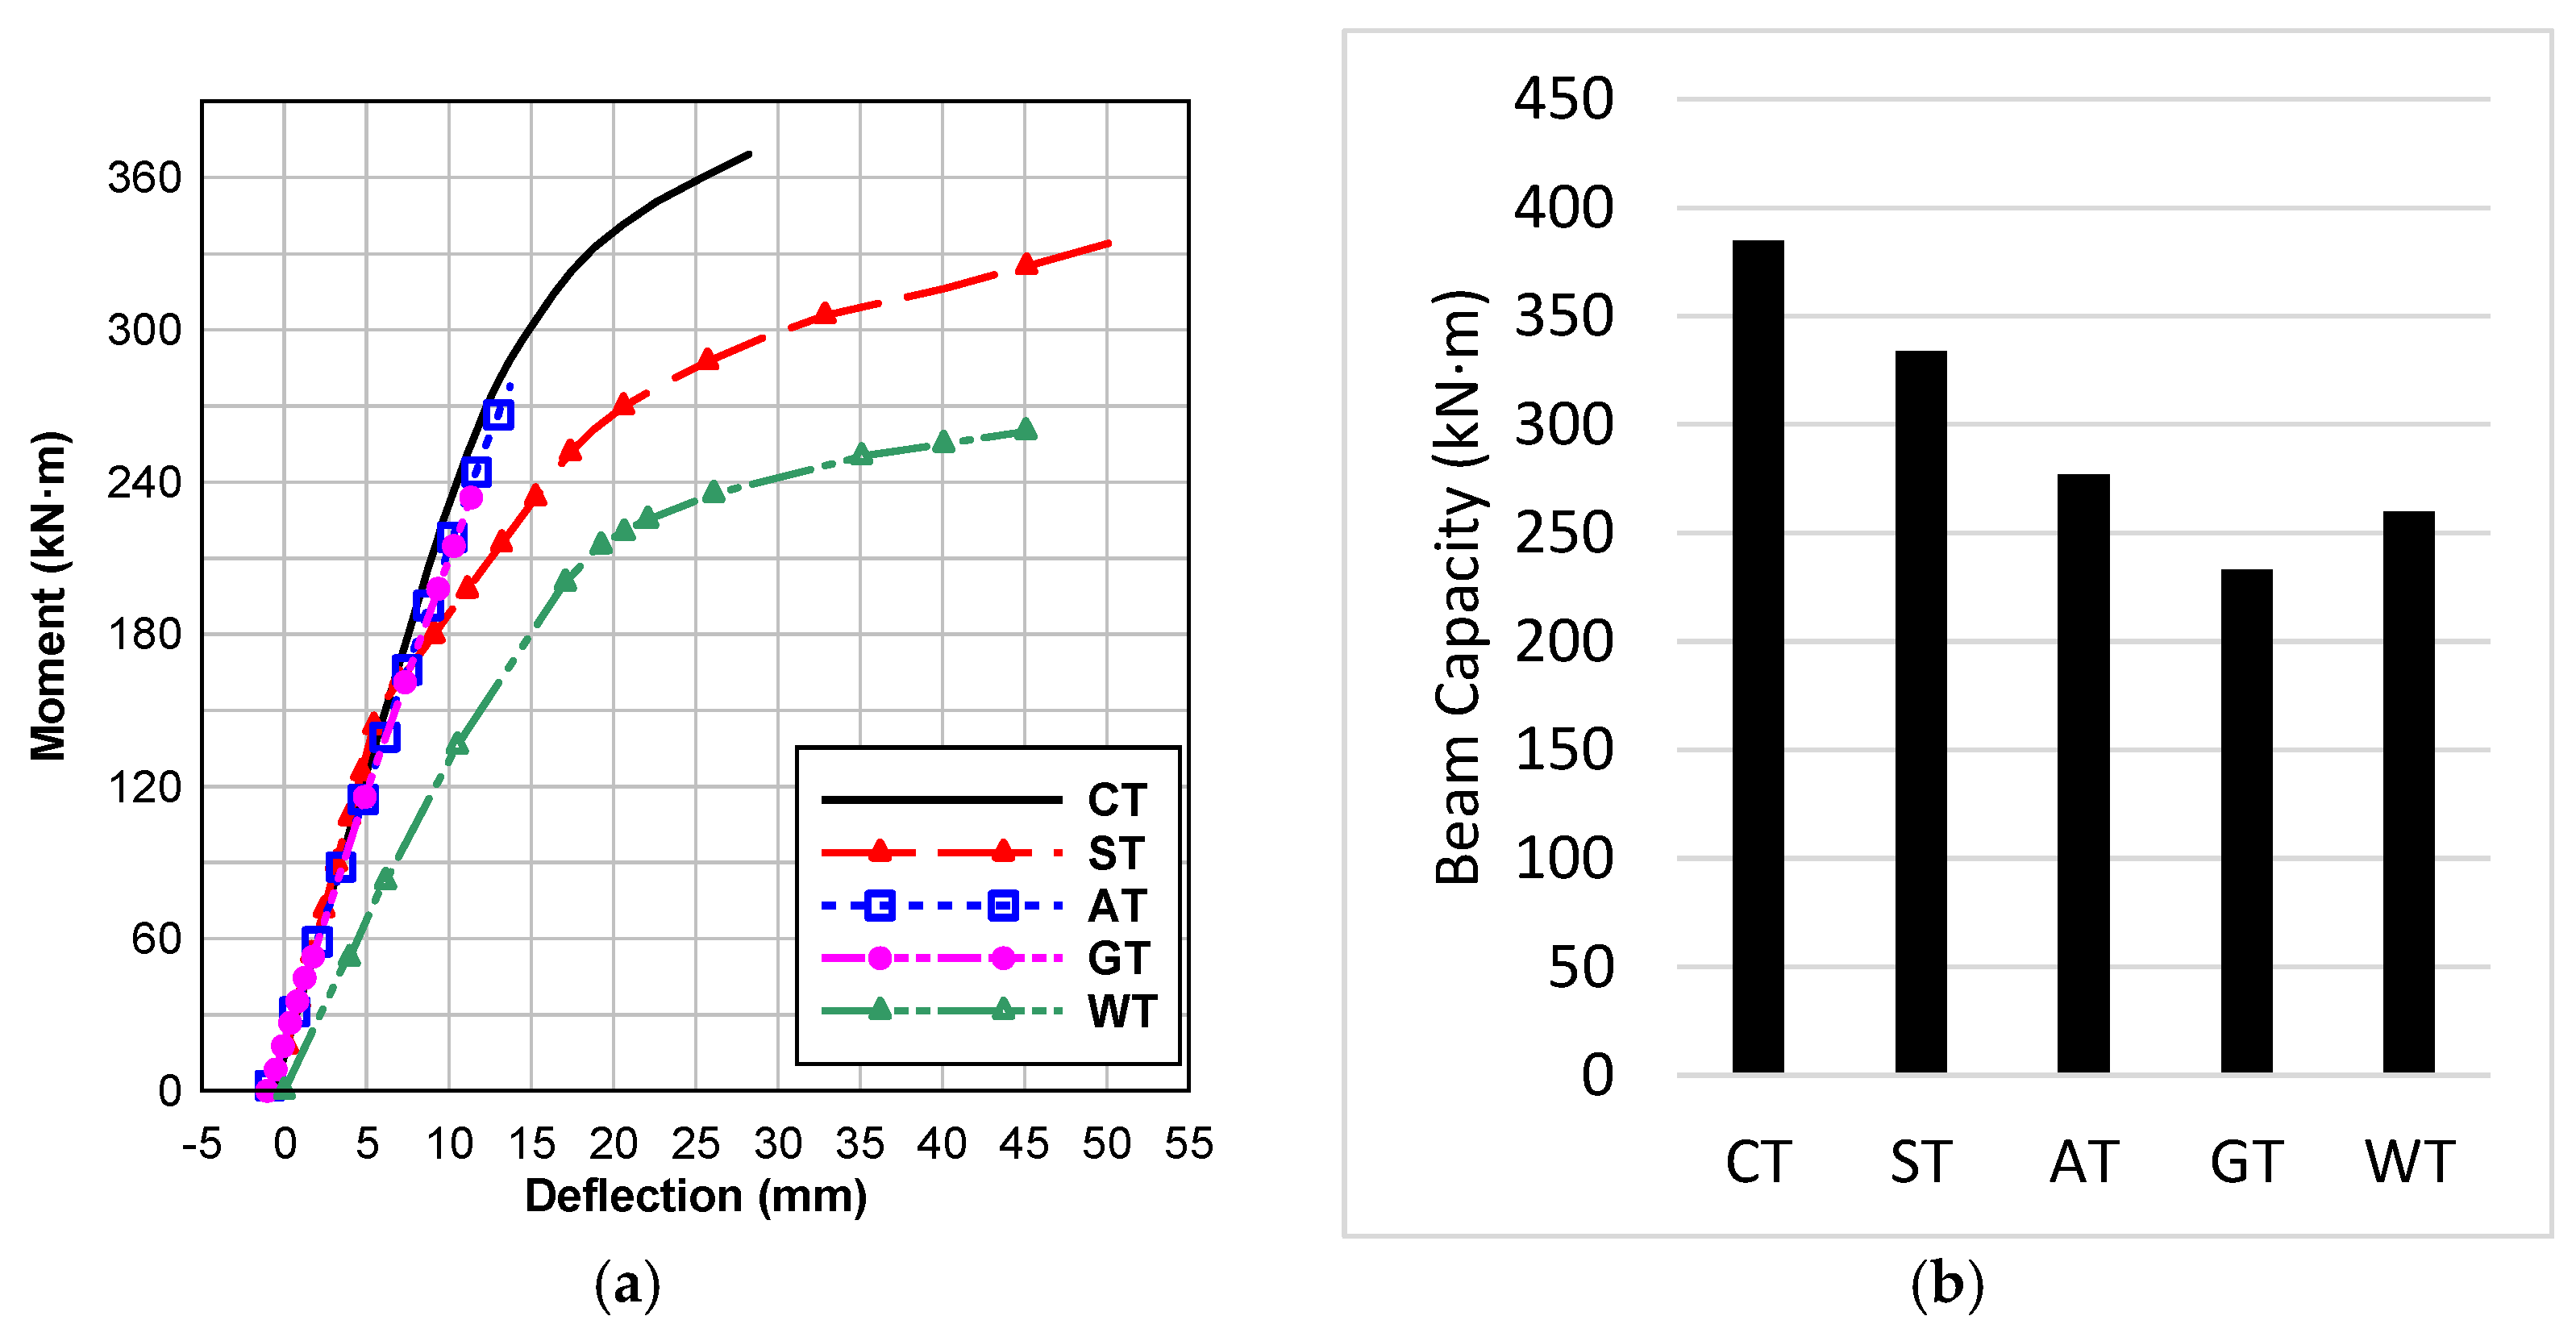
4.1. Effect of Tendon Material

Figure 9a shows the mid-span moment–deflection curves of beams ST, CT, AT, and GT in comparison with model WT. It is observed that model CT has the highest capacity (380 kN·m) compared with other models. Therefore, the CFRP tendon increases the CB capacity by 50% as shown in Figure 9b. However, the GT model has the lowest capacity (234 kN·m) with the smallest deflection compared to others, and there was a sudden rupture in the tendon. Thus, the glass fiber tendon decreases the ductility and the load-carrying capacity of the beam. In addition, it was found that the ST beam capacity is higher than the AT by 19%. Table 6 shows the mid-span moment, deflections, and the force in the tendon for each model. The mode of failure for models CT and AT was a rupture in the FRP tendons; however, the mode of failure was concrete crushing in models ST and WT.

4.2. Effect of Post-Tensioning Level

In this group, post-tension ranging from 20% to more than 50% of tendon ultimate strength is studied. Model CT1 has the maximum moment capacity (385 kN·m) with a deflection of 28 mm, as shown in Figure 10a. For model CT2, the maximum moment is 380 kN·m which is higher than the maximum moment of model CT3 by 5%. However, model CT4 has the lowest moment capacity (352.2 kN·m) with a deflection of 13.28 mm.
Therefore, model CT1 increases the beam moment capacity by 10% higher than model CT4. In general, by increasing the level of post-tensioning, early collapse occurs in the concrete. Yet by decreasing the level of post-tensioning, the moment capacity and the ductility of the beam increase.
Figure 10b shows the moment–slippage curves at the center of the CB with various degrees of post-tension level. It is noticed that by increasing the post-tension level, the slippage between the concrete and steel top flange decreases. In addition, the slippage between the concrete and steel top flange causes moments on the shear connector which is maximum at the base of the shank.
Figure 10c shows the moment on the shank for the four models with several post-tension levels. It can be observed that model CT4 has the highest moment on the shank, however, model CT1 has the lowest moment on the shank compared with other models. Therefore, it can be concluded that by increasing the post-tension levels, the moments on the shank decrease. it is recommended to use a 20% to 30% post-tension level.

4.3. Effect of Tendon Position Elevated

The moment–deflection responses for the strengthened beam with different tendon positions are shown in Figure 11a. Model CH1 has the maximum beam capacity (380 kN·m) compared with other models with maximum deflections of 30 mm. For model CH2 and model CH3, the ultimate moment was 324.2 kN·m and 306.02 kN·m, respectively. However, model CH4 has the lowest moment capacity which is 279.1 kN·m, as shown in Figure 11b. Therefore, CH1 beam moment capacity is 36% higher than model CH4; in general, by decreasing the tendon position, the beam moment capacity increases.

4.4. Effect of Tendon Length

Figure 12a shows the moment–deflection curves at the center of the strengthened beam with various tendon lengths. For model TL1, the maximum moment is 335 kN·m with a maximum deflection of 20 mm which is the lowest moment capacity compared with other models. The maximum moment for models TL2 and TL3 is 350 kN·m and 375 kN·m respectively. However, model TL4 has the maximum beam moment capacity (385 kN·m) with a deflection of 24 mm, Figure 12b.
It was observed that increasing the length of the tendons helps to increase the ultimate strength of the composite section and improve the overall behavior of the reinforced beam. However, because of the difficulty of construction, it is recommended that 90% of the beam span be used.

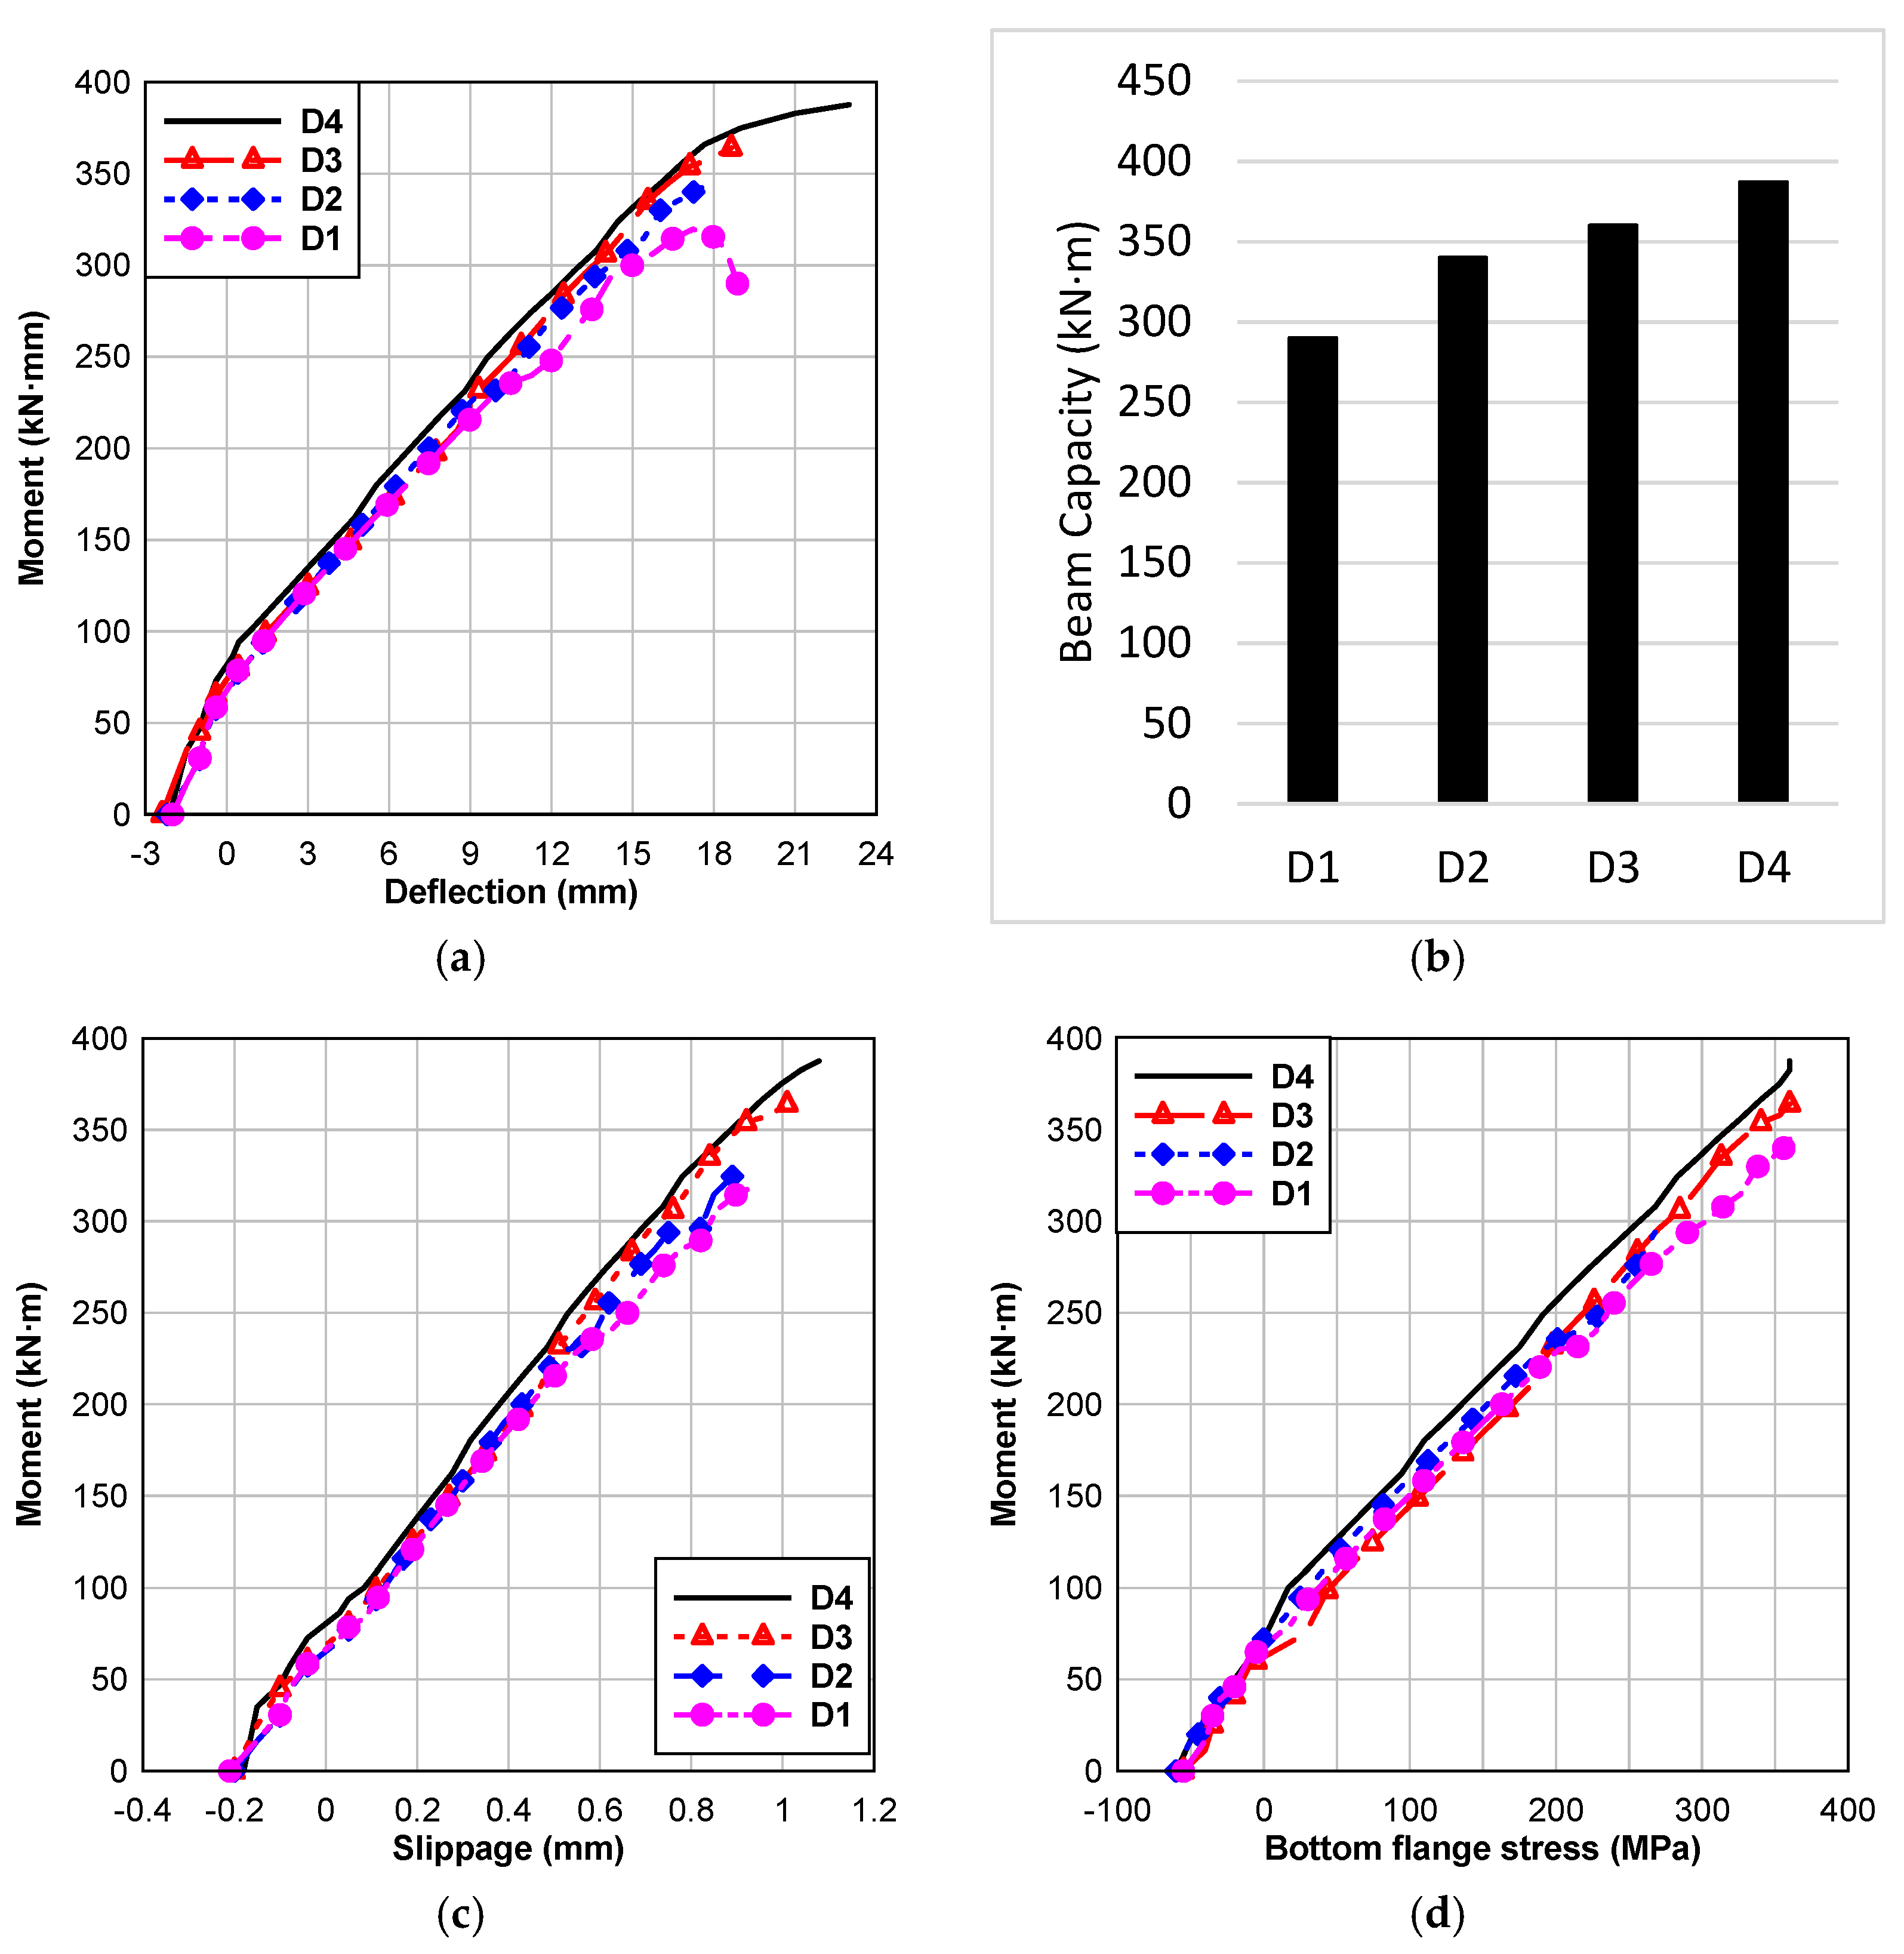
4.5. Degree of Shear Connection (DOSC)

Figure 13a shows the midspan moment–deflection responses of a CB with varying DOSC. Model D1 has the lowest moment capacity (290 kN·m) with a deflection of 18 mm and the failure happened in the studs. The highest moment of Models D2 and D3 is 345 and 364 kN·m, respectively. However, model D4 has the maximum beam capacity (385 kN·m) among all models and the failure was crushing in the concrete. It was observed that using 100% DOSC in D4 increases the ultimate capacity of the CB by 23% compared to D1. In general, as the degree of shear connection increases, the CB capacity increases, Figure 13b.
Figure 13c illustrates the midspan moment–slippage responses of a CB with varying degrees of shear connection. In comparison to the others, model D4 has the highest strength with minimum slippage. As a result, increasing the degree of shear connection reduces slippage between the concrete and steel top flanges. The moment vs. bottom flange stress curves at the center for the steel–concrete CB with several degrees of shear connection is shown in Figure 13d. The beam capacities are controlled by the shear connection capacity. The low shear connection capacity of model D1 results in premature failure compared to the other beams with a higher degree of shear connection. In order to fully profit from employing externally post-tensioned tendons, it is recommended to achieve a degree of composite action of 80% or higher between the concrete flange and the steel beam.

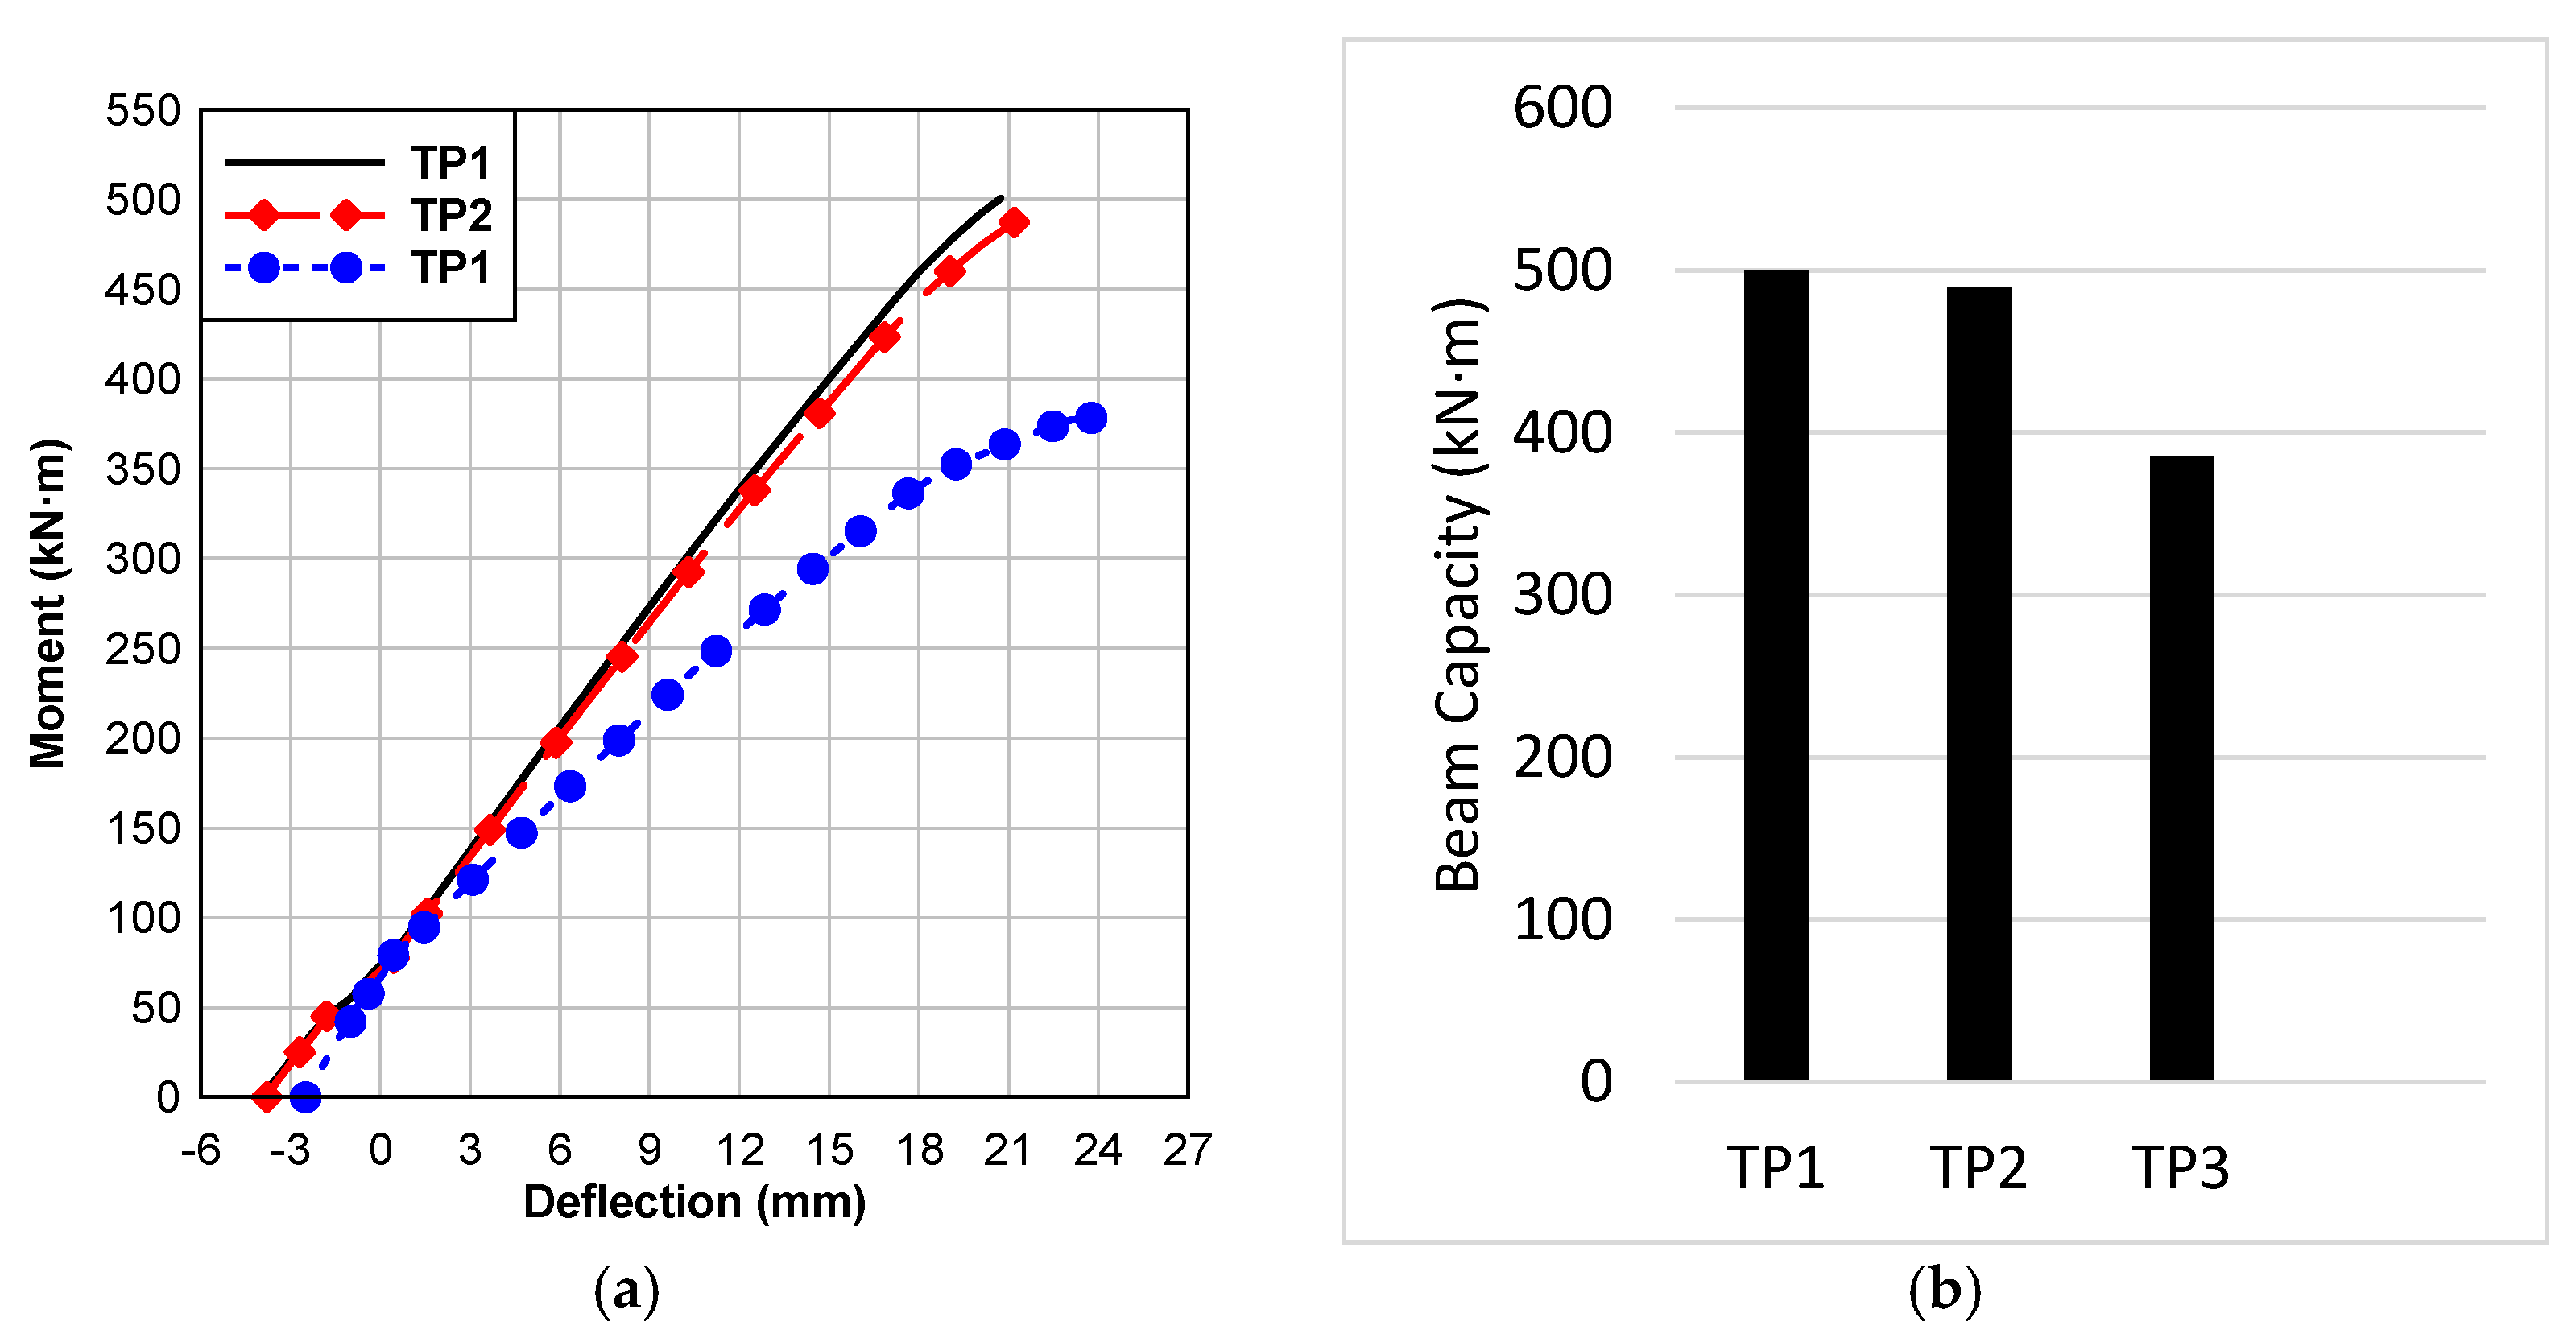
4.6. Effect of Tendon Profile

The moment–deflection curves at the center of the steel–concrete CB with different tendon profiles are shown in Figure 14a. The maximum moment of the model TP1 is 380 kN·m and the maximum deflection is 24 mm. The highest moment for models TP2 and TP3 is 490 and 500 kN·m, respectively, with deflections of 21 mm and 20 mm.
It can be seen that the strengthened beams move upward initially in the same way and behave quite similarly during the elastic zone. In comparison to the other profiles, the beam with the straight profile has superior ductility after yielding.
TP3 has the highest moment capacity with minimal deflection compared to the other models. In general, post-tensioned tendons with a trapezoidal and parabolic shape can reduce the deflection and greatly increase the yield load and the ultimate load of CBs by 125 and 130%, respectively: Figure 14b.

5. Conclusions

In this paper, a numerical model was developed to study the use of FRP post-tensioned tendons in composite construction. The model was validated by using two different experimental works. The model was used to study the effect of different parameters on the performance of steel–concrete CBs strengthened by post-tensioned tendons. A parametric study that investigated the effects of tendon materials, post-tension level, tendon length, degree of shear connection, and tendon profile was performed. The results of this study might be useful for both residential buildings and infrastructure such as bridges.
From this paper, the following findings may be drawn:
  • A good agreement of the proposed non-linear FEM with the literature experimental data was achieved.
  • The CFRP tendons improve the capacity of the CB by 50%, which is the higher improvement ratio.
  • By increasing the level of post-tensioning, early collapse occurs in the tendon. Yet when the level of FRP post-tensioning is decreased, the composite system capacity increases; therefore it is recommended to use a 20 to 30% post-tension level.
  • The ultimate load capacity and the ductility of the strengthened steel–concrete CB with CFRP tendon decreases by increasing the tendons elevated from the bottom surface of the steel beam flange.
  • Applying external PT through the full length of the beam increases the ultimate load capacity. Due to the construction difficulty, it is recommended to use 90% of the beam span length.
  • As the degree of shear connection decreases, the beam’s stiffness and ultimate load capacity decrease. However, as the degree of shear connection decreases, stud stresses and interface slippage increase.
  • It is recommended that post-tension strengthening is utilized for bridges and structures with at least an 80% degree of shear to ensure the best performance.
  • Adding post-tensioned tendons with trapezoidal and parabola profiles to CBs enhances yield and ultimate loads by 125 and 130%, respectively, with less deflection.

Author Contributions

Conceptualization, A.H.E., A.A.E.-S. and H.F.S.; Data curation, A.H.E. and A.A.E.-S.; Funding acquisition, H.A.S.; Project administration, H.F.S. and H.A.H.; Supervision, H.A.S., H.F.S. and H.A.H.; Writing—original draft, A.H.E. and A.A.E.-S.; Writing–review & editing, A.A.E.-S., H.A.S. and A.H.E. All authors have read and agreed to the published version of the manuscript.

Funding

This research received no external funding.

Institutional Review Board Statement

Not applicable.

Informed Consent Statement

Not applicable.

Data Availability Statement

The data that supported the findings of this study are available from the corresponding author upon reasonable request.

Conflicts of Interest

The authors declare no conflict of interest.

References

  1. Ferreira, F.P.V.; Tsavdaridis, K.D.; Martins, C.H.; De Nardin, S. Steel-concrete-composite beams with precast hollow-core slabs: A sustainable solution. Sustainability 2021, 13, 4230. [Google Scholar] [CrossRef]
  2. Zhang, L.W.; Sojobi, A.O.; Liew, K.M. Sustainable CFRP-reinforced recycled concrete for cleaner eco-friendly construction. J. Clean. Prod. 2019, 233, 56–75. [Google Scholar] [CrossRef]
  3. Hermansson, F.; Heimersson, S.; Janssen, M.; Svanström, M. Can carbon fiber composites have a lower environmental impact than fiberglass? Resour. Conserv. Recycl. 2022, 181, 106234. [Google Scholar] [CrossRef]
  4. Tang, Z.; Li, W.; Tam, V.W.Y.; Yan, L. Mechanical performance of CFRP-confined sustainable geopolymeric recycled concrete under axial compression. Eng. Struct. 2020, 224, 111246. [Google Scholar] [CrossRef]
  5. Nie, J.; Cai, C.S.; Wang, T. Stiffness and capacity of steel–concrete composite beams with profiled sheeting. Eng. Struct. 2005, 27, 1074–1085. [Google Scholar] [CrossRef]
  6. El-belbisi, A.; El-shihy, A.; Shaaban, H. Strengthening of Pre-stressed Steel–Concrete Composite Beams Using Carbon Fiber Tendons – A Parametric Study Abstract. Nano Res. Appl. 2018, 4, 2–7. [Google Scholar] [CrossRef]
  7. Ayyub, B.M.; Sohn, Y.G.; Saadatmanesh, H. Prestressed Composite Girders under Positive Moment. J. Struct. Eng. 1990, 116, 2931–2951. [Google Scholar] [CrossRef]
  8. Chen, S.; Gu, P. Load carrying capacity of composite beams prestressed with external tendons under positive moment. J. Constr. Steel Res. 2005, 61, 515–530. [Google Scholar] [CrossRef]
  9. Nie, J.G.; Cai, C.S.; Zhou, T.R.; Li, Y. Experimental and analytical study of prestressed steel–concrete composite beams considering slip effect. J. Struct. Eng. 2007, 133, 530–540. [Google Scholar] [CrossRef]
  10. Kim, K.S.; Lee, D.H.; Choi, S.M.; Choi, Y.H.; Jung, S.H. Flexural behavior of prestressed composite beams with corrugated web: Part I. Development and analysis. Compos. Part B Eng. 2011, 42, 1603–1616. [Google Scholar] [CrossRef]
  11. Ayman, E.-Z.; Hani, S.; Hesham, S.; Suzan, M.; Ashraf, E.-S. Finite-Element Modeling of Externally Posttensioned Composite Beams. J. Bridg Eng. 2015, 20, 4015018. [Google Scholar] [CrossRef]
  12. Hu, W.; Li, Y.; Yuan, H. Review of Experimental Studies on Application of FRP for Strengthening of Bridge Structures. Adv. Mater. Sci. Eng. 2020, 2020, 8682163. [Google Scholar] [CrossRef]
  13. Busel, J.P.; Lockwood, J. Product selection guide: FRP composite products for bridge applications. Mark Dev. Alliance FRP Compos. Ind. N. Y. 2000, 122–157. [Google Scholar]
  14. Tahir, M.; Wang, Z.; Ali, K.M.; Isleem, H.F. Shear behavior of concrete beams reinforced with CFRP sheet strip stirrups using wet-layup technique. Structures 2019, 22, 43–52. [Google Scholar] [CrossRef]
  15. Kazemi, M.; Li, J.; Lahouti Harehdasht, S.; Yousefieh, N.; Jahandari, S.; Saberian, M. Non-linear behaviour of concrete beams reinforced with GFRP and CFRP bars grouted in sleeves. Structures 2020, 23, 87–102. [Google Scholar] [CrossRef]
  16. Park, R.; Jang, J. Performance improvement of carbon fiber/polyethylene fiber hybrid composites. J. Mater. Sci. 1999, 34, 2903–2910. [Google Scholar] [CrossRef]
  17. Berradia, M.; El Ouni, M.H.; Ali, L.; Raza, A.; Ali, B. Data-oriented analysis of axial capacity of externally CFRP-confined concrete columns transversely reinforced with steel hoops or spirals. Mech. Adv. Mater. Struct. 2021, 1–14. [Google Scholar] [CrossRef]
  18. El-Emam, H.; El-Sisi, A.; Reda, R.; Seleem, M.; Bneni, M. Effect of concrete cover thickness and main reinforcement ratio on flexural behavior of RC beams strengthened by NSM-GFRP bars. Frat. Integrita Strutt. 2020, 14, 197–210. [Google Scholar] [CrossRef]
  19. Alsharari, F.; El-Zohairy, A.; Salim, H.; El-Din El-Sisi, A. Numerical investigation of the monotonic behavior of strengthened Steel-Concrete composite girders. Eng. Struct. 2021, 246, 113081. [Google Scholar] [CrossRef]
  20. Hawileh, R.A.; Nawaz, W.; Abdalla, J.A.; Saqan, E.I. Effect of flexural CFRP sheets on shear resistance of reinforced concrete beams. Compos. Struct. 2015, 122, 468–476. [Google Scholar] [CrossRef]
  21. Tiwary, A.K.; Singh, S.; Kumar, R.; Sharma, K.; Chohan, J.S.; Sharma, S.; Singh, J.; Kumar, J.; Deifalla, A.F. Comparative Study on the Behavior of Reinforced Concrete Beam Retrofitted with CFRP Strengthening Techniques. Polymers 2022, 14, 4024. [Google Scholar] [CrossRef] [PubMed]
  22. Xue, W.; Tan, Y. Cracking behavior and crack width predictions of concrete beams prestressed with bonded FRP tendons. In Proceedings of the 6th International Conference on FRP Composites in Civil Engineering, CICE, Rome, Italy, 13–15 June 2012; pp. 1–8. [Google Scholar]
  23. Grace, N.F.; Abdel-Sayed, G. Behavior of externally draped CFRP tendons in prestressed concrete bridges. PCI J. 1998, 43, 88–101. [Google Scholar] [CrossRef]
  24. ANSYS Inc. ANSYS Release 18.1 Documentation; ANSYS Inc.: Canonsburg, PA, USA, 2017. [Google Scholar]
  25. El-Sisi, A.E.; Saucier, A.; Salim, H.A. Parametric Study of Non-Load-Bearing Sandwich Wall Panels for Blast Mitigation. J. Perform. Constr. Facil. 2022, 36, 4021104. [Google Scholar] [CrossRef]
  26. El-Sisi, A.E.-D.A.; El-Husseiny, O.M.; Matar, E.B.; Sallam, H.E.-D.M.; Salim, H.A. Field-testing and numerical simulation of vantage steel bridge. J. Civ. Struct. Health Monit. 2020, 10, 443–456. [Google Scholar] [CrossRef]
  27. El-Belbisi, A. Strengthening of Pre-stressed Steel--Concrete Composite Beams Using Carbon Fiber Tendons--A Parametric Study. Arch. Med. 2018, 4, 7. [Google Scholar]
  28. Ollgaard, J.G.; Slutter, R.G.; Fisher, J.W. Shear strength of stud connectors in lightweight and normal weight concrete, AISC Eng’g Jr., April 1971 (71-10). AISC Eng. J. 1971, 1971, 55–34. [Google Scholar]
  29. Abdel Aziz, K. Numerical Modeling and Experimental Study of Composite Beams with Partial or Spaced Shear Connection. Ph.D. Thesis, INSA Rennes, Rennes, France, 1986. [Google Scholar]
  30. Johnson, R.P.; Molenstra, N. Partial shear connection in composite beams for buildings. Proc.-Inst. Civ. Eng. Part 2 Res. Theory 1991, 91, 679–704. [Google Scholar] [CrossRef]
  31. Alsharari, F.; El-Zohairy, A.; Salim, H.; El-Din El-Sisi, A. Pre-damage effect on the residual behavior of externally post-tensioned fatigued steel-concrete composite beams. Structures 2021, 32, 578–587. [Google Scholar] [CrossRef]
  32. El-Sisi, A.E.; Saucier, A.; Salim, H.A.; Hoemann, J.M. Experimental and Numerical Evaluation of Reinforced Concrete Walls Retrofit Systems for Blast Mitigation. J. Perform. Constr. Facil. 2019, 33, 04018113. [Google Scholar] [CrossRef]
  33. El-Emam, H.; El-Sisi, A.; Bneni, M.; Ahmad, S.S.E.; Sallam, H.E.D.M. Effects of tensile reinforcing steel ratio and near-surface-mounted bar development length on the structural behavior of strengthened rc beams. Lat. Am. J. Solids Struct. 2020, 17, 1–11. [Google Scholar] [CrossRef]
  34. El-Sisi, A.A.; Hassanin, A.I.; Shabaan, H.F.; Elsheikh, A.I. Effect of External Post-Tensioning on Steel–concrete Composite Beams with Partial Connection. Eng. Struct. 2021, 247. [Google Scholar] [CrossRef]
  35. Emam, M.Y. Strengthening Steel-Concrete Composite Girders Using Prestressed Fibre Reinforced Polymer. Master’s Thesis, Department of Civil Engineering, University of Calgary, Calgary, AB, Canada, 2007. [Google Scholar]
Figure 1. The FEM mesh for the composite cross-section.
Sustainability 14 15792 g001
Figure 2. Material Models: (a) Concrete compression stress–strain curve and (b) Steel material model.
Sustainability 14 15792 g002
Figure 3. Stress–strain behavior of the tendon materials (tendons).
Sustainability 14 15792 g003
Figure 4. The geometrical characteristics of the simply supported CB tested by Chen (all dimensions in mm): (a) Cross Section and (b) Elevation of the beam.
Sustainability 14 15792 g004
Figure 5. Comparison between mid-span Moment–Deflection curve for the Chen et al. [8] and the current FEM.
Sustainability 14 15792 g005
Figure 6. The geometrical characteristics of the CB were tested by Emam (all dimensions in mm) [35]: (a) Cross Section and (b) Elevation of the beam.
Sustainability 14 15792 g006aSustainability 14 15792 g006b
Figure 7. Comparison between the mid-span moment–deflection curve for the Emam [35] and the FEM.
Sustainability 14 15792 g007
Figure 8. The geometry of group (F) models: (a) Straight tendon, (b) Trapezoidal tendon, and (c) Parabola tendon.
Sustainability 14 15792 g008
Figure 9. Effect of tendon material: (a) Mid-span Moment–Deflection curves and (b) Beam capacity.
Sustainability 14 15792 g009
Figure 10. Results of models group (B); (a) Mid-span Moment–Deflection curves, (b) The moment–slippage curves at the center of the CB, and (c) Mid-span Moment–Moment on the shank. curves Shank moment on the shank.
Sustainability 14 15792 g010
Figure 11. Effect of tendon position elevated; (a) Mid-span Moment–Deflection curves and (b) Beam capacity.
Sustainability 14 15792 g011
Figure 12. (a) Mid-span Moment–Deflection curves and (b) Beam capacity.
Sustainability 14 15792 g012
Figure 13. Effect of DOSC: (a) Mid-span Moment–Deflection curves, (b) Beam capacities, (c) Moment slippage relation, and (d) Moment vs. Bottom flange stress relation.
Sustainability 14 15792 g013
Figure 14. Effect of tendon profile: (a) Mid-span Moment–Deflection curves of models group and (b) Beam capacity.
Sustainability 14 15792 g014
Table 1. Summary of material properties for Chen et al. experiment [8].
Post-Tension TendonsConcreteSteel I-Beam
Fy (MPa)Fu (MPa)Ap (mm2)PU (kN)Fc (Mpa)Fy (MPa)Fu (MPa)
WebFlangeWebFlange
16801860137.4112.635327.7406.5492.6593.6
Fy and Fu are the yield and ultimate strengths of the material, and PU is the tendon’s ultimate resistance. Fc is the concrete compression strength.
Table 2. Moments and deflections of experimental and FE analysis.
ModelMu (kN·m)Δu (mm)
Experimental Results35055
FEM Results33553
Accuracy96%96%
Table 3. Summary of material properties for Chen et al. experiment [8].
CFRP PlateConcreteSteel I-Beam
Fu (MPa)E (GPa)Fc (Mpa)Fy (MPa)Fu (MPa)
WebFlangeWebFlange
2565153.848352454
Table 4. Moments and deflections of Emam [35] experimental work and FE analysis.
ModelLoad (kN)Δu (mm)
Emam Results130145
FEM Results135146
Accuracy96%99%
Table 5. Parametric study details and limitations.
GroupsModelMaterialPT LevelHeight (He)LengthDOSCProfile
Group AWT~~~~100%~
STSteel20% PU10% H100% LStraight
CTCFRP
ATAFRP
GTGFRP
Group BCT1CFRP20% PU10% H100% L100%Straight
CT230% PU
CT340% PU
CT450% PU
Group CCH1CFRP20% PU10% H100% L100%Straight
CH215% H
CH320% H
CH425% H
Group DTL1CFRP20% PU10% H40% L100%Straight
TL260% L
TL370% L
TL480% L
Group ED1CFRP20% PU10% H100% L40%Straight
D260%
D380%
D4100%
Group FTP1CFRP20% PU10% H100% L100%Straight
TP2Trapezoidal
TP3Parabola
Table 6. Result of group A.
No.ModelUpward
Deflection (mm)
Max.
Moment (kN·m)
Deflection (mm)Tendons
Ultimate Force (kN)
1WT~25545~
2ST0.933350223
3CT138025331
4AT1.227914284
5GT1.523411230
Publisher’s Note: MDPI stays neutral with regard to jurisdictional claims in published maps and institutional affiliations.

