3.1. Methane Production Performance
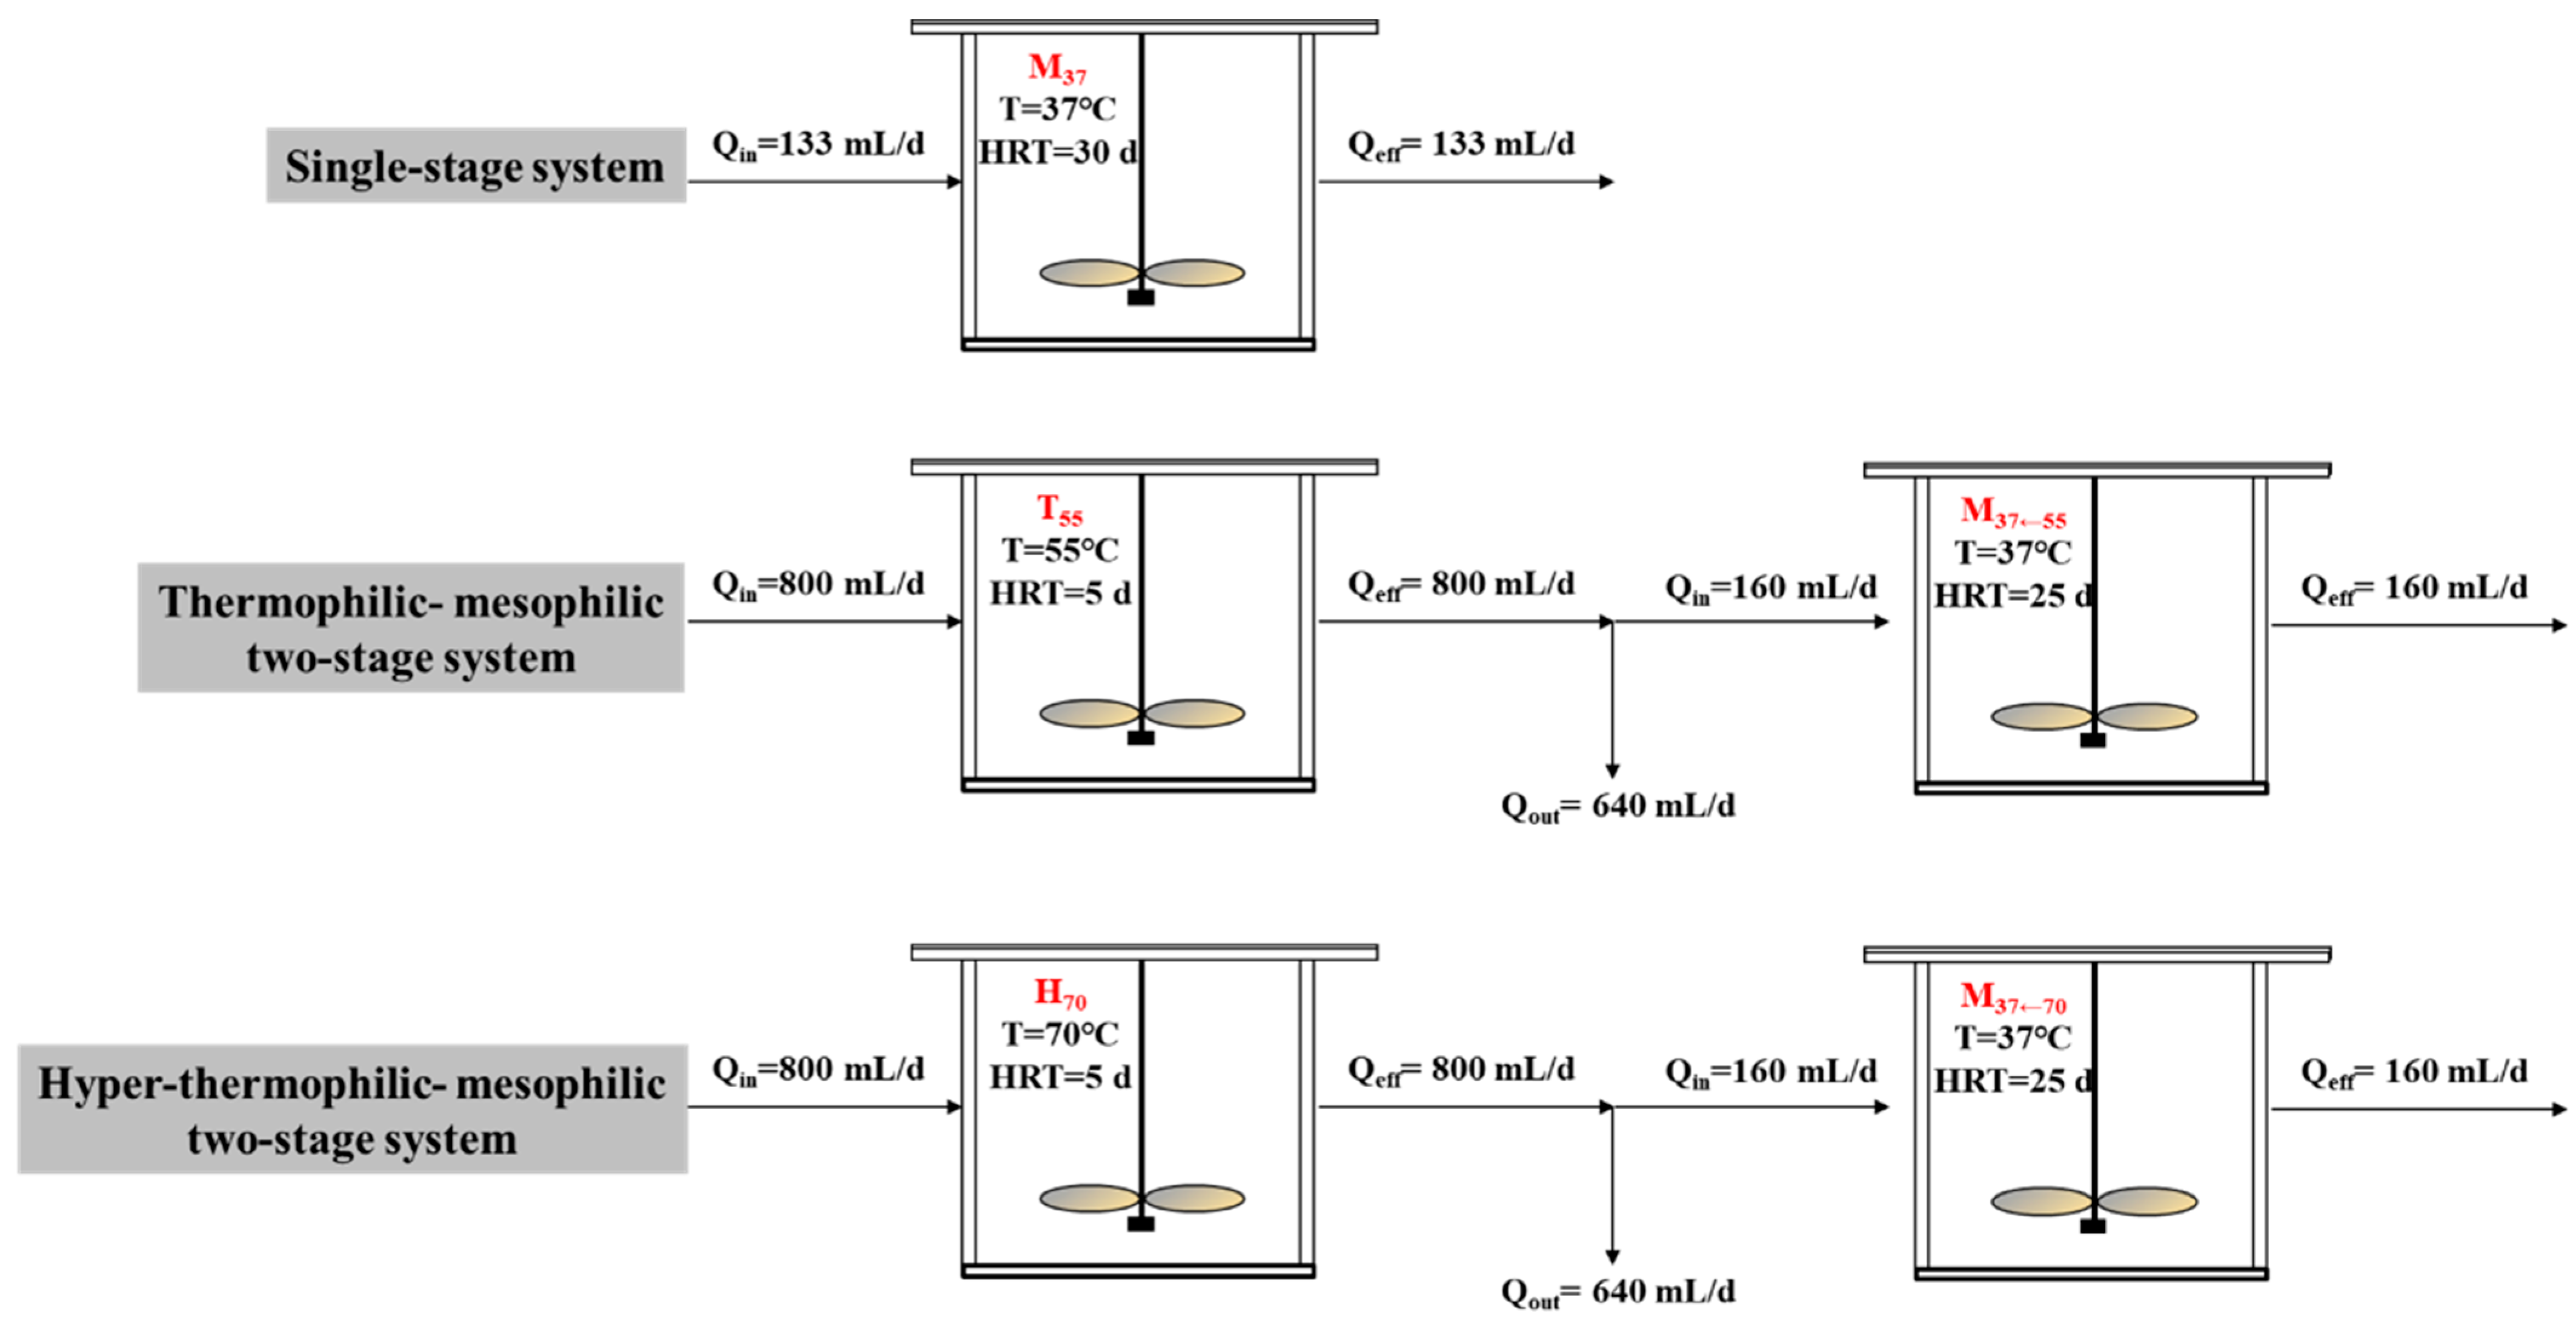
The performance in terms of gas production and methane content in the biogas within the five reactors is illustrated in
Figure 2. After 60 d, all reactors were considered to have entered a steady period. The following data results calculated are all based on the data from the stable period.
Table 2 summarizes the gas performance results in the three systems. The volumetric biogas production rates of the three systems were all over 1.2 L/L/d, and highest one appeared in the H
70 + M
37←70 system with 1.44 L/L/d. In the case of each reactor, the M
37←70 obtained the highest volumetric biogas production rate of 1.71 L/L/d, while the volumetric biogas production rate of the H
70 was lowest (0.07 L/L/d). The biogas yields in the T
55 + M
37←55 and H
70 + M
37←70 systems were, respectively, 9.4% and 14.3% higher than those in the M
37. However, the three systems had similar methane yields. One-way ANOVA showed a significant difference was not present between the T
55 + M
37←55 and H
70 + M
37←70 processes in terms of methane yield, yet when compared to the single-stage process, the two-stage process showed a higher methane yield. The result confirms previous research demonstrating that a thermophilic-mesophilic two-stage anaerobic system is conducive to increasing methane production [
15]. The M
37 system had the highest methane content of 65.7%, approximate to the average methane content of 65% in a biogas plant of pig manure [
16]. The methane contents of the T
55 + M
37←55 and H
70 + M
37←70 systems were 63.7% and 59.4%, respectively. On the basis of those results, it can be concluded that a high-temperature treatment increased biogas production in the two-stage process, with better effects being observed in the thermophilic condition. However, when contrasted with single-stage process, the methane content did not increase. By comparing the methane content of the three mesophilic reactors, it was found that a high-temperature treatment decreased the methane content, indicating that the higher the temperature, the lower the methane content. This may have been due to the difference in the concentration of various organic compounds in the hydrolysates. In addition, the shifts in microbial community may be another reason. The effluent of the first stage was as the feeding of the mesophilic reactor, with a large number of hydrolytic bacteria and acidifying bacteria entered the mesophilic reactor, which may change the microbial community.
Table 3 shows the comparison between previous researches on the anaerobic digestion of pig manure. In the single CSTR, the methane yield was in the 188–320 mL/g-VS range. In this study, the methane yield was 293 mL/g-VS, consistent with the literature report. The different properties of feed pig manure and process operation parameters may be the reason for the difference in exact methane yield. As for the two-stage CSTRs, this study showed a near methane yield in the T
55 + M
37←55 (317 mL/g-VS) and the H
70 + M
37←70 (313 mL/g-VS), 6–8% higher than the single M
37. The research of Hu et al. also proved that the hyper-thermophilic-mesophilic two-stage process has better methane yield than the single-stage process.
3.2. Decomposition Performance and Mass Balance
During the AD of the pig manure, the changes in TS, VS, and TCOD reflected the degradation and transformation of organic matter. The organic matter removal efficiency is shown in
Figure 3a–c. In the M
37, the average removal efficiencies of TCOD, VS, and TS were 56.9%, 52.3%, and 39.2%, respectively. The removal efficiencies of the M
37←70 were not much different from that of the M
37. However, the M
37←55 had the highest removal efficiencies in comparison with the M
37, with 9.9% higher TS removal efficiency, 1.9% higher VS removal efficiency, and 2.6% higher TCOD removal efficiency. Among the reactors, the H
70 reactor had the lowest removal efficiencies of TCOD, VS, and TS. These were observed to be lower than 6.5%, indicating that only a small part of the organic matter was degraded in the H
70, and the absence of methanogenesis in this reactor resulted in this low rate of degradation. The rate of contribution of T
55 in the T
55 + M
37←55 system in terms of TCOD and VS removals was 13.4% and 28.1%, respectively. Furthermore, the rate of contribution of H
70 to the H
70 + M
37←70 system during TCOD and VS removals was 7.4% and 8.3%, respectively.
TS and VS balance are shown in
Figure 3d,e.
In the M37 system, 39.7% of TS was converted to biogas, which was consistent with the removal efficiency of TS. In the T55 + M37←55 and H70 + M37←70 systems, 51.6% and 40.8% of TS were converted to biogas, respectively. The VS removal efficiencies in the M37, T55 + M37←55 and H70 + M37←70 systems were 52.3%, 61.5%, and 53.0%, respectively. One-way ANOVA shows there was a significant difference. In addition, the TCOD removal efficiencies in the M37, T55 + M37←55 and H70 + M37←70 systems were 56.9%, 62.8%, and 58.0%, respectively. The T55 + M37←55 system had the best organic matter removal efficiency, and the two-stage AD was able to degrade more organic matter than the single-stage AD.
COD mass balance was calculated based on the experimental results, and
Figure 3f shows the summarized results. In feedstock pig manure, SCOD and particle chemical oxygen demand (PCOD) constituted the TCOD, which was calculated as 100%. In the T
55 and H
70 reactors, as a result of hydrolysis and acidification, the PCOD content decreased and the SCOD concentration increased. Furthermore, the H
70 had a higher SCOD concentration than the T
55 due to the absence of methanogenesis. There was similar SCOD content remaining in the effluent of the M
37 (5.7 ± 0.8 g/L), M
37←55 (5.6 ± 0.7 g/L), and M
37←70 (5.8 ± 0.9 g/L), while a significant difference was present by One-way ANOVA. The lowest amount of PCOD + SCOD (34.5%) remained in the T
55 + M
37←55 system, which corresponded with the highest CH
4 yield. Meanwhile, the single-stage system had the lowest CH
4-COD (54.4%), corresponding with the highest PCOD + SCOD (40.3%).
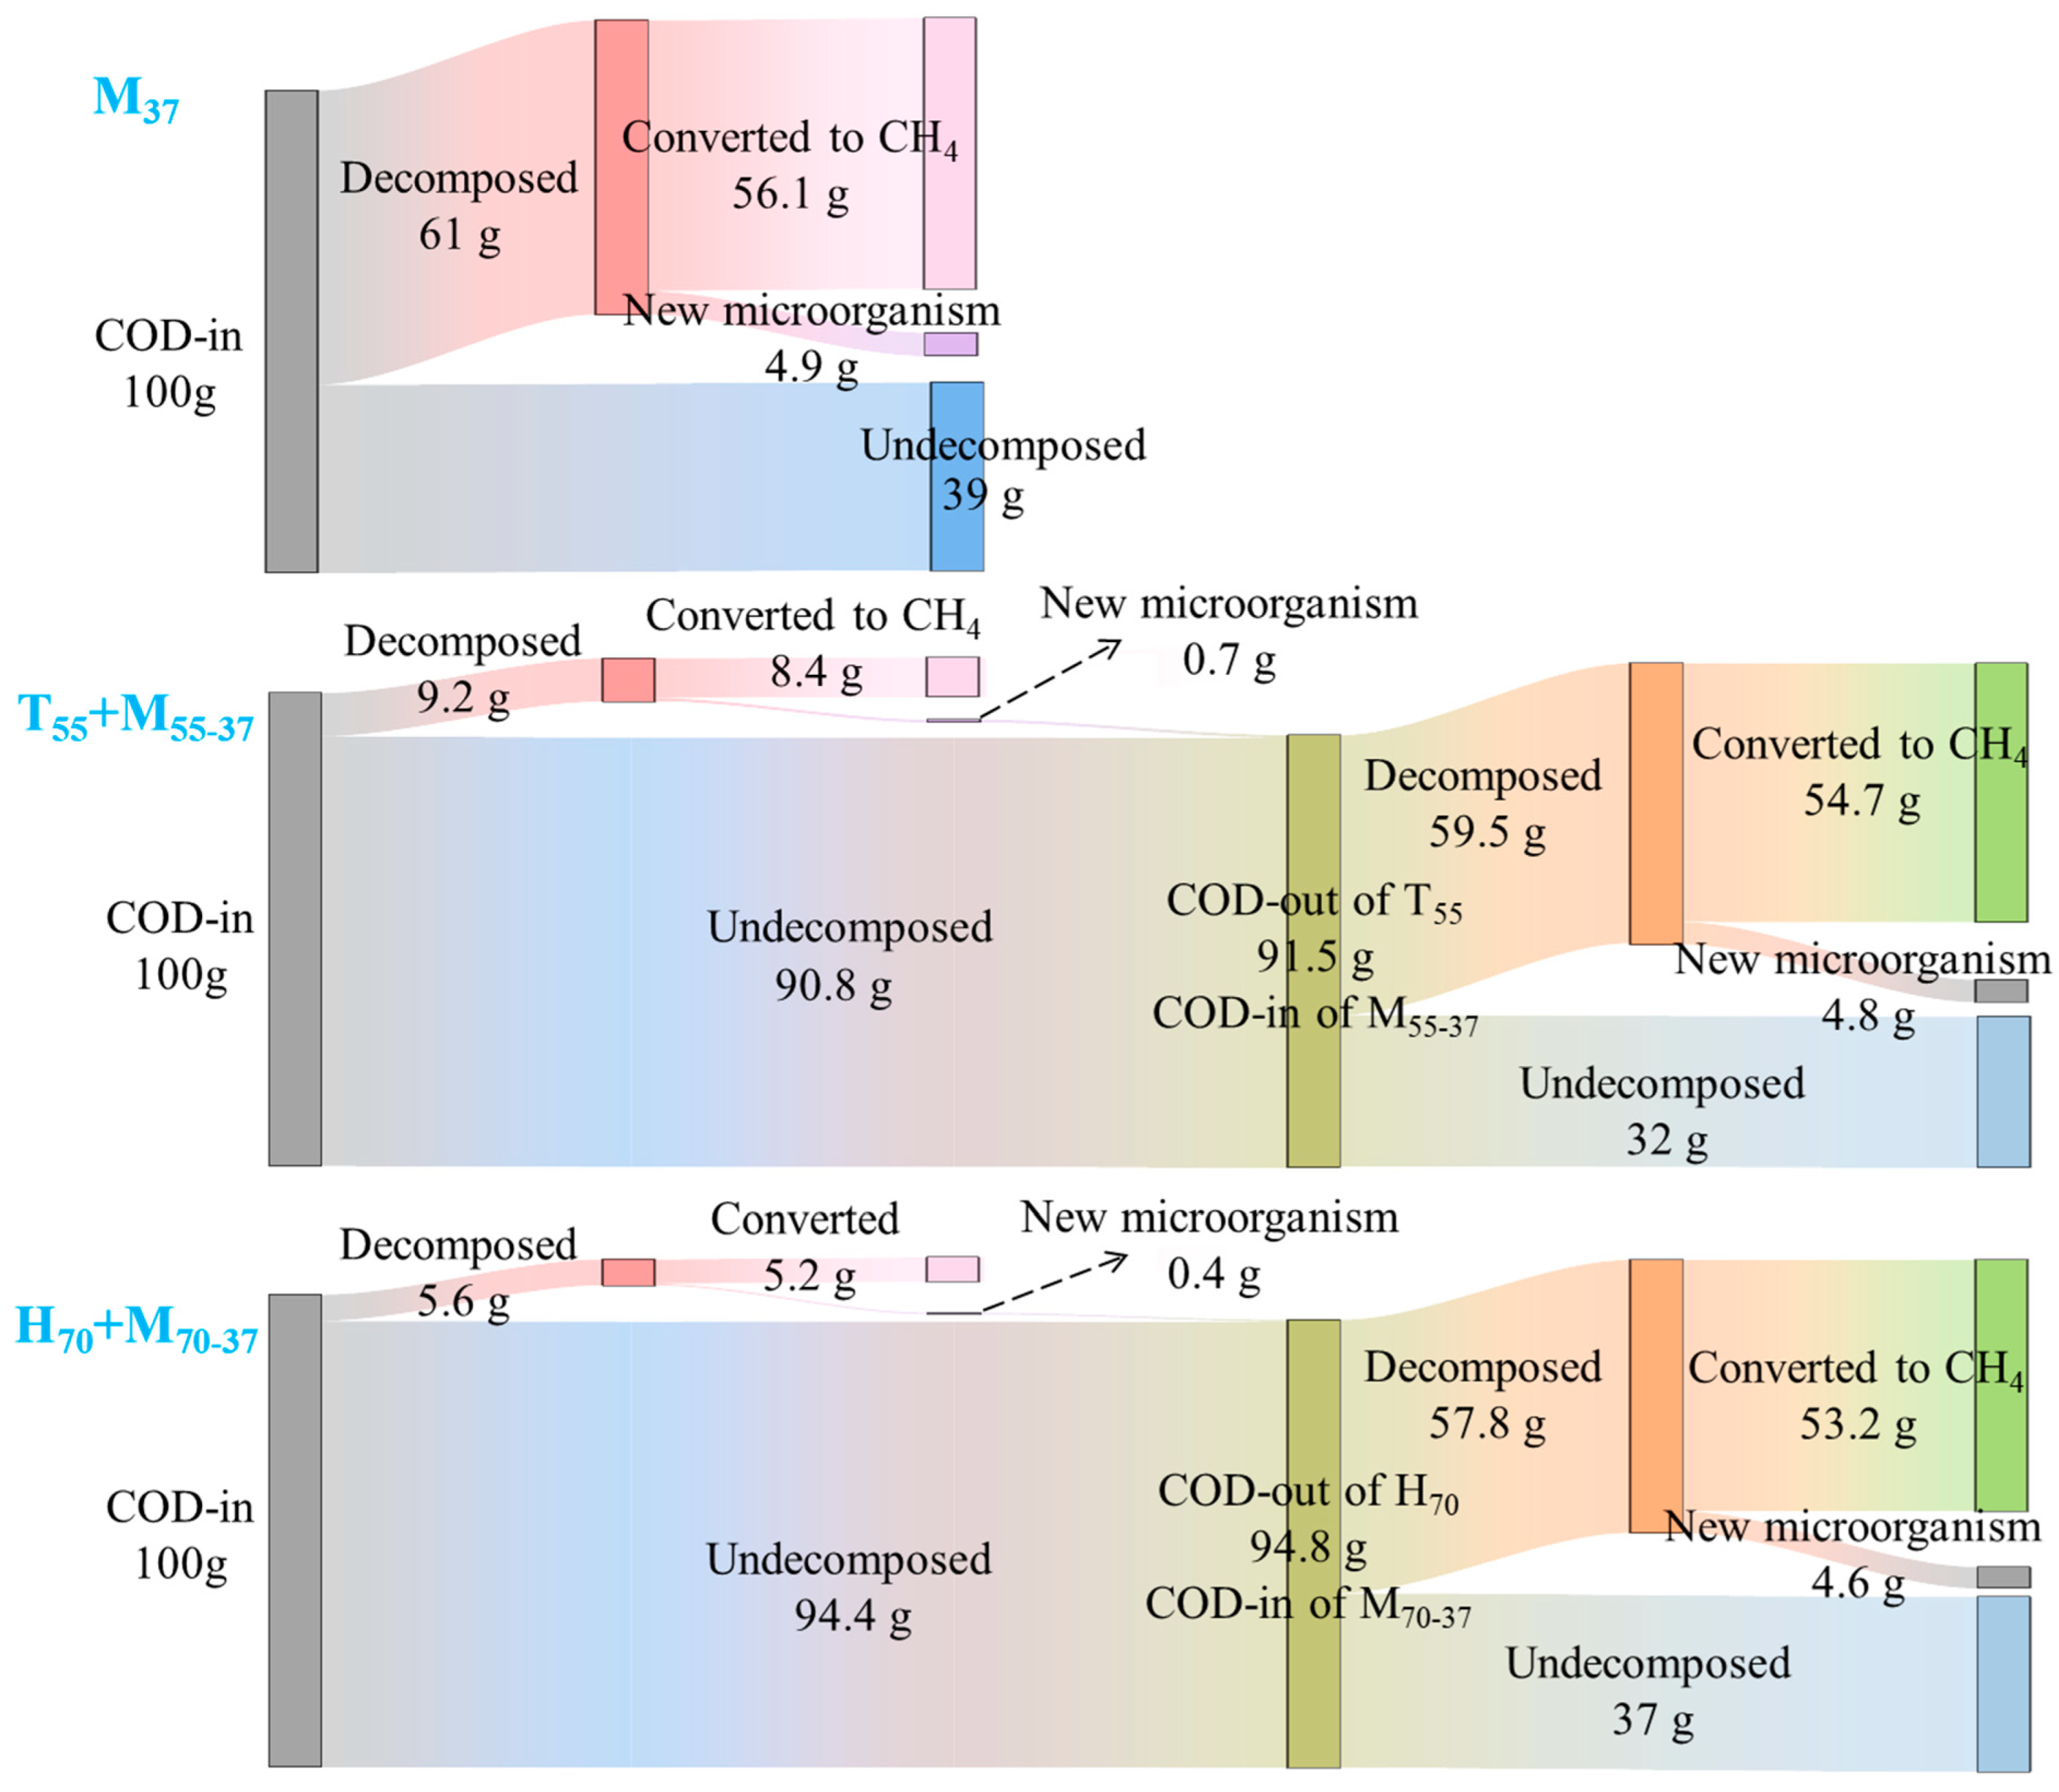
The degradation of organic matter depends on the action of microorganisms. One part of the degraded organic matter is used for the proliferation of microorganisms, and the other part is eventually converted into methane. The biomass distribution and COD conversion efficiency of the three systems are presented in
Figure 4, with an influent COD of 100%. In the single AD, about 61% of the organic matter could have been converted by microorganisms, with 56.1% converted to methane, and 4.9% used for the proliferation of anaerobic microorganisms. In the T
55 + M
37←55 system, only 9.2% of the organic matter was converted by microorganisms in the T
55. The remaining undecomposed organic matter went into the mesophilic reactor, and about 59.5% of this organic matter could have been converted by microorganisms, with 54.7% converted to methane, and 4.8% used for the proliferation of anaerobic microorganisms. In the H
70 + M
37←70 system, more undecomposed organic matter (94.4%) in the H
70 reactor went into the mesophilic reactor, and about 57.8% of the organic matter could have been converted by microorganisms, with 53.2% converted to methane, and 4.6% used for the cell proliferation. The final undecomposed organic matter in the three systems was M
37 (39%) > H
70 + M
37←70 (37%) > T
55 + M
37←55 (32%), which was consistent with the organic matter removal results (
Figure 4).
3.3. Characterization of COD Flow in the Three Systems
Balancing the acidogenesis and methanogenesis metabolism is crucial for an anaerobic process [
22]. With the high-temperature hydrolysis pretreatment, the COD flow may have experienced changes because higher VFAs went to the methanogenic reactor. The conversion efficiencies for the four steps of AD in the reactors/systems are shown in
Table 4. In the T
55 + M
37←55 system, around 56.3% of suspended solid in pig manure was hydrolyzed, which was higher than the 49.7% observed in the M
37 system. When considered alongside the next three steps, the conversion efficiencies of the T
55 + M
37←55 system were 5.7%, 5.1%, and 4.8% higher than the M
37 system during the acidogenesis, acetogenesis, and methanogenesis steps. However, in the T
55 reactor, the conversion efficiencies during the four steps were far less than those in the M
37 and M
37←55 reactors, recording a hydrolysis ratio of 14.5%, and an acidogenesis ratio of 12.1%. The low hydrolysis ratio in the T
55 reactor could be attributed to the acidic pH (6.21 ± 0.05) and high TVFA (23.1 ± 1.8 g-acetate/L), which led to an adverse environment for functional microorganisms, thus inhibiting the hydrolysis of organic matter. In the T
55, 1.4% methanogenesis indicated that the consumption rate of VFA was slow, while the generation rate of VFA from the acidogenesis of pig manure was higher, which led to the VFA accumulation.
The H70 + M37←70 system accomplished conversion efficiencies, approximately 4–6% higher than those in the M37 reactor. In the H70 reactor, the conversion efficiencies were extremely low, with a hydrolysis ratio of 12.8%, and an acidogenesis ratio of 0.9%. Low pH (5.89 ± 0.16) and total VFA (TVFA) (13.9 ± 2.0 g-acetate/L) could have been the cause. In the H70 reactor, acidogenesis appeared to be the rate-limiting step. When comparing the conversion efficiency with the four steps in the T55 + M37←55 and H70 + M37←70 systems, the former was about 1% higher than the latter, suggesting that the thermophilic-mesophilic AD contributed more to enhancing hydrolysis than the hyper-thermophilic-mesophilic AD. Acidogenesis and acetogenesis conversion efficiencies also reflected the conversion of acid. There were a few residual VFAs (0.5–0.6 g-COD/L) in the second stage and the removal efficiency reached 96.6–97.6%. The change of acetic acid was similar in the second stage, at 96.2–97.6% removal efficiency.
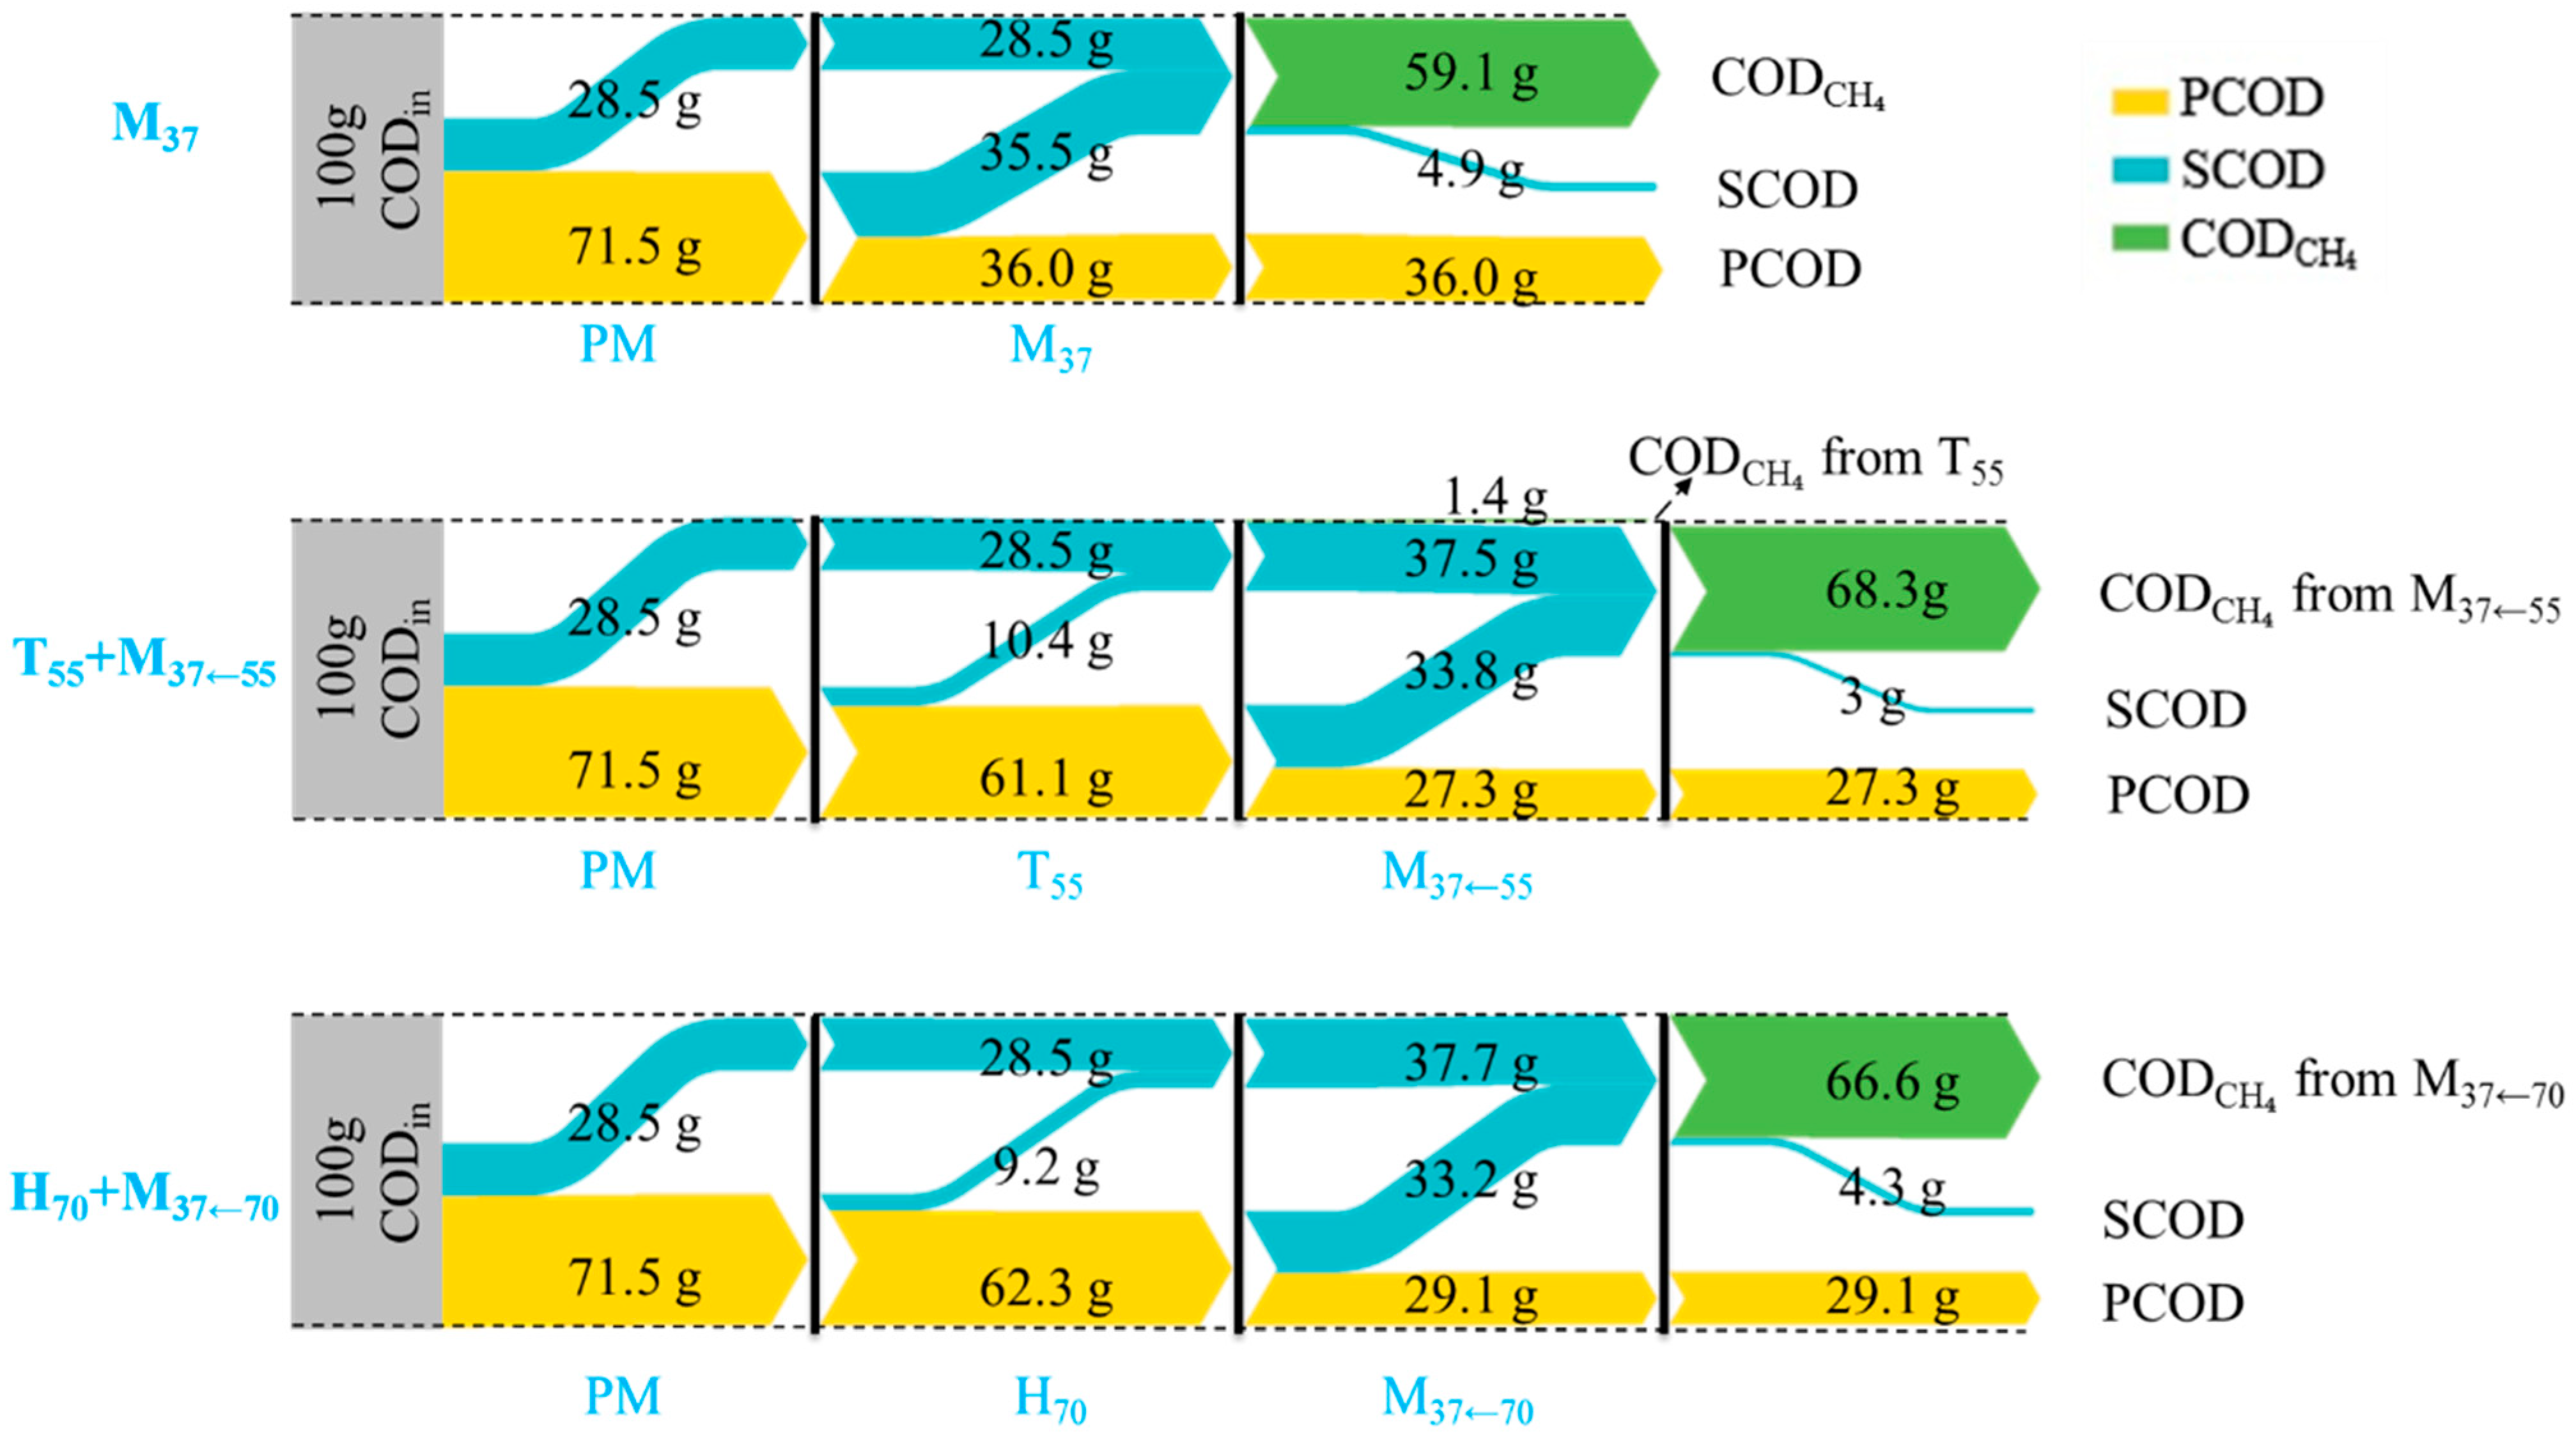
Based on hydrolysis and methanogenesis conversion efficiencies,
Figure 5 shows the COD flow of the three systems. The 100 g of feed pig manure (as TCOD) contained 28.5 g SCOD and 71.5 g PCOD. In the M
37, 49.7% of PCOD was converted into SCOD; thus, the hydrolysis conversion efficiency was 49.7%. Supposing this portion of the hydrolyzed COD was eventually completely converted to methane, then 23.6% methanogenesis conversion efficiency would be attributed to the contribution of SCOD in feed pig manure. Lastly, the methanogenesis conversion efficiency (59.1%) was higher than the hydrolysis conversion efficiency. In the two two-stage systems, 9.2–10.4% PCOD was converted into SCOD during the first stages and the 53.3–55.3% remaining PCOD was converted into SCOD in subsequent mesophilic reactors. Thus, it can be seen that the ability to convert PCOD to SCOD in the three mesophilic reactors was in this order: M
37←55 > M
37←70 > M
37. Thermophilic and hyper-thermophilic conditions in the first stage hydrolyzed solid organic matter by a small margin; therefore, the enhancement effect of high temperature on hydrolysis was reflected in both the first and second stages. Additionally, the thermophilic condition was better than the hyper-thermophilic condition. In the T
55 + M
37←55 system, 25.5 g out of 28.5 g SCOD in pig manure was converted into methane (supposing the COD hydrolyzed during the two stages was completely converted to methane). In the H
70 + M
37←70 system, 24.2% methanogenesis conversion efficiency was attributed to the contribution of SCOD in feed pig manure. Thermophilic-mesophilic AD had a better effect on hydrolysis and methane production.
3.4. Stability Performance in the Three Processes
Figure 6 summarizes the pH and VFA characteristics of feedstock pig manure and the sludge in the five reactors. The pH of pig manure fluctuated between 5.55~6.53. However, the pH of the thermophilic and hyper-thermophilic reactors stabilized at 6.14~6.30 and 5.69~6.10, respectively, although it did experience a rapid decline in the initial period. Unlike those two reactors, there were no distinct escalations or drops in the other three reactors during the initial period, and the pH ranges in the entire operation period were 7.69~8.06 (M
37), 7.58~8.01 (M
37←55) and 7.64~7.99 (M
37←70), respectively. Neutral to slightly alkaline conditions are optimal for methane-producing bacteria. A general understanding is that methanogenic bacteria have their optimum pH value within the range of 6.7~7.4 [
23]. However, it has been reported that the anaerobic digestion process can tolerate a pH range from 6.5 up to 8.0 [
24]. The pH ranges in the above three reactors were within the limits suitable for the growth and metabolism of methanogens, under conditions that required no pH adjustment. In the five reactors, the average pH values were 7.86 ± 0.08 (M
37), 6.21 ± 0.05 (T
55), 7.89 ± 0.08 (M
37←55), 5.89 ± 0.16 (H
70), and 7.77 ± 0.05 (M
37←70). Kruskal–Wallis ANOVA showed that there were distinctive differences (
p < 0.05) in the pH values between the T
55 and H
70 reactors, between the M
37←70 and M
37 reactors, and between the M
37←70 and M
37←55 reactors. There were distinctive differences (
p < 0.01) in the pH values between the T
55 and H
70 reactors, and between the M
37←55 and M
37←70 reactors. However, the M
37 and M
37←55 reactors had indistinctive differences (
p = 0.199 > 0.05). The pH value of the H
70 was lower than 6.2, which is a value under which methanogenic activity is considerably inhibited [
25]. It arises from the toxic effect on the methanogenic archaea of some intermediates, and this could explain the reason for the H
70 reactor not producing methane (
Figure 2).
Table 5 summarizes the main VFA and LA concentrations in the reactors. TVFA is the acidizing product and direct/indirect substrate for methanogenesis in anaerobic digestion, and the accumulation of VFAs should be avoided for a stable anaerobic process. A 13.1 ± 1.1 g-acetate/L high TVFA concentration was observed in the pig manure, and the concentrations of TVFA in the T
55 and H
70 were 23.1 ± 1.8 and 13.9 ± 2.0 g-acetate/L, respectively. A higher TVFA concentration in the T
55 than in the H
70 indicated that it was more beneficial to realize the acidification of organic matter in pig manure under thermophilic conditions. However, the T
55 had a higher pH value than the H
70, which could be explained by lactic acid concentration. In the T
55 and H
70 reactors, the lactic acid concentrations were 5.6 ± 0.4 and 13.0 ± 0.5 g/L, respectively. This result was in accordance with a previous report that higher production of lactic acid was obtained under hyper-thermophilic conditions [
26]. Soluble sugars are substrates available for the growth of lactic acid bacteria. Lactic acid can be degraded into acetic acid alone or acetic acid and propionic acid simultaneously [
27]. According to a previous study, a pH range of 5–6 was the optimum for lactic acid production [
28], explaining why additional lactic acid was produced at a hyper-thermophilic temperature. Another reason for the pH result could be attributed to a better buffer environment in the T
55 due to the high concentration of ammonia nitrogen with 3.1 ± 0.2 g/L, whereas 1.8 ± 0.1 g/L ammonia nitrogen was measured in the H
70. At the same time, it also showed better proteolysis in the thermophilic reactor than in the hyper-thermophilic reactor. This may have been due to the lower acidic pH inhibiting protein degradation [
29]. For pig manure with high nitrogen content, ammonia can lead to unstable anaerobic performance as a potential inhibitor [
30]. However, in the second stage reactors, that situation was not serious. In the methane-producing reactors, low concentrations of VFA were observed. During the steady period, the TVFA in the M
37, M
37←55, and M
37←70 reactors were 0.4 ± 0.2, 0.6 ± 0.2, and 0.4 ± 0.2 g-acetate/L, respectively, which showed that the methanogenic reactors were in a good condition. One-way ANOVA showed that there was no significant difference in residual VFA of the three mesophilic reactors (
p > 0.05).
In the five reactors, acetate, propionate, and butyrate were the main VFAs. The concentration of acetic acid in the T
55 was the highest at 7.89 g/L, 64% higher than that in the H
70 and 86% higher than that in pig manure. The concentration of propionic acid in the T
55 was 2.07 g/L, 1.6 times that of the H
70. The concentration of butyric acid in the T
55 was 3.54 g/L, 1.9 times that of H
70. In the T
55 and H
70, acetic acid was the highest proportion of VFA, followed by butyric acid and propionic acid. This is in line with previous research which indicated that acetic acid and butyric acid were the dominant VFA at 55 °C and 80 °C when cellulose was used as the substrate of acidogenic fermentation [
31]. As for the other three methane-producing reactors, the concentrations of acetic acid, propionic acid, and butyric acid were all below 0.2 g/L, which showed good stability.


