Article

Analysis of Thermal Comfort under Different Exercise Modes in Winter in Universities in Severe Cold Regions

1
Department of Architecture, School of Architecture and Civil Engineering, Huangshan University, Huangshan 245041, China
2
Key Laboratory of Cold Region Urban and Rural Human Settlement Environment Science and Technology, Ministry of Industry and Information Technology, School of Architecture, Harbin Institute of Technology, Harbin 150006, China
*
Author to whom correspondence should be addressed.
Sustainability 2022, 14(23), 15796; https://doi.org/10.3390/su142315796
Submission received: 14 October 2022 / Revised: 13 November 2022 / Accepted: 24 November 2022 / Published: 28 November 2022

Abstract

:
In this study, we collected 927 cases of samples from students at the Harbin Institute of Technology, China and conducted a thermal comfort questionnaire survey on four outdoor exercise modes in winter. Additionally, we analyzed the thermal perception conditions of the campus population in winter, the association between exercise volume and TCV (Thermal Comfort Vote) and the correlation between PET (physiological equivalent temperature) and MTSV (Mean Thermal Sensation Vote). Furthermore, we identified different PET neutral temperatures under different exercise modes (skating 3 °C, running 6 °C, hiking 9 °C, standing 14 °C), the variability of different thermal comforts in the original residence and the trend of thermal comfort with outdoor activity time. Finally, we obtained the prediction model of thermal perception under different exercise modes, and it can used as a basis for assessing the cold outdoor thermal environment to provide some references for environmental designers.

1. Introduction

Weather can affect human mood and behavior, and staying in a good outdoor environment for sufficient time can effectively improve human mood and perception [1]. Human activities are also influenced by weather conditions [2]. Winter is extremely cold in severe cold areas in China, and bad weather not only reduces human comfort but also causes local frostbite to the human body. The college student population is more frequently engaged in outdoor activities due to their younger and more vigorous age structure. In order to reduce health risks in extreme cold environments, we should precisely assess the thermal comfort criteria for the college student population to engage in outdoor activities [3].
The theoretical human comfort index is based on the human energy balance equation, which integrates the influence of meteorological elements and human parameters on human heat transfer and finally establishes a numerical model of the thermal environment and thermal comfort. The physiologically equivalent temperature (PET) [4] is defined as the typical indoor equivalent air temperature state, which determines the approximate thermal sensation of the human body outdoors [5]. At the same time, the physiologically equivalent temperature index considers the effects of several major factors such as meteorological parameters, clothing thermal resistance and activity level on thermal sensation and thermal comfort comprehensively. PET, which used to act as a thermal comfort evaluation index to evaluate outdoor environments in regions such as Kassel, Germany [6] (spring and summer), Tokyo, Japan [7] (spring) and Taichung, Taiwan [8] (all seasons), is now more widely applied in related fields. Several studies have also reported its application in evaluating complex outdoor environments in different climatic regions [9,10,11,12,13]. Xi Chen found that the outdoor thermal sensation of the Harbin population is insensitive to SET* changes but more sensitive to PET changes [14]. With reference to the meteorological parameters and human physiological parameters corresponding to each comfort index, some scholars worked out the distribution of the thermal sensation range corresponding to each comfort index and concluded that the PET index is more applicable in assessing the comfort level in areas with large temperature differences between seasons. Thus, the PET comfort evaluation index was used in this study for analysis [6,15,16].
According to the seven ASHRAE scales, “neutral” refers to a state in which the body neither feels cold nor hot. [17] In this state, the heat dissipation and heat production of the human body reach a balance, the amount of energy used for body temperature regulation is the least and the body temperature remains constant. According to Gagge [18] and Fanger [19], when the body feels “neutral”, human are in the state of “thermal comfort”. If the indoor environmental parameters are strictly controlled and the dress and activity conditions of personnel are also strictly regulated, the neutral temperature of the human body will not be affected by ethnicity, nor will it vary with seasons and climate. Experiments conducted in the United States, Denmark, Japan and China have found that the neutral temperature was relatively close to 26 °C [10,20,21]. The study of Katzschner [22] in Kassel, Germany used PET as an evaluation index and found that a PET between 18–21 °C was the thermoneutral temperature. Nikolopoulou [23] et al. found that the neutral temperature in different regions varied greatly through their study on field measurements and questionnaires (9189) on outdoor thermal comfort in seven cities in five European countries. Cheng [24] et al. conducted a longitudinal study on outdoor thermal comfort in Hong Kong and also found that the neutral PET temperature was 25 °C and 21 °C in summer and winter in Hong Kong, respectively. Furthermore, Lai, Dayi. [25] found that, in Tianjin, the neutral temperature was 14.6 °C in winter
Psychological adaptation refers to the fact that factors such as people’s thermal experiences and expectations can affect people’s psychological states when judging the thermal environment to some extent [26]. Thermal experience will lead to certain expectations of the current thermal environment, and different thermal experiences will generate different thermal expectations. For instance, if people’s expectations of the current environment are low, people will be more likely to feel comfortable. Chengzu Kang [27] conducted a trial study in different working conditions in a microclimate chamber. Through the analysis of thermal sensation, acceptance, etc., it was found that the participants adapted to the decrease in outdoor temperature quickly but responded to the increase in outdoor temperature slowly, indicating that people had psychologically adapted to the cold climate and were more adaptive to the colder environment. Igor Knez et al. [28] analyzed people from different cultures and regions. He found that Swiss people preferred sunlight more than Japanese people and concluded that local culture was an important factor influencing the usability of outdoor thermal comfort evaluation indicators.
To begin with, in terms of climate zoning, thermal comfort studies on higher education campuses mostly concentrate on tropical and subtropical regions; the relevant indexes vary greatly in different climate zones, even differing substantially [29]. Zhao, LJ [30] and Soheila Kl et al. [31] modified the existing evaluation indexes for hot climate and proposed a new thermal comfort index model; related literature [10,32,33] used thermal comfort indexes to evaluate the current thermal conditions and proposed corresponding optimization strategies. Gou ZH [34] determined the neutral temperature range of the campus population in different seasons in hot summer and cold winter regions. Zhou XL [35] analyzed the differences in the PET neutral temperature and adaptive behavior regulation of the campus population from different climate zones in hot summer and cold winter regions. Hong Bo [36] investigated the outdoor thermal comfort (OTC) of the campus population of different nationalities in cold regions. In recent times, there has been some research on the thermal comfort of university campuses in cold regions. Some of them focus on optimizing the campus space form to improve the microclimate and enhance thermal comfort. For example, Chen S [37] studied the influencing mechanism of the street form and building boundary on human thermal comfort. Other studies combine each climate factor with human behavior patterns to evaluate human thermal comfort, and it is applicable to thermal environment assessment. For example, Sun C [38] compared and analyzed the applicability of thermal comfort indicators for colleges in severe cold regions and determined the range of PET scales. Nonetheless, there are few comparisons of the thermal comfort of campus populations under different exercise modes in severe cold regions.
All in all, in the climate background of severe cold regions, a college campus has its own thermal comfort evaluation criteria due to its population characteristics and activity features. Therefore, this study explored the following aspects: thermal balance adjustment under different exercise modes, the thermal adaption analysis of different indigenous people to a cold climate, the analysis of the thermal adaptation process of outdoor activities, the thermal neutral temperature under different exercise modes and the prediction analysis of the thermal sensation under different exercise modes.

2. Research Methods

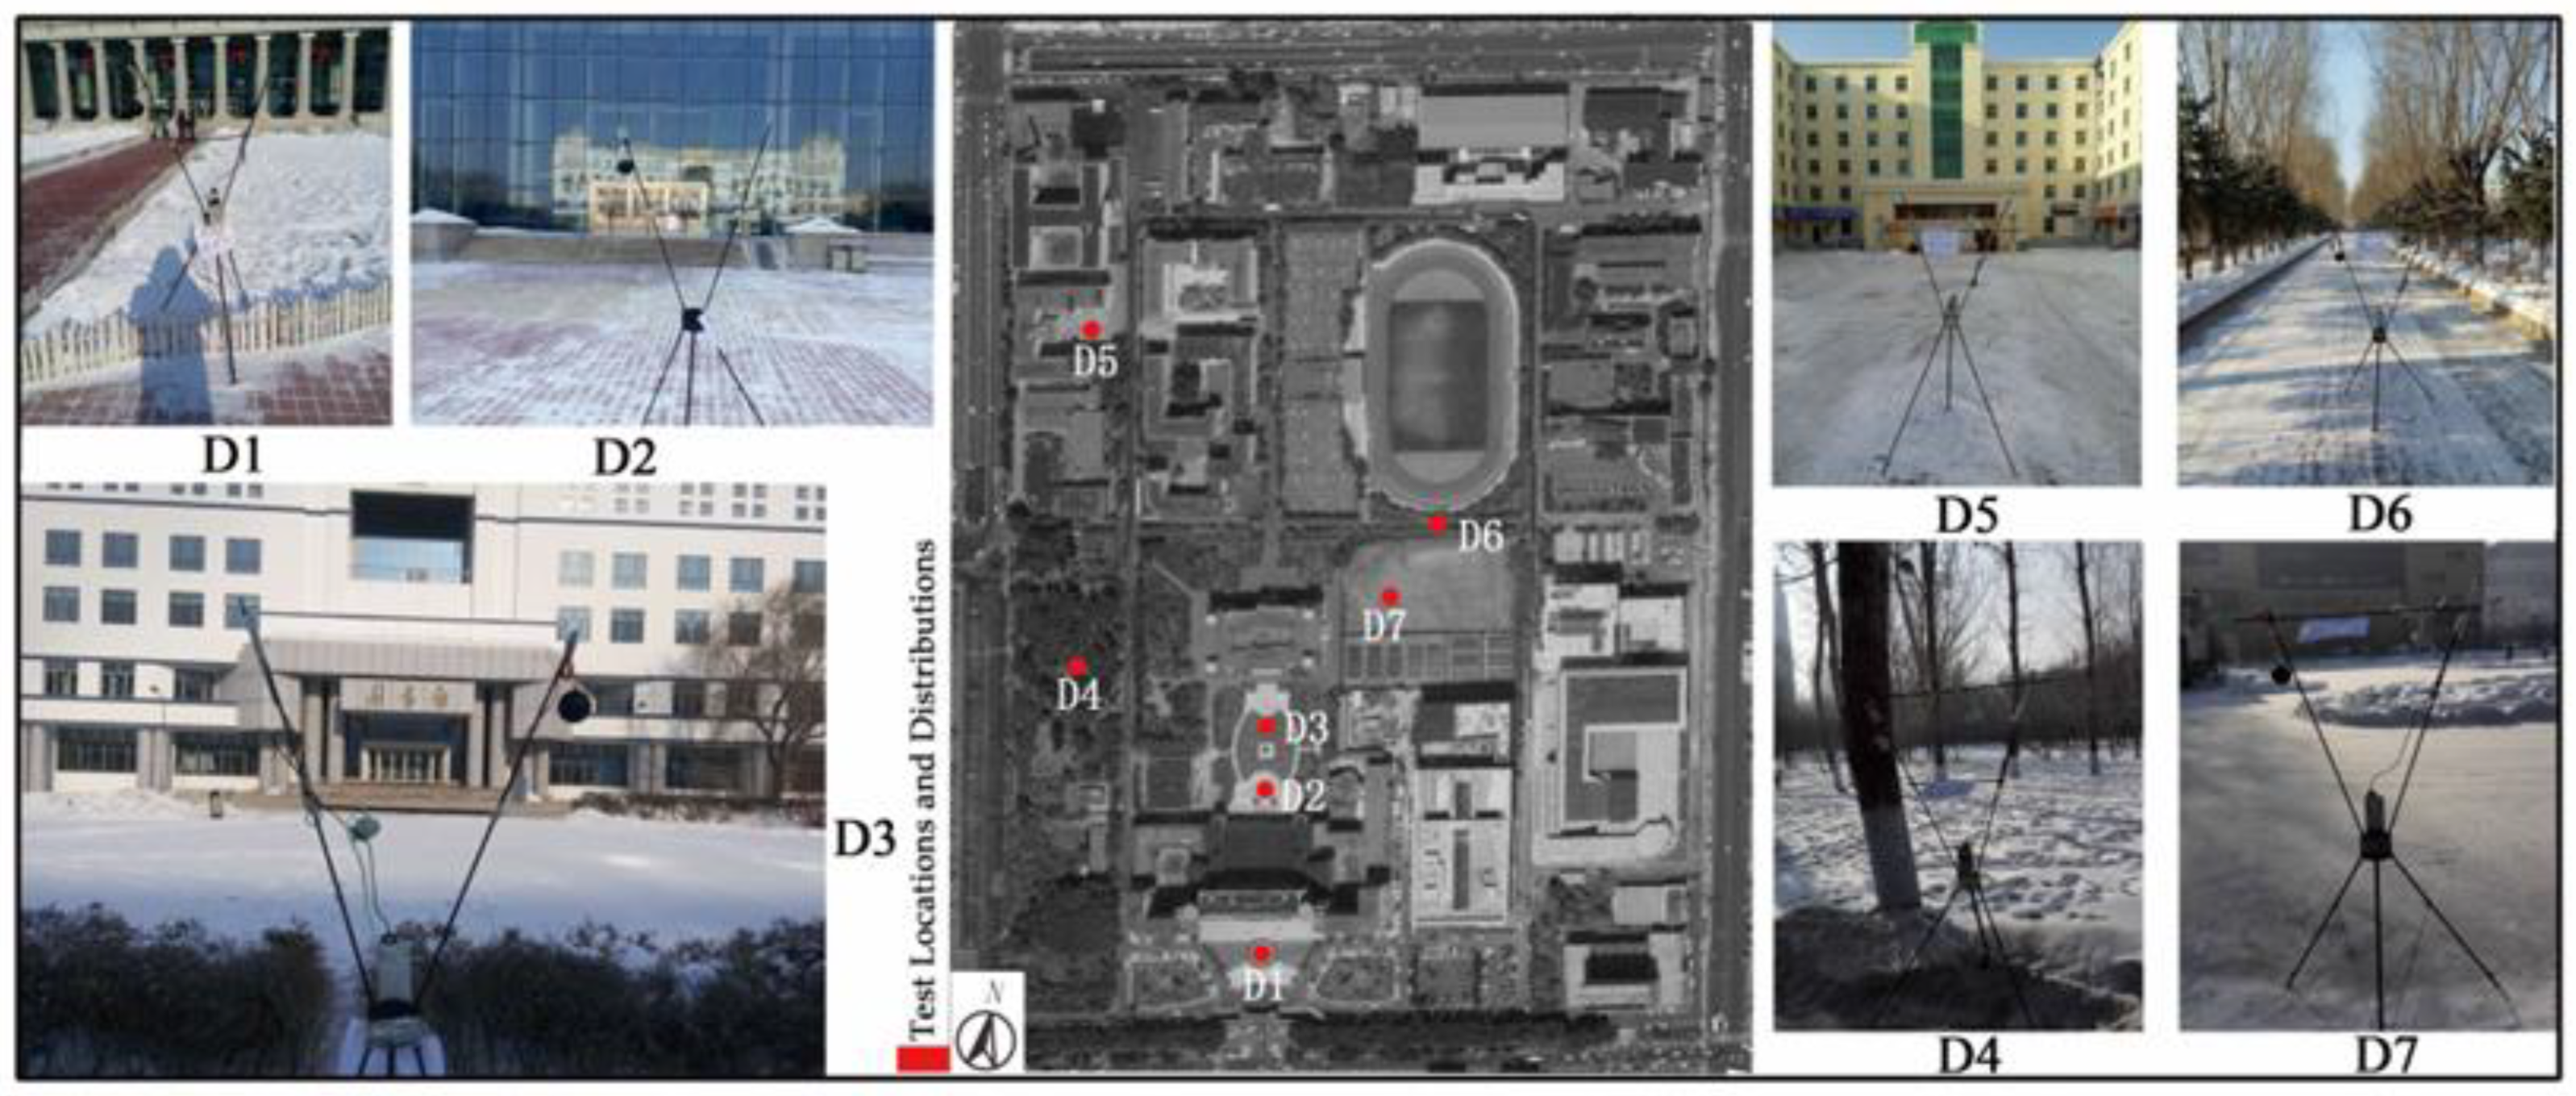
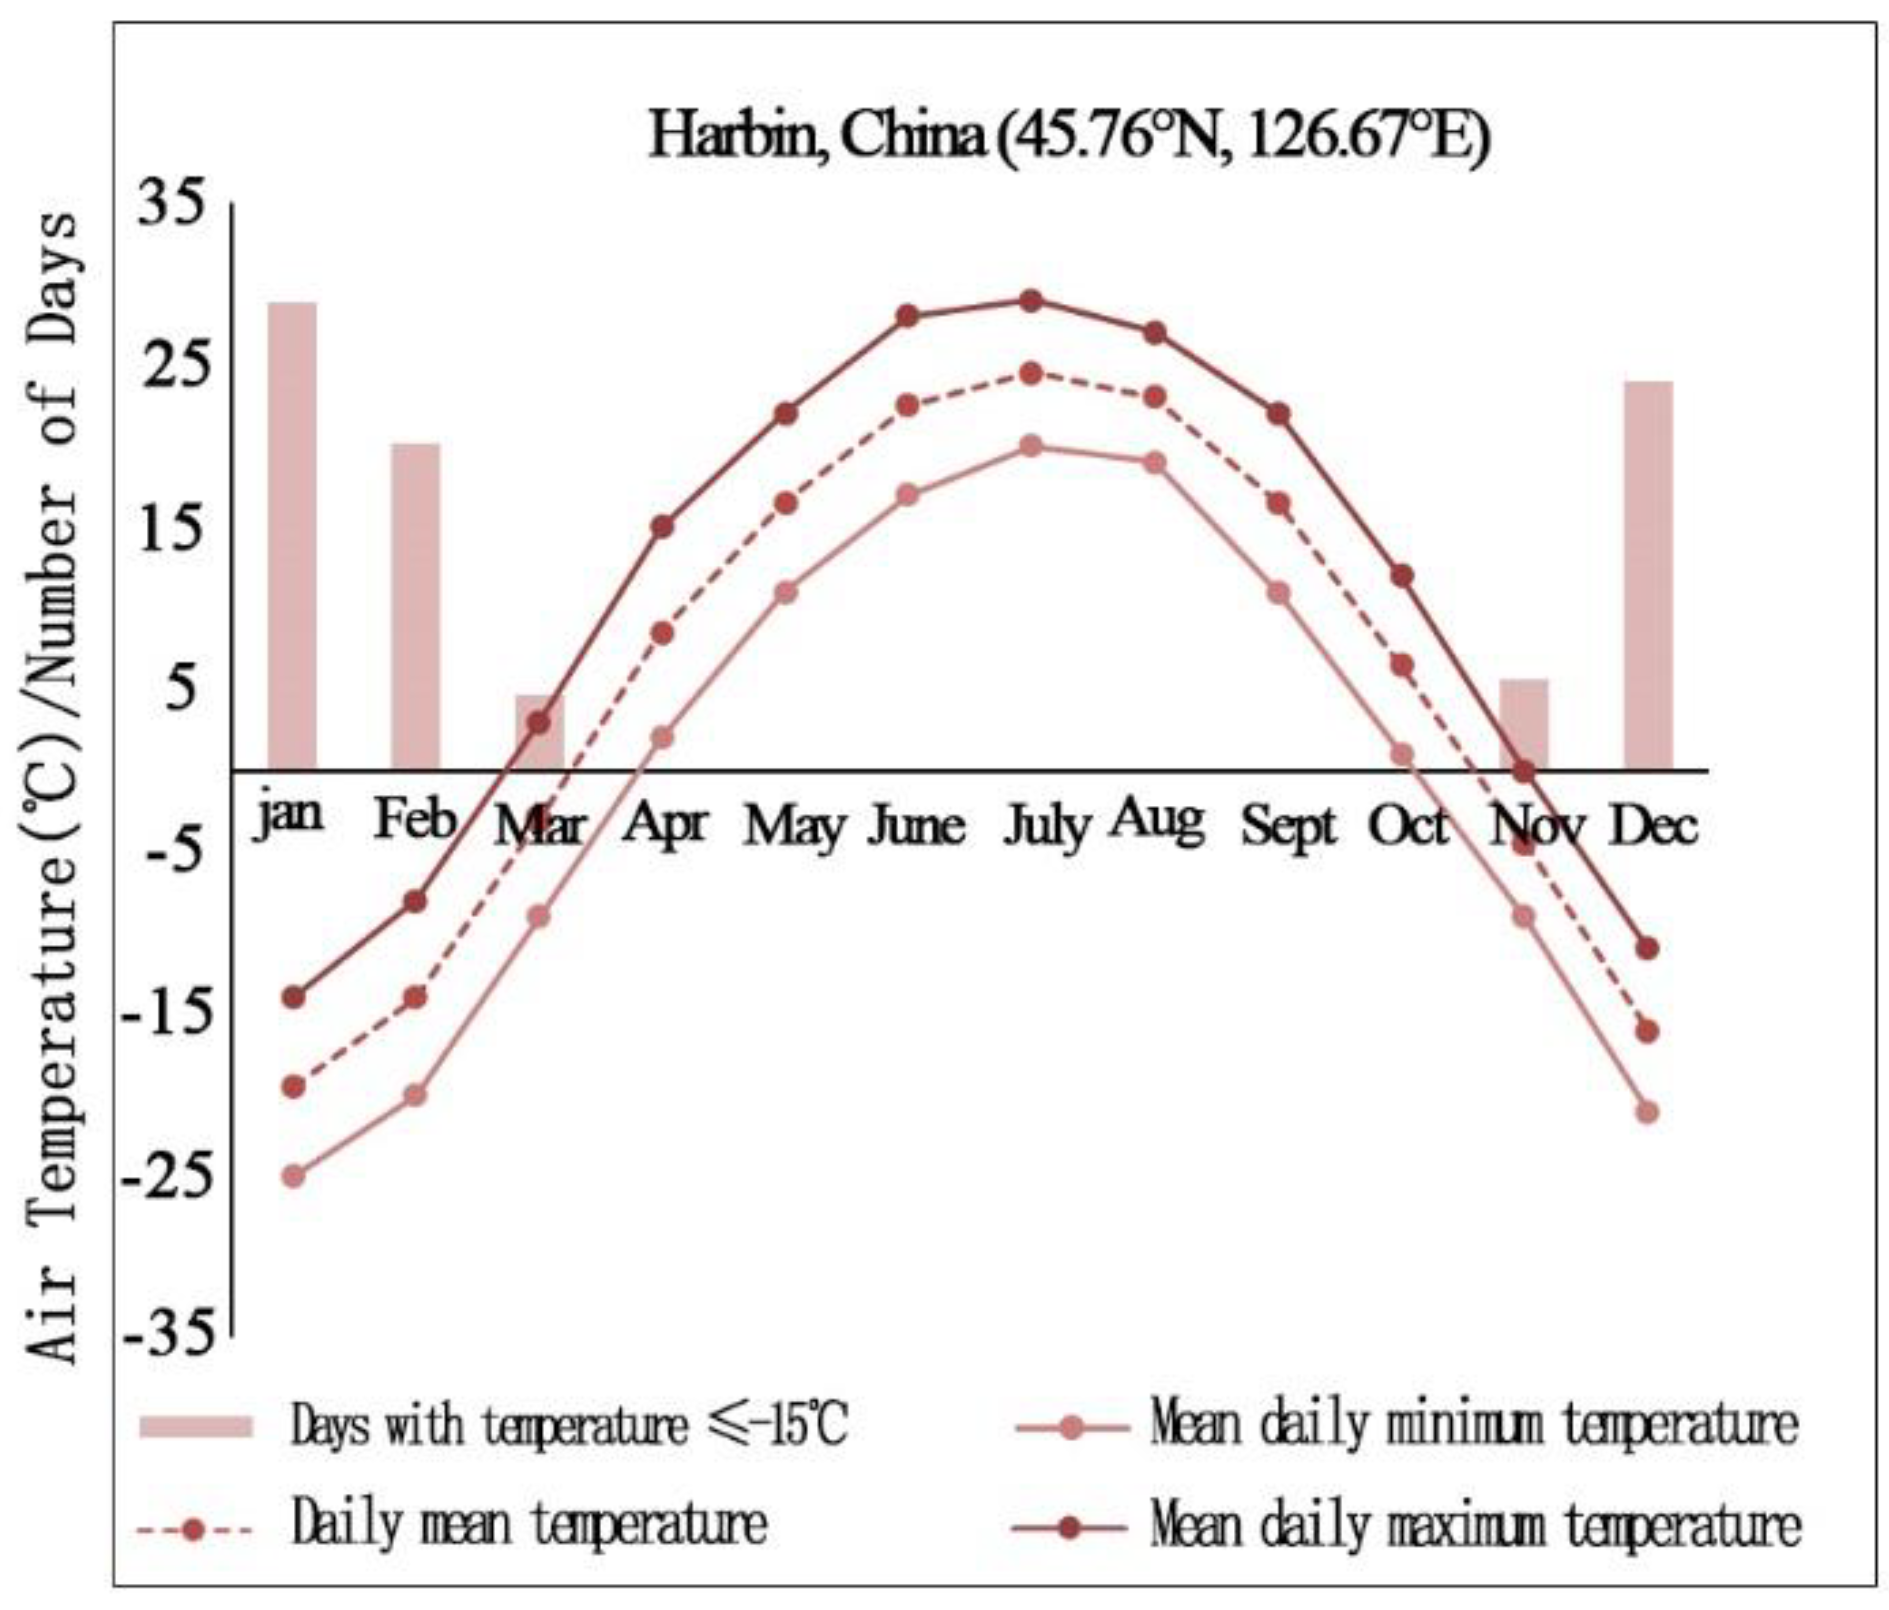
2.1. Overview of the Study Population

The research site is the second campus of the Harbin Institute of Technology, China, and the research subjects are university students. Harbin has long and cold winters, with a monthly mean temperature close to −20 °C in the coldest month, and southwestern wind prevails in the winter. It is also a typical severe cold city. The second campus of the Harbin Institute of Technology is a medium-sized campus, including teaching areas, sports areas and living grouping areas, which can meet the needs of different activities of people. The paper investigates the thermal comfort of the human body under different exercise modes (standing and chatting, walking, running, skating) outdoors. Thus, the sites where such exercises are frequent are chosen for the actual measurement, such as the skating rink, sidewalk, woods, courtyard (plastic field), etc. The subjects of this study (university students) came from different provinces. Thus, the adaptability of people from different places of origin to the cold winter climate in severe cold regions can be more objectively reflected.

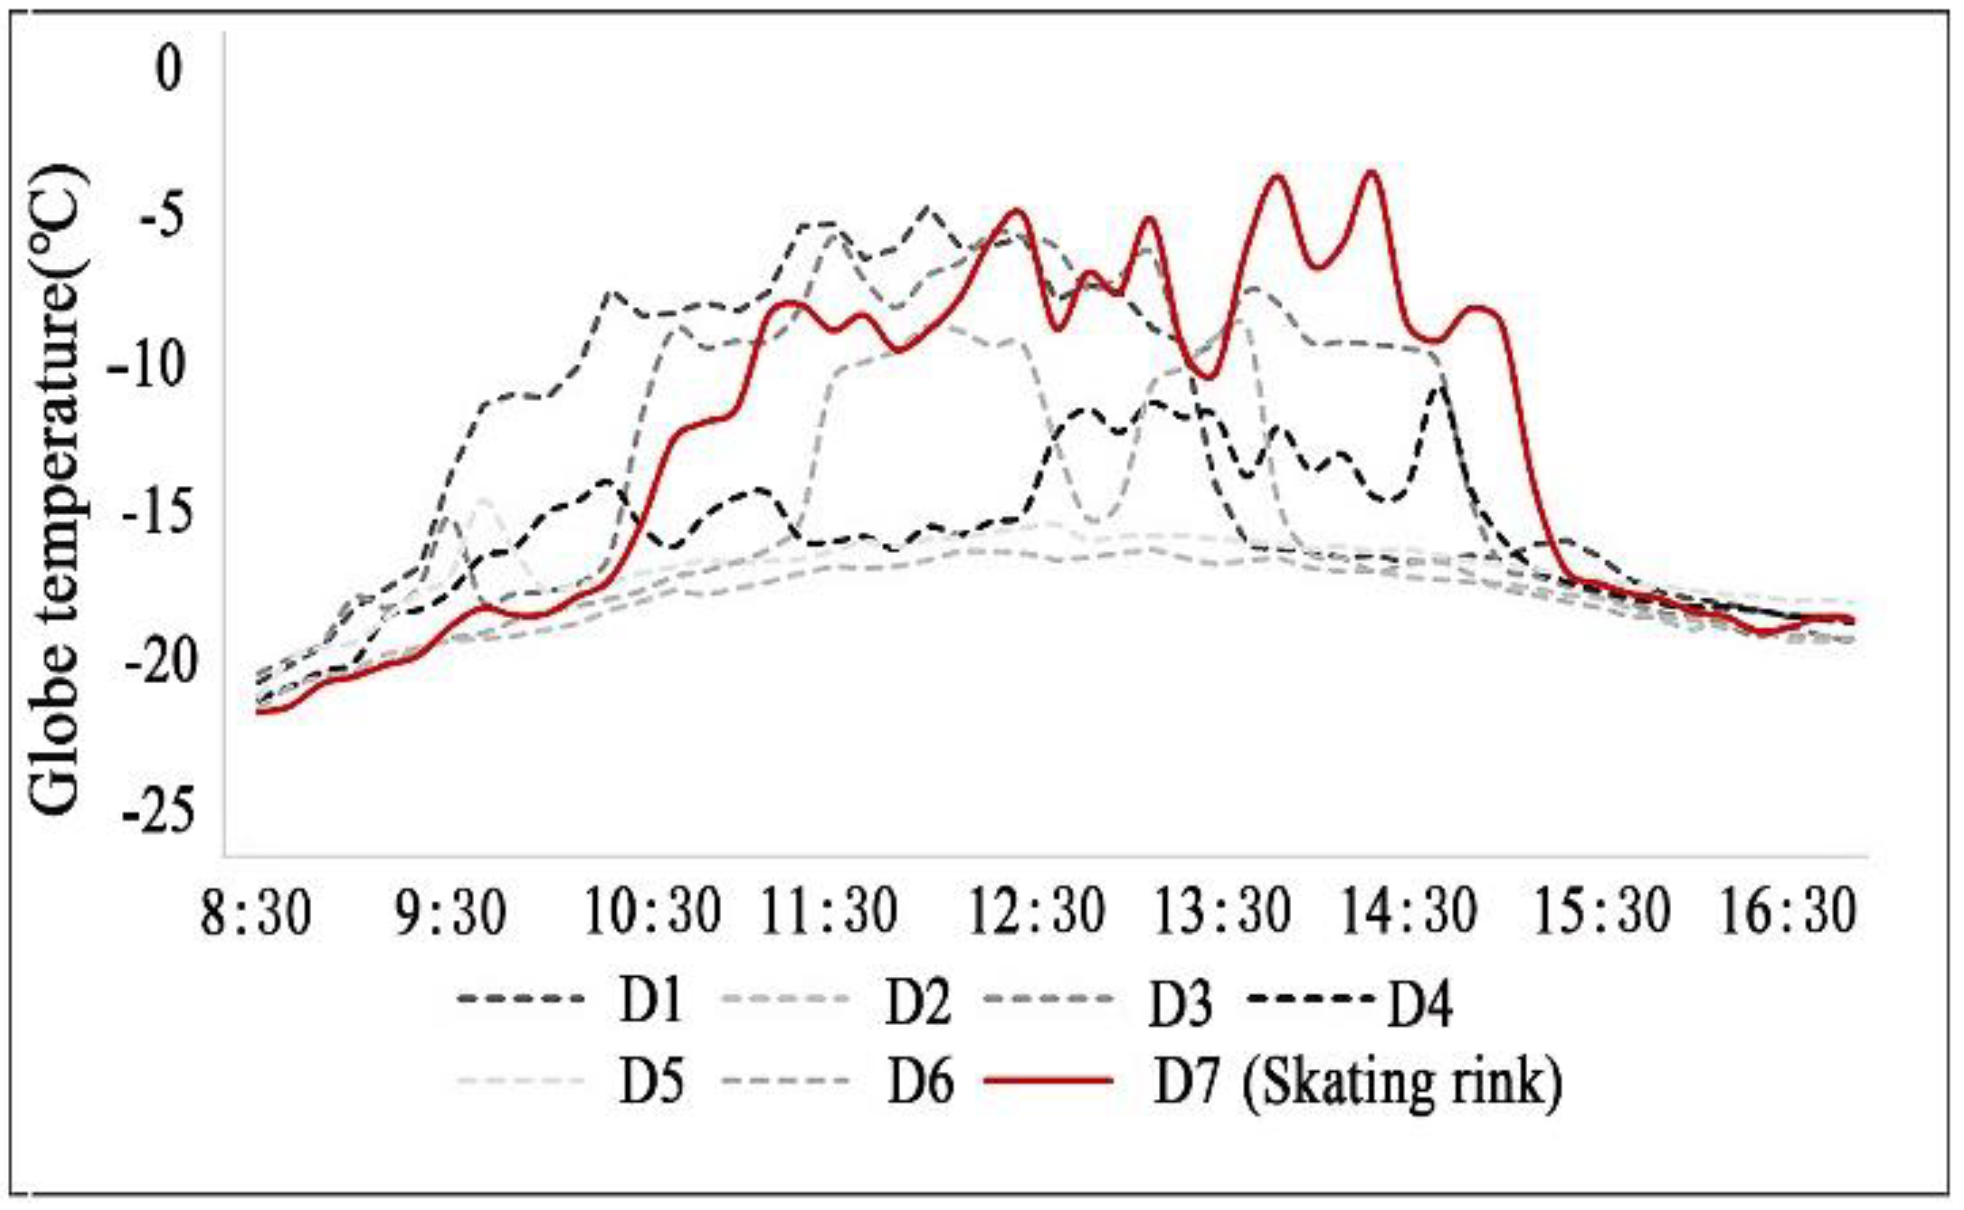
2.2. Data Collection

This article used a meteorological parameter collection method and questionnaire survey together to conduct the study. For the main outdoor exercise modes of students in winter (skating, running, walking, standing and chatting), seven measurement sites on campus were selected for the meteorological parameter collection (as shown in Figure 1). The collection period was from December 2020 to early January 2021, a typical winter meteorological period in Harbin (as shown in Figure 2). During this period, three sunny days were selected for the meteorological data collection, each time from 8:00 to 19:00. The collected physical environment data collected included outdoor air temperature (Ta), relative humidity (RH), wind speed (V), black-bulb temperature (Tg) and total sunlight radiation (G); the variation range of measured meteorological parameters is shown in Table 1, and it was used for the calculation of PET values for people under different exercise modes at each measurement point (calculated using the RayMan model). The details of the test instruments arrangement are shown in Figure 1, the test height was 1.5 m (pedestrian height), the data recording interval was 1 min and the accuracy of the test instrument is shown in Table 2. The cloud amount was obtained from the test data of the fixed weather station on the same day. Referring to the prescribed clothing thermal resistance standard in ASHRAE55-2013 [39], the amount of clothing (Clo) was calculated according to the actual clothing combination, and the clothing thermal resistance range was concentrated between 1.52 Clo and 2.03 Clo.

2.3. Questionnaire Survey Design

A total of 927 valid questionnaires were received in this survey, and the questionnaire personnel were divided into four groups according to the human behavior pattern for research. The survey content was divided into two parts: the first part is the basic information of the respondents, including gender, place of origin, amount of clothing and duration of exercise; the second part is the sensation vote, which is mainly to vote subjectively on temperature, wind speed and radiation, respectively. The thermal sensory voting (TSV) that corresponds to temperature used the ASHRAE seven-level scale, and the thermal comfort voting (TCV) used the five-level scale since the subtle differences perceived by the human body in cold weather are easily misjudged by the participants, as shown in Table 3 and Table 4. Bin frequency analysis was used as the statistical method for the data.

2.4. Activity Level Calculation

With reference to the metabolic rate of the human body under different labor intensities proposed by the ASHRAE55-2013 standard, combined with the basic situation of the research exercise level, the exercise level of skating can be set at 180 W, the exercise level of running can be set at 205 W, the exercise level of walking can be set at 120 W and the exercise level of standing can be set at 100 W. The Ray Man model was used to calculate the PET values in each motion state, and the starting conditions for this model to input include air temperature (Ta), relative humidity (RH), wind speed (V), mean radiation temperature (Tmrt), the geographical location of the calculation site and the participants’ age, gender, weight (kg), height (m), activity intensity (W) and clothing thermal resistance (Clo). Among them, air temperature (Ta), relative humidity (RH) and wind speed (V) values were obtained based on the collected data of the weather station at each measuring site. The average radiation temperature (Tmrt) was calculated using Equation (1) [40]
Tmrt = [ ( Tg + 273 ) 4 + 1.10   ×   10 8 V 0.6 ε   ×   D 0.4 ( Tg     Ta ) ] 1 4 273
where: D is the diameter of the black sphere (0.08 m); ε is the scattering coefficient (0.95); other parameters have the same meaning as before.

3. Analysis of Measurement and Questionnaire Results

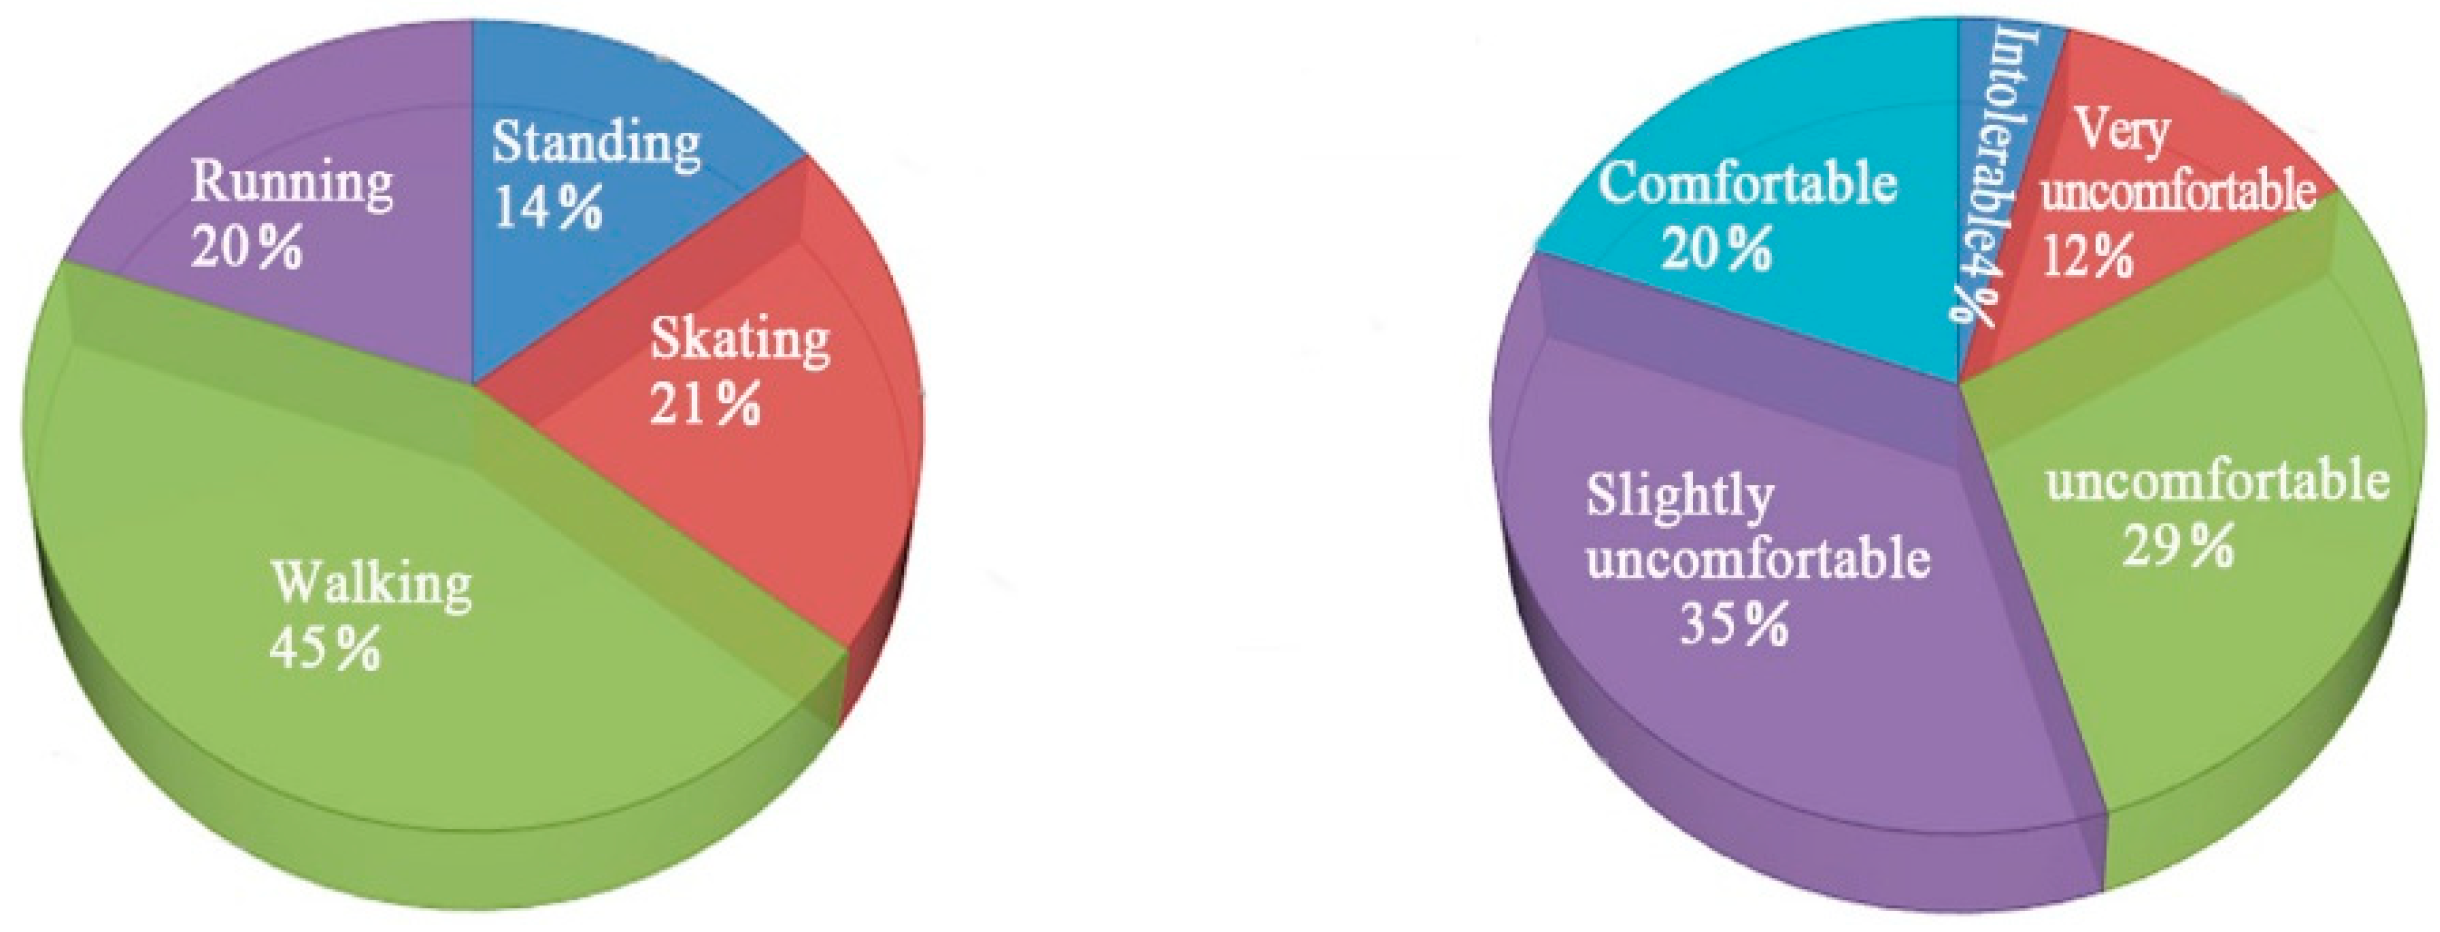
3.1. Thermal Sensation Statistics

The basic information of the respondents is as follows: males account for 49.5% and females account for 50.5%; their ages are mainly between 18 and 26 years old; they have lived in Harbin for more than 6 months. In this study, the research object is the comfort level of outdoor activities for college students. Due to the cold winter in severe cold regions, students’ outdoor activities are limited and monotonous, mainly including skating, running, walking and standing. In the study period, the proportion of different exercise patterns of the investigators is shown in Figure 3.
Among all respondents, 20% were comfortable, 35% were slightly comfortable, 29% were uncomfortable, 12% were very uncomfortable and 4% were intolerable. The median thermal comfort level of all respondents was 2.0, and the mean was 2.48, greater than the median, indicating that the overall sensation of thermal comfort is low. While the outdoor environment in Harbin is relatively harsh in winter, the thermal comfort level is acceptable due to people’s behavioral, physiological and psychological adaptations to this environment. Although the distribution of the thermal comfort votes of men and women was basically the same (Figure 4), the relative proportions of men and women feeling comfortable were different, and the proportion of men feeling comfortable is higher than that of women (men (11%) and women (7%)). This is because the activity level of women among the respondents was slightly lower than that of men, and the clothing index of women was also lower than that of men. Thus, the low thermal resistance of clothing and the lower metabolic volume reduced the thermal comfort level of women.

3.2. The Relationship between Exercise Volume and Thermal Comfort

Both metabolic volume and environment temperature have a significant effect on the thermal sensation comfort of the human body. From Figure 5, it can be seen that the thermal comfort level of skating is the highest, followed by the running and walking modes, and the standing mode has the lowest thermal comfort level. With the increase in metabolic volume, the thermal balance adjustment of the human body will regulate the balance between heat production and heat dissipation. Moreover, the core temperature will gradually rise during the balance process and level off when the activity lasts for a period of time, and at this time, the core temperature will tend to stabilize. Furthermore, the thermal sensation of the human body will also tend to stabilize accordingly, and humans will feel warmer.
Based on the above, the metabolic volume of skating is slightly lower than that of running, but the thermal comfort level of skating is significantly higher than that of running. The reason is that, in the daytime and the same working condition, the temperature of the black globe is higher than that of the other underlying surface. Particularly, between 12:30 and 15:30, the temperature of the black globe is significantly higher than that of other underlying surfaces (see Figure 6), and in this time period, ice skating exercise activity is frequent. Moreover, due to the fixed skating rink, the relatively stable physical thermal environment, the different running path, the volatile environment and, especially, the huge impact of solar radiation, the thermal comfort level of the human body is reduced. According to the questionnaire statistics, the proportion of the four exercise modes reaching the thermal comfort state is as follows: skating is 31%, running is 22%, walking is 17% and standing is 2%. As shown in Figure 5, the thermal comfort distribution states of running and walking are similar. Nonetheless, it can be seen from the above that the percentage of running thermal comfort is higher than that of walking, and the metabolic volume of running is higher than that of walking, indicating that there is a positive relationship between the metabolic volume and thermal comfort when outdoor activities are carried out in winter in servere cold regions.

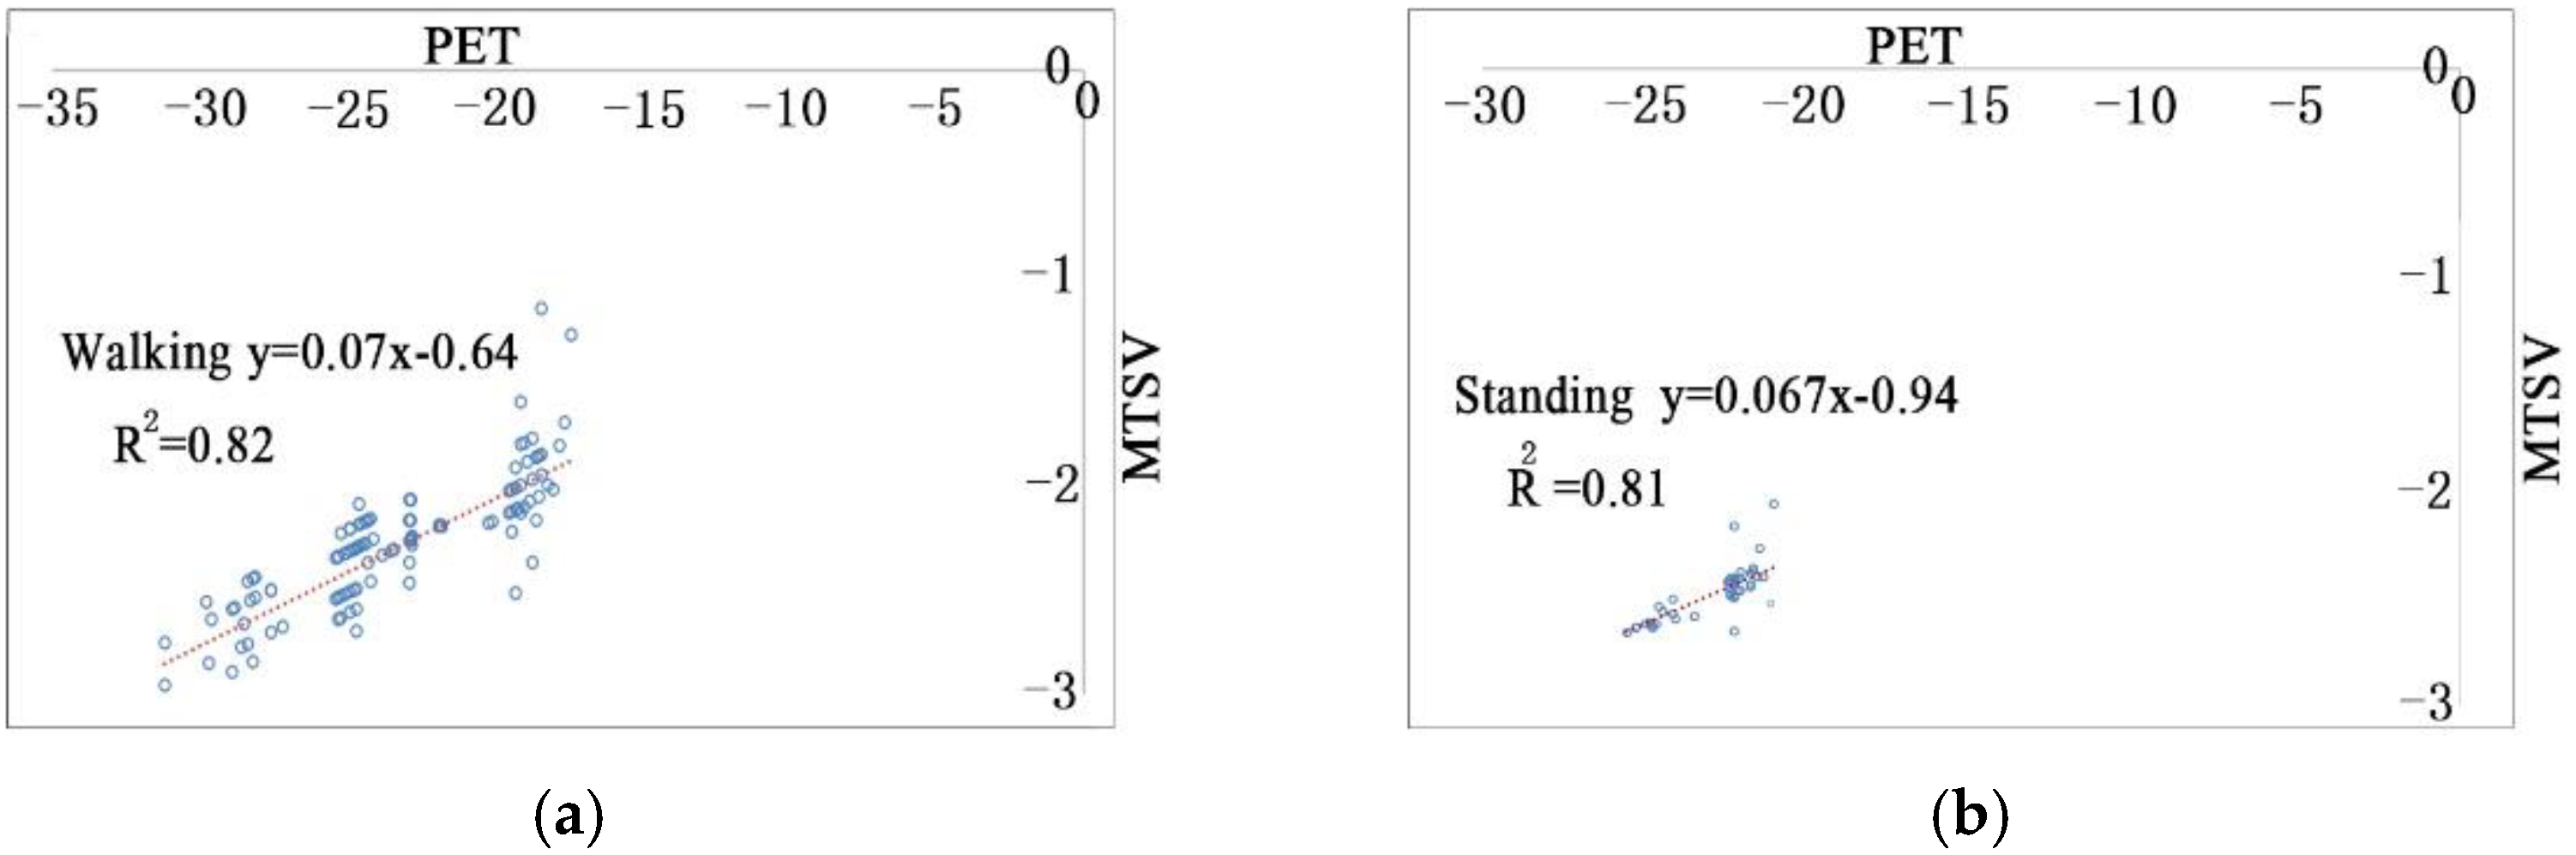
3.3. Correlation between Physiologically Equivalent Temperature and Mean Thermal Sensory Vote

Due to individual differences and the influence of psychological and physiological factors, people’s thermal sensation varies even in the same environment. Thus, it is not accurate enough to directly use TSV to model human thermal sensation. Therefore, the temperature frequency method (Bin method) was adopted, i.e., the temperature variation range was divided into several temperature intervals according to certain intervals, with the central temperature of each temperature interval as the independent variable and the mean value of the thermal sensation vote, MTSV (Mean Thermal Sensation Vote), as the dependent variable. The quantitative relationship between the two was established by linear regression analysis. Combining the votes of the four motion states, the fitting equations of each motion mode were finally achieved by the above method, as shown in Figure 7, Figure 8 and Figure 9. It can be seen that the R2 values of the regression equations under these four exercise modes are greater than 0.8, indicating that the degree of fitting is relatively high and is of statistical significance. The slope of the fitting equation indicates the thermal sensitivity of thermal sensation to PET changes. From the results (Figure 9), it can be seen that the thermal sensitivity of the four exercises is skating, running, walking and standing, in order. From the MTSV and PET fitting equation, it can be seen that, for every 9 °C increase in skating mode PET, every 12 °C increase in running mode PET, every 14 °C increase in walking mode PET and every 15 °C increase in standing mode PET, the thermal sensation level will increase by one level.
Neutral temperature refers to the temperature in which people feel neither cold nor hot. When MTSV = 0, the PET neutral temperature of the four exercise modes can be obtained through the fitting equation, and the details are shown in Table 5. The neutral temperature under the skating mode is 3 °C, which is obviously lower than that of other exercise modes. The main reason is that most of the subjects’ activity time is between 10 and 15. At that time, the air temperature and solar radiation are high, the black globe temperature on the ice surface is also higher than that of other surfaces and the metabolism is also on the high side due to the large amount of exercise. All the factors result in a high thermal sensation and low neutral temperature of the human body. Some of the running respondents chose the evening as their activity time. In the evening, the temperature and the amount of solar radiation are low. For the convenience of sports, the average thermal resistance of sportswear is 0.3 Clo lower than that of other states, so the thermal sensation is low and the desired neutral temperature is high compared to skating. However, the neutral temperature of walking and standing is low because of the small amount of metabolism of the exercise mode. The thermal sensitivity decreases, leading to a cold thermal sensation, and the expected neutral temperature increases accordingly. As shown in Figure 7, Figure 8 and Figure 9, according to the scatter diagram of PET and MTSV calculated by meteorological and physical parameters, the neutral temperature of each exercise mode is not within this range, which indicates that Harbin is cold in winter, and it is difficult for the outdoor temperature to reach the neutral temperature when engaging in outdoor exercises.

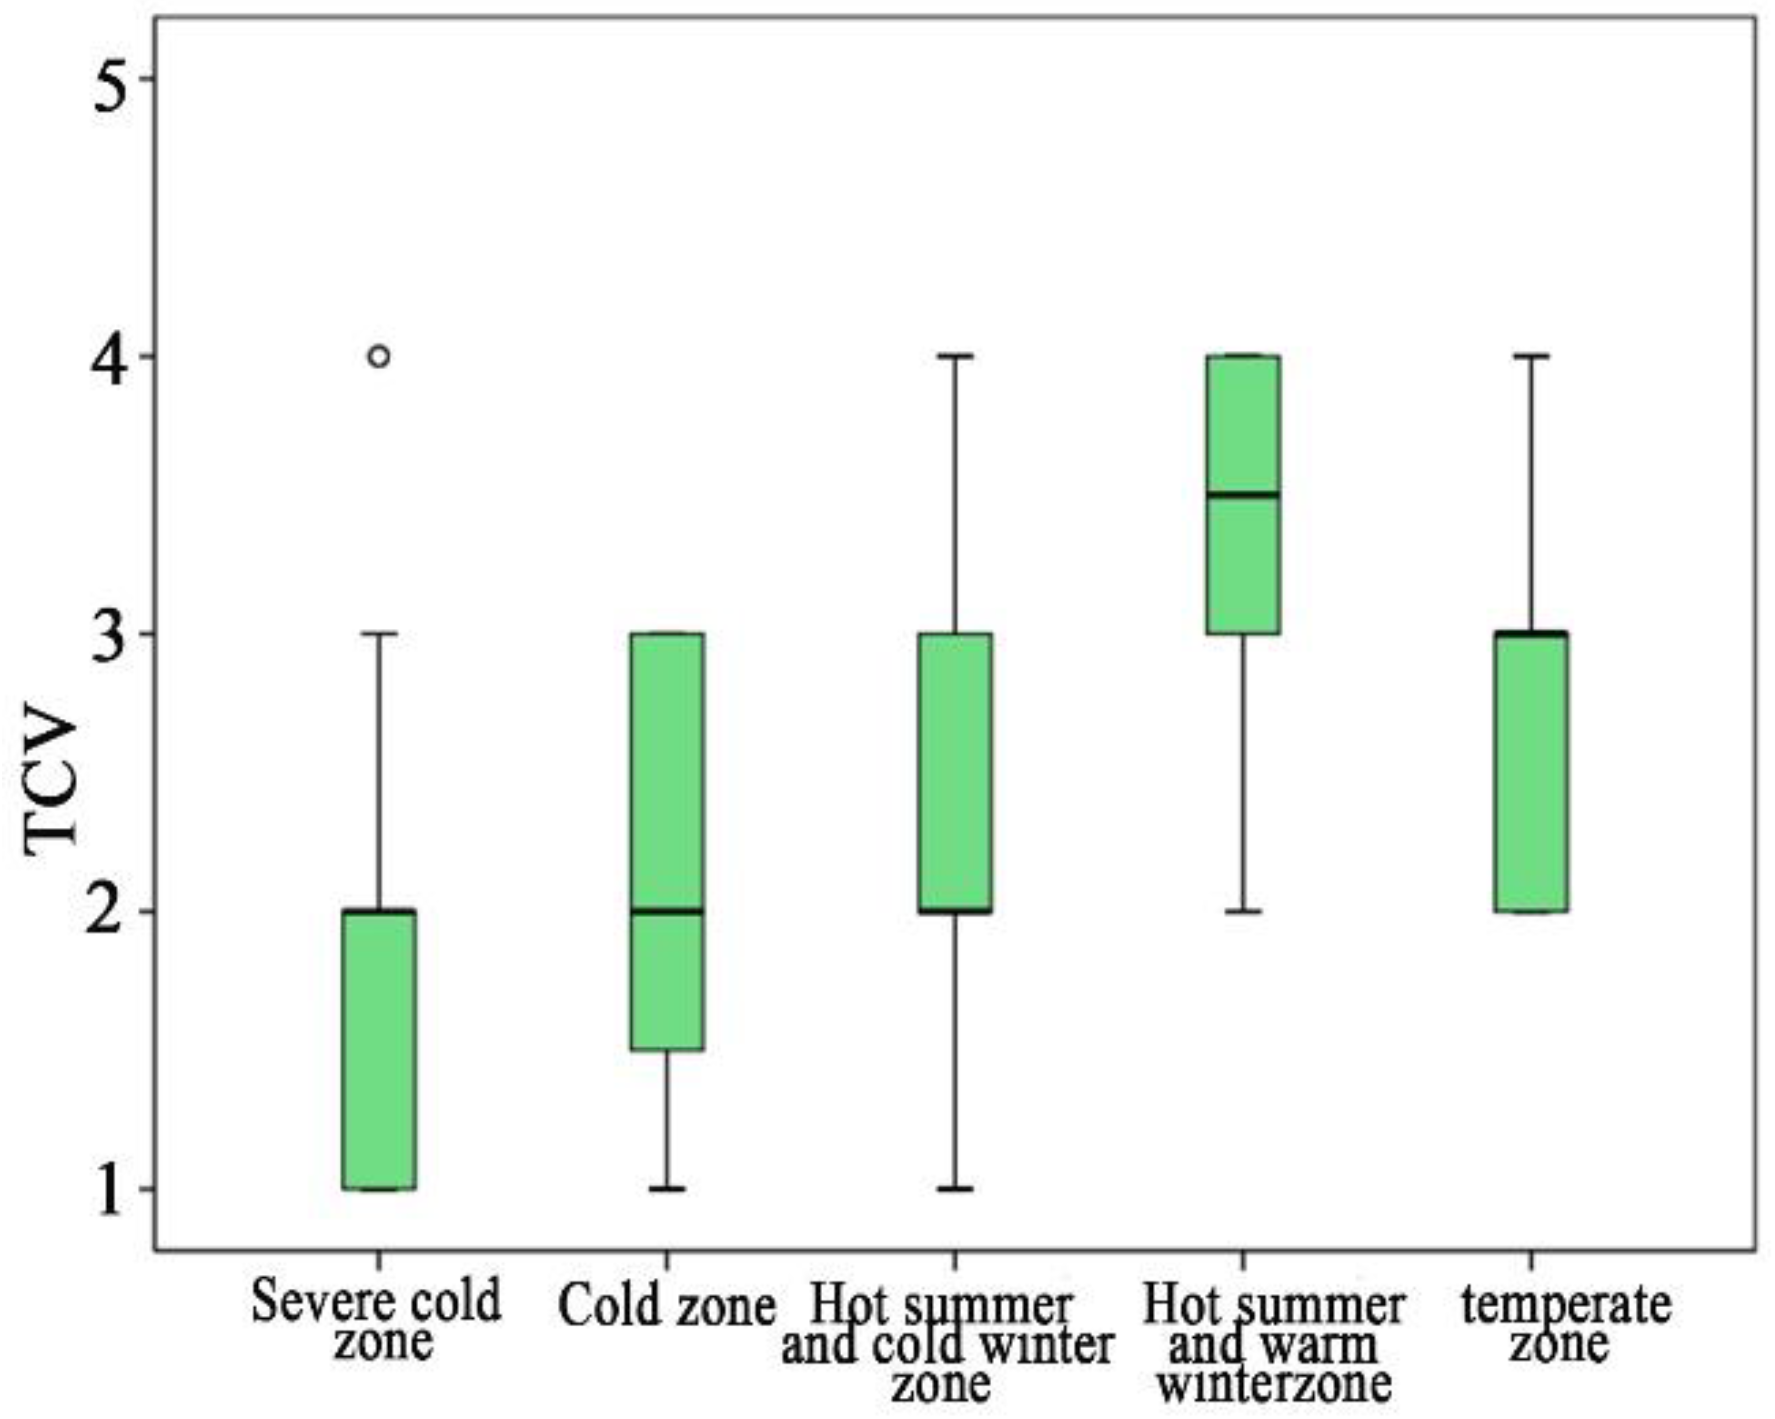
3.4. Relationship between Place of Origin and Thermal Comfort

According to GB 50176-2016 “Code for thermal design of civil buildings” for climate zoning, China is divided into five zones: severe cold zone (tmin.m ≤ −10 °C), cold zone (10 °C < tmin.m ≤ 0 °C), hot summer and cold winter zone (0 °C < tmin.m ≤ 10 °C, 25 °C < tmax.m ≤ 30 °C), hot summer and warm winter zone (10 °C < tmin.m, 25 °C < tmax.m ≤ 29 °C) and temperate zone (0 °C < tmin.m ≤ 13 °C,18 °C < tmax.m ≤ 25 °C). People’s adaptation and habituation to the climatic conditions in their long-term residence result in some differences in their thermal perception and comfort in the new climatic conditions. In this study, the respondents’ original places of residence are classified according to the thermal climate zones, people in the same exercise mode are selected for the comparison of thermal comfort levels and the research subjects have lived in Harbin for more than 6 months. Skating is chosen for the analysis because of the relatively uniform distribution of skating subjects and the relatively concentrated activity time (Figure 10).
Overall thermal comfort levels: severe cold zone > cold zone > hot summer and cold winter zone > hot summer and warm winter zone > temperate zone. Harbin is a typical cold region with extremely cold winters, and its temperatures ranged from −32 to −16 °C during the test period. Therefore, the evaluation of the level of thermal comfort of people in different places of origin is also an evaluation of the degree of cold resistance of the human body. The main reason for the above results is people’s experience with the climatic conditions of their long-term place of residence. Thermal experience refers to people’s past thermal experience, which influences their perception of the outdoor thermal environment. The longer one lives in a place or stays outside and the more repeatedly a pedestrian is exposed to a thermal environment, the response to this environmental stimulus decreases accordingly, and the expected comfort level to it decreases as well. Therefore, the highest level of thermal comfort of the population was found in the severe cold zone [41]. The temperature varies from low to high in different climate zones, and the comfort level varies from high to low accordingly.

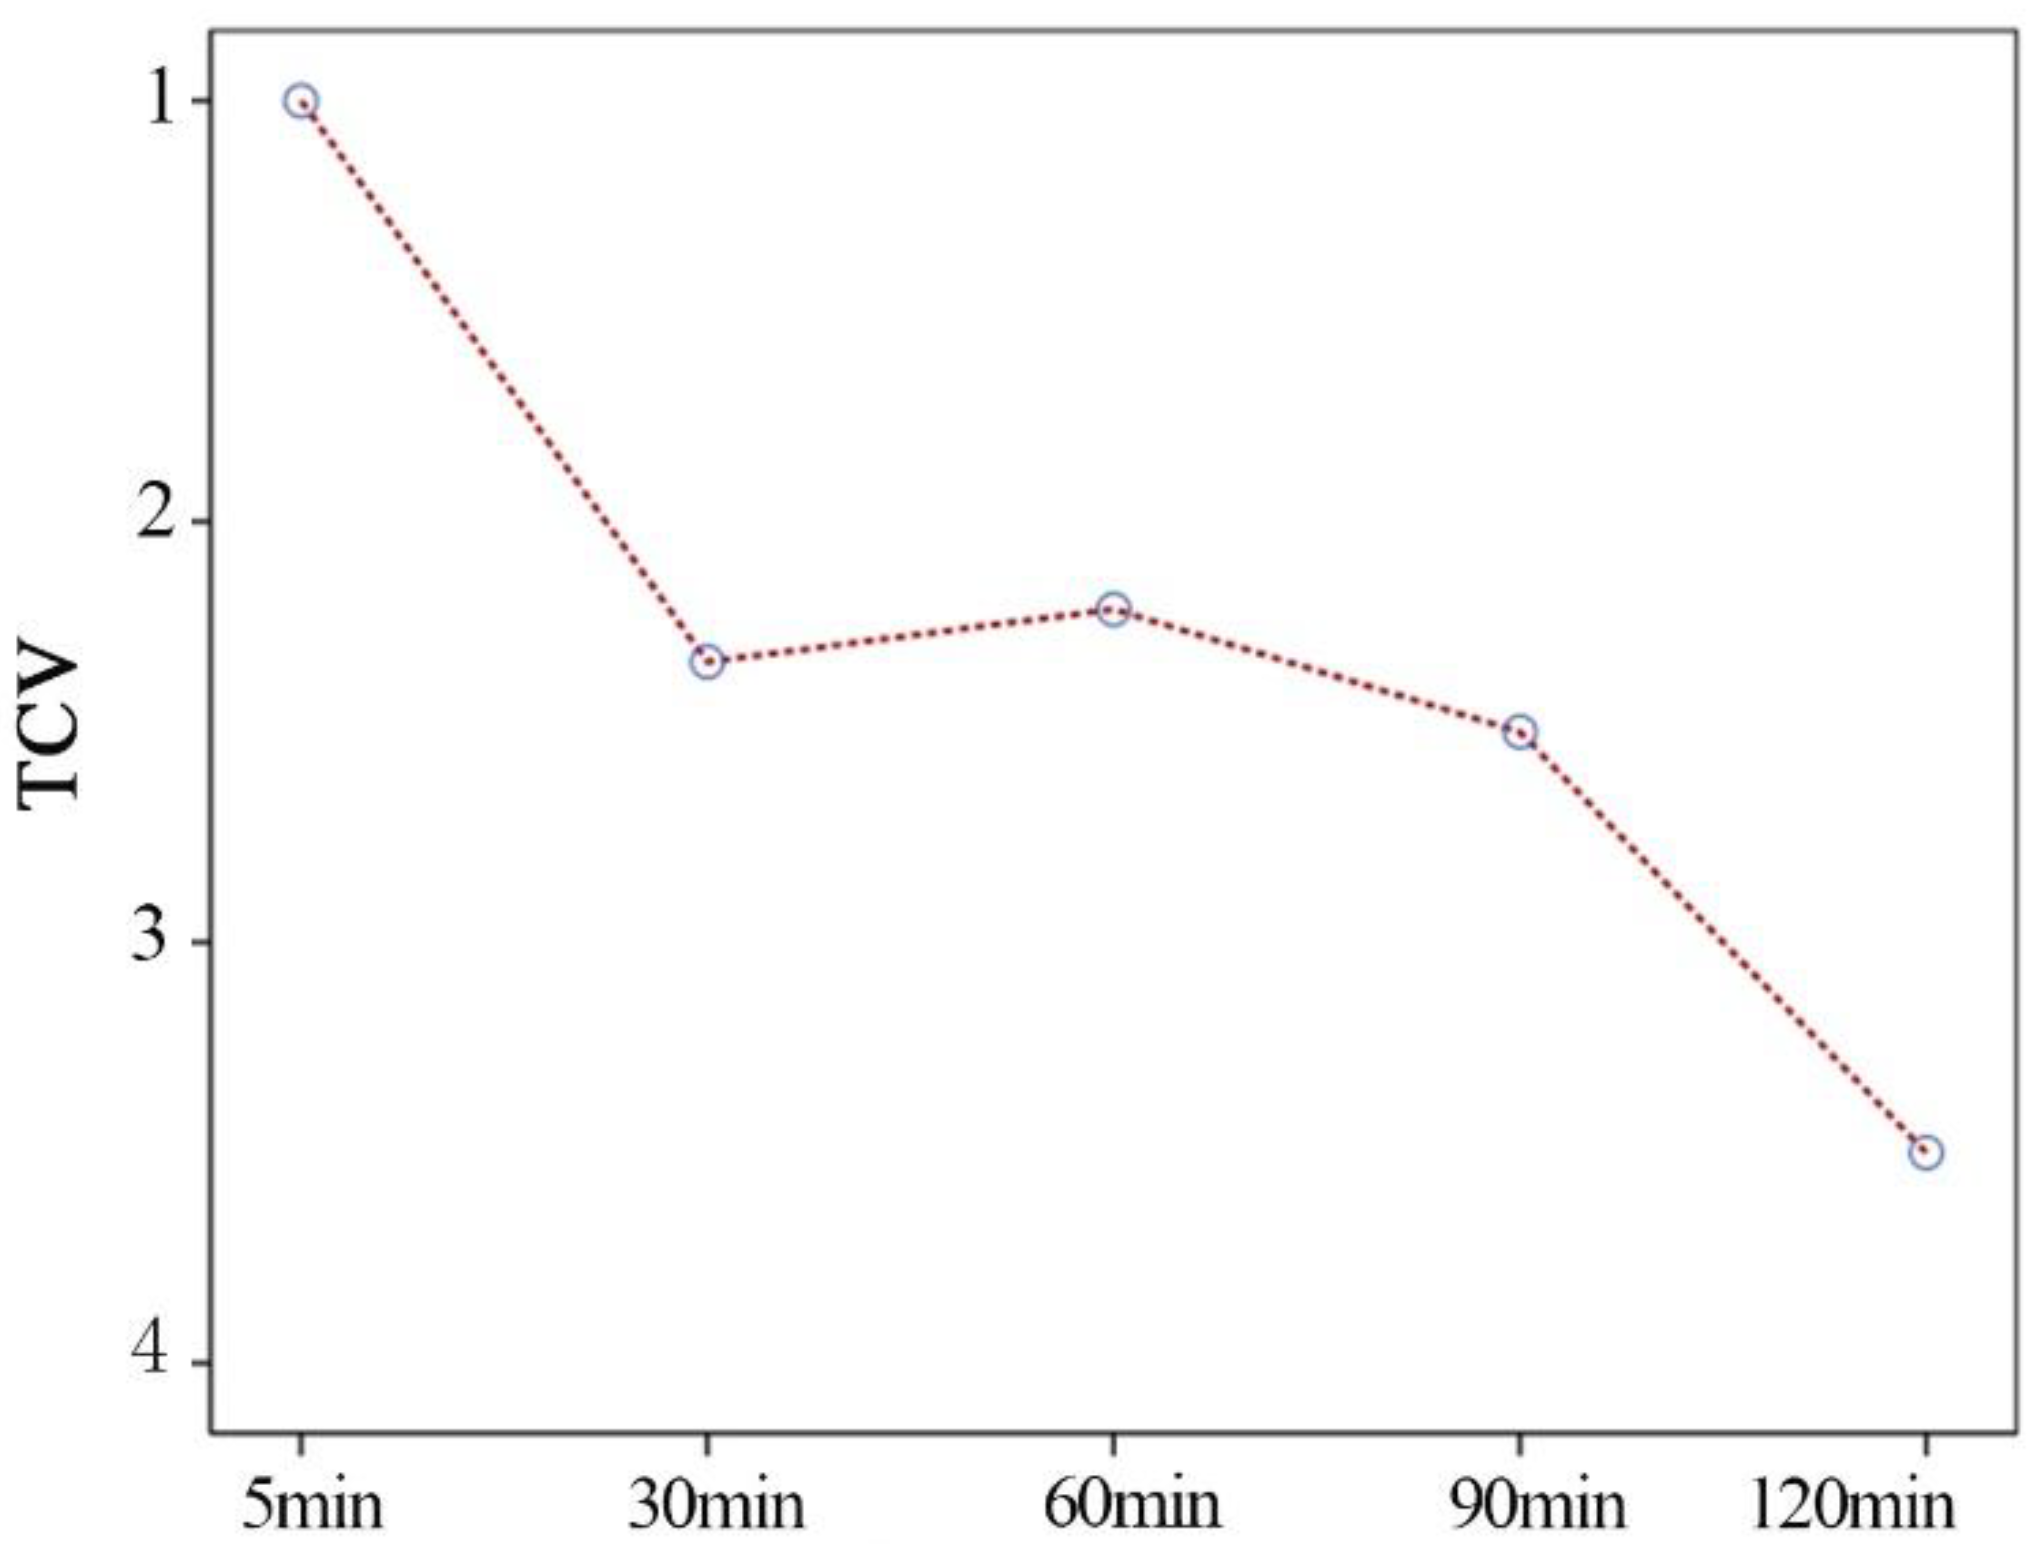
3.5. Correlation between Outdoor Activity Time and Thermal Comfort

As illustrated in Figure 11, the correlation between the duration of outdoor activity and thermal comfort in winter was analyzed. It can be seen that the general correlation is negative, and the thermal comfort of people who are active outdoors in winter decreases with the increase in residence time, but the linear pattern is not completely consistent. In the first 30 min, people came from the warm indoors to the cold outdoors, and there was a temporal adaptation process. The heat balance of the human body at the beginning of the outdoor exercise did not reach a stable state. In 30–60 min, human thermal comfort had a small rebound because the core temperature of the human body tended to stabilize after exercising for a period of time. The body’s thermal sensation also stabilized accordingly. Subjects felt warmer, thermal comfort improved and more adaptive behaviors could be accomplished in a longer period of time than in a shorter period of time. However, after that, with the increase in exercise over time, the human metabolism accelerated, and heat loss gradually increased such that thermal comfort decreased accordingly.

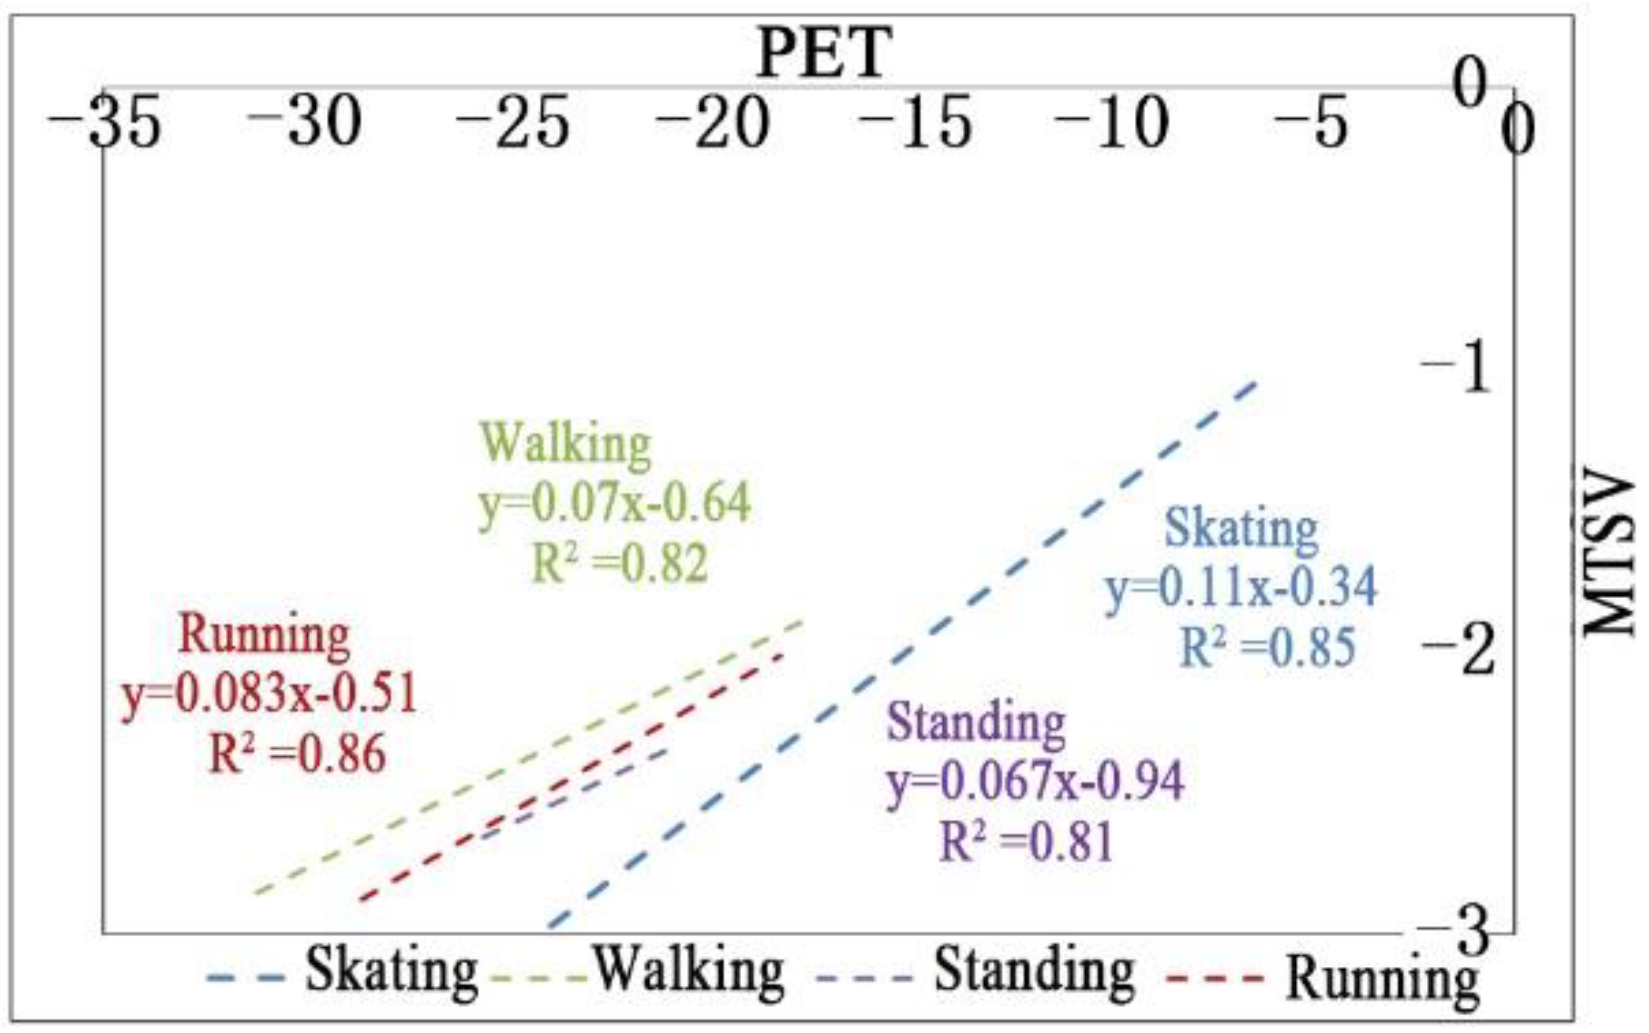
3.6. Thermal Sensory and Microclimate Factor Models of Different Exercise Modes

There are differences in the human thermal sensation of different exercise modes (metabolic rate). Yongzhao Zhai et al. [42] found that subjects had different thermal expectations of the environment when they were at different activity intensities. When the metabolic rate was 4, they preferred a slightly warmer environment, and when the metabolic rate was 6, a warmer environment was preferred. Therefore, there are differences in the acceptable temperature range for the human body. Tingquan Zheng [43] of Chongqing University studied the influence of people’s activity level on thermal sensation in neutral and cool temperature environments by means of actual measurements and questionnaires through mathematical statistics and physiological analysis. The results showed that the higher the ambient temperature, the lower the influence of the activity level on the thermal sensation of the human body.
Therefore, it is necessary to conduct a quantitative analysis of the thermal sensation and microclimate factor for different exercise modes. The multiple linear regression analysis was conducted with the mean thermal sensation vote as the dependent variable and the measured physical parameters as the independent variable. The regression equation not only quantifies the effect of microclimate factors on thermal sensation but also predicts the average outdoor thermal sensation of the population under a certain exercise mode from meteorological data. The multiple linear regression model for the mean thermal sensation under different exercise modes in winter is as follows:
Running: MTSV = −1.124 + 0.044Ta − 0.072Va + 0.001G, R2 = 0.38, p < 0.01
Skating: MTSV = −1.247 + 0.063Ta − 0.087Va + 0.001G, R2 = 0.61, p < 0.01
Walking: MTSV = −1.435 + 0.077Ta − 0.075Va + 0.001G, R2 = 0.47, p < 0.01
Standing: MTSV = −1.672 + 0.085Ta − 0.042Va + 0.001G, R2 = 0.64, p < 0.01
In the formula,
MTSV—mean thermal sensation vote;
Ta—air temperature (°C);
Va—air velocity (m/s);
G—solar radiation (W/m2).
The p values for all regression models were <0.01, indicating statistical significance. Furthermore, the model fitting degree was high for standing and skating (R2) and relatively low for walking and running (R2). This is due to the fact that when the subjects are engaging in the latter two exercises, individual activity intensity varies greatly, and the difference in metabolism is great, which lead to a great disparity in thermal sensation. The metabolism of running, skating, walking and standing decreased in turn. The sensitivity of the regression model from the four exercise modes revealed that, as metabolism decreased, the more sensitive it was to temperature and the less sensitive it was to wind speed.

4. Discussion

In this study, a questionnaire survey on thermal comfort was conducted with the measured data. The main objective is to understand the thermal comfort of the outdoor activities of university students in severe cold regions, including the thermal sensation, the thermal adaption and the quantitative relationship between thermal sensation and microclimate factors. The study found that the student population has developed some adaptations from living in cold climates for a long time, and more than half of the population could accept outdoor thermal comfort when conducting outdoor activities; the neutral outdoor temperature of the university population in cold regions was low; the level of thermal comfort of the population that is experienced in cold regions was higher than that of the population that is experienced in warm regions in cold outdoor environments; the lower the outdoor activity level in winter, the more sensitive it is to temperature and the less sensitive it is to wind speed.
In a study of human thermal comfort in pedestrian streets in cold regions, Jin H [44] found that more than 80% of the population can accept the outdoor thermal comfort in winter. Additionally, he found that men have a higher level of thermal comfort than women in the same environment, and the longer they live in Harbin, the higher the level of thermal comfort that they can accept. The latter two points are consistent with the results of this study. However, its thermal comfort acceptable percentage is higher than that in this study. This is mainly due to pedestrians frequently moving in and out of indoor shopping malls and staying outside for a longer period of time and their pleasant mood of shopping, which lead to a higher level of thermal comfort [45]. Chen Xin [46] conducted a statistical study on the satisfaction with the thermal comfort of outdoor people in Harbin. The percentage of people who were “slightly uncomfortable” or more was 48%, and in this study, it slightly increased to 55%. On the one hand, this is because the proportion of male students in this study is slightly higher; on the other hand, the proportion of people under the exercise mode among the respondents is higher, and the high activity level improves their thermal perception.
Regarding the thermal adaptation of different thermal experiences, Jiao Xue [47] conducted a field survey from May to October 2019 on a university campus in Shanghai, China (a hot summer and cold winter region). He found that the overall comfort level of long-term residents is higher, and respondents from hot summer and cold winter climate zones are less affected by changes in UTCI than respondents from severe cold and cold climate zones. Similar to the results of this study, when only the climatic context is different, hot summer locals are more adaptable to the climate with higher thermal comfort levels.
T. Xi [48] analyzed the thermal adaptation mode of visitors from different origins in the same environment. When the PET < −7 °C, the comfort experience of out-of-town visitors is better than that of local visitors. Compared with the results of this study, the thermal comfort level of local people engaging in outdoor exercises is higher than that of other people with experience in warm areas. The fact that the out-of-town population traveled in Harbin could be considered as a short-term thermal experience. Due to the long experience of living in hot areas, there is a certain novelty about the cold climate combined with the pleasure of the travelers, which increases the level of acceptance. The population studied in this study has lived in cold areas for six months and has been adapted to these areas to some degree, combined with life experience in the places of origin, leading to a reduction in thermal comfort due to the precognition of cold weather.
As for research on PET and MTSV, Chen Xin [46] found that the thermal sensation in Harbin is less sensitive to PET changes than that in other regions. Thermal sensation was “neutral” for a PET between 10 and 25 °C. T. Xi and others [49] found that the thermal sensation was “neutral” for temperatures between 14.3 and 31 °C, with a neutral temperature of 13.2 °C in winter, which was lower than the neutral temperature in other climatic zones and had a wider range of variation. Comparing the results of this study with the literature above, the thermal sensation is more sensitive to PET under all exercise modes in the same Harbin area, and the neutral temperature is lower. The main reason for this is the low age structure of the student population and the high proportion of females, who are therefore more sensitive to cold temperatures [12]; the low neutral temperature is mainly due to the fact that the higher the activity level, the stronger the metabolism, leading to a higher thermal sensation. Henriques [50] demonstrated that, at the same environmental parameters, the higher the intensity of exercise, the lower the temperature at which the thermal comfort state is reached. It is consistent with the results of this study.
Nikolopoulou and Lykoudis [51] used statistical methods to establish meteorological function equations for different uses of functional spaces outdoors in Athens. It can be seen that different human behavioral modes have different microclimate criteria for functional spaces. Jin, H [52] found that there are significant differences in thermal comfort among people engaged in different forms of exercise in severe cold regions and that the acceptable thermal range for the exercise population is greater than that of the resting population. In addition, he corrected the UTCI thermal perception temperature interval. While the results of his study are consistent with those of this study, the difference is that this study proposes a thermal perception prediction model under different exercise modes based on his study. Lu Ming [53] conducted a quantitative analysis of human thermal sensation and meteorological parameters for different activity types of the active population in Harbin Park. The sensitivity of the average human thermal sensation to temperature and wind speed was lower than that of this study because the study subjects were mostly elderly people.

5. Conclusions

This study combines measured data with subjective questionnaires to analyze human thermal comfort based on multiple outdoor exercise modes and to develop regression models of thermal sensation and microclimate factors for different exercise modes. The relevant findings are as follows.
(1) From the results of the survey, it can be seen that 20% of the respondents felt comfortable, and 35% felt slightly more comfortable. This shows that, although it is cold in winter, the level of comfort is acceptable for more than half of the people when engaging in outdoor activities. The number of men is slightly more than that of women in the samples that felt comfortable.
(2) The higher the level of outdoor activity, the higher the comfort level. However, skating is concentrated in a specific period of time, and the temperature of the black ball on the ice cushion surface is higher than that in other circumstances, which enhances a certain level of human comfort.
(3) The PET and MTSV correlation analysis shows that, for each increase in PET for the four exercise modes (skating 9 °C, running 12 °C, walking 14 °C and standing 15 °C), the heat sensation rises by one level. Human thermal sensory sensitivity is positively correlated with the amount of metabolism of human exercise.
(4) There are differences in the comfort levels of people who participate in outdoor activities in winter in severe cold regions due to physiological acclimatization. The analysis shows that people with experience in cold regions have higher comfort levels in outdoor activities than those with experience in warm regions.
(5) The correlation analysis between outdoor activity time and thermal comfort TCV shows that the comfort TCV drops sharply in the first 30 min, with a small rebound between 30 and 60 min, after which the comfort gradually decreases at an accelerated rate.
(6) A regression equation is established with the thermal sensory vote as the dependent variable and meteorological parameters as the independent variables. As metabolism decreases with outdoor exercise modes, the more sensitive the body is to temperature, the less sensitive it is to wind speed.
Regarding the university population in severe cold regions, this study first proposes the PET neutral temperature under different exercise modes and the corresponding thermal perception prediction model and determines the variability of outdoor thermal comfort among people of different places of origin. However, there are still some limitations in this study. For instance, the study fails to consider the effect of the difference in the population’s living habits on thermal comfort and fails to include the monitoring and analysis of the physiological parameters of the respondents under exercise modes, which will be analyzed more comprehensively in future studies. Another limitation is that this study focuses on the thermal comfort of the respondents, which is not associated with the space form of the campus. In future studies, we will propose corresponding optimization strategies to improve the human thermal comfort under different exercise modes.

Author Contributions

L.Q. designed and wrote the manuscript draft and read, corrected and approved the final manuscript. X.Y. provided facilities and technical support and evaluated the results and the discussion of these results. All authors have read and agreed to the published version of the manuscript.

Funding

This work was financially supported by the National Natural Science Foundation of China (Grant Number: 51438005).

Institutional Review Board Statement

Not applicable.

Informed Consent Statement

Not applicable.

Data Availability Statement

Not applicable.

Conflicts of Interest

The authors declare no conflict of interest.

References

  1. Keller, M.C.; Fredrickson, B.; Ybarra, O.; Cté, S.; Johnson, K.; Mikels, J.; Conway, A.; Wager, T. A Warm Heart and a Clear Head: The Effects of Weather on Human Mood and Cognition. Soc. Sci. Electron. Publ. 2005, 16, 724–731. [Google Scholar]
  2. Scott, D.; Freitas, C.D.; Matzarakis, A. Adaptation in the Tourism and Recreation Sector. In Biometeorology for Adaptation to Climate Variability and Change; Springer: Dordrecht, The Netherlands, 2009; pp. 171–194. [Google Scholar]
  3. Fang, Z.; Xu, X.; Zhou, X.; Deng, S.; Wu, H.; Liu, J.; Lin, Z. Investigation into the thermal comfort of university students conducting outdoor training. Build. Environ. 2018, 149, 26–38. [Google Scholar] [CrossRef]
  4. Elnabawi, M.H.; Hamza, N.; Dudek, S. Thermal perception of outdoor urban spaces in the hot arid region of Cairo, Egypt. Sustain. Cities Soc. 2016, 22, 136–145. [Google Scholar] [CrossRef]
  5. Höppe, P. The physiological equivalent temperature–A universal index for the biometeorological assessment of the thermal environment. Int. J. Biometeorol. 1999, 43, 71–75. [Google Scholar] [CrossRef]
  6. Cheng, V.; Ng, E.; Chan, C.; Givoni, B. Outdoor Thermal Comfort Study in a Sub-Tropical Climate: A Longitudinal Study Based in Hong Kong. Int. J. Biometeorol. 2012, 56, 43–56. [Google Scholar] [CrossRef]
  7. Thorsson, S.; Honjo, T.; Lindberg, F.; Eliasson, I.; Lim, E.-M. Thermal Comfort and Outdoor Activity in Japanese Urban Public Places. Environ. Behav. 2007, 39, 660–684. [Google Scholar] [CrossRef]
  8. Lin, T.-P. Thermal perception, adaptation and attendance in a public square in hot and humid regions. Build. Environ. 2009, 44, 2017–2026. [Google Scholar] [CrossRef]
  9. Mayer, H.; Holst, J.; Dostal, P.; Imbery, F.; Schindler, D. Human Thermal Comfort in Summer within an Urban Street Canyon in Central Europe. Meteorol. Z. 2008, 17, 241–250. [Google Scholar] [CrossRef]
  10. Niu, J.; Liu, J.; Lee, T.-C.; Lin, Z.J.; Mak, C.; Tse, K.-T.; Tang, B.-S.; Kwok, K.C. A new method to assess spatial variations of outdoor thermal comfort: Onsite monitoring results and implications for precinct planning. Build. Environ. 2015, 91, 263–270. [Google Scholar] [CrossRef] [Green Version]
  11. Yang, B.; Olofsson, T.; Nair, G.; Kabanshi, A. Outdoor thermal comfort under subarctic climate of north Sweden—A pilot study in Umeå. Sustain. Cities Soc. 2017, 28, 387–397. [Google Scholar] [CrossRef]
  12. Amindeldar, S.; Heidari, S.; Khalili, M. The effect of personal and microclimatic variables on outdoor thermal comfort: A field study in Tehran in cold season. Sustain. Cities Soc. 2017, 32, 153–159. [Google Scholar] [CrossRef]
  13. Pantavou, K.; Lykoudis, S.; Nikolopoulou, M.; Tsiros, I.X. Thermal sensation and climate: A comparison of UTCI and PET thresholds in different climates. Int. J. Biometeorol. 2018, 62, 1695–1708. [Google Scholar] [CrossRef] [PubMed]
  14. Jin, H.; Wang, B.; Qiao, L. Studies of Elderly Thermal Comfort in Outdoor Environments in Severe Cold Area of China. In Proceedings of the International Conference on Sustainability in Energy and Buildings, Budapest, Hungary, 4–5 July 2019. [Google Scholar]
  15. Potchter, O.; Cohen, P.; Lin, T.-P.; Matzarakis, A. Outdoor Human Thermal Perception in Various Climates: A Comprehensive Review of Approaches, Methods and Quantification. Sci. Total Environ. 2018, 631–632, 390–406. [Google Scholar] [CrossRef] [PubMed]
  16. Spagnolo, J.; Dear, R.D. A Field Study of Thermal Comfort in Outdoor and Semi-Outdoor Environments in Subtropical Sydney Australia. Build. Environ. 2003, 38, 721–738. [Google Scholar] [CrossRef] [Green Version]
  17. Liaison, S.; Cooper, K.W.; Turner, S.C.; Paliaga, G.; Lynch, B.M.; Arens, E.A.; Aynsley, R.M.; Brager, G.S.; Deringer, J.J.; Ferguson, J.M. ANSI/ASHRAE 55:2010 Thermal Environmental Conditions for Human Occupancy. Build. Environ. 2010, 204, 108226. [Google Scholar]
  18. Henane, R.; Buguet, A.; Bittel, J.; Roussel, B. Thermal Rhythms and Sleep in Man. Approach to Thermal Comfort during Sleep. In Thermal Comfort/Confort Thermique; Les Editions de l’INSERM: Paris, France, 1977; pp. 195–234. [Google Scholar]
  19. Fanger, P.O. Thermal Comfort Analysis and Applications in Environment Engeering. In Thermal Comfort. Analysis and Applications in Environmental Engineering; Danish Technical Press: Copenhagen, Denmark, 1970. [Google Scholar]
  20. Eisler, A.D.; Eisler, H.; Yoshida, M. Perception of human ecology: Cross-cultural and gender comparisons. J. Environ. Psychol. 2003, 23, 89–101. [Google Scholar] [CrossRef]
  21. Aljawabra, F.; Nikolopoulou, M. Influence of Hot Arid Climate on the Use of Outdoor Urban Spaces and Thermal Comfort: Do Cultural and Social Backgrounds Matter? Intell. Build. Int. 2010, 2, 198–217. [Google Scholar]
  22. Katzschner, L. Open Space Design Strategies Based on Thermal Comfort Analysis. Proc. Plea 2004, 1, 47–52. [Google Scholar]
  23. Nikolopoulou, M.; Lykoudis, S. Thermal Comfort in Outdoor Urban Spaces: Analysis across Different European Countries. Build. Environ. 2006, 41, 1455–1470. [Google Scholar] [CrossRef] [Green Version]
  24. Cheng, V.; Ng, E.Y.Y. Thermal Comfort in Urban Open Spaces for Hong Kong. Arch. Sci. Rev. 2006, 49, 236–242. [Google Scholar] [CrossRef]
  25. Lai, D.; Guo, D.; Hou, Y.; Lin, C.; Chen, Q. Studies of Outdoor Thermal Comfort in Northern China. Build. Environ. 2014, 77, 110–118. [Google Scholar] [CrossRef]
  26. Hwang, R.L.; Lin, T.P.; Matzarakis, A. Seasonal Effect of Urban Street Shading on Long-Term Outdoor Thermal Comfort. Build. Environ. 2011, 46, 863–870. [Google Scholar] [CrossRef]
  27. Wang, Z.; Hou, J.; Kang, C.; Ning, H. Thermal Comfort with Floor Heating. Lect. Notes Electr. Eng. 2014, 261, 247–253. [Google Scholar]
  28. Knez, I.; Thorsson, S. Influences of Culture and Environmental Attitude on Thermal, Emotional and Perceptual Evaluations of a Public Square. Int. J. Biometeorol. 2006, 50, 258. [Google Scholar] [CrossRef] [PubMed]
  29. Golany, G.S. Urban Design Morphology and Thermal Performance. Atmos. Environ. 1996, 30, 455–465. [Google Scholar] [CrossRef]
  30. Zhao, L.; Zhou, X.; Li, L.; He, S.; Chen, R. Study on Outdoor Thermal Comfort on a Campus in a Subtropical Urban Area in Summer. Sustain. Cities Soc. 2016, 22, 164–170. [Google Scholar] [CrossRef]
  31. Khalili, S.; Fayaz, R.; Zolfaghari, S.A. Analyzing Outdoor Thermal Comfort Conditions in a University Campus in Hot-Arid Climate: A Case Study in Birjand, Iran. Urban Clim. 2022, 43, 101128. [Google Scholar] [CrossRef]
  32. Ghaffarianhoseini, A.; Berardi, U.; Ghaffarianhoseini, A.; Al-Obaidi, K. Analyzing the thermal comfort conditions of outdoor spaces in a university campus in Kuala Lumpur, Malaysia. Sci. Total. Environ. 2019, 666, 1327–1345. [Google Scholar] [CrossRef] [Green Version]
  33. Nastos, P.T.; Matzarakis, A. Human Bioclimatic Conditions, Trends, and Variability in the Athens University Campus, Greece. Adv. Meteorol. 2013, 2013, 976510. [Google Scholar] [CrossRef] [Green Version]
  34. Huang, Z.; Cheng, B.; Gou, Z.; Zhang, F. Outdoor Thermal Comfort and Adaptive Behaviors in a University Campus in China’s Hot Summer-Cold Winter Climate Region. Build. Environ. 2019, 165, 106414. [Google Scholar] [CrossRef]
  35. Makvandi, M.; Zhou, X.; Li, C.; Deng, Q. A Field Investigation on Adaptive Thermal Comfort in an Urban Environment Considering Individuals’ Psychological and Physiological Behaviors in a Cold-Winter of Wuhan. Sustainability 2021, 13, 678. [Google Scholar] [CrossRef]
  36. He, X.; An, L.; Hong, B.; Huang, B.; Cui, X. Cross-Cultural Differences in Thermal Comfort in Campus Open Spaces: A Longitudinal Field Survey in China’s Cold Region. Build. Environ. 2020, 172, 106739. [Google Scholar] [CrossRef]
  37. Chen, S.; Cui, P.; Mei, H. A Sustainable Design Strategy Based on Building Morphology to Improve the Microclimate of University Campuses in Cold Regions of China Using an Optimization Algorithm. Math. Probl. Eng. 2021, 2021, 2304796. [Google Scholar] [CrossRef]
  38. Yin, Q.; Cao, Y.; Sun, C. Research on Outdoor Thermal Comfort of High-Density Urban Center in Severe Cold Area. Build. Environ. 2021, 200, 107938. [Google Scholar] [CrossRef]
  39. Turner, S.C.; Arens, E.A.; Aynsley, R.M.; Brager, G.S.; Deringer, J.J.; Ferguson, J.M.; Filler, J.M.; Hogeling, J.J.; Inthout, D.; Kwok, A.G. ASHRAE STANDARD Thermal Environmental Conditions for Human Occupancy; ASHRAE: Peachtree Corners, GA, USA, 2010. [Google Scholar]
  40. ISO-7726; Thermal Environments—Instruments and Methods for Measuring Physical Quantities. ISO: Geneva, Switzerland, 1985.
  41. Nikolopoulou, M.; Baker, N.; Steemers, K. Thermal Comfort in Outdoor Urban Spaces: Understanding the Human Parameter. Sol. Energy 2001, 70, 227–235. [Google Scholar] [CrossRef]
  42. Zhai, Y.; Elsworth, C.; Arens, E.; Zhang, H.; Zhang, Y.; Zhao, L. Using Air Movement for Comfort during Moderate Exercise. Build. Environ. 2015, 94, 344–352. [Google Scholar] [CrossRef] [Green Version]
  43. Zheng, T. The Influence of Activity Level on Human Thermal Sensation. Ph.D. Thesis, Chongqing University, Chongqing, China, 2014. [Google Scholar]
  44. Jin, H.; Liu, S.; Kang, J. Thermal Comfort Range and Influence Factor of Urban Pedestrian Streets in Severe Cold Regions. Energy Build. 2019, 198, 197–206. [Google Scholar] [CrossRef]
  45. Zhang, T.; Su, M.; Hong, B.; Wang, C.; Li, K. Interaction of Emotional Regulation and Outdoor Thermal Perception: A Pilot Study in a Cold Region of China. Build. Environ. 2021, 198. [Google Scholar] [CrossRef]
  46. Chen, X.; Xue, P.; Liu, L.; Gao, L.; Liu, J. Outdoor Thermal Comfort and Adaptation in Severe Cold Area: A Longitudinal Survey in Harbin, China. Build. Environ. 2018, 143, 548–560. [Google Scholar] [CrossRef]
  47. Xue, J.; Hu, X.; Sani, S.N.; Wu, Y.; Li, X.; Chai, L.; Lai, D. Outdoor Thermal Comfort at a University Campus: Studies from Personal and Long-Term Thermal History Perspectives. Sustainability 2020, 12, 9284. [Google Scholar] [CrossRef]
  48. Xi, T.; Wang, S.; Wang, Q.; Lv, X. College Students’ Subjective Response to Outdoor Thermal Environment in a Severely Cold Climate City. In Proceedings of the Xiamen-Custipen Workshop on the Equation of State of Dense Neutron-Rich Matter in the Era of Gravitational Wave Astronomy, Xiamen, China, 3–7 January 2019. [Google Scholar]
  49. Lei, Y. Multi Dimensional Evaluation of Outdoor Thermal Comfort in Severe Cold City. Ph.D. Thesis, Harbin Institute of Technology, Harbin, China, 2019. [Google Scholar]
  50. Henriques, I.; Mady, C.; de Oliveira, S. Assessment of Thermal Comfort Conditions during Physical Exercise by Means of Exergy Analysis. Energy 2017, 128, 609–617. [Google Scholar] [CrossRef]
  51. Nikolopoulou, M.; Lykoudis, S. Use of Outdoor Spaces and Microclimate in a Mediterranean Urban Area. Build. Environ. 2007, 42, 3691–3707. [Google Scholar] [CrossRef] [Green Version]
  52. Lin, Y.; Jin, Y.; Jin, H. Effects of Different Exercise Types on Outdoor Thermal Comfort in a Severe Cold City. J. Therm. Biol. 2022, 109, 103330. [Google Scholar] [CrossRef] [PubMed]
  53. Wei, Y. Research of Thermal Comfort of Microclimate on Harbin Urban Park Based on Behavior Activity. Ph.D. Thesis, Harbin Institute of Technology, Harbin, China, 2015. [Google Scholar]
Figure 1. Arrangement of each measurement site and the surrounding environment.
Sustainability 14 15796 g001
Figure 2. Daily mean, maximum and minimum temperatures (Ta) and number of days with Ta ≤ −15 °C in the Harbin area (1988–2010 meteorological data).
Sustainability 14 15796 g002
Figure 3. Proportion of respondents’ exercise mode and thermal comfort indicators.
Sustainability 14 15796 g003
Figure 4. Relationship of TCV between different genders.
Sustainability 14 15796 g004
Figure 5. TCV distribution under different exercise modes.
Sustainability 14 15796 g005
Figure 6. Temperature comparison of the black globe in the skating rink and other sites.
Sustainability 14 15796 g006
Figure 7. Correlation between PET and MTSV under skating and running exercise modes. (a) Skating, (b) running.
Sustainability 14 15796 g007
Figure 8. Correlation between PET and MTSV in walking and standing states. (a) Walking, (b) standing.
Sustainability 14 15796 g008
Figure 9. Comparison of the correlations between PET and MTSV under the four exercise modes.
Sustainability 14 15796 g009
Figure 10. Box plot of the thermal comfort levels of respondents in different climate zones.
Sustainability 14 15796 g010
Figure 11. Relationship between Outdoor activity time and TCV.
Sustainability 14 15796 g011
Table 1. Average, maximum and minimum values of the actual measured physical parameters at each measurement site.
Ta (°C)RH (%)Va (m/s)Tg (°C)G (w/m2)
WinterAverage Value−17.0253.781.03−15.86555.1
Maximum Value−11.3365.903.02−5.85276.3
Minimum Value−21.3838.230.12−21.690
Table 2. Instrument technical parameter table.
Name and ModelMeasuring RangeAccuracySampling Period
BES-01 temperature data collection and record instrumentTemperature: −30–50 °C±0.5 °C10 s to 24 h
BES-02 humiture collection and record instrumentTemperature: −30–50 °C
Relative humidity: 0–99%
±0.5 °C
±3%
10 s to 24 h
YK-2005AH handheld small hot wire anemometerWind speed: 0. 4–40 m/s
Temperature: −29–+70 °C
±0.1 m/s
±1.0 °C
2 s to 12 h
SM206 solar radiation tester0.1~1999.9 w/m2±10 w/m22.5 n/s
Table 3. Basic information of the research subjects.
Basic Information Situation (Please Tick or Fill in the Appropriate Item)
Date Time Measuring Site
Sex□ Male
□ Female
Age Original residence
Height□ 155~160 cm □ 161~170 cm □ 171~180 cm □ ≥181 cm
Weight□ <45 kg □ 46~60 kg □ 61~70 kg □ ≥71 kg
Behavioral pattern□ Sitting □ Standing □ Walking □ Running
Outdoor time slot8:00–9:00 □ 9:00–10:00 □ 10:00–11:00 □
11:00–12:00 □ 12:00–13:00 □ 13:00–14:00 □
14:00–15:00 □ 15:00–16:00 □ 16:00–17:00 □
17:00–18:00 □ 18:00–19:00 □
Outdoor dwelling time□ ≤5 min □ 5~30 min □ 30 min~1 h
□ 1 h~2 h □ 2~3 h □ ≥3 h
Top □ Coat (thin/thick) □ T-shirt □ Shirt □ Thermal clothing
□ Dress □ Sweater □ Thin coat □ Thick coat
□ Down jacket □ Cotton jacket □ Thin down vest □ Thick down vest
Bottoms□ Shorts/Skirts □ Trousers/Skirts □ Warm trousers □ Long Johns □ Cotton trousers
Shoes□ Sandals □ Sports shoes □ Leather shoes □ Cotton shoes □ Cloth shoes
HatYes □ No □
Table 4. Thermal perception and thermal comfort of the survey respondents.
1. Your current level of thermal comfort rating (TCV)
12345
ComfortableSlightly uncomfortableUncomfortableVery uncomfortableIntolerable
2. Your current thermal sensation rating (TSV)
−3−2−10123
Very coldColdSlightly coldModerateSlightly warmWarmHot
3. Evaluation of environmental parameters
Scale−3−2−10123
TemperatureVery lowLowSlightly lowModerateSlightly highHighVery high
Wind speedVery lowLowSlightly lowModerateSlightly highHighVery high
HumidityVery humidHumidSlightly humidModerateSlightly dryDryVery dry
SunlightVery weakWeakSlightly weakModerateSlightly strongStrongVery strong
Table 5. PET neutral temperature in different motion states.
Motion StateSkatingRunningWalkingStanding
PET neutral temperature3 °C6 °C9 °C14 °C
Publisher’s Note: MDPI stays neutral with regard to jurisdictional claims in published maps and institutional affiliations.

