1. Introduction
With relentlessly increasing demands for natural resources, conflicts between human civilization and the natural environment are becoming increasingly intense [
1]. The resource-carrying capacity of the environment is beyond the limits of affordability; thus, investigations into the ecological carrying capacities of different regions have attracted the attention of many ecologists, geographers, and economists [
2]. This is particularly the case since the central government began to promote the development of ecosystems, wherein the evaluation of their carrying capacities has transitioned from the research to the practical implementation level. It is critical to establish monitoring and early warning mechanisms that are sensitive to the carrying capacity of ecosystems while implementing restrictive measures on overloaded areas. Through the supervision and evaluation of the overload status of the natural resources of a given region, the diagnosis and prediction of sustainable development lay the foundation for the development of differentiated and operable restrictive measures, which are the basis of regional spatial and overall functional area planning.
Ecological carrying capacities are the most fundamental and critical content for the study of those resource environments, where the status of ecological carrying capacities directly determines the development and changes in regional resource environment carrying capacities [
3,
4]. Filgueira et al. [
5] regard ecological carrying capacities as the self-sustainability of environmental resources supporting external socioeconomic pressures. For the arid regions of Northwest China, the application of the ecological carrying capacity concept translates to ensuring sustainable social and economic development while regulating the rational exploitation and utilization of resources toward the establishment of a virtuous cycle of ecological management [
6].
From the standpoint of research, scholars from different disciplines have conducted in-depth investigations into ecological carrying capacities via state space [
7], comprehensive evaluation [
8], ecological footprint [
9], socioecological index system [
10], and other methods [
11]. Li et al. [
12] selected 16 indexes from the three dimensions of ecological function elasticity, resource and environment capacity, and socioeconomic coordination to conduct a quantitative evaluation of the ecological carrying capacity of Beijing using the state space method. Jian Peng et al. [
13] evaluated the regional ecological carrying capacity of Dali in Yunnan Province from the perspectives of ecological pressure and elasticity based on a comprehensive evaluation of the carrying capacity model. Further, Xie et al. [
14] analyzed the dynamic changes and driving factors of the ecological footprint in the Yellow River Delta. These experts evaluated and analyzed ecological carrying capacities using different research domains [
15,
16]. Although this research improves our understanding of regional ecological carrying capacities, several issues remain. For the evaluation of ecological carrying capacities, the statistical spatial interpolation method has been extensively employed to evaluate the impacts of anthropogenic activities on ecosystems. However, in the study of the arid areas of Northwest China, which include sparsely populated areas, the spatial interpolation method does not accurately reflect anthropogenic interference with the ecological environment.
The index system evaluation method is a method to describe the status of ecological carrying capacity by establishing a series of index systems and evaluating them. The index system of evaluation method for the evaluation of ecological carrying capacity should first be chosen to represent the main characteristics of the ecological carrying capacity index, including social economy, the land use index; second, the analysis of each index, the bearing capacity of ecological instruction meaning, then, to measure these characteristics factor, determine the weight coefficient of each characteristic factor in the ecological carrying capacity. Finally, the evaluation system of ecological carrying capacity is established to evaluate the ecological carrying capacity. Consequently, for the development of an index system, this study took the objectivity of the index into full consideration and selected nighttime light data as an index for the evaluation of human social pressures [
16]. Nighttime light data have the following advantages in the evaluation of human activities [
17]. Firstly, nighttime light data are suitable for the monitoring of human activities over a large area. Secondly, the nighttime light data are not affected by clouds and fog; thus, they have strong objectivity. Thirdly, nighttime light data can reflect population [
18] and economic densities [
19], the urbanization level [
20], roads, and other information [
21], which are highly comprehensive [
22].
Ecological security pattern is theoretically supported by landscape ecology [
23], which essentially refers to a potential spatial pattern of ecosystems in the landscape [
24]. At present, the construction method of ecological security patterns has become increasingly mature, and the research framework of “identifying source areas, constructing resistance surfaces, and extracting corridors” has become the basic mode of ecological security pattern construction [
25,
26]. The ecological source refers to the habitat patches with important significance or radiation function for regional ecological security, which is the basis for constructing ecological security patterns [
27]. As another core element in the construction of ecological security patterns, the resistance surface is generally obtained through the assignment of land classes. Because the direct assignment is too subjective, ignores the internal differences under the same land cover type, and disguises the influence of human activities on the ecological resistance coefficient, the revision of resistance surface has been focused on in recent years.
The arid regions of Northwest China typically have low ecological carrying capacities in China [
28]. Recently, with changing climatic conditions and multiple anthropogenic interventions, ecosystems in the arid areas of Northwest China have generally become degraded. These aspects include low vegetation coverage, high land degradation index, low biological abundance index, high resource pressure, unreasonable economic structure, and so on. Therefore, it is urgent to formulate reasonable ecological restoration policies to promote the restoration of the ecological environment. Although there have been a lot of studies on the construction of ecological security patterns in the study area, there are still the following problems: (1) The previous studies mainly focused on a single watershed without an integrated analysis of the whole study area, and the policies formulated were not comprehensive. (2) In the identification of ecological source areas, a single land use factor is often considered, resulting in the identification of ecological source areas that cannot form radiation function to the study area.
In 2000, the central government began to implement the “Western Development Policy”, which aims to use the surplus economic development capacity of the eastern coastal areas to raise the level of economic and social development in the western regions. After that, the economic development of the western region increased rapidly. This study takes the year 2000 as the background to analyze the ecological environment situation in the western region without large-scale economic development. In 2007, the central government adopted the “11th Five-Year Plan” for the Development of the Western Region, which further improved the economic development speed of the western region. The GDP growth rate of each province exceeded 10%, which further improved the economic development speed of the western region, but at the same time, exposed many ecological problems. In 2012, the central government put forward the environmental protection theory that “clear water and green mountains are gold and silver mountains”, and local governments began to pay attention to ecological environmental issues. In 2018, six years after the introduction of ecological and environmental policies, we analyzed the ecological and environmental conditions in the western region after the adjustment of ecological and environmental policies. This investigation selected four stages of changes in eco-environmental policies in the study area in 2000, 2007, 2012, and 2018 and selected 13 indexes, including topography, hydrology, soil, vegetation, population, and nighttime light data. Spatial principal component analysis [
23] and the coding method [
24] were employed to monitor and evaluate the ecological carrying capacities of the arid regions of Northwest China (
Figure 1). Thus, to analyze the spatiotemporal variations, those areas with high ecological carrying capacities were selected as ecologically advantaged areas, whereas intersects were chosen as ecological sources; thus, the final ecological resource areas were obtained through their combination with important water sources and forested lands. Based on the minimum cumulative resistance model [
24], the arid areas in Northwest China were segmented into sixteen ecological security pattern regions, from which three ecological corridors and three ecological nodes were extracted. Based on the variable trends of ecological carrying capacities in the study area, ecological security patterns were designed and optimized to provide suggestions and countermeasures for ecological protection and development.
2. Materials and Methods
2.1. Study Area
The arid areas of Northwest China [
29] are bounded by Helan Mountain in the East, and the Kunlun, Altun, and Qilian Mountains in the South, located between 73° E–107° E and 35° N–50° N (
Figure 2). The administrative region primarily includes the Xinjiang Province, the Hexi Corridor of Gansu Province, and the Western region of Inner Mongolia, which specifically includes 14 locations, prefectures, and cities in Xinjiang, Jiu Quan, Jiayuguan, Zhangye, Wuwei, Jinchang of Gansu Province, and the Alxa League of Inner Mongolia, with an area of 2.09 × 10
6 km
2 and altitudes ranging from −154 to 7311 m. The study area is located deeply inland and far away from the sea, with an annual average precipitation of ~<200 mm. The climate is dry, with desert accounting for 64.47% of the total area under a typical temperate continental climate. Furthermore, the terrain of the area is undulating and shallow, and the ecological environment is very fragile; thus, it is difficult to recover following damage.
2.2. Data Resources
The data used in this study included:
(1) Nighttime light data (2000, 2007, 2012, 2018): The National Oceanic and Atmospheric Administration National Geophysical Data Center (NOAA/NGDC) website (
http://www.ngdc.noaa, accessed on 10 September 2022), provides DMSP-OLS nighttime light datasets from 1992 to 2013 and NPP-VIIRS nighttime light data from 2012 to 2018. DMSP-OLS data eliminate the influence of clouds, fire, and other noise factors, with a gray value of 0–63 and a resolution of 1 km [
17]. For this study, DMSP-OLS data were processed to the Albers and other area projections as the target projection and trimmed using the arid zone boundary in Northwest China. As the NSL data were derived from six different DMSP-OLS satellites (F10, F12, F14, F15, F16, and F18), which lacked continuity and comparability, this paper adopted the method of Wei et al. [
16] to correct them. Since DMSP-OLS sensor design has limitations, this paper used the enhanced vegetation index (EVI) to reduce the saturation of DMSP-OLS. The NPP-VIIRS data are monthly data with a resolution of 430 m. The noise factor was not removed from the NPP-VIIRS data, and the DN values of the NPP-VIIRS and DMSP-OLS data were significantly different; thus, we adopted the method of Wei et al. [
16], we adopted a simple regression method to adjust them, for correction and fitting.
(2) Land use data, soil organic matter content data, soil erosion spatial distribution data, and soil type distribution data were obtained from the Data Center for Resources and Environmental Sciences, Chinese Academy of Sciences (
http://www.resdc.cn, accessed on 10 September 2022), with a resolution of 1 km. The biological abundance index was calculated by referring to the Technical Specification for Ecological and Environmental [
22].
(3) Temperature and precipitation data were derived from monthly scale data of the meteorological stations of the China Meteorological Data Network. Based on the ArcGIS10.8 software platform, the kriging interpolation method was employed to perform the spatial interpolation of station data so as to obtain spatial distribution data of the average temperature and annual precipitation in 2000, 2007, 2012, and 2018 in the arid regions of Northwest China. The resolution was 1 km.
(4) Digital elevation data (DEM) were derived from a geospatial data cloud platform (
http://www.gscloud.cn, accessed on 10 September 2022). Based on DEM data and referred to the relevant research results of Sheshukov et al. [
30], the topographic potential index and river network density in the arid region of Northwest China were calculated with a resolution of 1 km.
(5) Vegetation cover data (2000, 2007, 2012, and 2018) were derived from the monthly scale products of NASA’s EOS/MODIS dataset with a resolution of 1 km.
(6) Social statistical data were calculated based on population distribution raster data and cultivated land and forest land raster data, with a spatial resolution of 1 km.
2.3. Establishment of Index System
The purpose of this study was to monitor and evaluate the ecological carrying capacity of the arid region of Northwest China. Therefore, the ecological carrying capacity was considered as the evaluation target layer, whereas the criterion layer was set as the ecological, environmental elastic force [
31], resource and environmental capacity [
27], and socioeconomic pressure [
32]. The elastic force of the ecological environment reflects the background conditions that support the development of the natural environment and human society. In consideration of natural conditions, such as the lack of water resources and sparse vegetation in the arid area of Northwest China, factors such as annual precipitation, biological abundance, topography, and soil should be judged when selecting indexes. Resource and environmental capacities primarily reflect the degree of coordination between resources, the environment, and human society. Therefore, per capita, resource reserves, and economic development levels were primarily considered for the selection of indexes. Social and economic pressures (i.e., pressures on resources and the environment brought about by anthropogenic development) directly reflect the challenges that exist toward socioeconomic development; thus, demographic and economic aspects were selected as indexes. Finally, this study selected 13 indexes with complete structures and easy statistics (
Table 1).
Socioeconomic pressures were the cause of state changes and the resulting responses [
33]. Since the development of the west (2000), the social economy of the arid area of Northwest China developed quickly, which resulted in the rapid deterioration of the environment. The arid region of Northwest China is widely populated, where the area of urban and rural construction land accounted for only 0.52% of the total area of the study area. The spatial interpolation of statistical data cannot accurately reflect the impacts of anthropogenic activities on ecosystems. Therefore, for this paper, the nighttime light data and land use data were selected as indexes of the pressure of social activities on the ecological environment in the arid area of Northwest China.
The elastic force of the ecological environment reflected the long-term effects of various factors in the study area and was the most direct reflection of the background conditions of the regional ecological environment [
34]. Located in the central portion of Eurasia, Northwest China is a typical arid land region with annual precipitation of less than 200 mm, with low vegetation coverage. Therefore, this paper selected soil organic matter content data, soil erosion spatial distribution data, and soil type distribution data to characterize the soil carrying capacity factors of the study area. The average annual precipitation and annual temperature, and river network density were selected to represent the combined hydrothermal status of the study area. The normalized difference vegetation index (NDVI) reflected the biological activities in the study area and indicated the resistance of organisms to environmental change. The topographic potential index was selected as the topographic and geomorphic bearing capacity of the study area.
Resource and environment capacities are targeted measures put forward by human society to promote the sustainable development of the ecological environment. Per capita cultivated land and forested areas reflect the situation of human society with agricultural resources. Higher per capita cultivated land and forested areas can significantly improve the response capacities of humanity to ecological environment change. Consequently, per capita cultivated land and woodland areas were selected as response factors for the evaluation of the ecological carrying capacity in the arid areas of Northwest China.
2.4. Data Processing
To verify whether there was data redundancy in the selected ecological carrying capacity evaluation index, the collinearity between independent variables was diagnosed by SPSS software prior to evaluation. For this study, the variance inflation factor and tolerance were employed as elements of the multivariate collinearity diagnosis. With 10 as the boundary, the greater the variance expansibility factor was, the greater the collinearity. The tolerance value was the reciprocal of the variance expansibility factor, where the smaller the tolerance was, the stronger the collinearity, with 0.1 as the boundary. Based on the ArcGIS10.8 software platform, a 15 km × 15 km fishnet was established in the arid area of Northwest China, and 9327 fish sites were generated (
Table 2). Thirteen evaluation indices and ecological carrying capacity indices were extracted from these fish sites for collinearity diagnosis. The results revealed that there was no collinearity between the 13 evaluation indices in the study area, which could be used as the evaluation of the ecological carrying capacity (
Table 2).
Due to different dimensions and units, the evaluation indices were not horizontally comparable. According to the impact of each index on the ecological carrying capacity, the evaluation index was divided into a positive and negative index. The larger the negative index value, the smaller the ecological carrying capacity index would be, while the larger the positive index value, the larger the ecological carrying capacity index would be. The positive indices included the vegetation coverage index, biological richness index, average annual precipitation, river network density, per capita, cultivated land area, per capita woodland area, soil organic matter content, and topographic position index. The negative indexes encompassed the annual average temperature, soil erosion intensity, and nighttime light data. The range standardization method was adopted for index standardization, and the formula was as follows [
35,
36]:
Negative indexes:
where
Ri represents the standardized value of index
i,
Xi is the actual value of each index,
Xmax is the maximum value of each index, and
Xmin is the minimum value of each index.
According to the graded assignment method, the evaluation indices were graded and assigned. According to the water conservation capacity of different land uses, various land uses were ranked in descending order: forest land, water body < grassland < cultivated land < construction land < bare land, which were assigned 0–1. According to their ecological environment protection abilities, the soil types in descending order were: chernozemic soil, black soil, black blanket soil, gray cinnamon soil < meadow soil, frozen soil, gray calcium soil, grass blanket soil, tidal soil < irrigated desert soil, gray/brown desert soil < saline soil, desert saline soil < stony soil and aeolian sand soil, with values of 0–1.
2.5. Spatial Principal Component Analysis
Based on the principle of mathematical statistics, spatial principal component analysis (SPCA) converts multiple spatial index data into a few comprehensive layers by rotating the spatial coordinate axes of the feature spectrum. Because there is no artificial mark in the entire calculation process, the bearing capacity evaluation result is more objective. Based on the ArcGIS10.8 software platform, this study conducted spatial principal component analysis on 13 standardized indexes, which determined seven spatial principal components (
Table 3) according to the principal component of more than 85%, and finally calculated the ecological carrying capacity index (ECC) in the arid region of Northwest China. The calculation formula was [
34]:
where ECC is the ecological carrying capacity index,
Rn is the nth principal component, and
Yn is the corresponding contribution rate of the n principal component.
ECC2000,
ECC2007,
ECC2012, and
ECC2018 are the ecological carrying capacity indices of 2000, 2007, 2012, and 2018 respectively, and
P1–
P7 are the first seven principal component factors after the dimensionality reduction of the original data. The cumulative contribution rate of the first seven principal component factors was >85%, and the remaining principal component factors were found to be inconsistent with the actual ecological carrying capacity by comparison; thus, they were identified as noise and discarded [
37].
2.6. Standardization and Classification of Ecological Carrying Capacity
To facilitate a temporal comparison of ecological carrying capacities, the results of the ecological carrying capacities in 2000, 2007, 2012, and 2018 were standardized, and the formula was:
where
SIECC is the standardized value of the ecological carrying capacity index with a range of 0–1,
ECCi is the actual value of the ecological carrying capacity index,
ECCmin is the minimum value of the ecological carrying capacity index, and
ECCmax indicates the maximum value of the ecological carrying capacity index.
2.7. Construction of Ecological Security Pattern
According to the ecological security pattern development method proposed by Yu Kongjian et al. [
38]., the monitoring and evaluation results of the ecological carrying capacity in the arid area of Northwest China and the regional characteristics of the region, the “origins” of the regional ecological security pattern were identified. The Minimum Cumulative Resistance (MCR) model was employed to establish the cumulative cost distance surface of the ecological source area, after which the ecological corridor and radiation channel were identified to construct the ecological security pattern using the formula [
39]:
where MCR is the minimum cumulative resistance value,
Dij is the spatial distance of species from source
j to landscape unit I,
Ri is the resistance coefficient of landscape unit
i to species movement, and
f is the positive correlation between minimum cumulative resistance and ecological process.
2.7.1. Determination of Ecological Source Area
Ecological source areas are patches that play important roles in regional ecological environments for sustainable human development. By monitoring and evaluating the ecological carrying capacity of the study area, while identifying ecological source areas based on the special regional characteristics of the arid area in Northwest China, this study ensured their objective and comprehensive selection. Specifically, 3 layers of 13 indices of quantitative analysis were monitored and evaluated for their ecological carrying capacity, ecological environmental elastic force, resource and environmental capacity, and social economic pressure. Next, the ability of sustainable regional ecological development was evaluated and treated as the normalized ecological carrying capacity as the edge area. The top 20% of the plaques of all the dominant ecological areas were combined to obtain the important ecological patches, which were considered the key development areas of pattern optimization, where the intersections of ecologically dominant areas were the ecological source areas. According to the environmental conditions of the study area, this study selected major rivers, lakes, and woodland patches larger than 10 km
2 as ecological sources [
21] and combined them with the ecological sources obtained through the monitoring and evaluation of ecological carrying capacities to obtain the final ecological sources. Since some small source areas have negligible impacts on the overall ecological environment, patches with areas greater than 10 km
2 were selected as the ecological source areas for this study.
2.7.2. Development of Minimum Cumulative Resistance Surface
To reflect the migration and movement of matter and energy between “target sources”, based on the cost-distance module of the ArcGIS10.8 software platform, this investigation adopted the minimum cumulative resistance model (MCR) to calculate the cumulative cost-distance between ecological source areas and other landscape types. Subsequently, the accessibility of each landscape unit to the ecological source area was assessed. According to the ecological attributes of the study area, five factors, including landscape type, elevation, slope, normalized difference vegetation index, and soil type, were selected as resistance factors. Each evaluation index was divided into five levels, with allocated values of 1, 2, 3, 4, and 5, respectively. The lower the value, the less resistance the “source” had to overcome in the process of migration, and vice versa. The evaluation index system of the ecological source resistance surface is shown in
Table 4.
To better analyze the minimum cumulative resistance surface, this study used the superposition analysis of production-living-ecological-land and cumulative consumption distance surface to make the ecological security pattern zoning more scientific. The grid calculator of ArcGIS10.8 software was employed to superposition the classification map of the cumulative consumption distance surface and the distribution map of production-living-ecological-land to obtain the landscape ecological function zoning map. The calculation formula was [
23]:
where
ESP is the type code of the ecological security pattern;
CodeARD is the grade 4 cumulative cost distance surface grade code (1–4), wherein 1–4 represent the ecological conservation, optimized buffer, ecological transition, and ecological protection zones, respectively;
CodeAGL refers to four types of production-living-ecological-land type codes; and 0–3 represent unused, ecological, production, and living land, respectively. In the calculated ecological security pattern type code, ten digits represent the cumulative cost distance surface classification, and one digit represents the production-living-ecological-land type (e.g., 10 represents the unused land in the ecological conservation area).
2.7.3. Extraction of Ecological Corridor Radiation Channel
The ecological corridor is a low cumulative resistance valley line between “sources” and an important aspect of energy circulation between two adjacent sources, which has important ecological, social, and economic functions. Based on the hydrological analysis module in the ArcGIS10.8 software platform, this study filled the depressions, calculated the flow direction and confluence accumulation based on the accumulated cost distance to the surface, and obtained the threshold values greater than 2000 through the repeated determination of the domain value. Vectorization was then performed, and the vectorized lines were smoothly processed. The minimum cost path between two sources was extracted, and the corridor between any two sources was obtained. The radiative path is the optimal path for the outward diffusion of ecological flow and is a low resistance valley line for the outward diffusion of material with “source” as the center. Based on the accumulated cost distance surface, it will play a key role in the future development of the research area, and its own development will identify the valley lines of low resistance values radiating outward from the center of the “source”.
2.7.4. Identification of Ecological Nodes
Ecological nodes are regions that connect two adjacent ecological sources in ecological space, which play a key role in the landscape ecological process. They are typically distributed in the weak ecological function of the corridor. Based on the unique physical geographical characteristics of the arid area in Northwest China, two methods were used to extract ecological nodes. The first was the intersection of the low resistance valley lines between sources, whereas the second involved seventy-one ecological nodes of the two types being extracted from the ridge line of ecological resistance (e.g., the intersection of the path with the maximum cumulative ecological resistance and low resistance valley line).
4. Conclusions
From the development of the western region in 2000 to the popularization of the theory of “two mountains” [
35], increasing attention has been paid to the protection of ecosystems in the arid area of Northwest China. With this background, our study employed the spatial main component analysis method (SPCA) to systematically monitor and evaluate the ecological carrying capacity of the arid regions of Northwest China toward the development of sustainable ecological security patterns. The following conclusions were obtained:
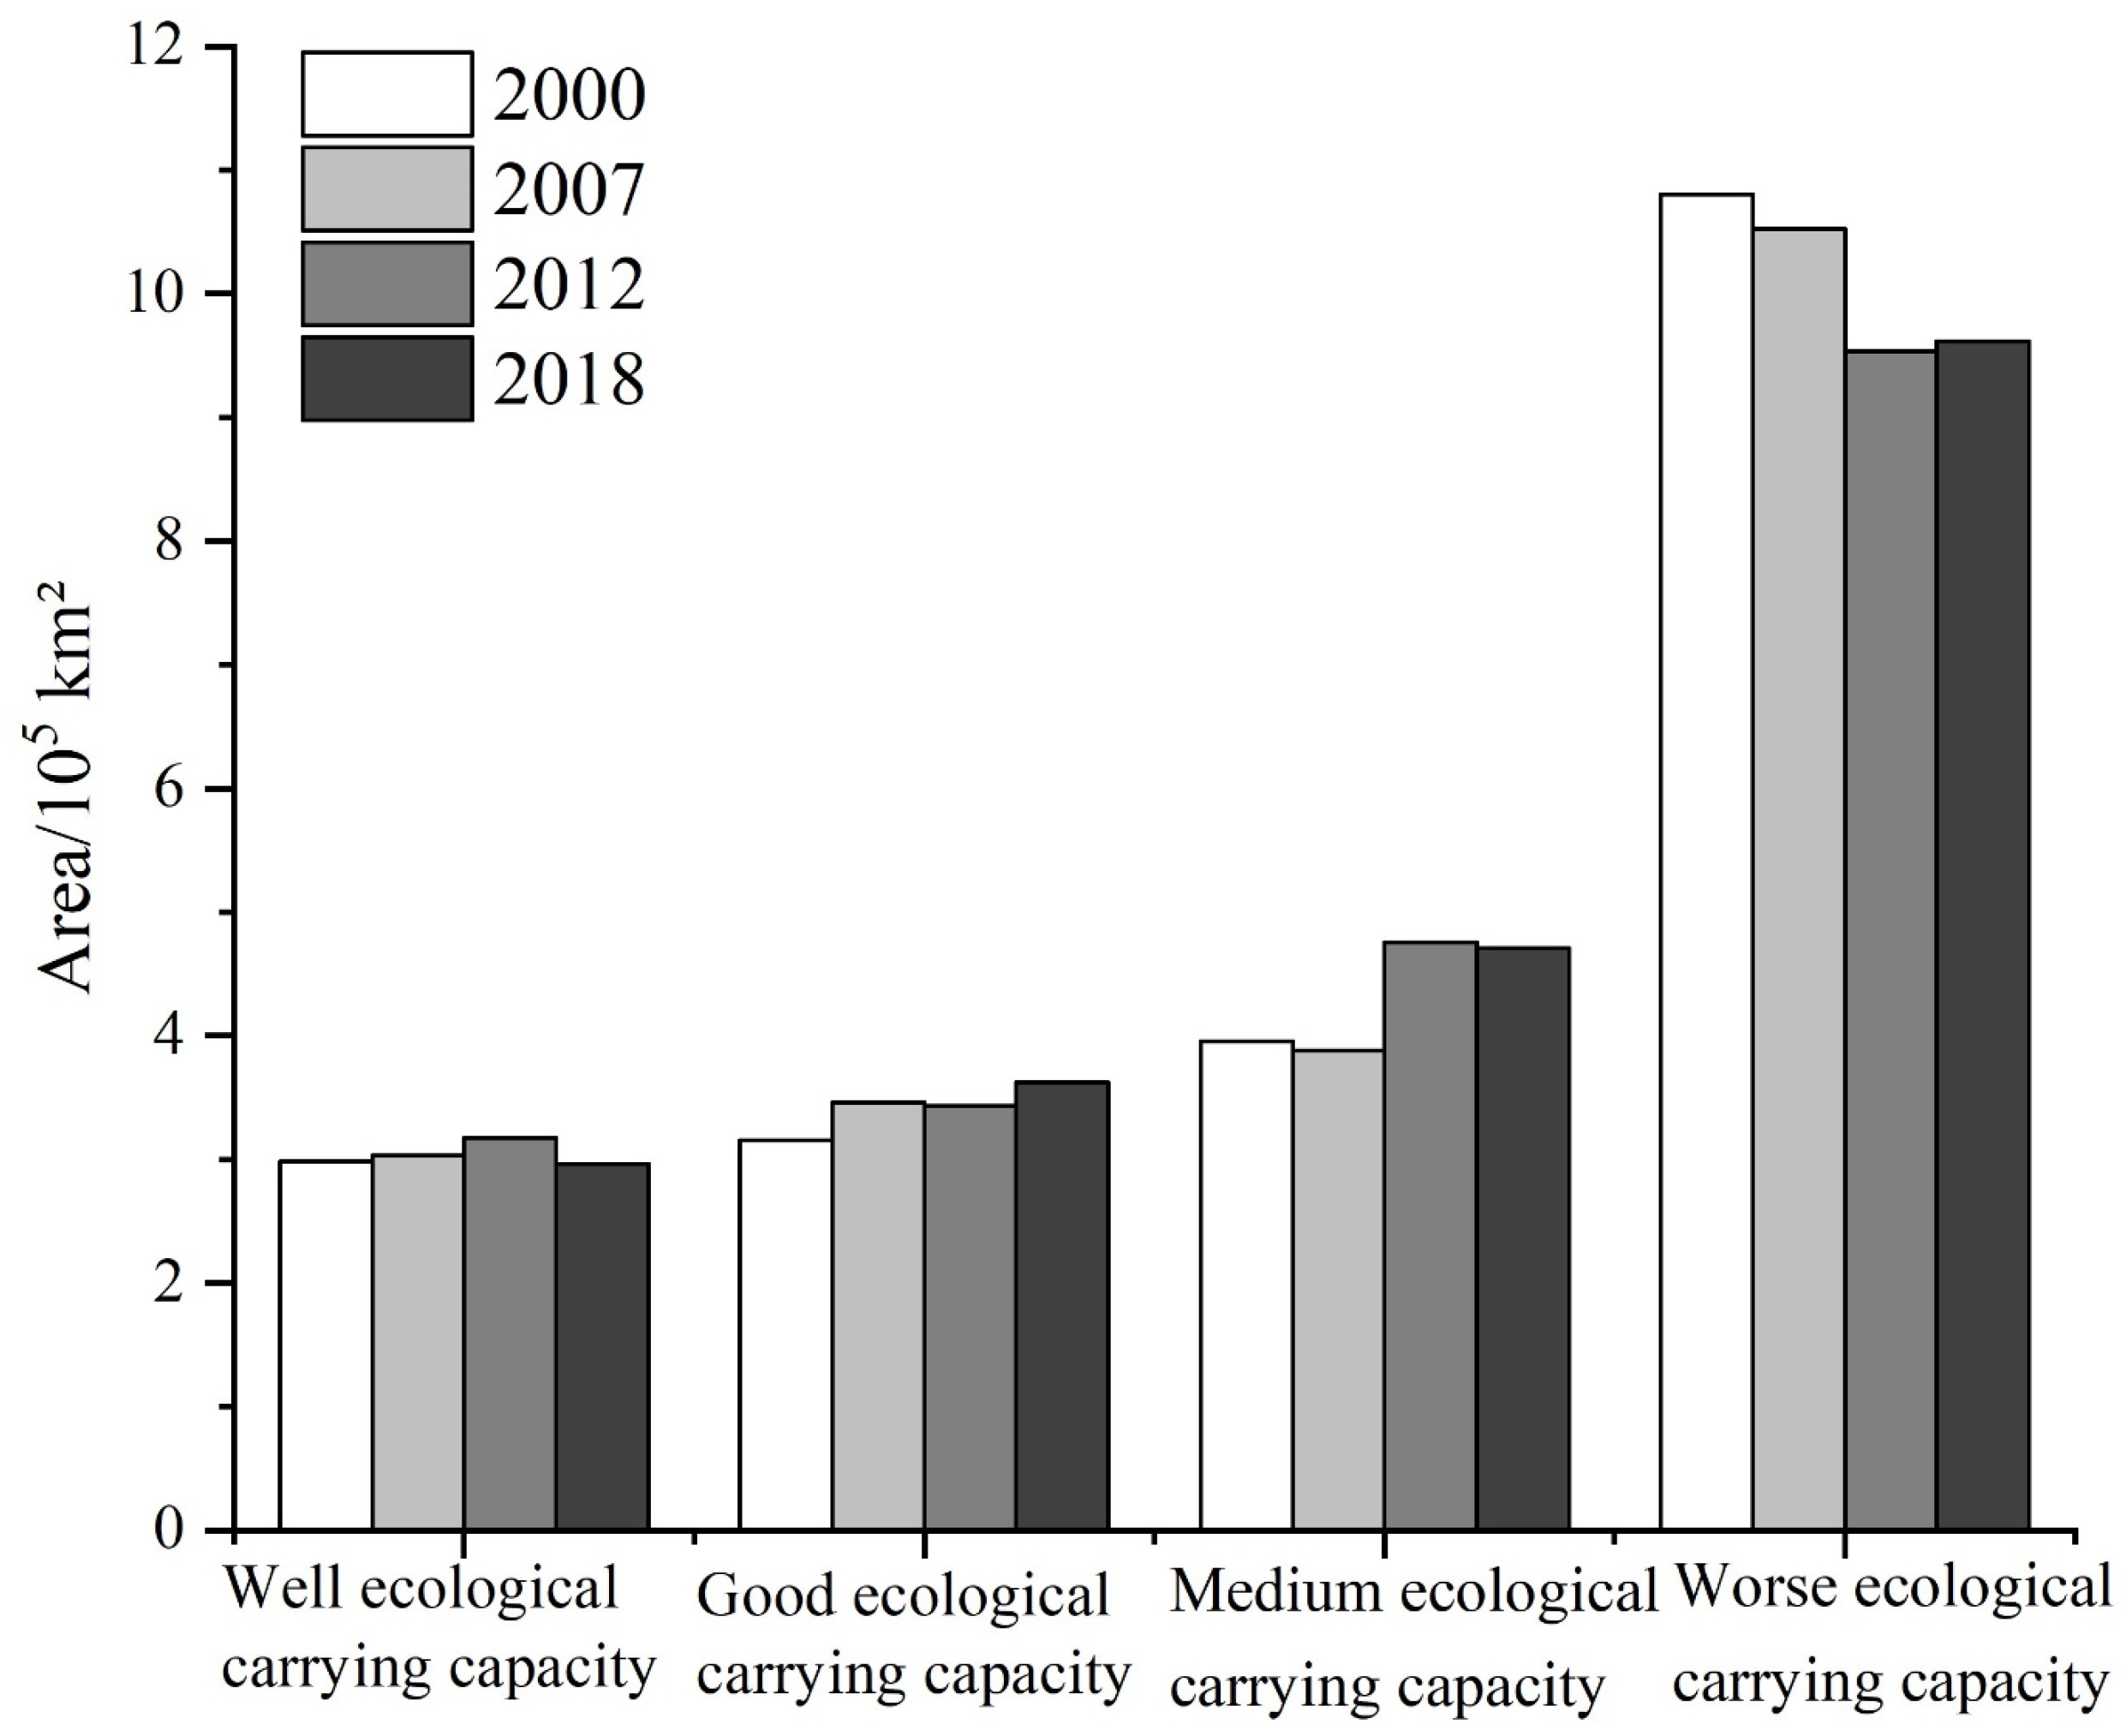
(1) On the whole, the ecological carrying capacity of the northwest arid region was weak, with the ecological carrying capacity increasing from east to west. The Good and Well ecological carrying capacity areas were primarily distributed across the Altai, Tianshan, Kunlun, and Qilian Mountains and other regions. The Weak and Medium ecological carrying capacity areas were primarily distributed across the Junger Basin, Tarim Basin, and Alashan Plateau.
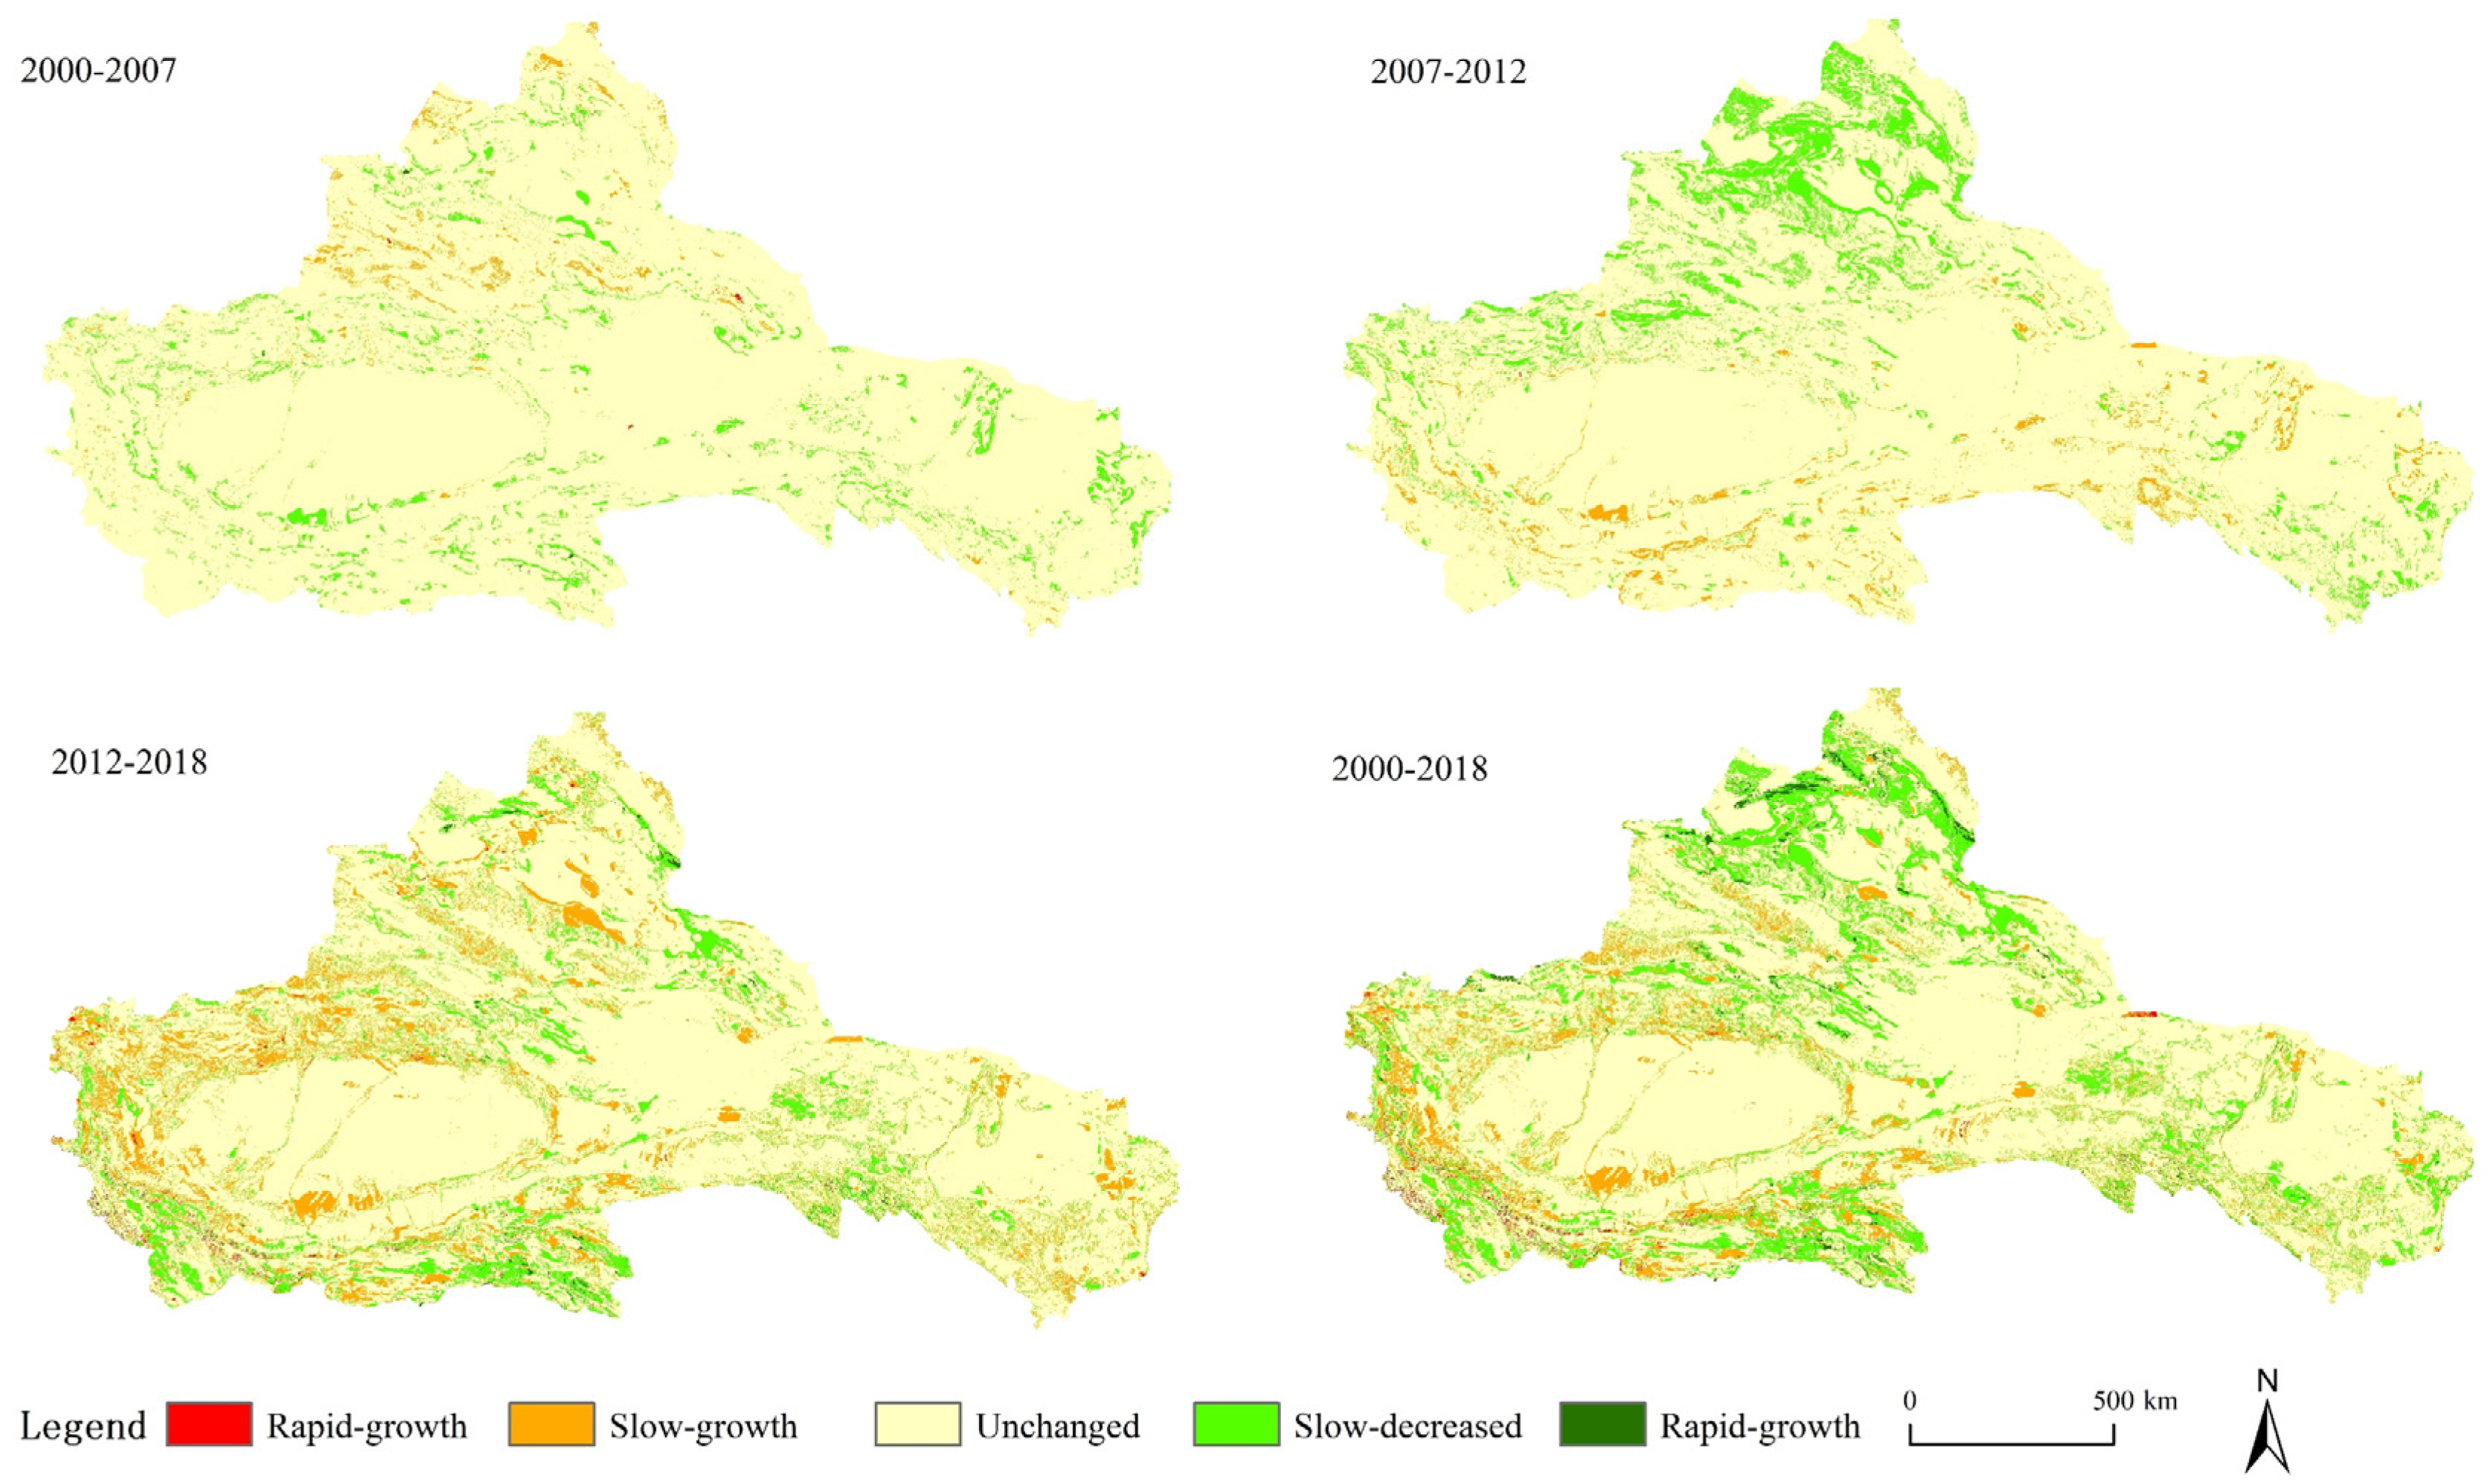
(2) From changes in the spatiotemporal characteristics of the ecological carrying capacity, the Weak carrying capacity of these areas decreased, while the Well carrying capacity increased. The Hexi region, Northern Xinjiang region and Western Inner Mongolia showed a general upward trend, while the southern Xinjiang portion showed a downward trend. The Bayingolin Mongol Autonomous Prefecture, Yili Kazak Autonomous Prefecture, Altay City, and Hami City, for the most part, remained unchanged. Overall, the ecological carrying capacities of the northwest arid areas increased slightly but steadily.
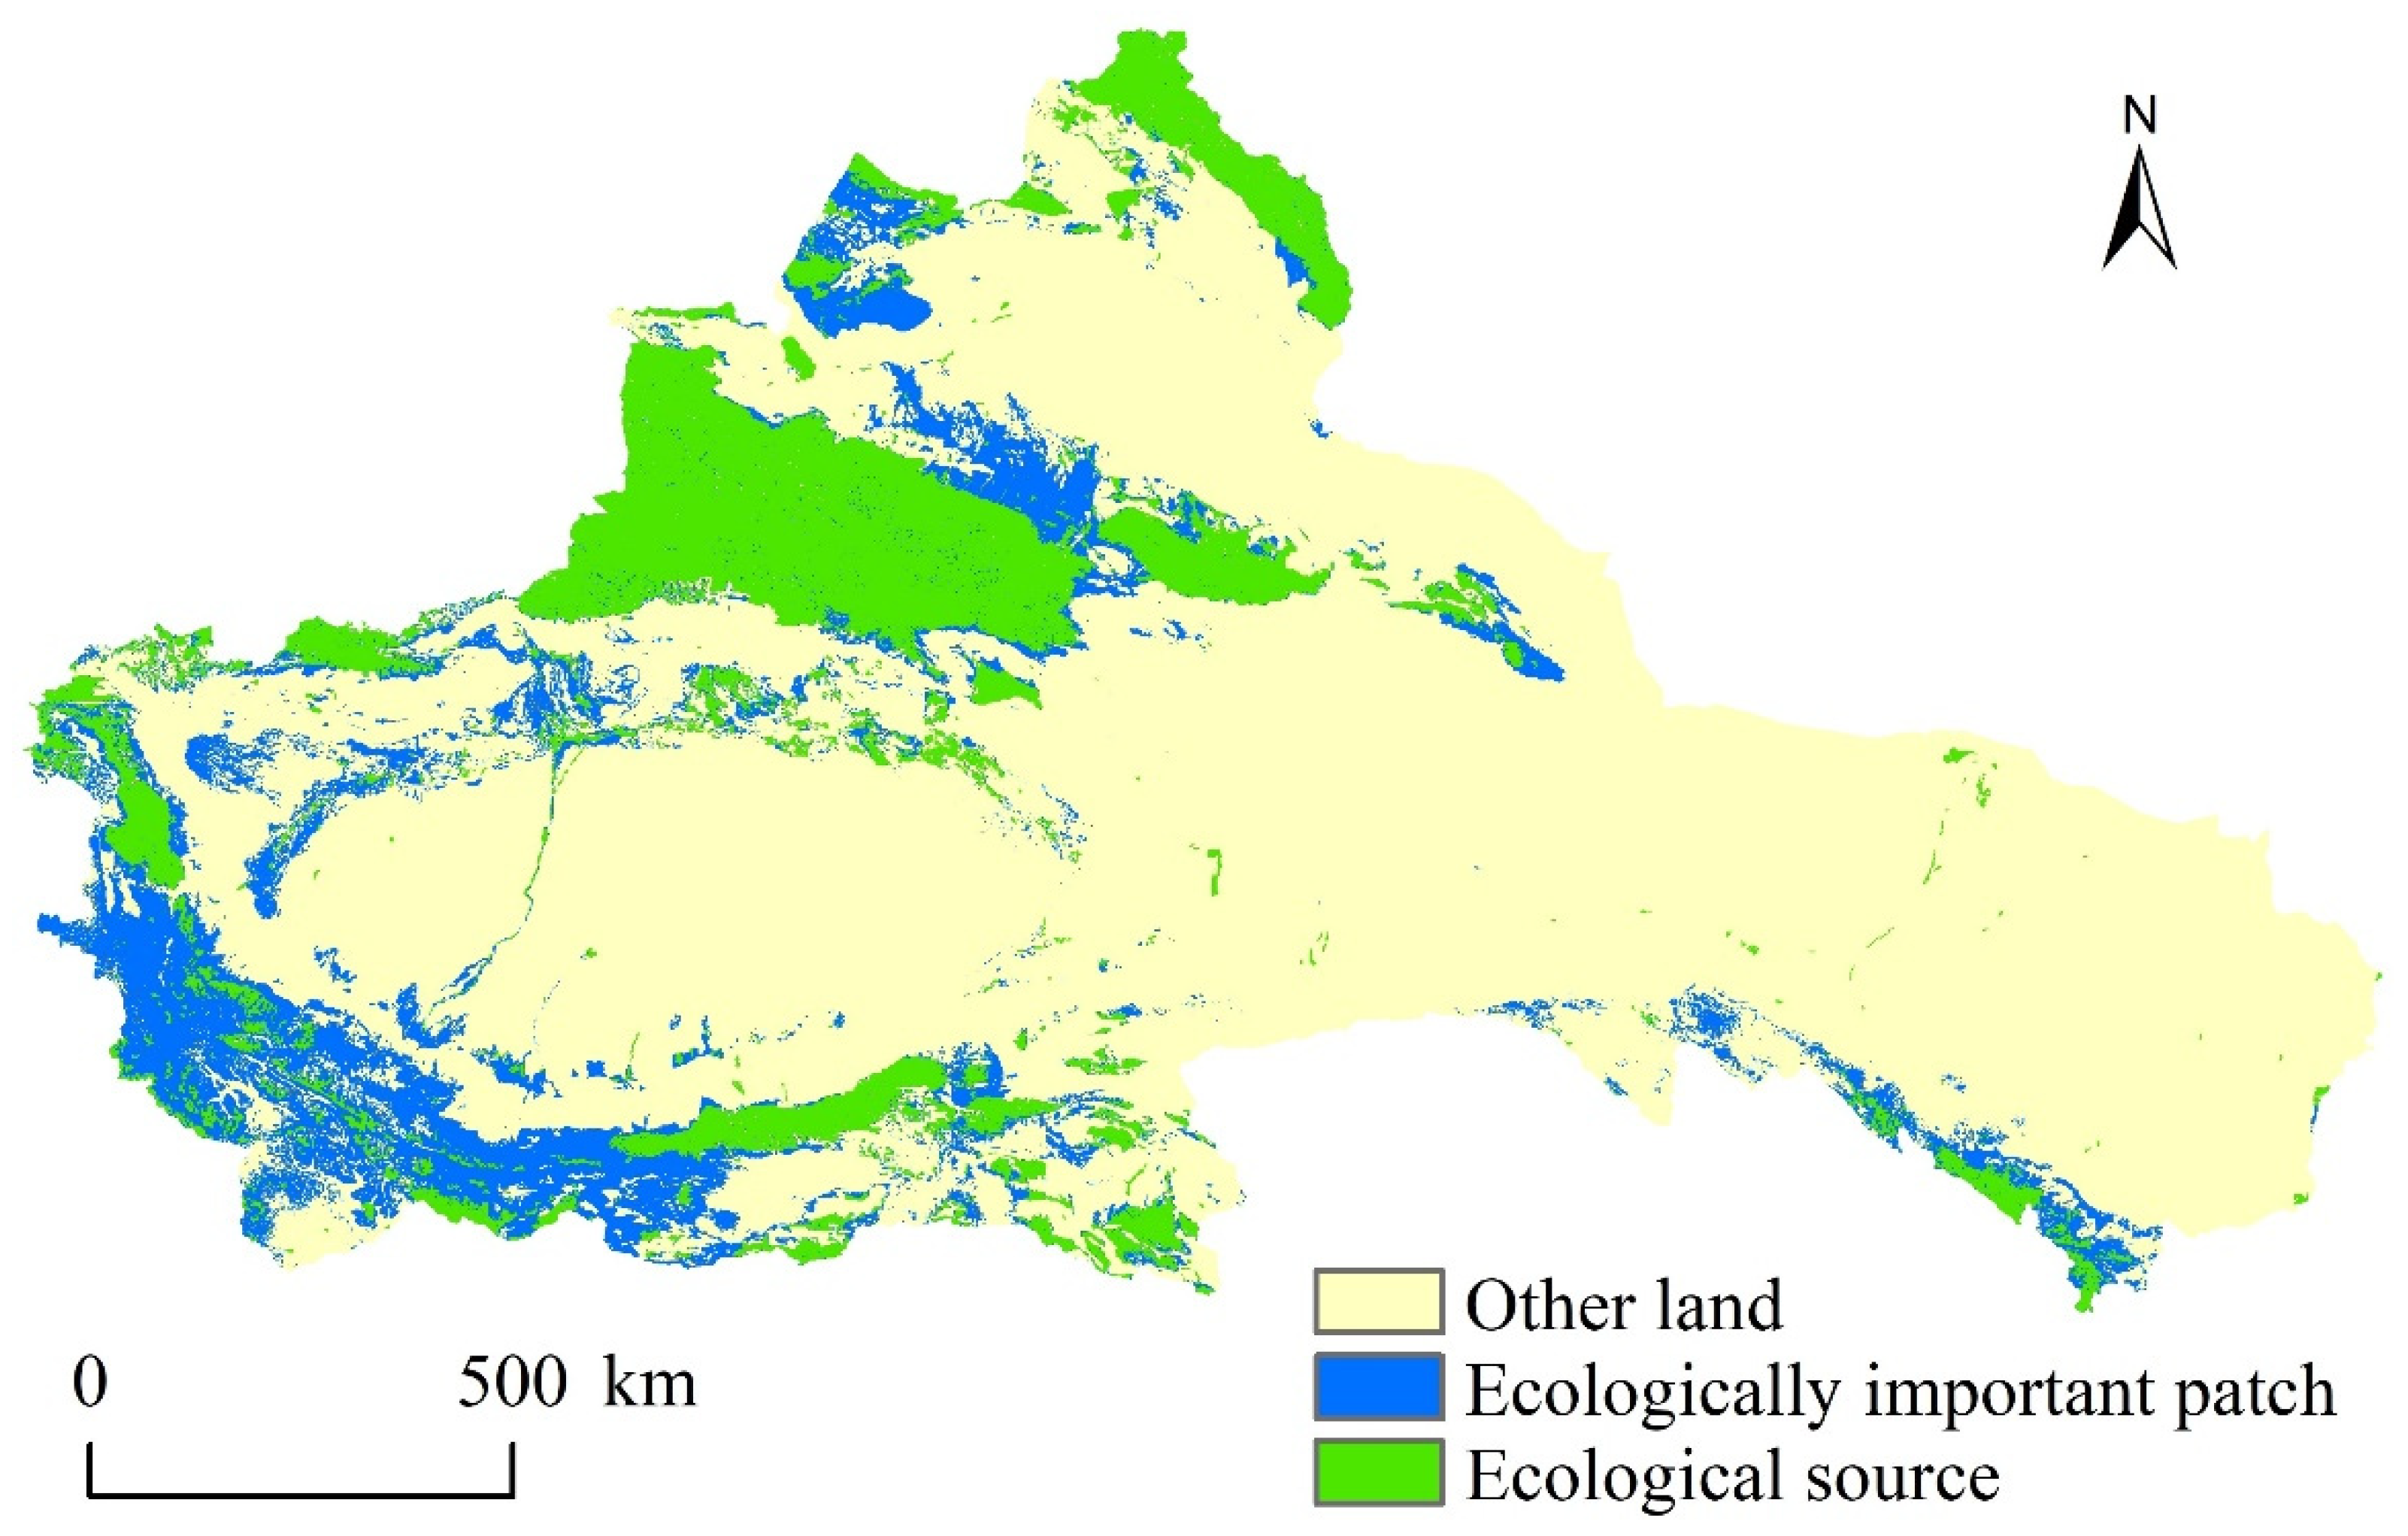
(3) Based on the results of the monitoring and assessment of the ecological carrying capacities, as well as the unique geographical characteristics of arid areas of Northwest China, the ecological source area was extracted as 237,215 km2, which accounted for 11.35 percent of the total study area. Generally, the ecological source area accounted for a low proportion of the whole, and the distribution of the ecological source areas was uneven. The ecological sources of the north area were higher than the south, and those of the west were higher than the east. From the topographical perspective, the ecological source areas were mainly distributed across the high mountain range area, with the basin areas having fewer than the mountainous regions.
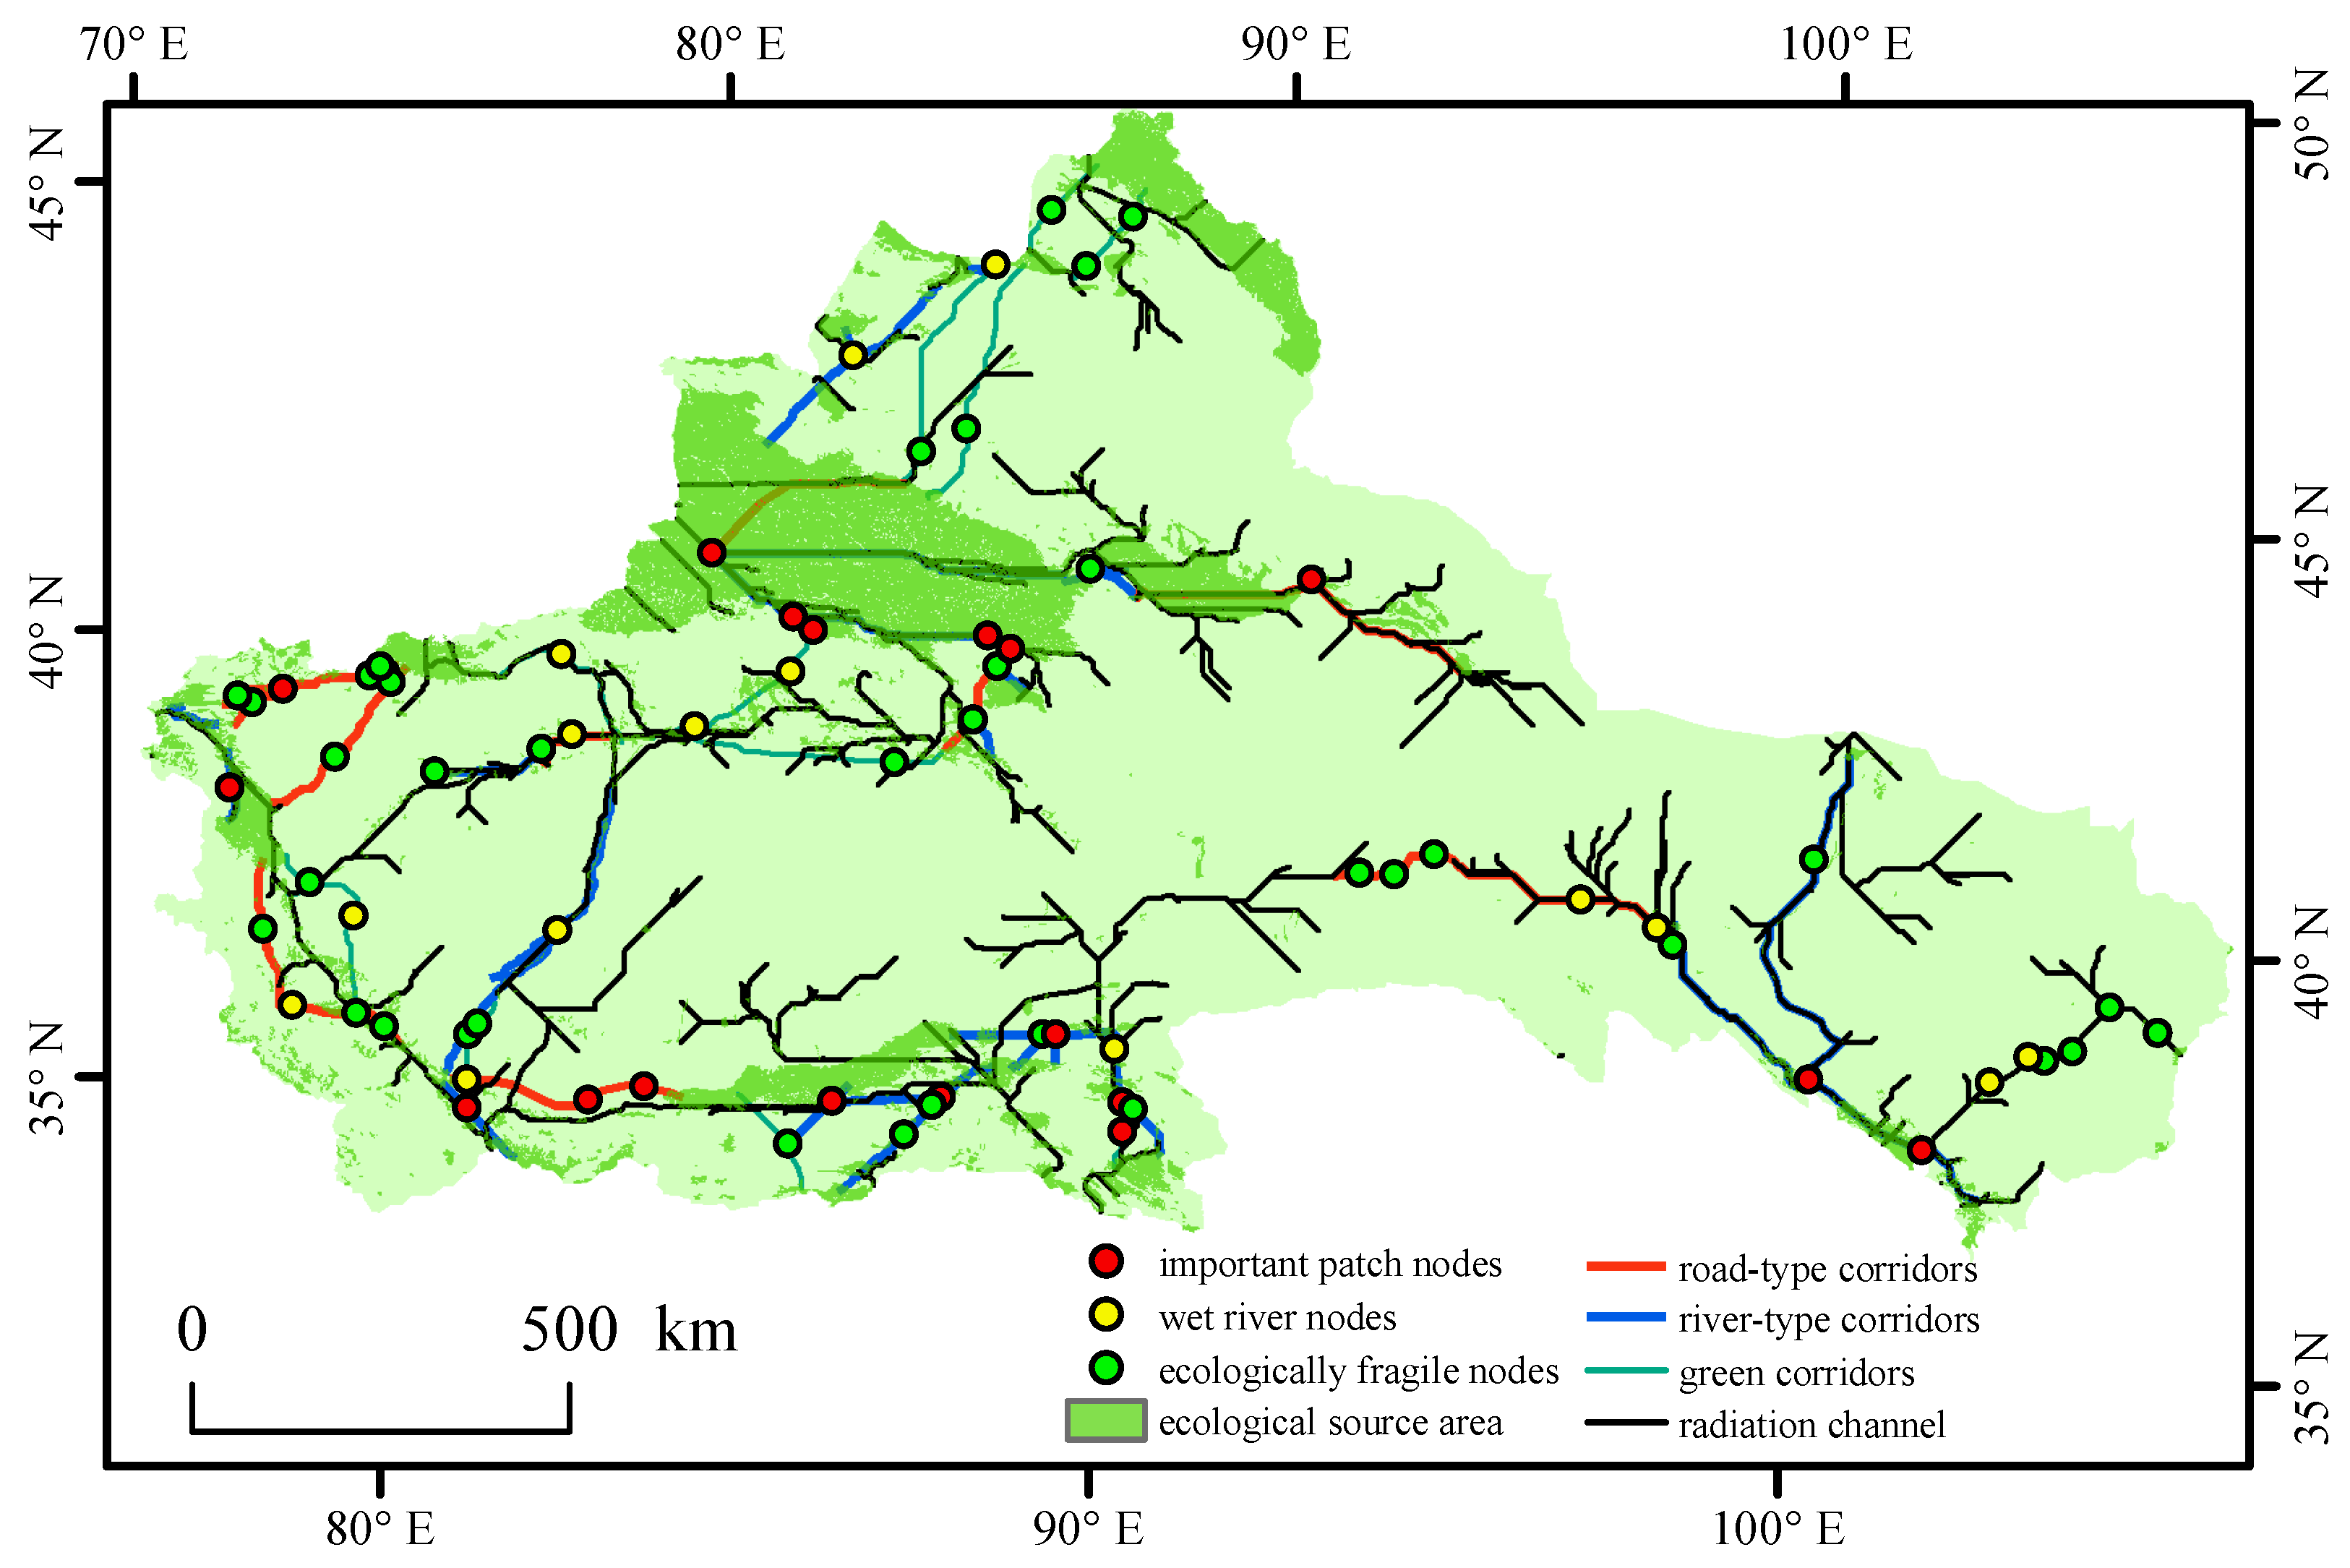
(4) Based on the MCR model and land use data, the arid areas of Northwest China were divided into sixteen ecological safety pattern partitions, and three types of corridors, such as road, river, and green corridors, were extracted. Further, three types of important plaque nodes were identified, such as river wet area nodes and ecologically fragile area nodes, and then optimized in combination with the ecological carrying capacity monitoring and evaluation results.
However, ecological carrying capacities are complex systems. The comprehensiveness and scientific nature of the selected indexes directly determined the accuracy of the results in the evaluation of ecological carrying capacities. Thus, the ecological carrying capacities were evaluated using spatial principal component analysis (SPCA) from seventeen indexes with three criteria levels, which took into account characteristics of the natural environment, such as hydrology, soil, and vegetation, and the social environment, such as urban, population, and economy. However, the data collection was confronted with great challenges due to the extensive scope, large areas, and significant regional differences, particularly in terms of the accuracy of the spatial rastering of statistics. Therefore, future research work should further study and perfect the aspects of index refinement and data spatialization. However, in terms of the macro-guidance of ecological management and ecological pattern optimization, this study provides new perspectives on the aspects of ideas and methods, which are worthy of attention as references in the future.


