Article

Climate Change Assessment of the Spatial Potential Aggregation Zones of Plectropomus pessuliferus marisrubri and Plectropomus areolatus along the Saudi Coast, Using RS and GIS

1
Environmental Studies Department, National Authority for Remote Sensing and Space Sciences (NARSS), Cairo 11843, Egypt
2
Urban Planning Department, Environmental Studies and Land Use Division, National Authority for Remote Sensing and Space Sciences (NARSS), Cairo 11843, Egypt
3
Department of Geography, College of Arts, Princess Nourah Bint Abdulrahman University, P.O. Box 84428, Riyadh 11671, Saudi Arabia
4
Department of Geography, Faculty of Art, Monofiya University, Shibin Al Kawm 32511, Egypt
5
Urban Planning Department, National Authority for Remote Sensing and Space Sciences (NARSS), Cairo 11843, Egypt
*
Author to whom correspondence should be addressed.
Sustainability 2022, 14(23), 15825; https://doi.org/10.3390/su142315825
Submission received: 30 September 2022 / Revised: 17 November 2022 / Accepted: 23 November 2022 / Published: 28 November 2022
(This article belongs to the Section Sustainable Oceans)

Abstract

:
Climate change is becoming one of the main threats to fishery resources, with the attendant possibilities of decreasing income and food security. Sea surface temperature (SST) is considered a major environmental indicator of climate change, one that impacts the marine ecosystem and habitat. Studying the impacts of SST changes necessitates regular effective monitoring; remote sensing techniques provide researchers with the ability to track changes on various spatial and temporal scales. This study provides an integrated approach, using the advantages of remote sensing data and GIS tools, to assess the SST changes in the spatial potential aggregation zones of Plectropomus pessuliferus marisrubri and Plectropomus areolatus along the Red Sea’s Saudi coast. This study used SST satellite data for 2011 and 2021 to detect changes and develop suitability and risk assessment maps. The SST showed an increase of 0.46 °C from 2011 to 2021, particularly during the summer months. As a result, the suitability of spatial potential aggregation from 2011 to 2021 has dropped in the summer months. The risk assessment analysis revealed a decrease in the suitable potential aggregation zones in the summer months, as it reached about −35.7% in August, while it increased in the winter months, reaching +2.52% in January.

1. Introduction

Climate change has had a negative impact on global marine economics and food security as the marine fisheries provide most of the daily food needs for about one billion people around the world [1,2]. Consequently, there will be a sharp growth in demand for fisheries production in the next 20 years [3]. Sea surface temperature (SST)is considered one of the significant indicators of global climate change, as it affects the oceanographic conditions, which, in turn, affects the marine ecosystems [4,5]. SST has a recorded increase of about 0.13 °C per decade between 1971 and 2010 [6], and it is anticipated that this rate will persist for the next century [7]. The Red Sea is considered the warmest sea in the world, due to its landlocked location. Therefore, it is particularly vulnerable to changing environmental conditions. The Red Sea’s temperature increased by 0.74 °C from 1982 to 2006 [8]. The impact of temperature variability on marine ecosystem components (e.g., coral reefs) has been reported [9] since the coral reef ecosystem is most vulnerable to thermal conditions. A declining trend in coral reef ecosystems, both globally [10] and specifically in the Red Sea, is correlated with the warming of SST [11]. The decrease in average colony size and increase in coral diseases are attributed to heat-mediated bleaching, particularly in the southern parts of the Red Sea [11]. However, the rapid deterioration of many marine ecosystems is largely due to rising ocean temperatures [12,13], which have a direct impact on the related fisheries [1,14]. Reef fish may also be impacted by the changes in sea surface temperatures [15,16,17], as the differences in sea surface temperature will affect the reproduction of marine organisms and the growth of fish [16,18]. Moreover, it has a significant impact on the spatial distributions of species, as many have migrated to the poles and deeper seas due to increasing sea surface temperature, as a way to maintain constant climate conditions [19,20,21,22,23,24]. As a result, the presence and abundance of fish lead to shifts in marine ecosystems, changes in fishing operations, the distribution of catch shares, and the effectiveness of measures to manage the fisheries [19,25].
The leopard coral grouper (Plectropomus leopardus), a type of coral reef fish known as ‘the coral trout’, is considered the most preferable due to its great commercial value; it is a good food fish and achieves high market prices, both locally and internationally, as it reaches a total length of 125 cm [26]. The coral trout (Plectropomus leopardus) belongs to the Serranidae fish family [27] and its natural habitat includes open water and coral reefs (Light et al., 1997). The leopard coral grouper is located in the western Pacific, where it is distributed from southern Japan to Australia and from the east coast of Thailand and Malaysia, east to the Solomon Islands, Caroline Islands, and Fiji [28]. The leopard coral grouper can be found at depths of three to one hundred meters [26]. Two species of Plectropomus grouper, Plectropomus pessuliferus marisrubri and Plectropomus areolatus, are found in the Red Sea [29], the Arabic names of which are ‘Najeel’ and ‘Tarathi‘, respectively [30]. Both species are the most preferred catch in the Red Sea and are highly fished as they are the most profitable species by weight in the fisheries of the Red Sea of Saudi Arabia [29] because of market choice, which suggests that they are heavily targeted and are collected from Saudi Arabian reefs. P. pessuliferus marisrubri and P. areolatus are worth about 26.43 ± 1.2 USD/kg and 25.92 ± 2.5 USD/kg [31]. P. pessuliferus marisrubri and P. areolatus have an average market size of 59.7 and 37.9 cm, respectively, while the maximum sizes are 120 and 80 cm, respectively [31]. Various studies have shown that P. leopardus metabolism and activity are very sensitive to changes in sea surface temperature [32,33]. Furthermore, P. leopardus showed a reduction in survival rates, indicating that it is quite vulnerable to higher sea surface temperatures [34,35]. Global climate change may alter the ecological habitats of P. leopardus species, affecting growth, reproduction, and stability as the fish move into deeper waters, resulting in reduced catches, in turn, affecting the commercial range [34].
Overexploitation of the most highly demanded and highest revenue species is considered one of the greatest threats to fishery resources. P. pessuliferus marisrubri and P. areolatus are highly targeted and are harvested from local Saudi Arabian reefs, as they command higher prices and meet consumer preference [31]. In addition, their slow rates of growth and sexual maturation make them more vulnerable to overfishing. Therefore, 60% of P. pessuliferus marisrubri and P. areolatus in Jeddah fish markets are of a size below the maturation size, which indicates that juveniles were caught [31]. Moreover, it was recorded that the abundance of both species in the fish market is relatively low compared to the lower-value species, reflecting the overfishing of immature or mature individuals caught before reproducing [31].
However, monitoring is a key challenge for fishery resource development; it provides early warning signs of fish supply decline due to changes in environmental conditions and their impacts on the abundance and distribution of exploited fish species. Satellite remote-sensing data provide consistent global observations at different spatial and temporal scales. The technology has been widely used for sustainable fisheries and aquaculture management, as it supplies different observation datasets compared to in situ ones. Since the 1980s, satellite remote sensing has been used to improve marine fishery management by determining potential fishing zones (PFZ) using temperature and other oceanographic parameters [36,37,38,39,40]. Remote sensing data is used for resource management, conservation, and exploitation, as it detects variations in environmental conditions affecting the recruitment, distribution, abundance, and availability of fishery resources, helping in sustainable development.
This study provides an integrated approach, based mainly on satellite data, to show the impacts of SST changes as a strong indicator of climate change on the potential aggregation areas of P. pessuliferus and P. areolatus along the Red Sea’s Saudi coast. The model was developed to evaluate the SST changes to the suitability of the potential aggregation zones from 2011 to 2021. The obtained results are expected to make a good contribution to the risk assessment of raising SST on suitable potential areas of fish aggregation, in terms of the appropriate temperature limits of P. pessuliferus and P. areolatus.

Study Area

The Red Sea is home to enormous coral reef habitats that support thousands of fishery zones [31]. Saudi Arabia’s Red Sea coastline is approximately 1500 km long and takes up most of the eastern Red Sea basin. The coastline reaches Yemen (16°22′ N), south of the Farasan Islands, from the Gulf of Aqaba to Jordan’s northern border (29°30′ N), Figure 1). Coral reefs can be found along the entirety of Saudi Arabia’s coastline and extend tens of meters from the coast before disappearing into the deep water, and are a common feature of Saudi Arabia’s Red Sea coastlines.

2. Materials and Methods

2.1. Data

The sea surface temperature (SST) satellite data analyzed in this study were derived from a moderate-resolution imaging spectroradiometer satellite (MODIS-Aqua) measurement. Level 3 (4 km) monthly standard mapped image (SMI) data are available showing SSTs. Changes in sea surface temperature were determined along the coastal area of Saudi Arabia over 10 years; the acquired images were downloaded for 2011 and 2021. Since the leopard coral grouper is found on coral reefs, the coral reef location along the Saudi Arabia coast was determined using an Arc-GIS shape file.

2.2. Data Determination of SST Changes

Detecting and monitoring SST has significant economic and social importance as it is essential for fishery planning and management. SST is considered one of the major indicators of climate change, affecting the marine ecosystem. Determining the ocean temperature using traditional techniques (measurement and data-collecting) is difficult and time-consuming. Remote sensing overcomes the difficulties in detecting SST changes over different decades as it provides regular continuous monitoring for global temperatures at different times and spatial resolutions. SST changes were determined using over 10 years from 2011 to 2021 using satellite data for all months (average monthly). The mean values for all months were obtained for the years 2011 and 2021 to determine the SST changes, both monthly and yearly, for further analysis and assessment.

2.3. Suitability Map of Spatial Potential Fishing Zones

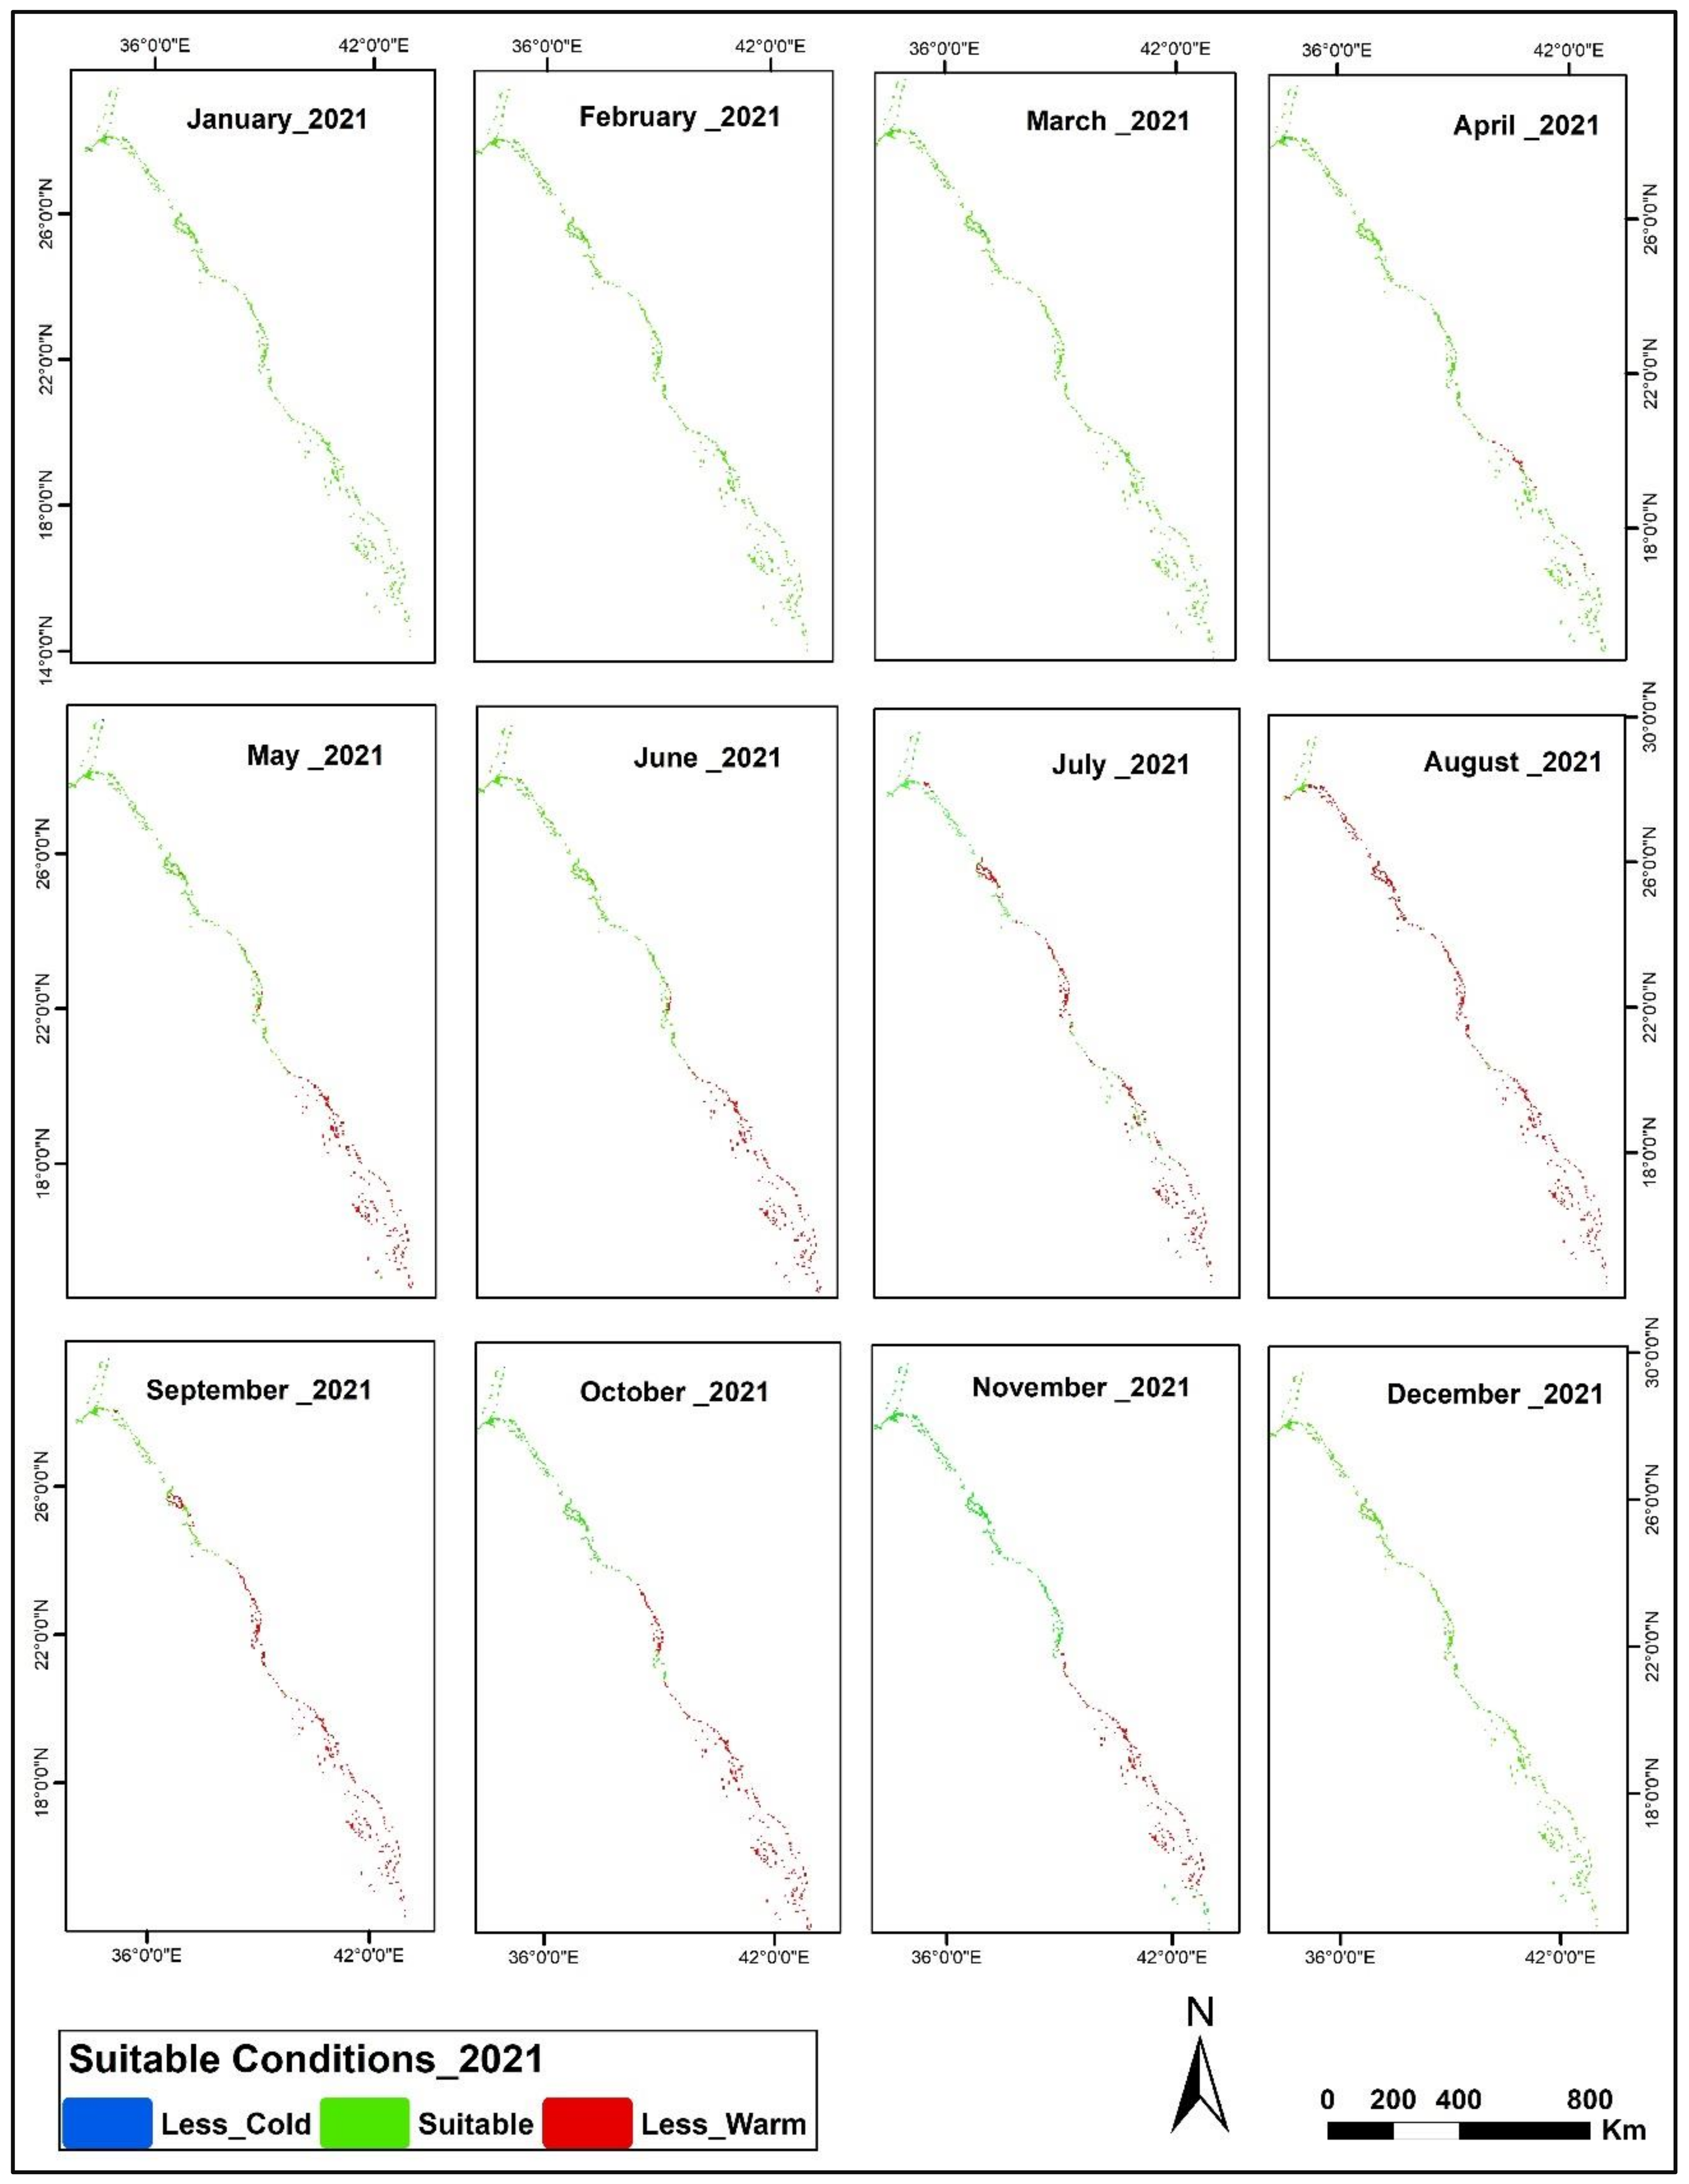
A suitability map was developed using the preferred temperature ranges of SST to determine the spatial potential aggregation zones. The exhibited temperature values favored by P. pessuliferus and P. areolatus for aggregation are between 22 and 30 °C [34,41,42]. The spatial potential areas of fish aggregation were produced by developing a GIS model that integrated the SST satellite data with the location of the coral reef (see Figure 2). The spatial potential aggregation zones were determined for all months of both 2011 and 2021 for further monitoring and evaluation. The model was generated by classifying the SST values into three classes, such as "less suitable—cold” (less preferable cold temperatures), which represents temperature values of less than 22 °C, “suitable” (the preferred temperatures) representing the favored conditions with temperature values of 22–30 °C, and the third class, “less suitable—warm” (less preferable warm temperatures), which reflect the excessive temperature of >30 °C. Moreover, a Euclidian distance method using an area of 500 m around the coral reef was applied to indicate the occurrence of fish distribution around the coral reefs. A weighted overlay step was used to integrate the three classes of suitability with the coral locations, to produce a suitability map of the two species for further assessment.

2.4. Risk Assessment of SST on Spatial Potential Aggregation Zones

An assessment of changes in the suitability of the potential fish aggregation zones between 2011 and 2021 was performed. The evaluation process was developed by determining the areas of the suitability classes of potential aggregation areas over the years 2011 and 2021. Differentiation was made for the three classes of suitability to determine the changes, either decreasing or increasing, to assess the impact of SST on the aggregation zones of P. pessuliferus and P. areolatus along Saudi Arabia’s Red Sea coastline.

3. Results and Discussion

3.1. SST Change Detection

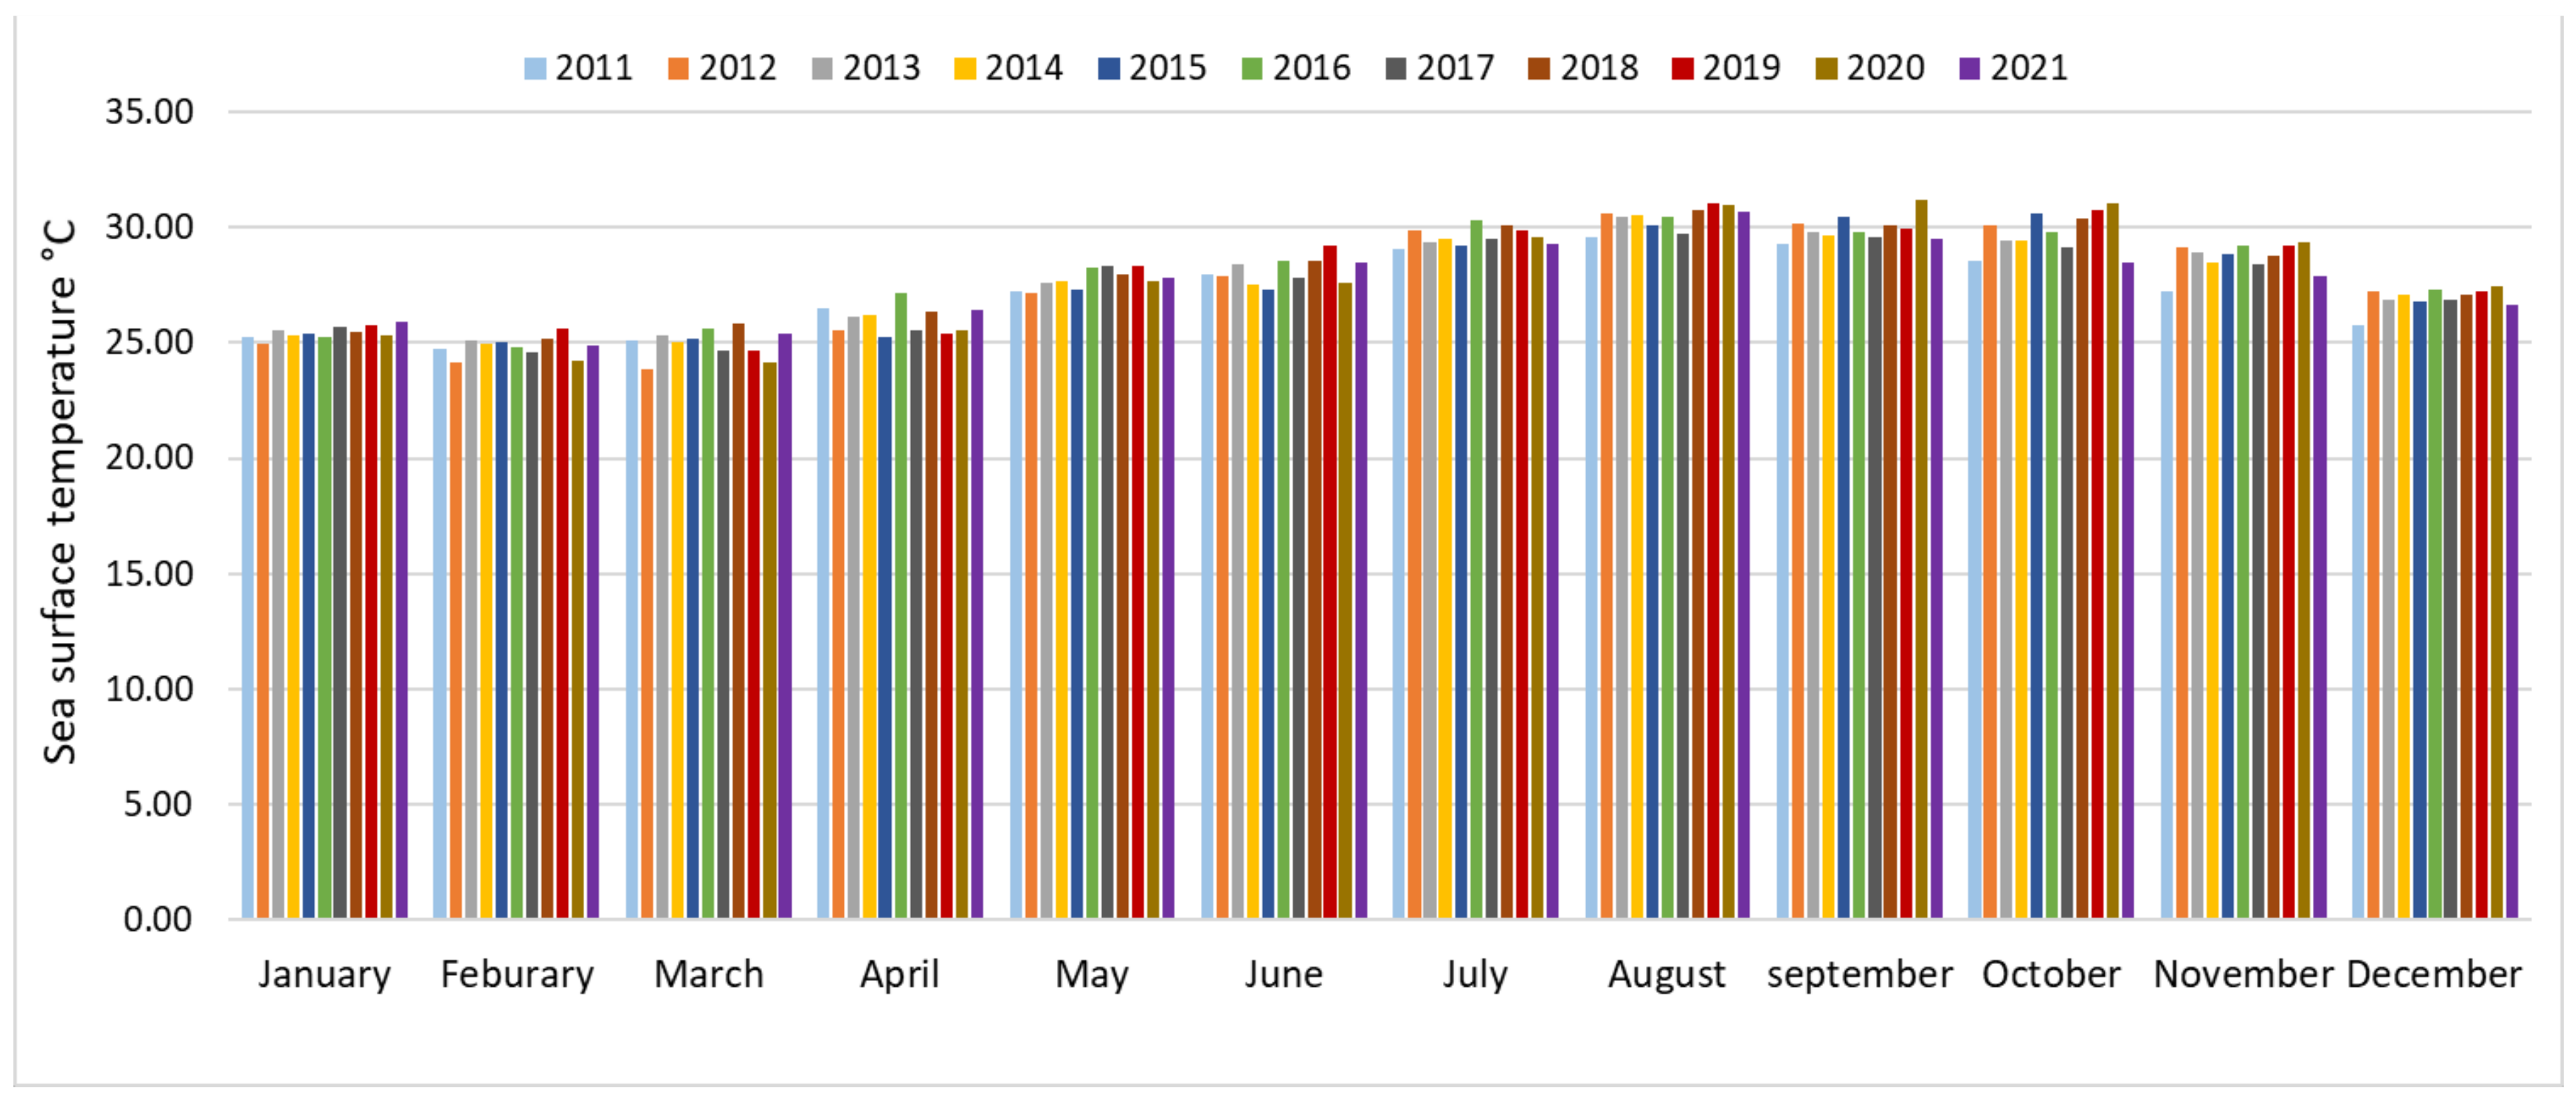
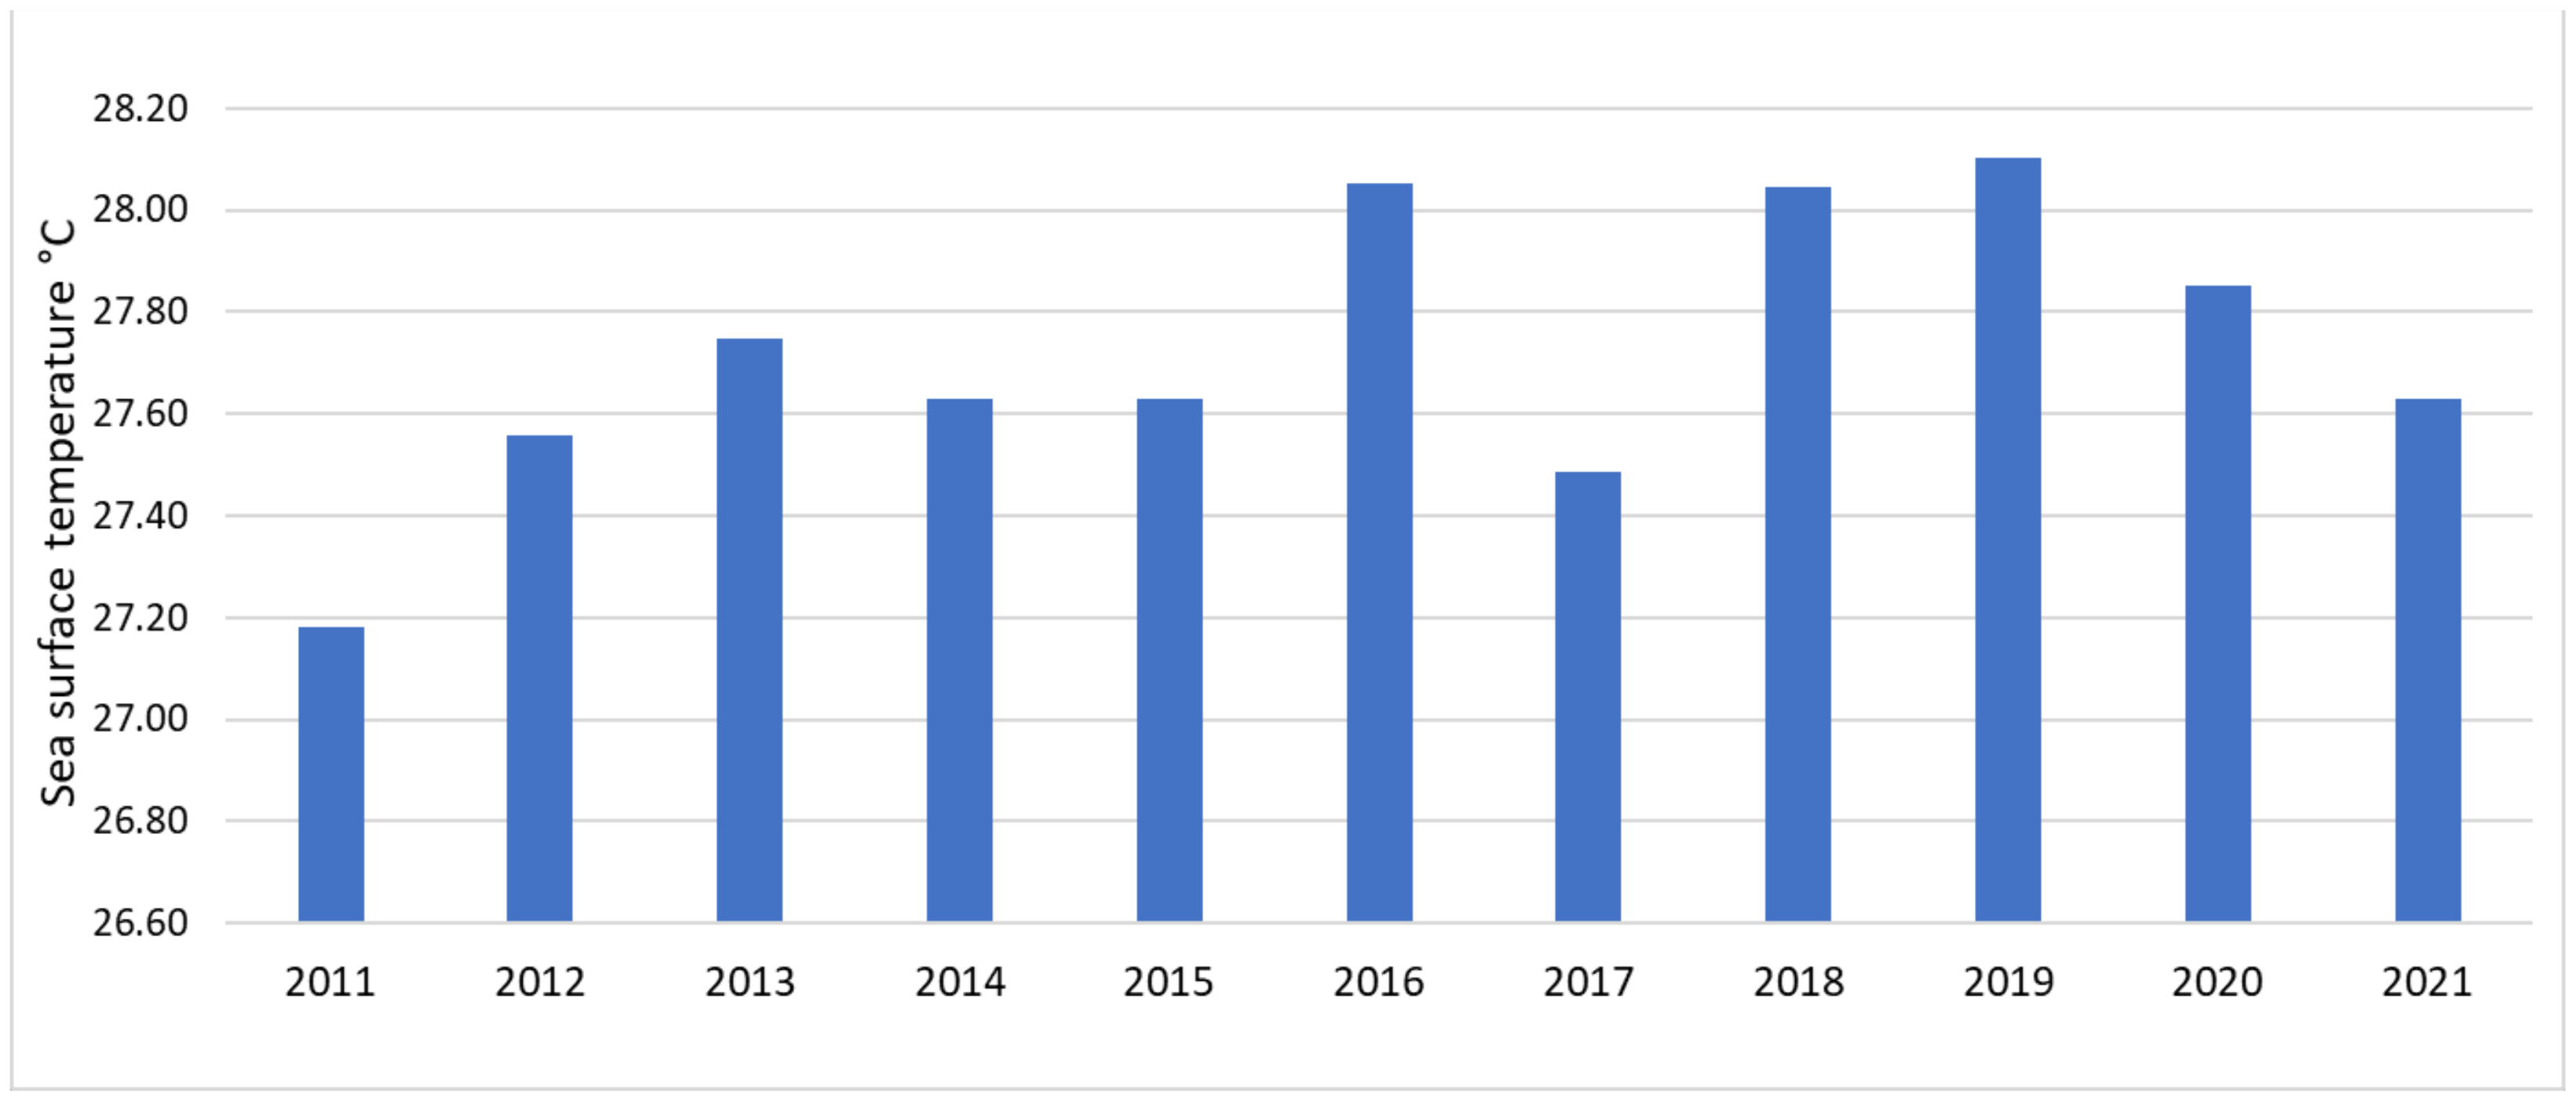
The change in sea surface temperature was studied as a primary step to show the impact of global warming on the marine environment; the sea surface temperature is considered one of the most significant environmental elements influencing the life cycle of fish [43]. Figure 3 shows the changes in SST on a monthly basis over ten years, from 2011 to 2021. It was observed that, generally, there was an increase in the temperature values from May to October, while SST started to decrease from November to April. The highest temperatures were recorded in August, while the lower values were in February and March. The average yearly values showed significant changes over the chosen 10 years. The years 2019, 2018 and 2016 had higher values, when the temperature exceeded 28 °C, while 2011 had a lower average year temperature. Those years (2019, 2018 and 2016) are considered the warmest years in terms of ocean temperatures, historically speaking [44]. The warming ocean is an indisputable fact; ocean heat content (OHC) is a crucial indicator of the Earth’s energy imbalance. Ocean temperatures are affected by global warming and other internal variabilities, such as the El Niño southern oscillation (ENSO), which contributes to the redistribution of ocean heat and the exchange between ocean and atmosphere [44]. According to [45], El Niño (the warm ENSO phase) promotes a northward shift of the Red Sea convergence zone (RSCZ) and reinforces the Red Sea trough (RST) in the same direction. In contrast, the RSCZ shifts to the south during La Niña periods in November and December (cold ENSO phase), and the RST intensifies in the same direction. During El Niño years, the stronger southeast winds over the Gulf of Aden pump warmer water from the Arabian Sea into the Red Sea, causing increased SST, evaporation, and the transport of more moisture toward the RSCZ, consequently increasing rainy days and the total amount of rainfall over the Red Sea and the Middle East. The years 2016, 2018, and 2019 reported the highest values, as shown in Figure 4; El Niño events have been observed in 2015–2016 and 2018–2019 [46,47,48]. While 2011 and 2017 were the lowest values (Figure 4), La Niña events that occurred include 2010–2011, 2016–2017, and 2020–2021 [49,50].
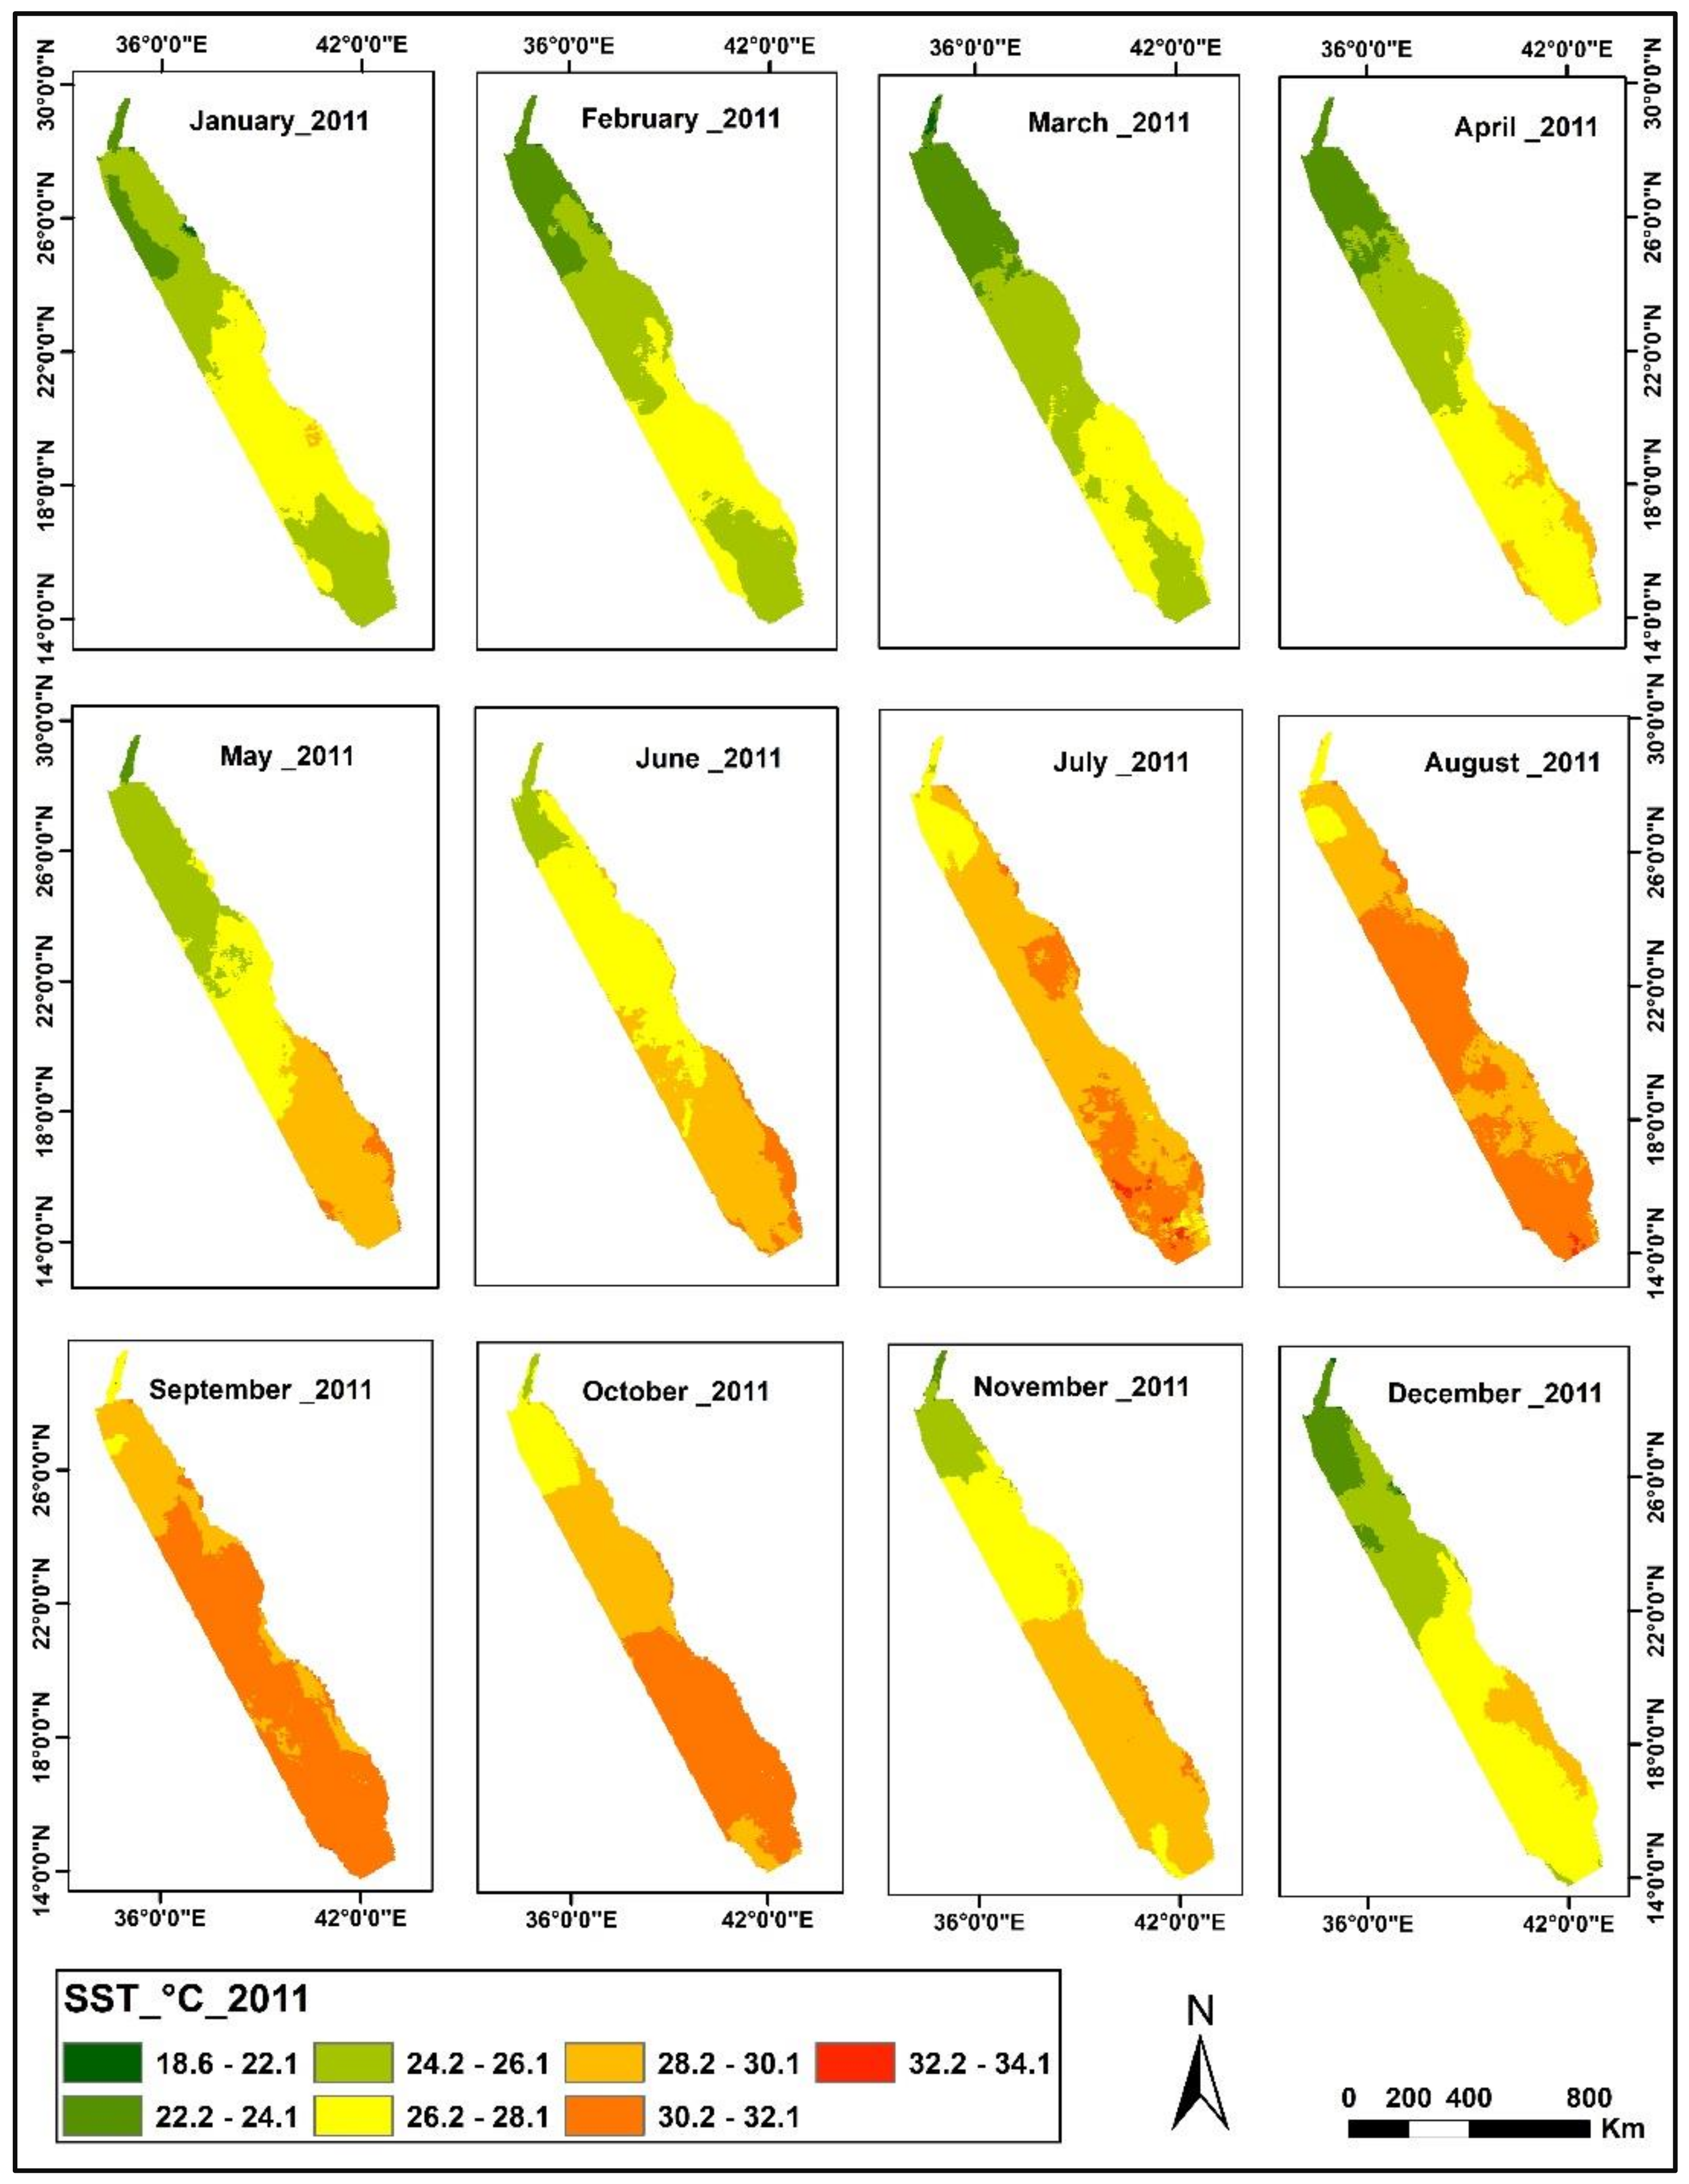
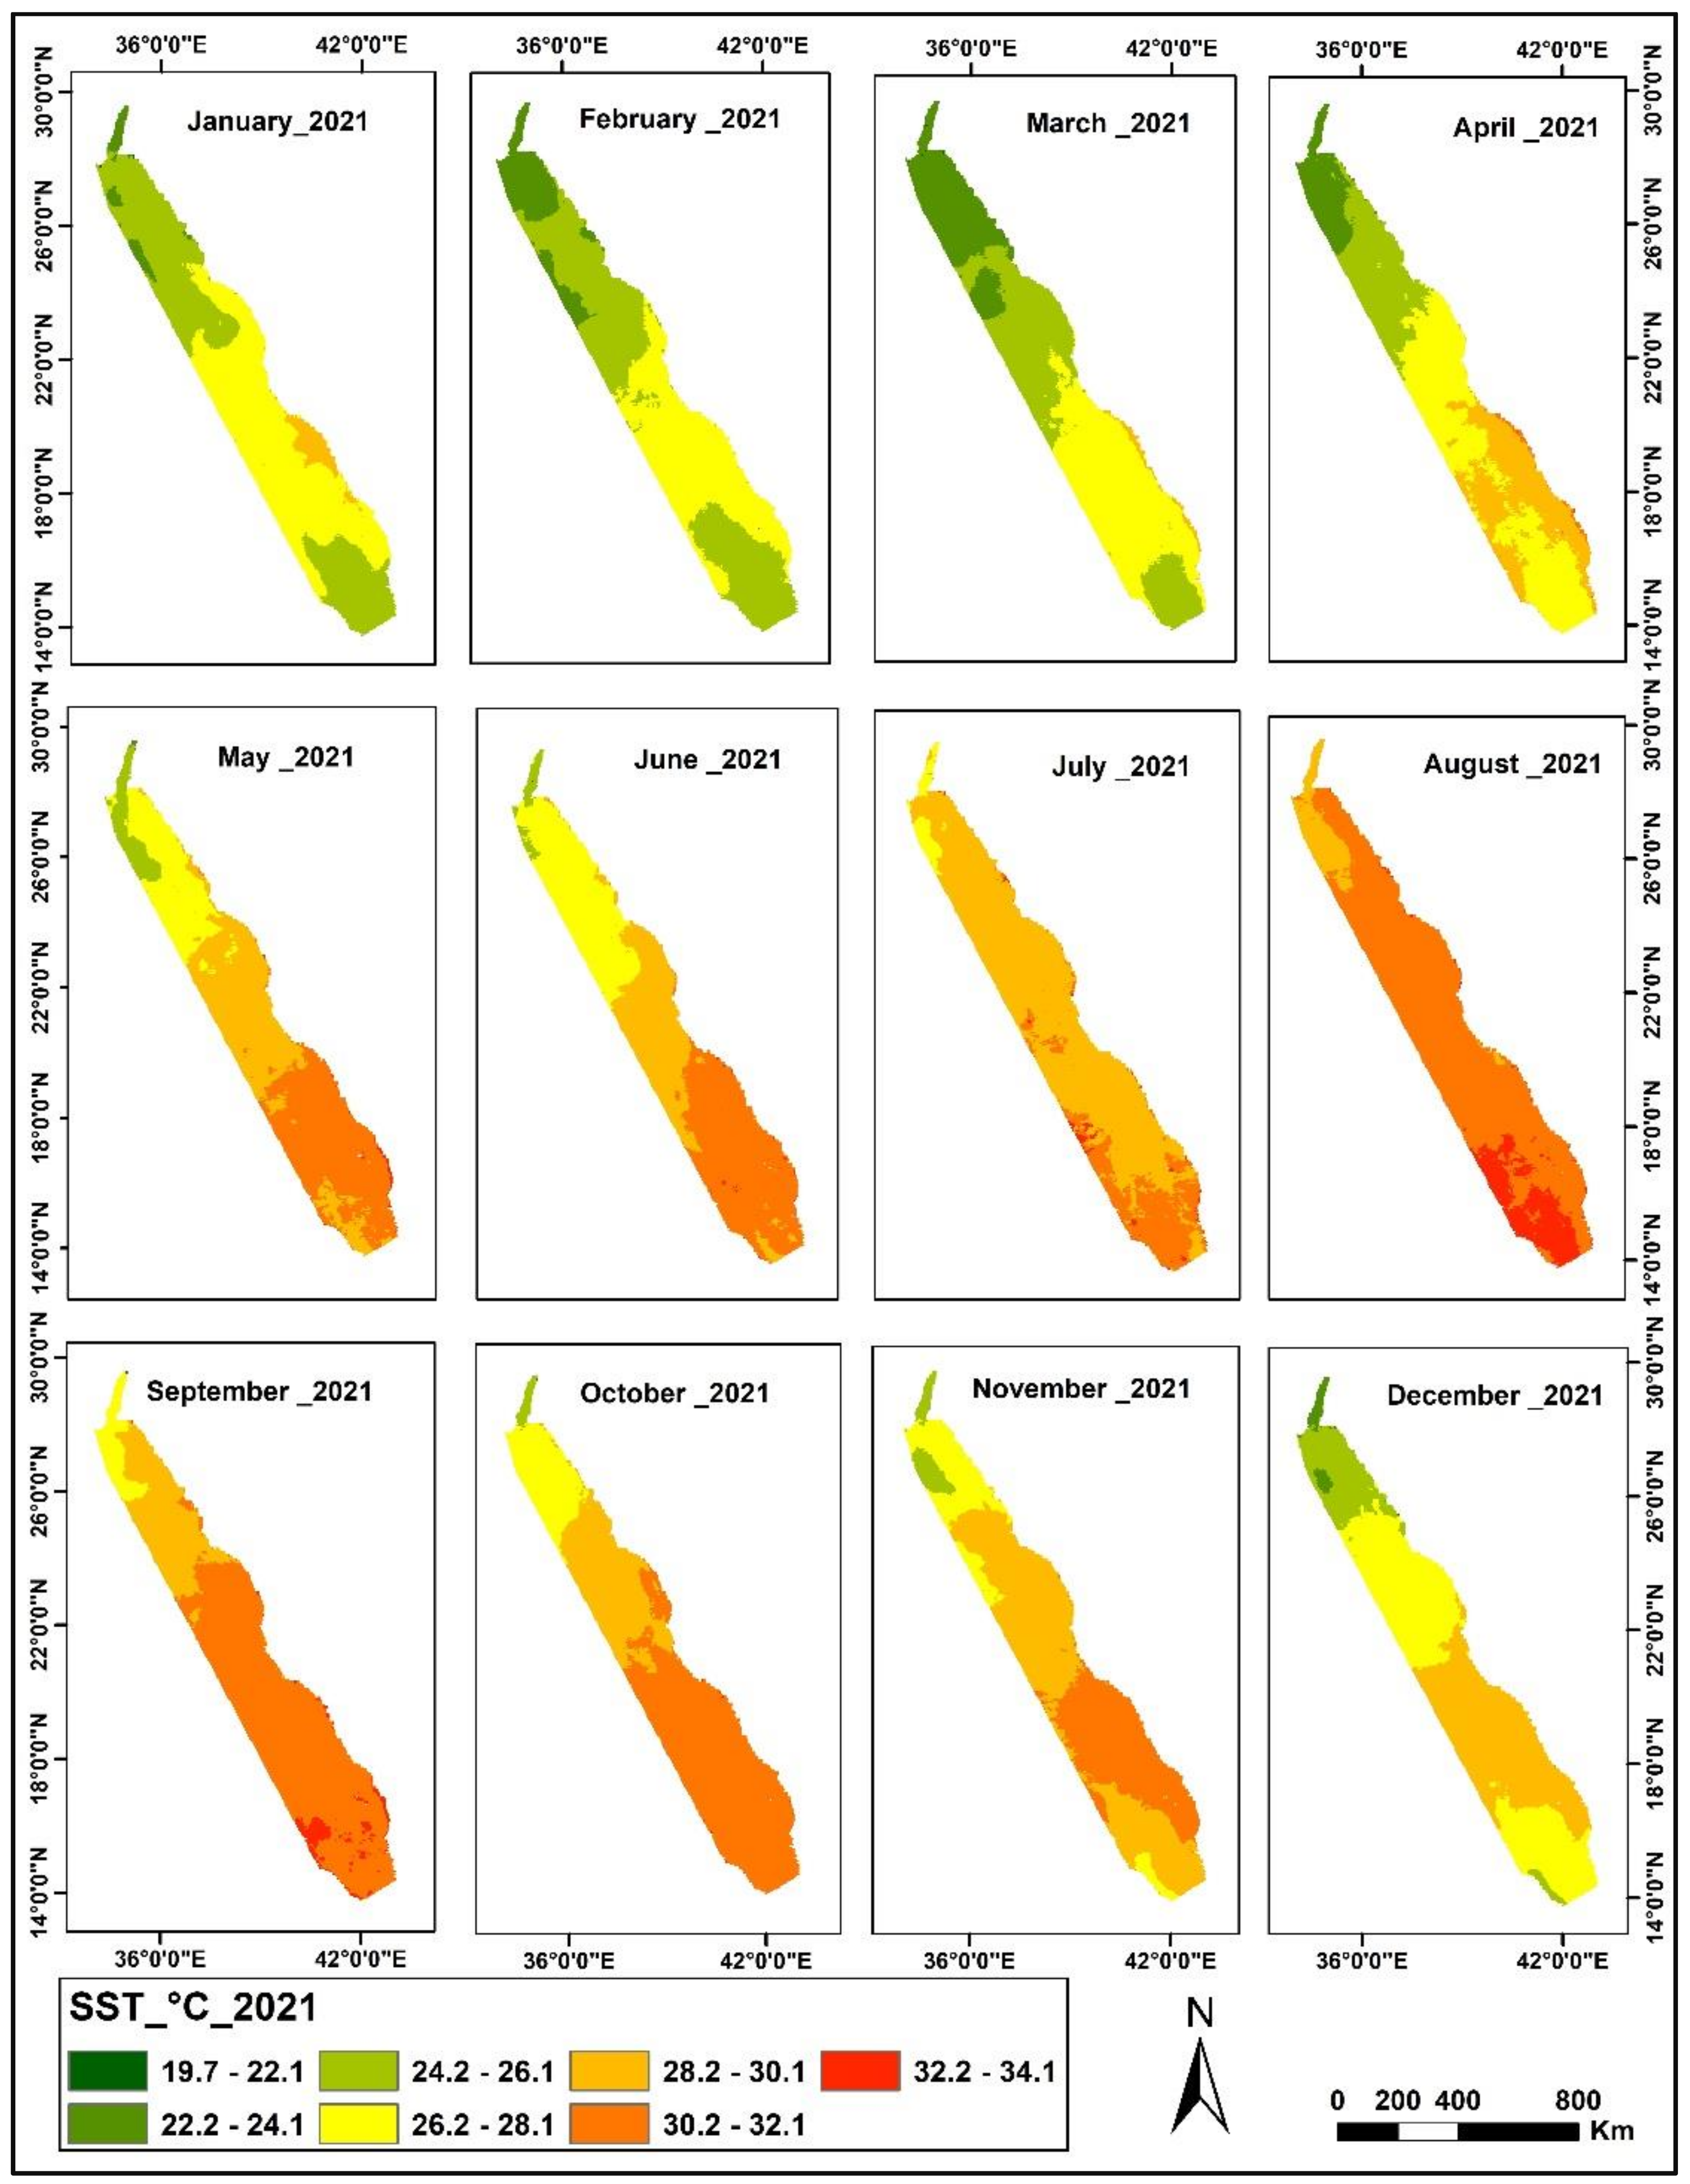
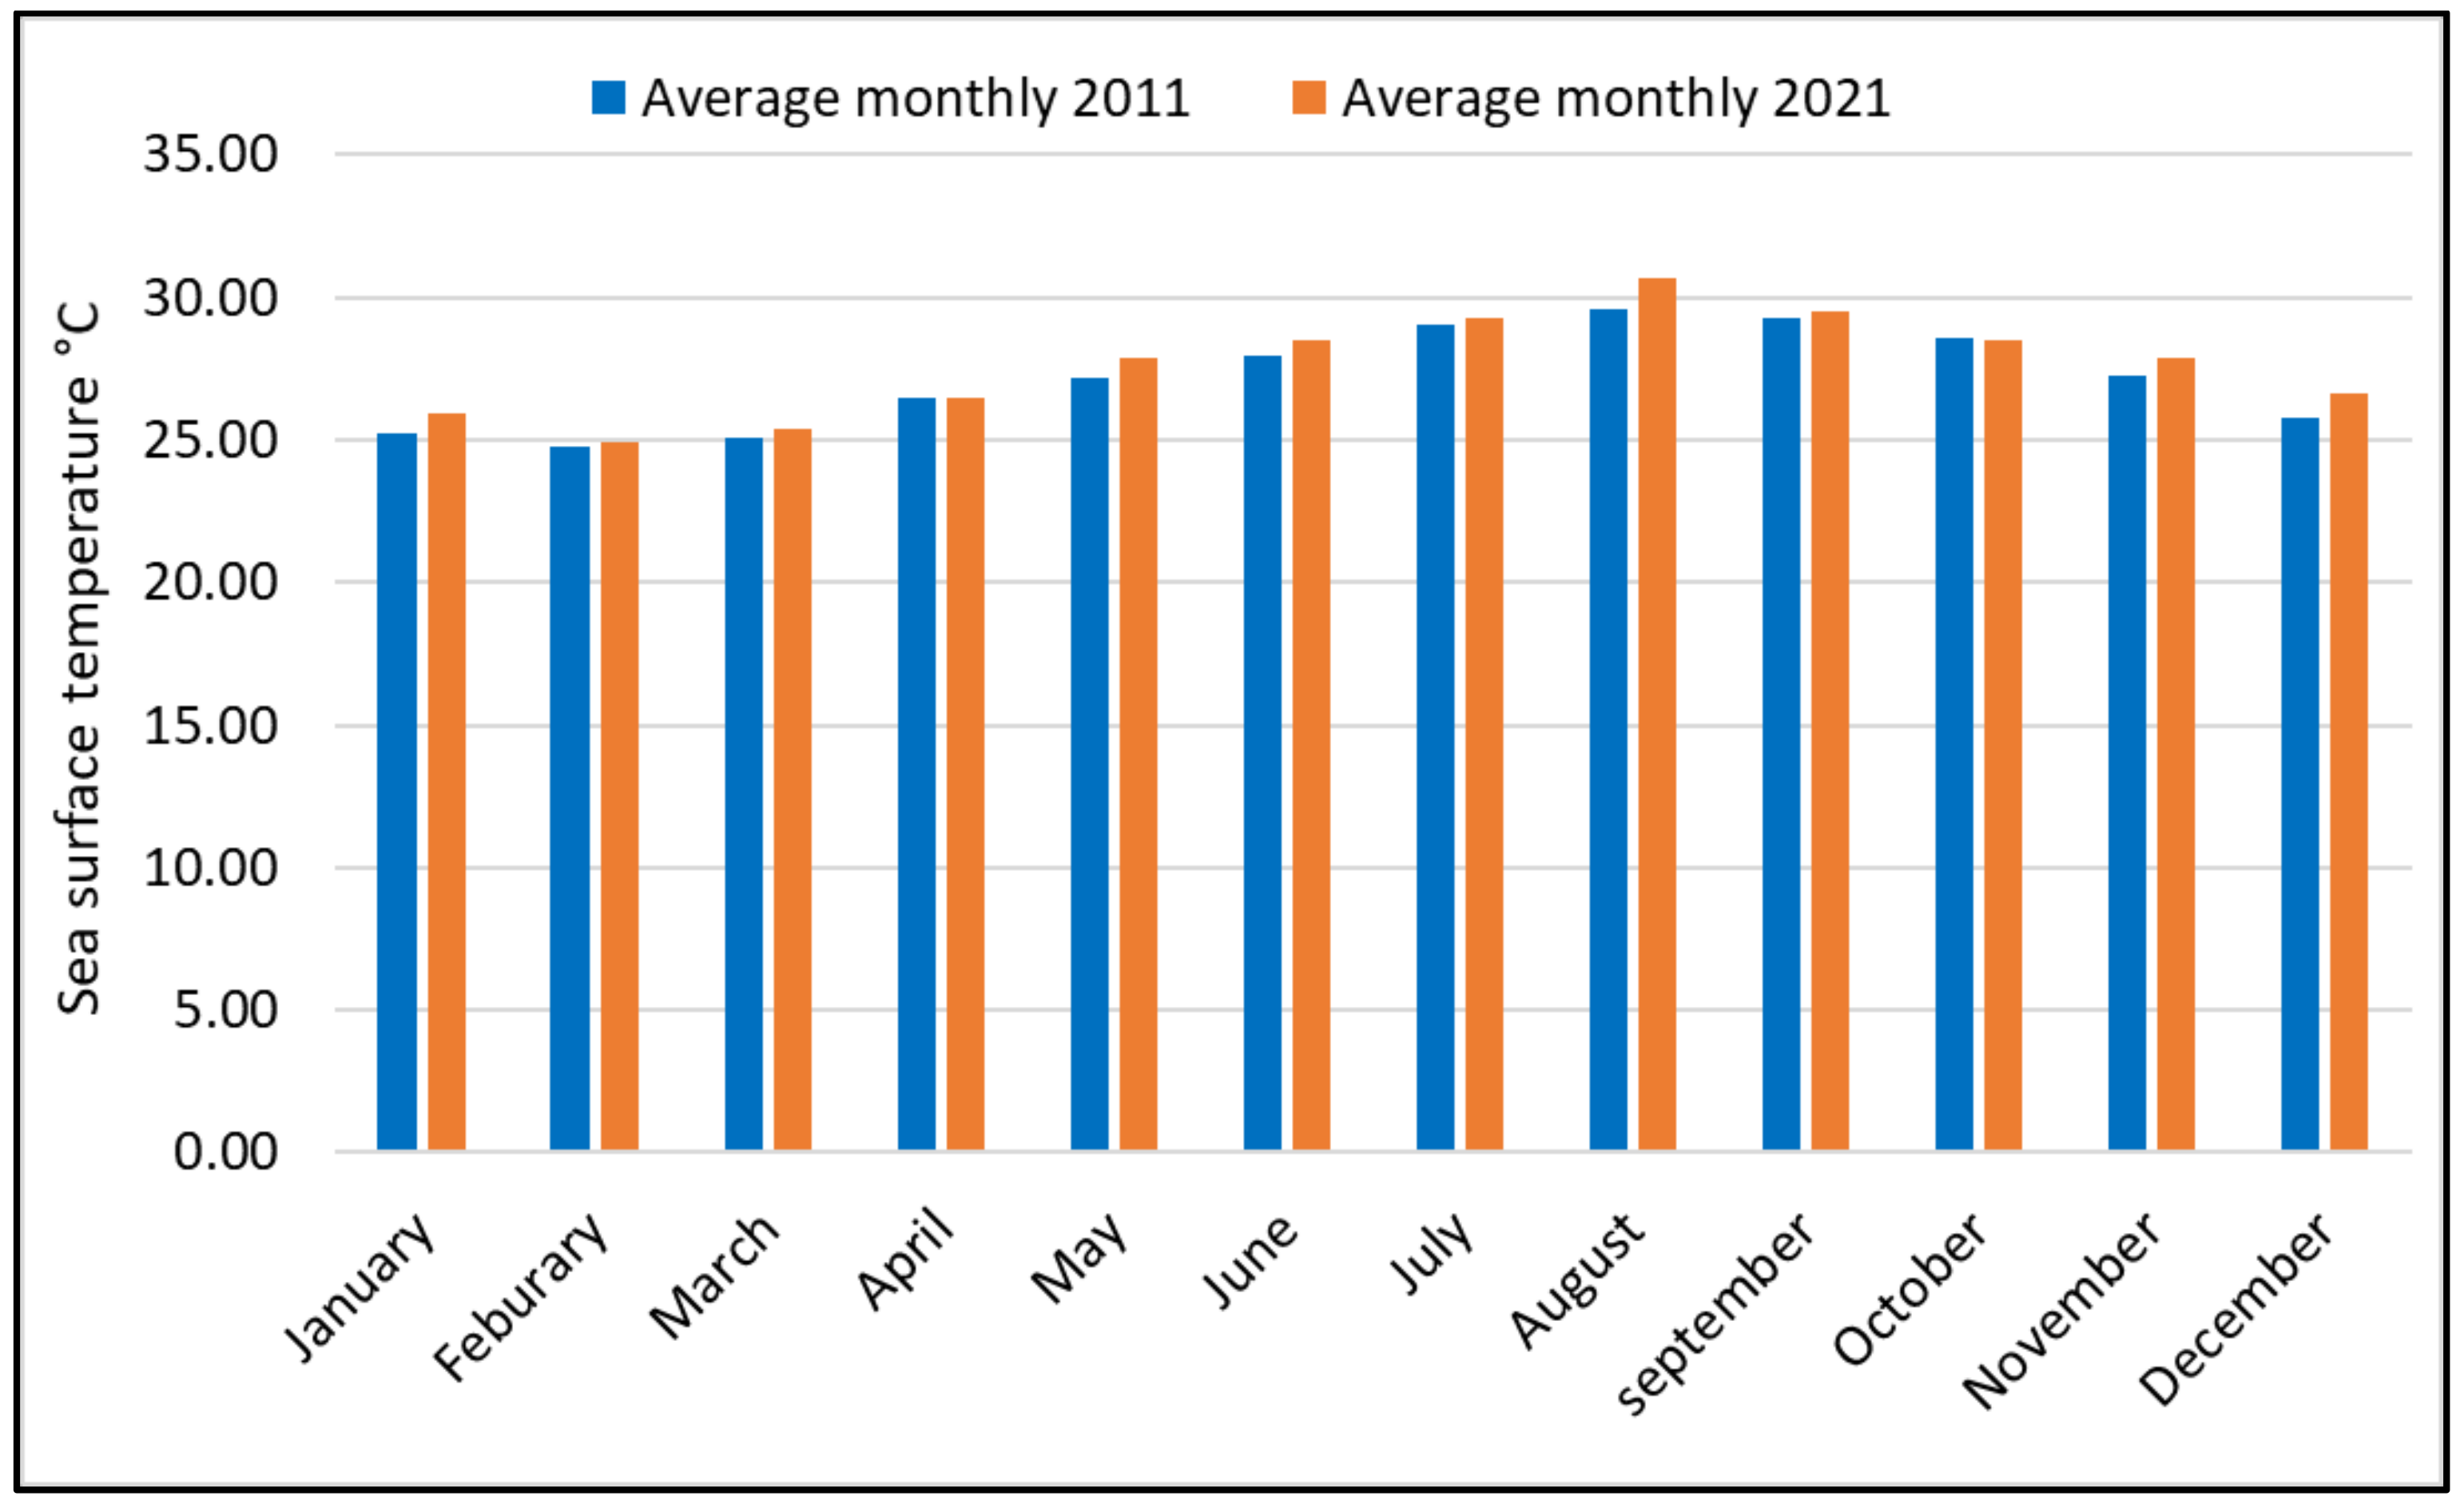
Satellite data was used to detect the sea surface temperature (SST) changes over 10 years by comparing the sea surface temperatures for 2011 and 2021. Figure 5 shows the sea surface temperatures in 2011, wherein the coldest months were from January to March and December, with temperatures between 18 and 24 °C, while the sea surface temperature started to increase from April and reached higher values in the summer months, from July to October, as the temperatures ranged from 26 °C to 34 °C. The SST of 2021 generally has the same trend as 2011 throughout the months of the year (see Figure 6 and Figure 7). August was the warmest month, while the coldest one was February. However, the temperatures of 2021 showed an increase in temperature values compared to 2011 (see Figure 6 and Figure 7). Although the years 2011 and 2021 were included in the La Niña events, 2011 showed a higher SST than 2011 (see Figure 7 and Figure 8). The average yearly sea surface temperature increased by about 0.46 °C from 2011 to 2021, when it rose from 27.18 °C to 27.64 °C (Figure 8). Moreover, it was observed that the increasing trend is from the south (high rates of temperature) to the north, where the lowest temperature was recorded (Figure 5 and Figure 6). The increased water surface temperature for 2021 (see Figure 7 and Figure 8) is more probably related to global heating than the ENSO events, since the two years of 2011 and 2021 are included in the La Niña events (the cold ENSO phase) [49,50]. Global warming due to heattrapping has a significant potential for raising SST as more than 90% of the heat accumulates in the ocean due to its large heat capacity [44]. Increasing the sea surface temperature by about 0.46 °C, from 2011 to 2021, may affect the spawning seasons (from April to July) as the spawning temperature range is between 25 and 26.5 °C [51]. Moreover, shifts in spawning areas may occur as the increasing pattern of sea surface temperature is gradually extended from south to north. Changes in the spawning season and spawning area (latitude) leads to changes in the growth rates [52]. According to [53], the increase in sea surface temperature impacts enzymatic activity, metabolism, feed intake, feeding behavior, growth, and the survival of different fish species, subsequently altering the availability, the abundance of fish, and the fishing season’s rhythm. Moreover, warming ocean temperature has a reversing effect on dissolved oxygen, which significantly affects marine life, particularly corals and other sensitive organisms [54,55].

3.2. Suitability Map of Spatial Potential Aggregation Zones

P. areolatus and P. pessuliferus marisrubri are located along the Saudi Red Sea coast, while the larger individuals are found in southern parts because of lower fishing pressure [29]. The suitability map was classified into three classes, based on the reported favored temperature values for P. pessuliferus marisrubri and P. areolatus. The suitable class of temperature values was from 22 °C to 30 °C, whereas values lower than 22 °C were classified as "less suitable—cold”, indicating cooler weather conditions, while higher values of temperature than 30 °C were classified as “less suitable—warm”, reflecting the less preferable warm conditions. Figure 9 and Figure 10 show the distribution of the three classes along the coast for 2011 and 2021, respectively. The suitability map of 2021 showed a decrease in the suitable class (green color) from April to November, which is related to an increase in the less suitable—warm class (red color), compared to 2011. Furthermore, the suitable class shown for 2021 demonstrated an increase from January to March and December, compared to 2011. This increase is attributed to the decrease in the less suitable—cold class. The suitability maps showed that the increase in the less suitable—warm class areas was gradually distributed from the southern to the northern parts of the Red Sea, which is correlated to the increasing pattern of SST (see Figure 6). The results revealed the negative impact of Red Sea warming rates for 2021 on the location area (latitude) of P. pessuliferus marisrubri and P. areolatus. The decrease in the suitable class from April to November 2021, compared to 2011, is due to the rise in SST, as it exceeded 30 °C at that point. Moreover, the increase in the suitable class areas that occurred in 2021 from January to March and in December reflects the fact that the temperature reached the appropriate warm temperatures compared to the colder temperatures of 2011 for the same months. Changing the sea surface temperature altered the abundance areas, as they shifted gradually from the southern to northern latitudes. Changes in the aggregation zone latitudes and areas (decreasing gradually to the north) may not have a significant impact on fish markets at the present time, as the high-population-density areas are more concentrated in the center and the north than in the south, where the fishing pressure is lower. In addition, the high-demand regions are near Jaddah, which is supplied by stocks from the north and central regions [29]. However, shrinking the aggregation areas may result in the fishing of smaller individuals (juveniles) before reproduction occurs, as 60% of P. pessuliferus marisrubri and P. areolatus in the Jeddah fish market are of a size below that of mature fish [31]. This will subsequently threaten the abundance of P. pessuliferus marisrubri and P. areolatus in the Red Sea. However, the lack of fishery data according to the regions along the Saudi Arabian coastline has restricted further analysis and comparison to show the effect of warming temperatures on the environmental conditions and, subsequently, the aggregation zones.

3.3. Risk Map of Potential Aggregation Zones

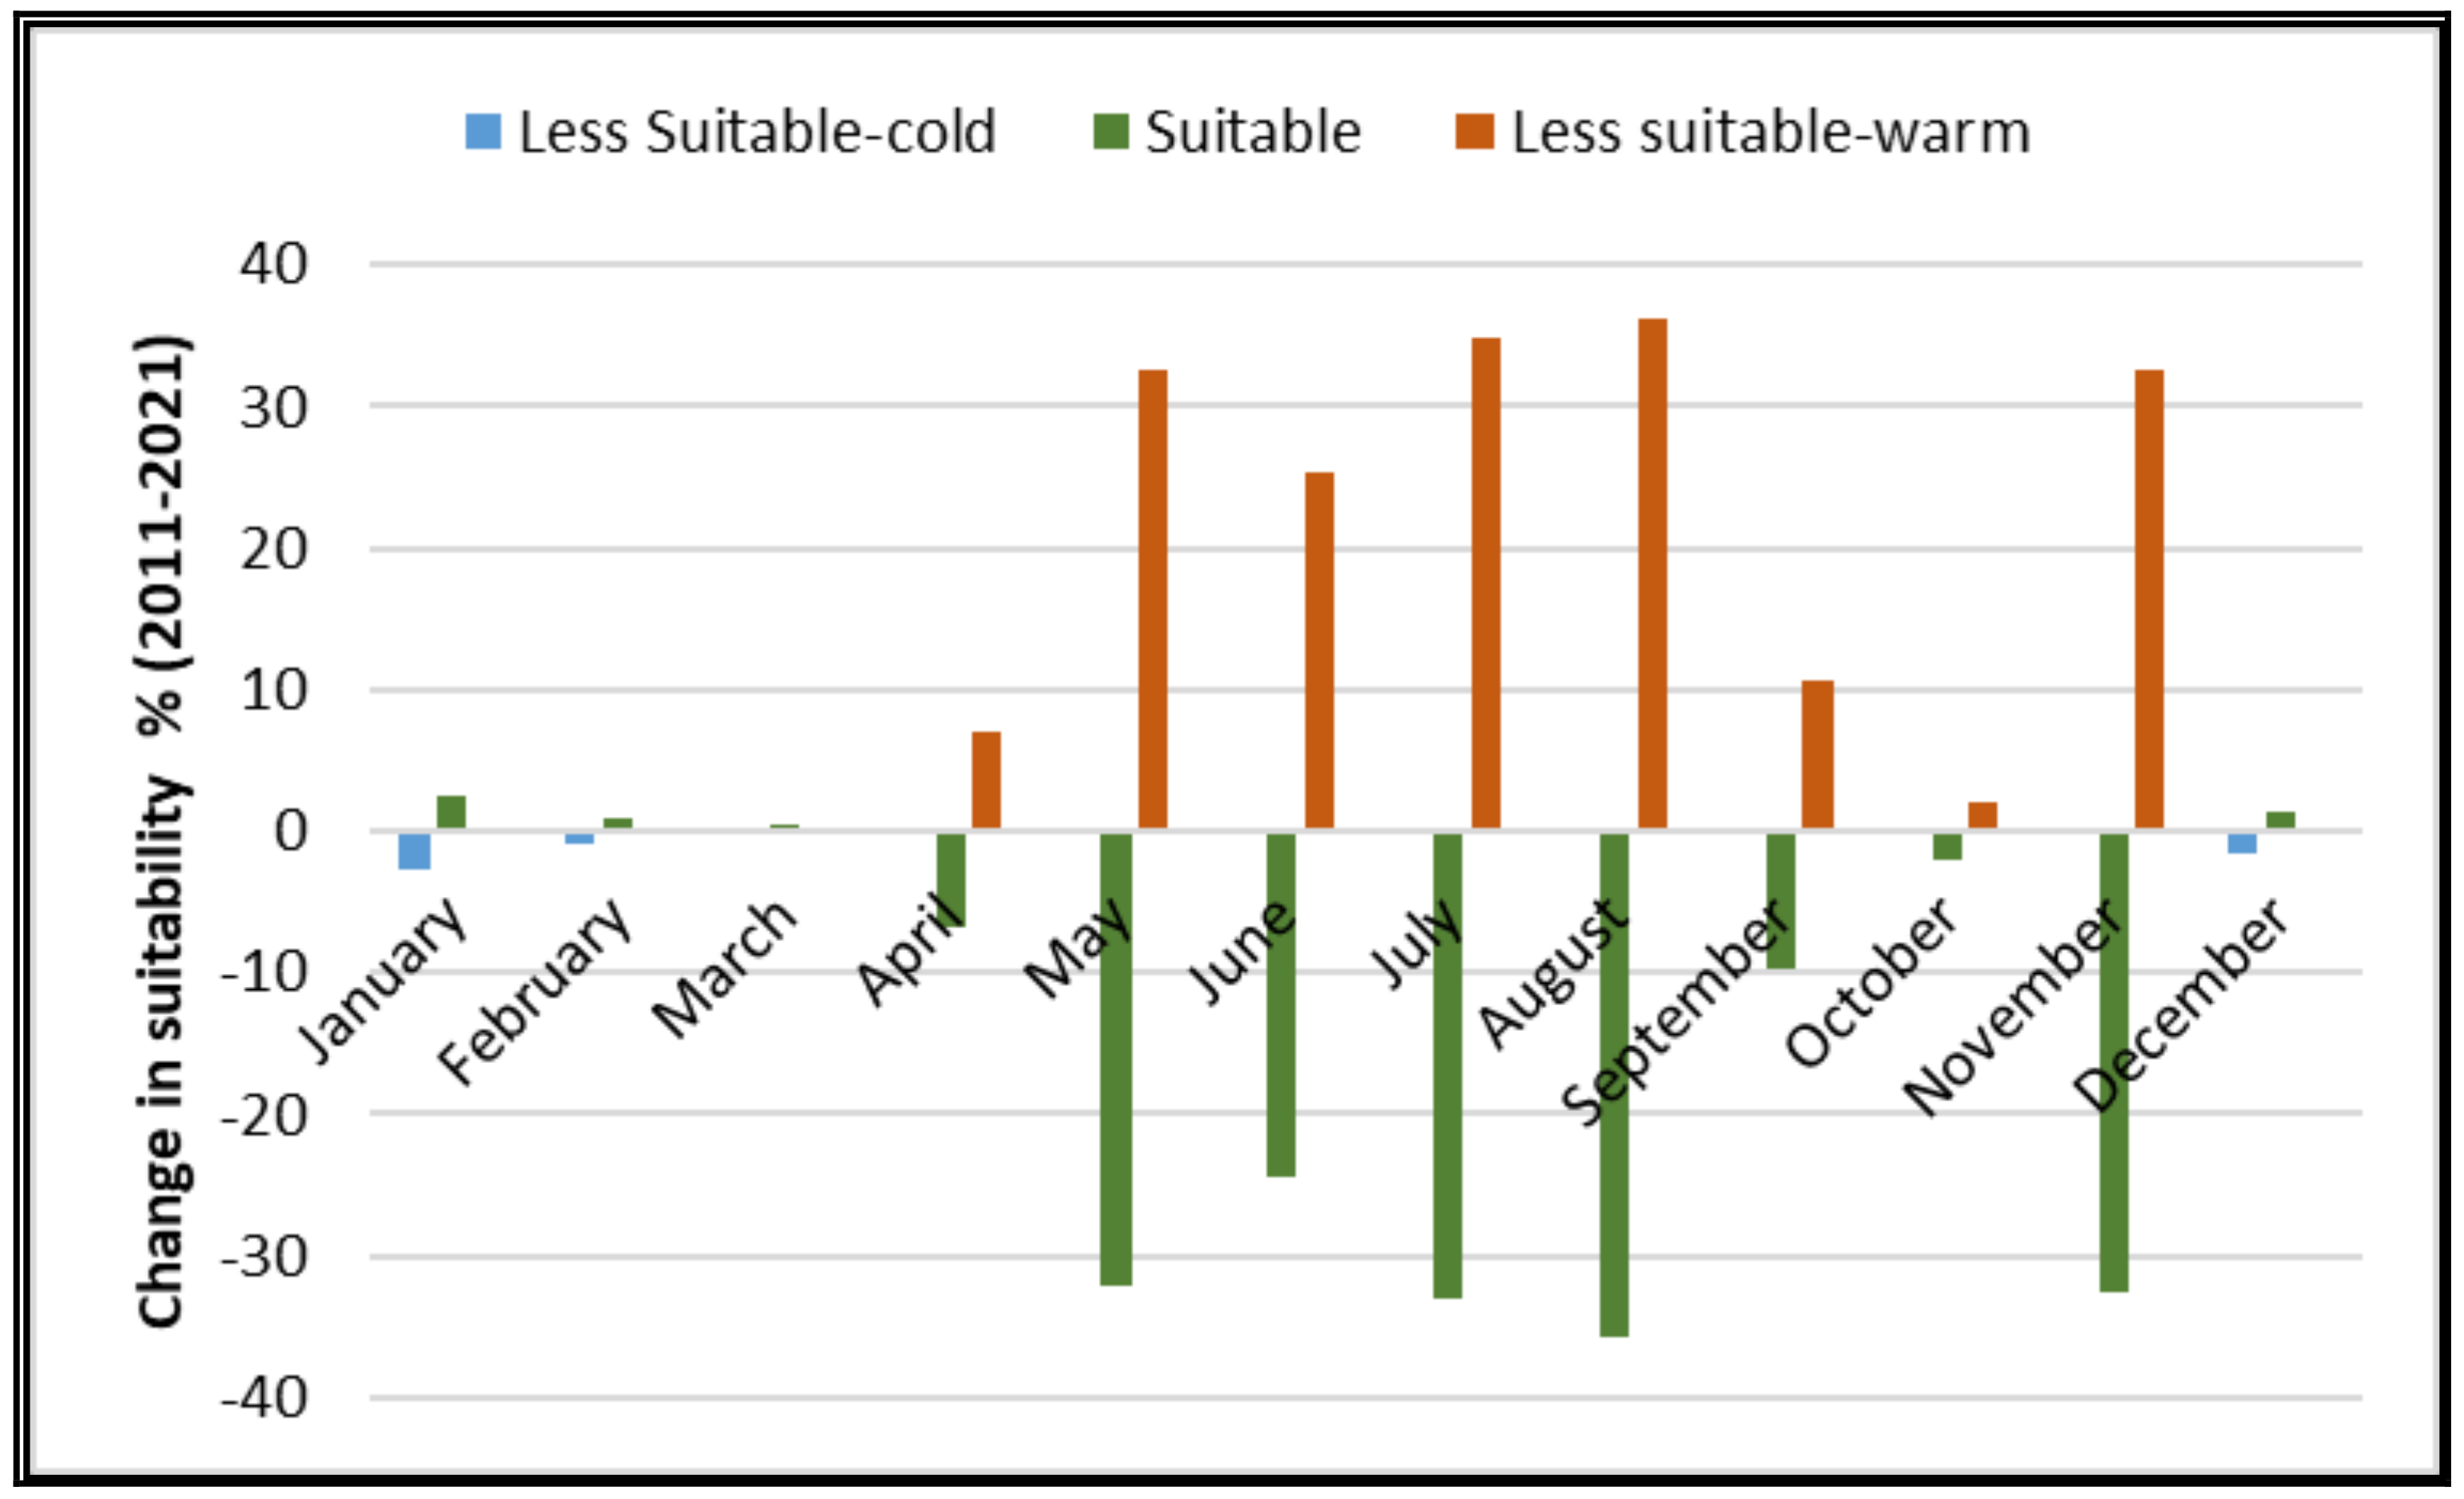
The risk map of the spatial potential zones has been developed to show the increase in risk zones (unfavorable conditions of aggregation), revealing the decrease in the fish aggregation locations. Figure 11 shows a gradual increase in the risk zones (unfavorable conditions of aggregation) from April to August as they reached a higher rate of increasing (see Figure 12), while the risk zones showed a gradual decrease for September and October and increased in November. The increasing risk zones showed a gradual expansion pattern from south to north, as the SST shows in Figure 6, indicating the significant impact of sea warming. According to Figure 11 and Figure 12, the spatial favorable potential areas decreased for 2021 compared to 2011 for the months from April to November as the sea surface temperature became warmer (>30 °C). Consequently, the risk zones (unfavorable conditions of aggregation) increased. A higher decreasing rate of potential aggregation areas for 2021 was recorded in August at −35.7%, and the lower rate was 2.1% in October (see Figure 12). An increase in the suitable potential aggregation areas was estimated from January to March and December, as the higher rate was recorded at 2.52% in January (see Figure 12). However, the decrease in the suitable potential aggregation zones is much greater, as it is about 14 times the increasing rate. The results indicated that the greater decrease in suitable potential zones was impacted by the increase in SST, due to global warming and climate change. Changes in environmental conditions may have an impact on fishing resources, including recruitment, dispersion, abundance, and availability. Moreover, the decrease in spatial aggregation areas (latitude), shrinking gradually to the north parts, shifts the spawning sessions as the fish move according to the ambient sea surface temperature, which affects the fishes’ growth and fishing sessions. The decline in abundance areas of P. pessuliferus marisrubri and P. areolatus, due to the environmental conditions, can be considered a major threat to biodiversity and fisheries resources, and will cause economic losses. However, overexploitation is also a major threat to the fisheries’ resources as P. pessuliferus marisrubri and P. areolatus are highly valued and high-demand fish species in Saudi Arabia. Recently, the fish sizes seen in the fish markets have been smaller than the full maturation size, indicating heavy harvesting before they even have the opportunity to reproduce [31]. Subsequently, a “shrinking baseline” [56] could occur as the abundance of smaller fish sizes in markets increase over time, leading to the unsustainability of fishery resources. Therefore, the Red Sea marine reserves need to be restored and different management techniques should be used to conserve all population stocks.

4. Conclusions

Remote sensing has proved to be an effective way of determining the SST changes and the impact of that change over a long period; it is a significant environmental indicator of climate change, affecting the reproduction of marine organisms and the growth of fish. This study has used SST satellite images for 2011 and 2021 to detect the changes, develop suitability maps, and evaluate the SST changes’ impacts on the spatial potential aggregation zones of P. pessuliferus and P. areolatus along the Saudi Arabia Red Sea coast. A significant increase in the average yearly value of the SST range has increased by about 0.46 °C from 2011 to 2021. The risk assessment maps reflected the impact of SST changes as the suitable potential aggregation zones decreased by about 35.7% in August 2021, compared to 2011. The increase in risk zones showed a gradual expansion pattern from south to north as the SST increased in southern parts, compared to the central and northern regions. The study showed that changes in environmental conditions, such as SST, affect the spatial distribution, abundance, and availability of fishery resources. This study has provided an approach to tracking and assessing SST changes, a strong indicator of climate change that affects marine habitats, raising the alarm for decision-makers to develop sustainable plans that preserve the marine environment and, as a result, food security and economic income.

Author Contributions

Conceptualization, N.K.; Methodology, N.K. and M.S.R.; Software, R.H.R., I.Y.I. and M.S.R.; Validation, N.K., R.H.R. and M.S.R.; Formal analysis, M.S.R.; Investigation, N.K.; Data curation, R.H.R.; Writing—review & editing, N.K.; Visualization, R.H.R.; Funding acquisition, H.M.A. and I.I.A. All authors have read and agreed to the published version of the manuscript.

Funding

This research was funded by Princess Nourah bint Abdulrahman University Researchers Supporting Project number (PNURSP2022R243), Princess Nourah bint Abdulrahman University, Riyadh, Saudi Arabia.

Institutional Review Board Statement

Not applicable.

Informed Consent Statement

Not applicable.

Data Availability Statement

Not applicable.

Conflicts of Interest

The authors declare no conflict of interest.

References

  1. Bell, J.D.; Kronen, M.; Vunisea, A.; Nash, W.J.; Keeble, G.; Demmke, A.; Pontifex, S.; Andréfouët, S. Planning the use of fish for food security in the Pacific. Mar. Policy 2009, 33, 64–76. [Google Scholar] [CrossRef] [Green Version]
  2. Gillett, R. Fisheries in the Economies of the Pacific Island Countries and Territories; Asian Development Bank: Mandaluyong City, Philippines, 2009. [Google Scholar]
  3. Bell, J.D.; Reid, C.; Batty, M.J.; Lehodey, P.; Rodwell, L.; Hobday, A.J.; Johnson, J.E.; Demmke, A. Effects of climate change on oceanic fisheries in the tropical Pacific: Implications for economic development and food security. Clim. Chang. 2013, 119, 199–212. [Google Scholar] [CrossRef]
  4. IPCC. Contribution of Working Group II to the Fourth Assessment Report of the Intergovernmental Panel on Climate Change. In Climate Change 2007: Impacts, Adaptation and Vulnerability; Parry, M.L., Canziani, O.F., Palutikof, J.P., van der Linden, P.J., Hanson, C.E., Eds.; Cambridge University Press: Cambridge, UK, 2017; 976p. [Google Scholar]
  5. IPCC. An IPCC Special Report on the impacts of global warming of 1.5 °C above pre-industrial levels and related global greenhouse gas emission pathways, in the context of strengthening the global response to the threat of climate change, sustainable development, and efforts to eradicate poverty. In 2018: Global Warming of 1.5 °C.; Masson-Delmotte, V., Zhai, P., Pörtner, H.-O., Roberts, D., Skea, J., Shukla, P.R., Pirani, A., Moufouma-Okia, W., Péan, C., Pidcock, R., Eds.; Cambridge University Press: Cambridge, UK; New York, NY, USA, 2018; 616p. [Google Scholar] [CrossRef]
  6. Barros, A.F.; Campos, V.P.; da Silva, J.C.P.; Lopez, L.E.; da Silva, A.P.; Pozza, E.A.; Pedroso, L.A. Tempo de exposição de juvenis de segundo estádio a voláteis emitidos por macerados de nim e de mostarda e biofumigação contra Meloidogyne incognita. Nematropica 2014, 44, 190–199. [Google Scholar]
  7. Philippart, C.J.; Anadón, R.; Danovaro, R.; Dippner, J.W.; Drinkwater, K.F.; Hawkins, S.J.; Oguz, T.; O’Sullivan, G.; Reid, P.C. Impacts of climate change on European marine ecosystems: Observations, expectations and indicators. J. Exp. Mar. Biol. Ecol. 2011, 400, 52–69. [Google Scholar] [CrossRef]
  8. Belkin, I.M. Rapid warming of large marine ecosystems. Prog. Oceanography. 2009, 81, 207–213. [Google Scholar] [CrossRef]
  9. Riegl, B.M.; Bruckner, A.W.; Rowlands, G.P.; Purkis, S.J.; Renaud, P. Red Sea coral reef trajectories over 2 decades suggest increasing community homogenization and decline in coral size. PLoS ONE 2012, 7, e38396. [Google Scholar] [CrossRef] [PubMed]
  10. Hughes, T.P.; Anderson, K.D.; Connolly, S.R.; Heron, S.F.; Kerry, J.T.; Lough, J.M.; Baird, A.H.; Baum, J.K.; Berumen, M.L.; Bridge, T.C.; et al. Spatial and temporal patterns of mass bleaching of corals in the Anthropocene. Science 2018, 359, 80–83. [Google Scholar] [CrossRef] [Green Version]
  11. Raitsos, D.E.; Hoteit, I.; Prihartato, P.K.; Chronis, T.; Triantafyllou, G.; Abualnaja, Y. Abrupt warming of the Red Sea. Geophys. Res. Lett. 2011, 38. [Google Scholar] [CrossRef] [Green Version]
  12. Hoegh-Guldberg, O.; Bruno, J.F. The impact of climate change on the world’s marine ecosystems. Science 2010, 328, 1523–1528. [Google Scholar] [CrossRef] [PubMed]
  13. Stocker, T. (Ed.) Climate Change 2013: The Physical Science Basis: Working Group I Contribution to the Fifth Assessment Report of the Intergovernmental Panel on Climate Change; Cambridge University Press: Cambridge, UK, 2014. [Google Scholar]
  14. Rogers, A.; Blanchard, J.L.; Mumby, P.J. Vulnerability of coral reef fisheries to a loss of structural complexity. Curr. Biol. 2014, 24, 1000–1005. [Google Scholar] [CrossRef] [PubMed]
  15. Deutsch, C.; Ferrel, A.; Seibel, B.; Pörtner, H.O.; Huey, R.B. Climate change tightens a metabolic constraint on marine habitats. Science 2015, 348, 1132–1135. [Google Scholar] [CrossRef] [Green Version]
  16. Portner, H.O.; Knust, R. Climate change affects marine fishes through the oxygen limitation of thermal tolerance. Science 2007, 315, 95–97. [Google Scholar] [CrossRef] [Green Version]
  17. Comte, L.; Olden, J.D. Climatic vulnerability of the world’s freshwater and marine fishes. Nat. Clim. Change 2017, 7, 718–722. [Google Scholar] [CrossRef]
  18. Pauly, D. On the interrelationships between natural mortality, growth parameters, and mean environmental temperature in 175 fish stocks. ICES J. Mar. Sci. 1980, 39, 175–192. [Google Scholar] [CrossRef]
  19. Lenoir, J.; Bertrand, R.; Comte, L.; Bourgeaud, L.; Hattab, T.; Murienne, J.; Grenouillet, G. Species better track climate warming in the oceans than on land. Nat. Ecol. Evol. 2020, 4, 1044–1059. [Google Scholar] [CrossRef] [PubMed]
  20. Perry, A.L.; Low, P.J.; Ellis, J.R.; Reynolds, J.D. Climate change and distribution shifts in marine fishes. Science 2005, 308, 1912–1915. [Google Scholar] [CrossRef] [PubMed]
  21. Dulvy, N.K.; Rogers, S.I.; Jennings, S.; Stelzenmüller, V.; Dye, S.R.; Skjoldal, H.R. Climate change and deepening of the North Sea fish assemblage: A biotic indicator of warming seas. J. Appl. Ecol. 2008, 45, 1029–1039. [Google Scholar] [CrossRef]
  22. Nye, J.A.; Link, J.S.; Hare, J.A.; Overholtz, W.J. Changing spatial distribution of fish stocks in relation to climate and population size on the Northeast United States continental shelf. Mar. Ecol. Prog. Ser. 2009, 393, 111–129. [Google Scholar] [CrossRef] [Green Version]
  23. Mueter, F.J.; Litzow, M.A. Sea ice retreat alters the biogeography of the Bering Sea continental shelf. Ecol. Appl. 2008, 18, 309–320. [Google Scholar] [CrossRef] [Green Version]
  24. Last, P.R.; White, W.T.; Gledhill, D.C.; Hobday, A.J.; Brown, R.; Edgar, G.J.; Pecl, G. Long-term shifts in abundance and distribution of a temperate fish fauna: A response to climate change and fishing practices. Glob. Ecol. Biogeogr. 2010, 20, 58–72. [Google Scholar] [CrossRef]
  25. Sumaila, U.R.; Cheung, W.W.; Lam, V.W.; Pauly, D.; Herrick, S. Climate change impacts on the biophysics and economics of world fisheries. Nat. Clim. Change 2011, 1, 449–456. [Google Scholar] [CrossRef]
  26. Heemstra, P.C.; Randall, J.E. Groupers of the World. FAO Fish. Synop. 1993, 16, 382. [Google Scholar]
  27. Russ, G.R.; Lou, D.C.; Higgs, J.B.; Ferreira, B.P. Mortality rate of a cohort of the coral trout, Plectropomus leopardus, in zones of the Great Barrier Reef Marine Park closed to fishing. Mar. Freshw. Res. 1998, 49, 507–511. [Google Scholar] [CrossRef]
  28. Choat, J.H.; Amorim, P.; Law, C.; Ma, K.; Myers, R.; Nair, R.; Pollard, D.A.; Rhodes, K.; Russell, B.; Samoilys, M.; et al. Plectropomus pessuliferus. IUCN Red List. Threat. Species 2018, e.T118359431A100469254. [Google Scholar] [CrossRef]
  29. DesRosiers, N. Growth and Maturation of Plectropomus spp. in the Saudi Arabian Red Sea. Ph.D. Thesis, King Abdullah University of Science and Technology, Thuwal, Saudi Arabia, 2011. [Google Scholar]
  30. Burger, J.; Gochfeld, M.; Batang, Z.; Alikunhi, N.; Al-Jahdali, R.; Al-Jebreen, D.; Aziz, M.A.; Al-Suwailem, A. Fish consumption behavior and rates in native and non-native people in Saudi Arabia. Environ. Res. 2014, 133, 141–148. [Google Scholar] [CrossRef] [Green Version]
  31. Shellem, C.T.; Ellis, J.I.; Coker, D.J.; Berumen, M.L. Red Sea fish market assessments indicate high species diversity and potential overexploitation. Fish. Res. 2021, 239, 105922. [Google Scholar] [CrossRef]
  32. Johansen, J.L.; Messmer, V.; Coker, D.J.; Hoey, A.S.; Pratchett, M.S. Increasing ocean temperatures reduce activity patterns of a large commercially important coral reef fish. Glob. Change Biol. 2014, 20, 1067–1074. [Google Scholar] [CrossRef]
  33. Johansen, J.L.; Pratchett, M.S.; Messmer, V.; Coker, D.J.; Tobin, A.J.; Hoey, A.S. Large predatory coral trout species unlikely to meet increasing energetic demands in a warming ocean. Sci. Rep. 2015, 5, srep13830. [Google Scholar] [CrossRef] [PubMed] [Green Version]
  34. Prachett, M.S.; Messmer, V.; Reynolds, A.; Martin, J.; Clark, T.D.; Munday, P.L.; Tobin, A.J.; Hoey, A.S. Effects of Climate Change on Reproduction, Larval Development, and Adult Health of Coral Trout (Plectropomus spp.); Project Report; Fisheries Research and Development Corporation: Deakin West, Australia, 2013. [Google Scholar]
  35. Pratchett, M.S.; Cameron, D.S.; Donelson, J.; Evans, L.; Frisch, A.J.; Hobday, A.J.; Hoey, A.S.; Marshall, N.A.; Messmer, V.; Munday, P.L.; et al. Effects of climate change on coral grouper (Plectropomus spp.) and possible adaptation options. Rev. Fish Biol. Fish. 2017, 27, 297–316. [Google Scholar] [CrossRef]
  36. Tang, D.; Kawamura, H.; Lee, M.A.; Van Dien, T. Seasonal and spatial distribution of chlorophyll-a concentrations and water conditions in the Gulf of Tonkin, South China Sea. Remote Sens. Environ. 2003, 85, 475–483. [Google Scholar] [CrossRef]
  37. Shattri, M.; Tan, C.K.; Ibrahim, H.M.; Rashid, M.S.A. Satellite fish forecasting in south china sea. In Proceedings of the 22nd Asian Conference on Remote Sensing, Singapore, 5–9 November 2001; pp. 22–25. [Google Scholar]
  38. Dan Teknik, M.S.; Nurdin, S.; Mustapha, M.A.; Lihan, T.; Abd Ghaffar, M.A. Determination of potential fishing grounds of Rastrelliger kanagurta using satellite remote sensing and GIS technique. Sains Malays. 2015, 44, 225–232. [Google Scholar]
  39. Kassi, J.B.; Racault, M.F.; Mobio, B.A.; Platt, T.; Sathyendranath, S.; Raitsos, D.E.; Affian, K. Remotely sensing the biophysical drivers of Sardinella aurita variability in Ivorian waters. Remote Sens. 2018, 10, 785. [Google Scholar] [CrossRef]
  40. Balaguru, B.; Ramakrishnan, S.S.; Vidhya, R.; Thanabalan, P. A comparative study on utilization of multi-sensor satellite data to detect potential fishing zone (PFZ). In International Archives of the Photogrammetry, Remote Sensing & Spatial Information Sciences, XL-8, ISPRS Technical Commission VIII Symposium, Hyderabad, India, 9–12 December 2014; ISPRS: Hyderabad, India, 2014. [Google Scholar]
  41. Sun, Z.; Xia, S.; Feng, S.; Zhang, Z.; Rahman, M.M.; Rajkumar, M.; Jiang, S. Effects of water temperature on survival, growth, digestive enzyme activities, and body composition of the leopard coral grouper Plectropomus leopardus. Fish. Sci. 2015, 81, 107–112. [Google Scholar] [CrossRef]
  42. Das, S.K.; Xiang, T.W.; Noor, N.M.; De, M.; Mazumder, S.K.; Goutham-Bharathi, M.P. Temperature physiology in grouper (Epinephelinae: Serranidae) aquaculture: A brief review. Aquac. Rep. 2021, 20, 100682. [Google Scholar] [CrossRef]
  43. Martínez-Palacios, C.A.; Tovar, E.B.; Taylor, J.F.; Durán, G.R.; Ross, L.G. Effect of temperature on growth and survival of Chirostoma estor estor, Jordan 1879, monitored using a simple video technique for remote measurement of length and mass of larval and juvenile fishes. Aquaculture 2002, 209, 369–377. [Google Scholar] [CrossRef]
  44. Cheng, L.; Abraham, J.; Zhu, J.; Trenberth, K.E.; Fasullo, J.; Boyer, T.; Locarnini, R.; Zhang, B.; Yu, F.; Wan, L.; et al. Record-Setting Ocean Warmth Continued in 2019. Adv. Atmos. Sci. 2020, 37, 137–142. [Google Scholar] [CrossRef] [Green Version]
  45. Dasari, H.P.; Langodan, S.; Viswanadhapalli, Y.; Vadlamudi, B.R.; Papadopoulos, V.P.; Hoteit, I. ENSO influence on the interannual variability of the Red Sea convergence zone and associated rainfall. Int. J. Climatol. 2018, 38, 761–775. [Google Scholar] [CrossRef] [Green Version]
  46. Donegan, B. El Niño Conditions Strengthen, Could Last Through Summer. Weather. Co. 2019. Available online: https://weather.com/news/weather/news/2019-03-14-el-nino-conditions-strengthen-could-last-through-summer (accessed on 29 September 2022).
  47. Nagano, A.; Wakita, M.; Fujiki, T.; Uchida, H. El Niño-Related Vertical Mixing Enhancement Under the Winter Mixed Layer at Western Subarctic North Pacific Station K2. J. Geophys. Res. Ocean. 2021, 126, e2020JC016913. [Google Scholar] [CrossRef]
  48. Wang, S.; Mu, L.; Liu, D. A hybrid approach for El Niño prediction based on Empirical Mode Decomposition and convolutional LSTM Encoder-Decoder. Comput. Geosci. 2021, 149, 104695. [Google Scholar] [CrossRef]
  49. Feng, M.; Zhang, Y.; Hendon, H.H.; McPhaden, M.J.; Marshall, A.G. Niño 4 West (Niño-4W) Sea Surface Temperature Variability. J. Geophys. Res. Ocean. 2021, 126, e2021JC017591. [Google Scholar] [CrossRef]
  50. Liang, X.S.; Xu, F.; Rong, Y.; Zhang, R.; Tang, X.; Zhang, F. El Niño Modoki can be mostly predicted more than 10 years ahead of time. Sci. Rep. 2021, 11, 17860. [Google Scholar] [CrossRef] [PubMed]
  51. Nemeth, R.S. Dynamics of Reef Fish and Decapod Crustacean Spawning Aggregations: Underlying Mechanisms, Habitat Linkages, and Trophic Interactions. In Ecological Connectivity among Tropical Coastal Ecosystems; Nagelkerken, I., Ed.; Springer: Dordrecht, The Netherlands, 2009. [Google Scholar] [CrossRef]
  52. Shoji, J.; Toshito, S.I.; Mizuno, K.I.; Kamimura, Y.; Hori, M.; Hirakawa, K. Possible effects of global warming on fish recruitment: Shifts in spawning season and latitudinal distribution can alter growth of fish early life stages through changes in daylength. ICES J. Mar. Sci. 2011, 68, 1165–1169. [Google Scholar] [CrossRef]
  53. Tsuji, M.; Abe, H.; Hanyuu, K.; Kuriyama, I.; Tsuchihashi, Y.; Tsumoto, K.; Nigou, T.; Kasuya, T.; Katou, T.; Kawamura, T.; et al. Effect of temperature on survival, growth and malformation of cultured larvae and juveniles of the seven-band grouper Epinephelus septemfasciatus. Fish. Sci. 2014, 80, 69–81. [Google Scholar] [CrossRef]
  54. Abram, N.; Gattuso, J.-P.; Prakash, A.; Cheng, L.; Chidichimo, M.P.; Crate, S.; Enomoto, H.; Garschagen, M.; Gruber, N.; Harper, S.; et al. Framing and Context of the Report. In IPCC Special Report on the Ocean and Cryosphere in a Changing Climate; Pörtner, H.-O., Roberts, D.C., Masson-Delmotte, V., Zhai, P., Tignor, M., Poloczanska, E., Mintenbeck, K., Alegría, A., Nicolai, M., Okem, A., Eds.; Cambridge University Press: Cambridge, UK; New York, NY, USA, 2019; pp. 73–129. [Google Scholar] [CrossRef]
  55. Bindoff, N.L.; Cheung, W.W.; Kairo, J.G.; Arístegui, J.; Guinder, V.A.; Hallberg, R.; Hilmi, N.J.M.; Jiao, N.; Karim, M.S.; Levin, L.; et al. Changing Ocean, Marine Ecosystems, and Dependent Communities. In IPCC Special Report on the Ocean and Cryosphere in a Changing Climate; Pörtner, H.-O., Roberts, D.C., Masson-Delmotte, V., Zhai, P., Tignor, M., Poloczanska, E., et al., Eds.; Intergovernmental Panel on Climate Change: Geneva, Switzerland, 2019; pp. 477–587. [Google Scholar]
  56. Pauly, D. Anecdotes and the shifting baseline syndrome of fisheries. Trends Ecol. Evol. 1995, 10, 430. [Google Scholar] [CrossRef] [PubMed]
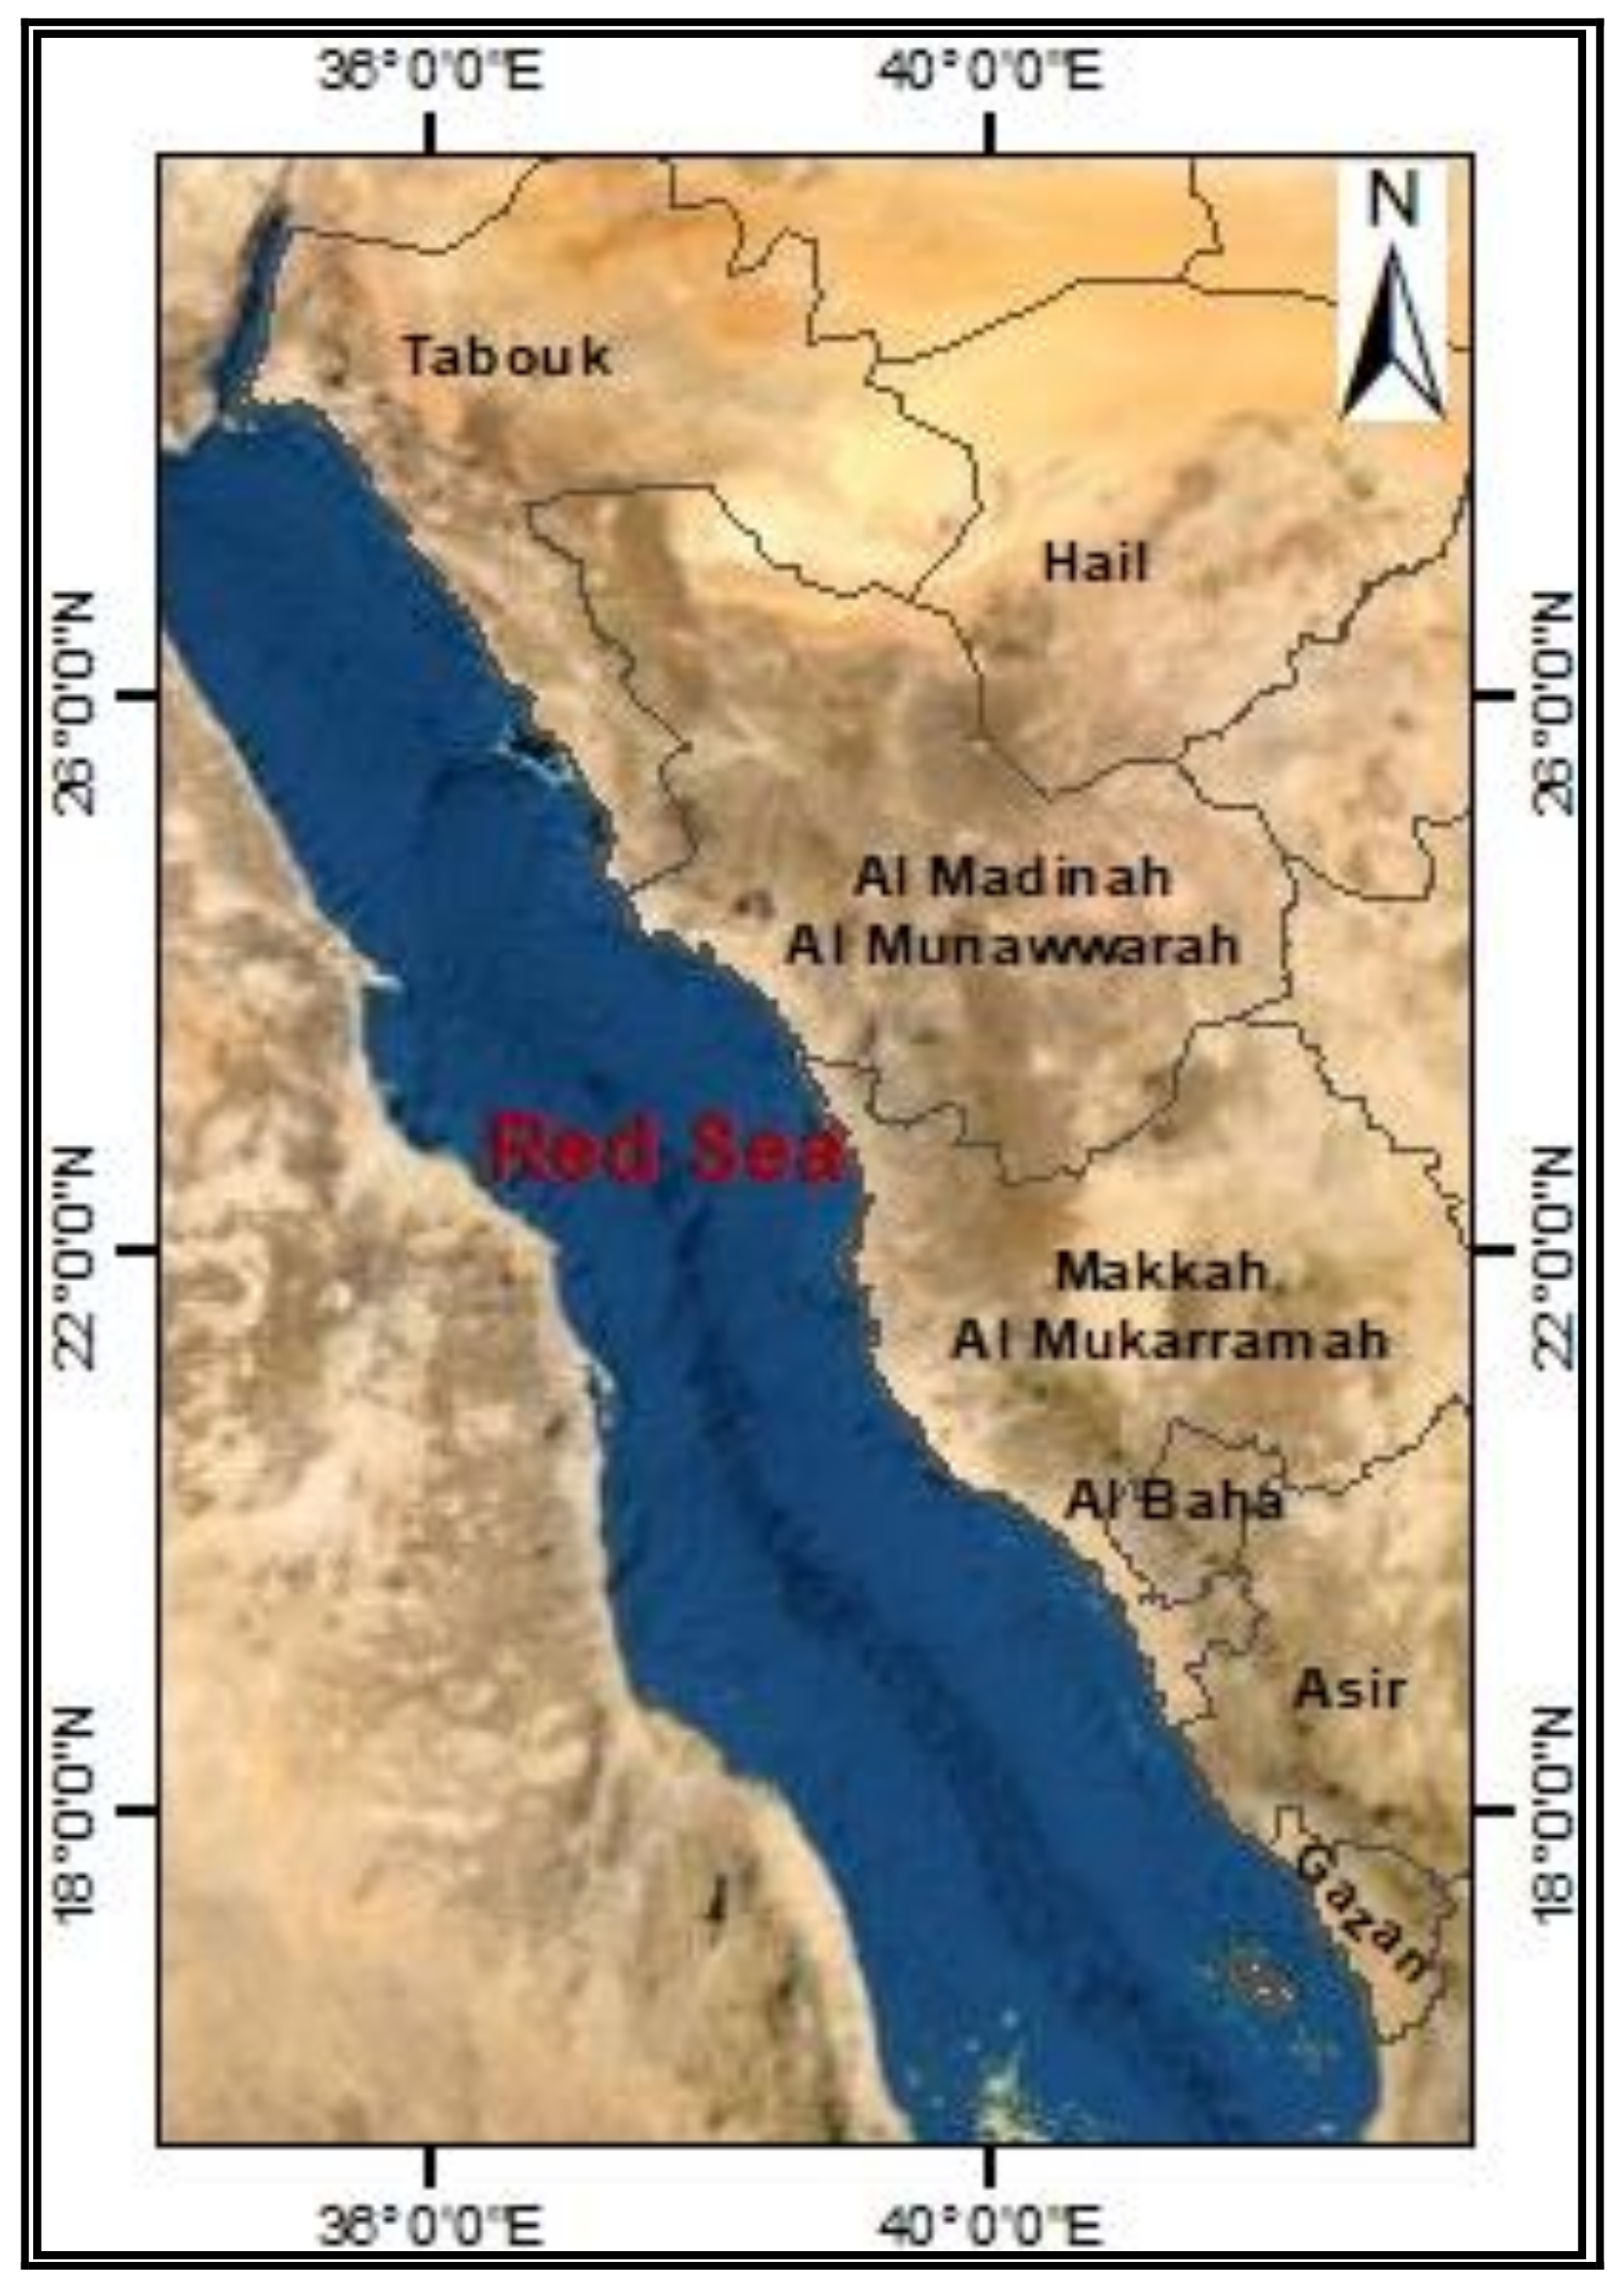
Figure 1. Red Sea coastline of Saudi Arabia.
Sustainability 14 15825 g001
Figure 2. An integrated model of the potential aggregation zone suitability map.
Sustainability 14 15825 g002
Figure 3. The monthly sea surface temperature (SST) values of Saudi’s Red Sea from 2011 to 2021.
Sustainability 14 15825 g003
Figure 4. Average yearly sea surface temperature (SST) of Saudi’s Red Sea from 2011 to 2021.
Sustainability 14 15825 g004
Figure 5. The monthly sea surface temperature (SST) values of Saudi’s Red Sea for 2011.
Sustainability 14 15825 g005
Figure 6. The monthly sea surface temperature (SST) values of Saudi’s Red Sea for 2021.
Sustainability 14 15825 g006
Figure 7. Average monthly sea surface temperature (SST) of Saudi’s Red Sea for 2011, compared to 2021.
Sustainability 14 15825 g007
Figure 8. Average yearly sea surface temperature (SST) of Saudi’s Red Sea for 2011, compared to 2021.
Sustainability 14 15825 g008
Figure 9. Suitability map of the spatial potential aggregation zones for 2011.
Sustainability 14 15825 g009
Figure 10. Suitability map of the spatial potential aggregation zones for 2021.
Sustainability 14 15825 g010
Figure 11. Risk map of the spatial potential zones of fish aggregation.
Sustainability 14 15825 g011
Figure 12. Changes (shown as a percentage) in the different suitability classes of the spatial potential aggregation zones.
Sustainability 14 15825 g012
Publisher’s Note: MDPI stays neutral with regard to jurisdictional claims in published maps and institutional affiliations.