Article

Does Companies’ ESG Performance Make a Difference for New Zealand’s Stock Market Investors during the COVID-19 Pandemic?

by
Jędrzej Białkowski
1,* and
Anna Sławik
2
1
Department of Economics and Finance, UC Business School, University of Canterbury, Christchurch 8140, New Zealand
2
Institute of Economics, Finance and Management, Jagiellonian University, 30-348 Kraków, Poland
*
Author to whom correspondence should be addressed.
Sustainability 2022, 14(23), 15841; https://doi.org/10.3390/su142315841
Submission received: 19 July 2022 / Revised: 14 November 2022 / Accepted: 16 November 2022 / Published: 28 November 2022
(This article belongs to the Section Economic and Business Aspects of Sustainability)

Abstract

:
This paper aims to investigate whether the environmental, social, and corporate governance (ESG) score of New Zealand-listed companies is associated with their stock performance during the COVID-19 pandemic. The idea of socially responsible investing is commonly accepted in New Zealand, and past academic literature has argued for the positive (though often weak) relationship between companies’ stock returns and their ESG profile. The methodology of the research is threefold. First, the average daily return for 11 New Zealand Exchange (NZX) market sectors and the S&P/NZX50 index during the COVID-19 panic and rebound periods are compared. Then, the impact of the COVID-19 outbreak on the average daily return of 11 broad NZX sectors in relation to the average ESG score for a given sector is checked. Finally, the relationship between the daily average performance of 56 NZX-listed companies and their ESG scores proxied by Refinitiv’s ESG Combined Score is determined. The analysis reveals no support for the idea that the returns of firms with higher ESG scores are greater than those with a low ESG ranking during the COVID-19 pandemic. The results show a negative, though statistically insignificant, correlation between the ESG score and annualized stock return both on the sector and individual company levels. Even though our reported findings do not confirm the believed positive correlation of the analyzed measures (based on previous studies), they clearly show that high ESG performance does not harm financial performance even in the context of crises.

1. Introduction

The COVID-19 pandemic provides a unique opportunity to test sustainable and responsible investing (SRI) strategies (strategies that considers ESG factors in portfolio selection and management). It has even been labeled by the Financial Times as the “ESG acid test” [1]. The previous studies examining the ESG and corporate financial performance (CFP) nexus in the context of crises show that a high ESG profile can facilitate smoother operation and offer better resistance to external distress (see [2,3,4,5]). The very recent studies dealing with the same phenomenon during the COVID-19 spread support those findings (see [6,7,8]).
In this paper, we contribute to the ongoing discourse of whether the ESG performance of companies matters under these unprecedented dire straits by testing the sustainability effect in the small economy of New Zealand (NZ). Although it struggled with this natural disaster at the beginning of 2020, it then became the only country free of new cases of COVID-19 and its domestic economy has been the least impacted so far by the direct consequences of the spread of the disease. In our research, we examine if there is a positive relation between ESG performance and corporate financial performance (CFP), and take it as a proxy for the latter market-based measures of CFP, i.e., the stock returns of companies listed on the New Zealand Stock Exchange (NZX). We examine companies with a high and low Refinitiv’s ESG combined score available in the DataStream database (Refinitiv’s ESG Combined Score is an overall company score based on the reported information in the environmental, social, and corporate governance pillars (ESG Score) with an ESG Controversies overlay). We are aware that narrowing a CFP to generate stock returns is a distinct simplification, but at the same time, stock returns are a widely accepted and effective measure thereof.
The growth of SRI is one of the key trends in capital markets over the last 30 years. From a niche position, it has become part of the mainstream global finance industry (Globally, sustainable investing assets amounted to $35.3 trillion at the beginning of 2020, a 15% increase compared with 2018. The largest three regions—based on the value of their sustainable investing assets—were the United States, Europe, and Japan [9]). Potential explanations for this trend include a growing awareness that finance intertwines with matters of social responsibility and the difficult aftermath of irresponsible finance that led to a global financial crisis [10]. Indeed, sustainable, green, or ethical finance has generated renewed attention due to notorious corporate scandals such as those of Enron, WorldCom, Arthur Andersen, and Lehman Brothers; environmental accidents such as Exxon, Union Carbide, and British Petroleum; and greenwashing incidents such as the cluster munitions scandal in NZ. Additionally, the growing importance of governmental regulations, including non-financial disclosure, the amplified scrutiny of the media, and increased pressure from various stakeholders, have placed the challenge of ESG issues on the strategic agenda of virtually all firms (e.g., [11]) and, consequently, of capital markets.
The concept of business accountability for ESG activity goes along with the idea that a company should deliver value not only to shareholders but to different stakeholder groups as well, by acknowledging their claims, rights, or needs. Since enterprises are “embedded in a society and draw all their resources from it, then they must act like responsible citizens” [12], p. 105. This is, however, extremely unlikely to be incorporated as long as there is no tangible link to a company’s performance. As argued by [13], continuous efforts to identify the impact of ESG on a company’s financial performance (CFP) are also efforts to legitimize its social engagement and prove that businesses can do well by doing good.
Hence, the most persuasive driver for investors and companies is the fact that SRI has begun to perform as well as, and often better than, its mainstream counterparts. Although a causal conclusion remains complex, most research finds either a positive or neutral correlation between the ESG quality represented by a business and its CFP (e.g., [14,15]). Such effect is backed up by strong evidence that on the microeconomic level, firms can mitigate their risk exposure through effective ESG policies, whereas, on the macroeconomic level, socially responsible behavior likely leads to a better corporate investment environment, better financial stability, and stronger and more crisis-resilient economies [16].
This article proceeds as follows. Section 2 explains the association between ESG performance and CFP based on empirical research evidence, including insights from NZ. Section 3 presents the research methodology and data sources. Section 4 illustrates the obtained results. A brief discussion and conclusion in Section 5 finishes the paper.

2. The Challenge of Matching ESG Performance with CFP

Academics have tried for decades to find and explain the relationship between responsible and sustainable management (reflected in a firm’s behavior) and a company’s value mirrored by its financial performance. Although many questions are still open or answered with mixed results, numerous interesting implications have been observed based on academic research. In this section, we observe some of them, noticing they are, in general, related to three aspects of a company’s performance: competitive advantage (see [17,18,19,20]), financial results (see [21]), and risk and volatility (see [16,22,23,24]).
Whatever the explanation of the link between ESG and CFP, empirical evidence showing the strength of this relationship seems to be at least as crucial. Research examining strictly the link between companies’ ESG profile and their accounting and market measures of CFP reports mostly a positive, though usually weak, relationship. For example, a meta-analysis of 167 studies investigating the effects between ESG performance and CFP since 1972, conducted by Margolis et al. (2007), indicates only a mildly positive relationship between them. The extensive meta-analysis of empirical evidence from January 1980 to February 2019 by [15] shows a positive, statistically significant but economically modest, relationship between ESG performance and CFP. [14] enhanced meta-study based on over 200 sources reports a remarkable correlation between diligent sustainability business practices and economic performance. In particular, 90% of the studies on the cost of capital show that high sustainability standards lower the cost of capital for companies; 88% of the research shows that ESG practices are positively correlated with better operational performance, and the majority of studies (33 out of 41) find that a higher ESG score translates into a superior stock price performance relative to firms with a lower ESG score [14]. An earlier study by [25] for the US market also finds that the portfolio of high-sustainability US companies outperforms the low-sustainability portfolio over the long term in 14 of the 18 years of the sample period 1993–2010, both in terms of the stock market and accounting performance. Those results are consistent with theoretical expectations of a null to a modestly positive link between ESG and CFP [26].

2.1. ESG and Crisis Resilience

It should be of critical interest to verify whether and how the aptitude for sustainability can pay off in the turbulent environment during external crises, such as natural distress, political unrest, and pandemics. Some research has already documented the positive impact of ESG on CFP under economic downturn conditions. According to Lins et al. (2017), during the global financial crisis, firms with high social capital, as measured by corporate social responsibility (CSR) intensity before the crisis, had significantly higher stock returns than firms with low social capital. High-ESG firms also experienced, inter alia, higher profitability, productivity, sales growth, and return on assets (ROA) and raised more debt, relative to low-ESG firms [4,27]. In general, those results show that “investors assigned a premium to high-CSR companies during a crisis of trust” [4].
Such a phenomenon can be explained by the stakeholder theory of crisis management which argues that the stakeholder model of corporate governance (the one that naturally suits the incorporation of ESG factors) is associated with more successful crisis management outcomes due to higher frequencies of proactive and accommodating crisis management behavior [3]. Ref. [2] argue that the stakeholder model of corporate governance may help firms prevent crises or recover from them more successfully. As tested by [22], a firm’s susceptibility to economic downturns can be reduced thanks to CSR activities, which strengthen customer loyalty. The case study by [28] proves that established pre-crisis stakeholder relationships, and strong communication channels, in particular, help handle a crisis, and may serve as significant resources for the post-crisis period. The stakeholder approach in general is believed to enhance adaptability through the effective management of multilateral contracts [29] and organizational flexibility [30]. Those qualities in particular constitute the necessary conditions for operating in uncertainty and under unfavorable circumstances of crises or distress, such as, for example, natural disasters or pandemics. As a result, by adopting a stakeholder approach, organizations can optimize their crisis management efforts [31]. On the other hand, as [32] results suggest, the shareholder model is in turn associated with higher frequencies of crises, indicating that a solely profit-maximization approach makes companies more prone to crisis.
Scholars have already tried to capture the link between ESG and CFP during the COVID-19 pandemic. The studies by [7,22] prove that CSR is a protective measure, reducing the pandemic-induced drops in stock prices. The robust study by [7], p. 25 shows, in particular, that firms that engaged more in CSR activities prior to the pandemic “experience superior stock price performance in response to COVID-19, and the CSR-resilience nexus is stronger among economies with social norms that place a higher priority on environmental and social issues”. Additionally, [8] verify a positive joint effect of CSR and corporate debt level on firm risk during the current pandemic. These results are consistent with stakeholder theory, illustrating that socially responsible behavior strengthens bonds between a firm and its stakeholders and that this pays off in times of crisis.
Assuming the positive relationship between CSR performance prior to the pandemic and crisis management efficiency and/or crisis resilience, we examine this link in the high-CSR-aware economy of NZ. We check whether a historically high ESG score is a proxy for dealing with distress and shocks, namely, whether it protects firms against pandemic panic and better equips them to pass smoothly through the COVID-19 maelstrom.

2.2. Insights from New Zealand

Although NZ is well known as a country with a high degree of awareness of environmental and sustainability issues [33], there is scarce academic evidence about the association of ESG performance with CFP for NZ firms. The most recent (to the best of our knowledge) available findings are those of [33], who examine audited financial reports of NZX50 constituents during 2002–2014 and report a positive connection between a firm’s CSR profile and financial performance. An earlier attempt to investigate the effect sustainability reporting has on CFP in NZ was made by [34]. Their study shows that for 17 NZX-listed companies, there was a generally positive trend in abnormal returns but the result was statistically insignificant. An industry-specific study by [35] explores the role of corporate governance characteristics on the CFP of large agricultural firms in NZ. The reported results reveal that listed companies have better corporate governance practices than their non-listed counterparts and that these practices are often associated with higher firm performance.
The above-mentioned research, however, examined the link between ESG disclosure but had not evaluated ESG, performance, and CFP. To the best of our knowledge, our analysis is the first that tests the impact of an independently rated ESG score on the CFP of NZX companies in the context of a pandemic.
It is worth rounding off this section with some new insights from the NZ capital market regarding the financial performance of impact investing. As surveyed by the Responsible Investment Association Australasia (RIAA), active impact investors are very satisfied with the financial performance of their impact investments, with 81% indicating that they are meeting (72%) or exceeding expectations (9%), and only 4% stating that they are under-performing expectations [36]. The prospect of impact investing in NZ looks promising. Most investors indicate that impact investing will become more significant and declare that they will allocate $5.9 billion to it in the medium term (5+ years), which suggests a potential six-fold increase in the capital already deployed [36]. It is also noteworthy that in 2019, 83% of New Zealanders expected their investments to be invested socially responsibly and ethically (compared with 72% in 2018). Two in three respondents said they would consider changing their provider of financial services if their current provider engaged in activities inconsistent with ESG values [37].
Finally, the very recent results of the World Values Survey Wave 7 (2017–2020) suggest that NZ society is prone to prioritize values reflected in the ESG performance of the economy’s constituents. For example, 55.3% of New Zealanders declare that protecting the environment should be given priority as compared with economic growth (versus 23.1% who think the other way around). This is more than all participating countries’ (48) average which is 54.6% [38]. This is also a significant increase from 2011 when 42.6% of New Zealanders indicated the environment should be higher in the hierarchy than the economy [39]. Such beliefs might help to complement NZ’s commitment to being carbon neutral by 2050. At the same time, only 57.2% of New Zealanders have confidence in environmental protection movements; 76.1% of the society are not members of those, and only 5.6% are active members. However, with such a score NZ still outperforms all countries’ average, which is 85.7% and 5.2%, respectively [38].
Taking the managerial perspective, NZ managers tend to search for competitive advantage through sustainability (see, e.g., the wine industry study by [40]. However, as indicated by [41], although the majority of managers consider sustainability practices an important factor for their personal future careers, NZ companies to a large extent do not include sustainability as a part of their strategic or operational planning process. This seems to be inconsistent with the NZ shareholders’ attitude. As reported by [42], the members of the New Zealand Shareholder Association want companies to be accountable for their environmental impacts, and this drives their affirmative attitude towards compulsory and comprehensive environmental information disclosure (in annual reports and corporate websites) and audits thereof.
Such an attitude seems to be reflected in the financial market’s figures. The value of SRI assets for Australia and NZ in 2020 amounted to $906 billion, which shows a 25% increase since 2018 [9]. NZ SRI assets alone used to make up the majority (72%) (or 63.2% acc. to [43]). of total assets under professional management worth $188 billion in 2018 [44], whereas, in 2020, they amounted to $142 billion, representing 43% of total funds under management [45]. The key drivers of SRI growth in this country are demand from institutional investors (indicated by 38% of respondents), ESG factors’ impact on performance (37%), and alignment to mission/values (27%) [45]. In addition, SRI is expected to receive a boost from millennial investors (born 1981-1996) [46], who have stronger commitments to sustainability investing than their parents [47]. This has been also the case in NZ where 61.9% of citizens up to 29 years old and 64% of those between 30–49 prioritized environmental protection over economic growth [38].
A question of to what extent those declarations—from both society, corporations, and investors—are genuine seems to be essential. The recent scandal about cluster munitions shows there might be a lot of greenwashing as well. While RIAA announces that the dominant SRI strategy in NZ is negative screening ($161 billion of assets under management), with controversial weapons (76%) (the relevance of investment in weapons manufacturing and distribution came into sharp focus in NZ following the mass shootings in Christchurch [44]) and tobacco (86%) being the most prevalent exclusionary screens among NZ investment managers [45], the flagship organization that used to support its reports, AMP Capital, together with other KiwiSaver providers (Westpac, Aon, ANZ, and BNZ) are alleged to have breached laws banning cluster munitionsby investing in companies making the controversial weapons [48]. One should note that investment in companies that produce cluster munitions is a criminalized activity in NZ since it enacted laws after becoming a party to the international treaty, Convention on Cluster Munitions. The Arms Amendment Bill (dated 10 April 2019) does not prohibit investment in other weapons; however, some funds may interpret their mandates in relation to NZ laws as reason to divest.
In light of all the above arguments, we put forward a hypothesis about a positive relationship between a company’s ESG score and CFP, as measured by stock returns. The reported insights prove that NZ constitutes an adequate setting for testing whether a high ESG score pays off during the crisis induced by COVID-19.

3. Materials and Methods
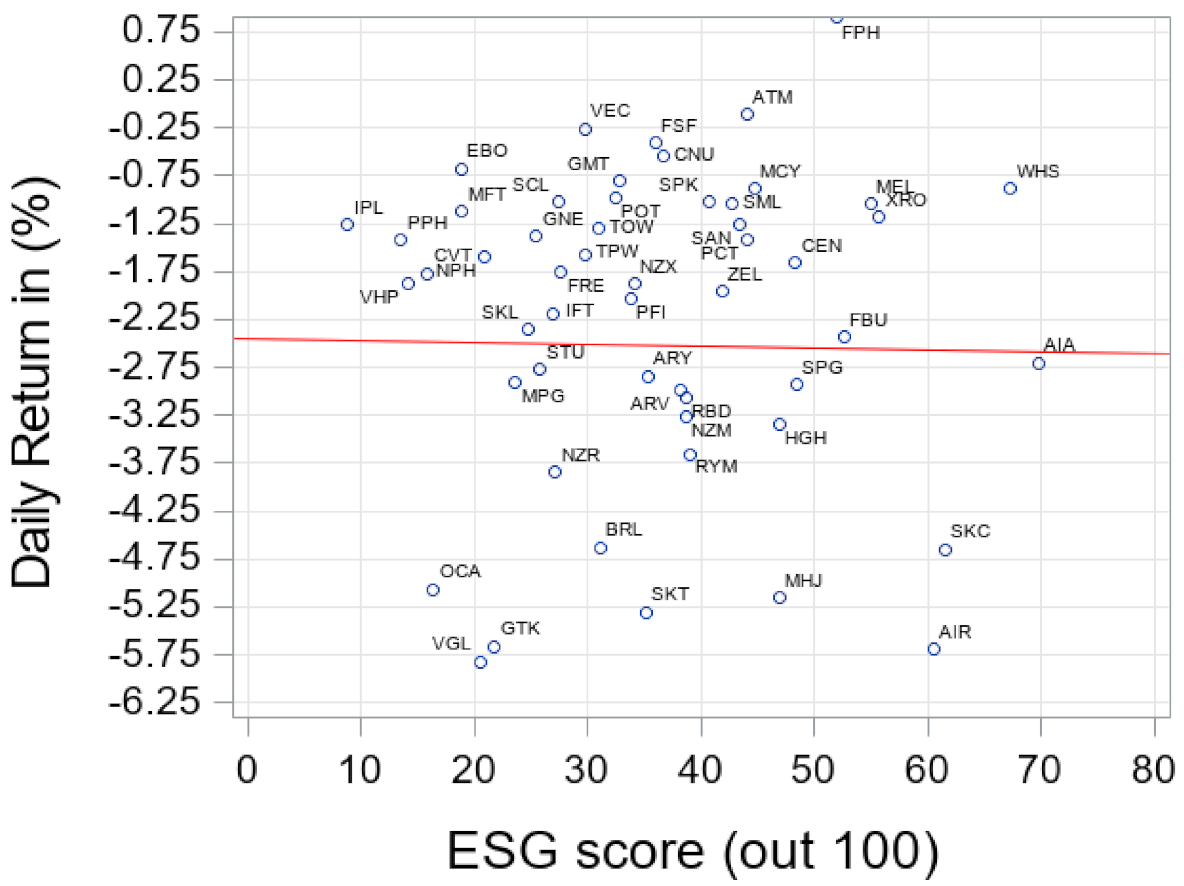
We seek an answer to the question of whether ESG values embedded in corporate management practices are capitalized by the stock market of the small economy of NZ during the unprecedented event of the COVID-19 pandemic. As a pandemic falls into the category of systemic risk, it has characteristics of a natural disaster. Interesting findings by [49] document that natural disasters have a statistically significant adverse impact on the macro-economy in the short run (when these are measured by the amount of property damage incurred), and that small economies seem to be more vulnerable than larger ones to such events (see other comprehensive papers on economic consequences of natural disasters: [50,51]).
Our aim is to examine the performance of NZ’s largest companies with an ESG rating during the February 2020–January 2021 period, after controlling for the sector. Our sample embraces all NZ-listed companies whose ESG combined score was available in Refinitiv’s DataStream database. Those are all constituents of the main index, S&P/NZX50, plus six companies not included therein. The S&P/NZX50 Index Gross is designed to measure the performance of the 50 largest eligible stocks listed on the Main Board of the NZX by float-adjusted market capitalization; representative, liquid, and investable, it is widely considered New Zealand’s preeminent benchmark index. The index is float-adjusted, covering approximately 90% of NZ equity market capitalization. Such a natural experiment allows us to shed light on the issue of whether ESG performance makes a difference for New Zealand’s investors in times of a natural disaster, such as COVID-19.
As a proxy of companies’ ESG profiles, we use one of the leading global, comprehensive ESG rating methodologies—the Refinitiv ESG scoring. The reason for choosing this ESG data provider is that it has the most comprehensive coverage among NZ companies (56 entities) in comparison with other ESG rating providers, which data we analyzed as well (e.g., the SAM Corporate Sustainability Assessment (CSA), issued by S&P Global and available in the Bloomberg terminal, covered only 31 NZ companies in its latest rating). Refinitiv’s model comprises two overall ESG scores: the ESG score, which measures the company’s ESG performance based on verifiable reported data in the public domain, and the ESGC score, which overlays the ESG score with ESG controversies to provide an evaluation of the company’s sustainability impact and conduct over time. S&P/NZX 50 constituents have been reviewed by Refinitiv on a quarterly basis since 2016.
Refinitiv calculates over 500 company-level ESG measures, of which a subset of 186 of the most comparable and material per industry is used for the overall company assessment and scoring process. The metrics are grouped into 10 categories. The category scores are rolled up into three pillar scores: environmental, social, and corporate governance. The ESG pillar score is a relative sum of the category weights, which vary per industry for the environmental and social categories. The final ESG score reflects the company’s ESG performance, commitment, and effectiveness based on publicly reported information. For each company, the Refinitiv methodology produces a score between 0 and 100.
We utilize companies’ historical ESG scores for late 2019 and early 2020, which are the latest available and could have served as a decision-making gauge for investors in NZ in the analyzed period. Historical scores or pre-crisis CSR engagement have been applied in similar research [see, e.g., [4,7,27]. In order to assure that ESG scores in general do not fluctuate significantly over time, we checked their dynamics on a year-to-year basis in the period 2017–2020 for our research sample. We also scanned media releases (using the Factiva database for the period 2016–2020) to verify that there was no scandal/controversy/affair that could have affected the ESG performance/profile of any company in our sample.

4. Results

The first step of our analysis is the examination of the performance of companies in the 11 main sectors that are listed on NZX (using the Global Industry Classification Standard (GICS) classification); we use S&P NZX sector indices as a proxy. In our analysis, we consider two periods: the panic period from 28 February to 25 March 2020 and the rebound period from 26 March until 19 January 2021. The first one is defined by the date when the first case of COVID-19 was detected on NZ soil and until the beginning of the lockdown in NZ. The beginning of the lockdown coincides with the date when global equity markets bounced back. The panic was amplified by the fact that NZ has one of the lowest intensive care unit (ICU) beds capacity in Organization for Economic Co-operation and Development (OECD) countries, thus a wider spread of COVID-19 in the community would have led to a higher number of deaths in comparison to other OECD countries (see Figure 1). During the period from 25–27 March, there were at least two events, which contributed to a rebound. The first one was the passing of the CARES Act, and the second was the beginning of the first lockdown in NZ. The period of the first lockdown (25 March 2020–13 May 2020) was characterized by a very high activity of individual investors.
Table 1 reports the average daily return for NZ sectors during both periods. In addition, we test the hypothesis of whether the performance was similar in the February–March 2020 and March 2020–January 2021 periods. We use a t-test, a statistical test that is used to compare the means of two groups (panic and rebound periods) to make a distinction in performance. In 9 out of 11 cases, the performance during the panic period was much worse than during the rebound. Three sectors were characterized by an average daily return below −2.5%: financials, IT, and consumer discretionary. Only in the case of consumer staples was the performance during the panic and rebound periods not statistically different.
Next, we examine if sectors with high ESG scores perform better than those characterized by low ESG scores. There are only 56 NZX-listed companies with ESG scores, belonging to 11 sectors. Figure 1 sheds light on the relationship between industry performance and ESG scores. The size of the bubbles in the graphs corresponds to the variability of returns in each sector separately. The grey color indicates the performance of a given sector during the panic period and the white during the bounce-back period. The position of bubbles is determined by the annualized return (Y-axis) and the ESG score. The two horizontal lines correspond to the average performance of companies that are part of the S&P NZX50 during the panic and rebound periods. The vertical line indicates the average ESG score for NZX-listed companies, according to Refinitiv’s DataStream.
Note: The two horizontal lines correspond to the average annual return of S&P/NZX 50 companies for the corresponding phase of the pandemic. The vertical line indicates the average ESG score for 56 listed companies with ESG scores. The abbreviations are defined in Table 1.
The figure illustrates the lack of a positive relationship between a higher ESG score (bubbles to the right) and performance (bubbles located higher). The white bubbles are smaller than the grey ones, suggesting that there was much more variability of returns during the panic period.
The final step of our analysis is to examine if, among the NZX companies, the ones with a higher ESG score experience smaller drops and/or a quicker rebound of their stock price. Figure 2 and Figure 3 show scatter plots of average daily returns for each of the 56 companies versus their ESG scores. In both cases, there is a line fitted to the cloud of points. In other words, we apply Ordinary Least Squares (OLS) regression to regress the return on ESG scores of NZ companies. During both the panic and the rebound period, the relationship between ESG score and CFP is negative and not statistically significant (the slope of the fitted line is small in the absolute term and statistically insignificant). As part of robustness checks, we considered market capitalization, book-to-market ratio, beta, price-to-earnings (P/E) ratio, earnings per share (EPS), net yield, dividend, Sharpe ratio, and the size of sales as the companies’ characteristics. In each case, we selected about 30% of companies with the highest or the lowest value of a given variable, we also considered a multivariable approach. In each case, we did not find a statistically significant relationship between ESG scores and performance.
In addition, we check the same relations for each ESG area separately, using the Environment Pillar Score, Governance Pillar Score, and Social Pillar Score provided by the Refinitiv DataStream. We are particularly interested in examining the correlation between Social Pillar Score and stock returns, since NZ is especially sensitive to social responsibility concerns, as the rights of Maori stakeholders are legally acknowledged under the Treaty of Waitangi Act 1975 (see [33]). The results, however, remain the same: each ESG pillar score correlates slightly negatively with stock returns, and those results are statistically insignificant as well.
As a part of robustness checks, we carry out the same analysis based on alternative ESG data sources: the SAM Corporate Sustainability Assessment (CSA) and the ESG Risk Ratings prepared by Sustainalytics. Independent of the selection of the ESG matrix, our conclusions remain unchanged.

5. Discussion and Conclusions

The aim of our study is to examine whether the COVID-19 pandemic, as an exogenous shock, allows us to determine the causal link between ESG scores and financial performance proxied by stock returns. The analysis is carried out using data from the small open economy of NZ, as it is well known that this is a country with a high degree of awareness of environmental and sustainability issues.
We show that in the case of the NZX stock market, the impact of ESG scores on the performance of stocks during the COVID-19 pandemic was marginal. Despite a clear difference in the performance of 9 out of 11 NZX sectors during the 28 February–25 March 2020 panic period and the 26 March 2020–19 January 2021 rebound period, we found a statistically insignificant negative relationship between performance and ESG scores. In other words, there was no substantial cost or benefit measured by stock returns from investing in companies with high ESG scores.
At least three arguments may be put forward to explain the described results. First, companies’ ESG activity is unlikely to be primarily motivated by narrow measures of CFP [15]. Generally, the meta-analytical studies show that there is a more direct link between ESG scores and accounting measures, with the ESG–market CFP measures relationship further confounded by industry and macro-economic variables [15]. Second, a pronounced ESG rating shortcoming is the lack of transparency regarding metrics and algorithms used by data providers and raters [46]: “150 ratings systems exist, covering over 10,000 sustainability performance metrics that are trying to fill the gap that is left by the lack of a generally accepted standard” (quoted in [52]). It is not clear that ESG measures capture the same construct [13] (Margolis et al., 2007), raising questions about the comparability and generalizability of findings. [53], in their recent study, found that in a dataset of six ESG raters, correlations between the scores of 823 companies were on average 0.61, and correlations between all ratings were on average 0.54. One solution to overcome such a shortcoming is to use a specialized ESG rating provider for homogenous industry analysis, as performed by [54]. Third, the timeframe (the pandemic-induced extreme market uncertainty) and the short horizon of our observation seem to be of crucial importance. As recently argued by [54, p.7], “in times of economic stress, investors may focus on the bottom line and view spending on ESG investment as distracting from primary business operations”.
The above-mentioned issues, i.e., ESG data ambiguity, choice of CFP measures, and unprecedented market, economic, and social conditions caused by the early phases of the COVID-19 pandemic, reflect the limitations of the study. Furthermore, the characteristics of the NZ capital market (market capitalization, development, participation of institutional investors, etc.) may have an additional impact on the results. Thus, a word of caution is advised against a direct extension of our results to other markets. Our research may be deepened in at least three ways. Firstly, we find it interesting to replicate the study in the post-introduction of mandatory climate-related disclosure timeframe. The NZ government has passed legislation making climate-related disclosures mandatory for large publicly listed companies, insurers, banks, nonbank deposit takers, and investment managers. Affected organizations are expected to publish disclosures from financial years beginning in 2023. The effect is expected to increase the quality and transparency of overall ESG disclosures (see [55]). This may have a further impact on the importance of ESG activities on performance. The second way is that studies based on different proxies of ESG performance and corporate performance are encouraged to test the extent to which the results depend on the methodology of data collection and processing and a system of performance measurement. The third one, taking a global perspective by performing a comparative analysis of ESG practice versus CFP across different regional financial markets can, in our view, offer valuable implications for theory and practice (see, e.g., [56]).
Our results suggest that delivering value to a broader spectrum of stakeholders (reflected by a high ESG score) does not necessarily immediately (in the short run) reduce or enhance the value for shareholders (measured by annualized stock returns) under pandemic circumstances. Thus, Kiwi investors are able to construct portfolios with ESG profiles in line with their expectations without the additional burden of other considerations. This is an interesting result and shows the uniqueness of the NZ capital market.
Although our findings do not indicate that sustainability matters for NZ investors in the context of COVID-19, we still share the view that there is untapped value in creating shared value [57].

Author Contributions

Conceptualization, J.B. and A.S.; methodology, J.B. and A.S.; formal analysis, J.B.; resources, J.B. and A.S.; data curation, J.B.; writing—original draft preparation, J.B. and A.S.; writing—review and editing, J.B. and A.S.; visualization, J.B. All authors have read and agreed to the published version of the manuscript.

Funding

This research received no external funding.

Data Availability Statement

Not applicable.

Conflicts of Interest

The authors declare no conflict of interest.

References

  1. Powell, J. Coronavirus as the ESG Acid Test. Financial Times, 2 April 2020. Available online: https://www.ft.com/content/51ea649a-0968-40fe-b65d-382b6f65d81b (accessed on 20 January 2022).
  2. Alpaslan, C.M.; Green, S.E.; Mitroff, I.I. Corporate governance in the context of crises: Towards a stakeholder theory of crisis management. J. Contingencies Crisis Manag. 2009, 17, 38–49. [Google Scholar] [CrossRef]
  3. Mitroff, I.I.; Alpaslan, M.C. Preparing for evil. Harv. Bus. Rev. 2003, 81, 109–115. [Google Scholar] [PubMed]
  4. Lins, K.V.; Servaes, H.; Tamayo, A. Social Capital, Trust, and Corporate Performance: How CSR Helped Companies during the Financial Crisis (and Why It Can Keep Helping Them). J. Appl. Corp. Financ. 2019, 31, 59–71. [Google Scholar] [CrossRef]
  5. Orlitzky, M.; Schmidt, F.L.; Rynes, S.L. Corporate social and financial performance: A meta-analysis. Organ. Stud. 2003, 24, 403–441. [Google Scholar] [CrossRef]
  6. Albuquerque, R.; Koskinen, Y.; Yang, S.; Zhang, C. Resiliency of environmental and social stocks: An analysis of the exogenous COVID-19 market crash. Rev. Corp. Financ. Stud. 2020, 9, 593–621. [Google Scholar] [CrossRef]
  7. Ding, W.; Levine, R.; Lin, C.; Xie, W. Corporate immunity to the COVID-19 pandemic. J. Financ. Econ. 2021, 141, 802–830. [Google Scholar] [CrossRef] [PubMed]
  8. Huang, H.; Ye, Y. Rethinking capital structure decision and corporate social responsibility in response to COVID-19. Account. Financ. 2021, 61, 4757–4788. [Google Scholar] [CrossRef]
  9. Global Sustainable Investment Review 2020. 2021. Available online: http://www.gsi-alliance.org/wp-content/uploads/2021/08/GSIR-20201.pdf (accessed on 20 January 2022).
  10. Boubaker, S.; Cumming, D.; Nguyen, D.K. (Eds.) Research Handbook of Finance and Sustainability; Edward Elgar Publishing: Cheltenham, UK; Northampton, MA, USA, 2018. [Google Scholar]
  11. Stevens, J.M.; Kevin Steensma, H.; Harrison, D.A.; Cochran, P.L. Symbolic or substantive document? The influence of ethics codes on financial executives’ decisions. Strateg. Manag. J. 2005, 26, 181–195. [Google Scholar] [CrossRef]
  12. Chakraborty, S.K.; Kurien, V.; Singh, J.; Athreya, M.; Maira, A.; Aga, A.; Gupta, A.K.; Khandwalla, P.N. Management paradigms beyond profit maximization. Vikalpa 2004, 29, 97–118. [Google Scholar] [CrossRef]
  13. Margolis, J.D.; Elfenbein, H.A.; Walsh, J.P. Does It Pay to Be Good? A Meta-Analysis and Redirection of Research on the Relationship between Corporate Social and Financial Performance. 2007. Available online: https://www.academia.edu/download/40262753/Does_It_Pay_to_Be_Good_._._._and_Does_It20151122-6328-6giv06.pdf (accessed on 20 January 2022).
  14. Clark, G.L.; Feiner, A.; Viehs, M. From the Stockholder to the Stakeholder. How Sustainability Can Drive Financial Outperformance. 2015. Available online: https://arabesque.com/research/From_the_stockholder_to_the_stakeholder_web.pdf (accessed on 20 January 2022).
  15. Huang, D.Z. Environmental, social and governance (ESG) activity and firm performance: A review and consolidation. Account. Financ. 2019, 61, 335–360. [Google Scholar] [CrossRef]
  16. Boubaker, S.; Cellier, A.; Manita, R.; Saeed, A. Does corporate social responsibility reduce financial distress risk? Econ. Model. 2020, 91, 835–851. [Google Scholar] [CrossRef]
  17. Jo, H.; Harjoto, M.A. Corporate governance and firm value: The impact of corporate social responsibility. J. Bus. Ethics 2011, 103, 351–383. [Google Scholar] [CrossRef]
  18. Greenwald, C. ESG and Earnings Performance. 2010. Available online: https://www.thomsonreuters.com/content/dam/openweb/documents/pdf/tr-com-financial/case-study/esg-and-earnings-performance.pdf (accessed on 20 January 2022).
  19. Godfrey, P.C.; Merrill, C.B.; Hansen, J.M. The relationship between corporate social responsibility and shareholder value: An empirical test of the risk management hypothesis. Strateg. Manag. J. 2009, 30, 425–445. [Google Scholar] [CrossRef]
  20. Renneboog, L.; Ter Horst, J.; Zhang, C. Socially responsible investments: Institutional aspects, performance, and investor behaviour. J. Bank. Financ. 2008, 32, 1723–1742. [Google Scholar] [CrossRef]
  21. El Ghoul, S.; Guedhami, O.; Kwok, C.C.; Mishra, D.R. Does corporate social responsibility affect the cost of capital? J. Bank. Financ. 2011, 35, 2388–2406. [Google Scholar] [CrossRef]
  22. Albuquerque, R.; Koskinen, Y.; Zhang, C. Corporate social responsibility and firm risk: Theory and empirical evidence. Manag. Sci. 2018, 65, 4451–4469. [Google Scholar] [CrossRef] [Green Version]
  23. Koh, P.S.; Qian, C.; Wang, H. Firm litigation risk and the insurance value of corporate social performance. Strateg. Manag. J. 2014, 35, 1464–1482. [Google Scholar] [CrossRef]
  24. Luo, X.; Bhattacharya, C.B. The debate over doing good: Corporate social performance, strategic marketing levers, and firm-idiosyncratic risk. J. Mark. 2009, 73, 198–213. [Google Scholar] [CrossRef] [Green Version]
  25. Eccles, R.G.; Ioannou, I.; Serafeim, G. The impact of corporate sustainability on organizational processes and performance. Manag. Sci. 2014, 60, 2835–2857. [Google Scholar] [CrossRef] [Green Version]
  26. Bénabou, R.; Tirole, J. Individual and corporate social responsibility. Economica 2010, 77, 1–19. [Google Scholar] [CrossRef]
  27. Lins, K.V.; Servaes, H.; Tamayo, A. Social Capital, Trust, and Firm Performance: The Value of Corporate Social Responsibility during the Financial Crisis. J. Financ. 2017, 72, 1785–1824. [Google Scholar] [CrossRef] [Green Version]
  28. Ulmer, R.R. Effective Crisis Management Through Established Stakeholder Relationships. Malden Mills as a Case Study. Manag. Commun. Q. 2001, 14, 590–615. [Google Scholar] [CrossRef]
  29. Freeman, R.E.; Evan, W.M. Corporate governance: A stakeholder interpretation. J. Behav. Econ. 1990, 19, 337–359. [Google Scholar] [CrossRef]
  30. Harrison, J.S.; St. John, C.H. Managing and partnering with external stakeholders. Acad. Manag. Perspect. 1996, 10, 46–60. [Google Scholar] [CrossRef]
  31. Ndlela, M.N. Crisis Communication. A Stakeholder Approach; Palgrave Pivot: Cham, Switzerland, 2019. [Google Scholar]
  32. Sheaffer, Z.; Mano-Negrin, R. Executives’ orientations as indicators of crisis management policies and practices. J. Manag. Stud. 2003, 40, 573–606. [Google Scholar] [CrossRef]
  33. Ding, D.K.; Ferreira, C.; Wongchoti, U. Reading between the lines: Not all CSR is good CSR. Pac. Account. Rev. 2018, 30, 318–333. [Google Scholar] [CrossRef]
  34. Reddy, K.; Gordon, L.W. The effect of sustainability reporting on financial performance: An empirical study using listed companies. J. Asia Entrep. Sustain. 2010, 6, 19–42. [Google Scholar]
  35. Roudaki, J. Corporate governance structures and firm performance in large agriculture companies in NZ. Corp. Gov. Int. J. Bus. Soc. 2018, 18, 987–1006. [Google Scholar]
  36. Newth, J.; Warner, A. “Impact Investor Insights New Zealand 2019”, Responsible Investment Association Australasia. 2019. Available online: https://responsibleinvestment.org/wp-content/uploads/2019/09/Impact-Investor-Insights-Aotearoa-NZ-2019-FULL-REPORT.pdf (accessed on 20 January 2022).
  37. RIAA and Mindful Money, Responsible Investment: NZ Survey 2019. 2019. Available online: https://mindfulmoney.nz/media/blog/file/da/nz-consumer-survey-2019.pdf (accessed on 20 January 2022).
  38. Haerpfer, C.; Inglehart, R.; Moreno, A.; Welzel, C.; Kizilova, K.; Diez-Medrano, J.; Lagos, M.; Norris, P.; Ponarin, E.; Puranen, B. (Eds.) World Values Survey: Round Seven—Country-Pooled Datafile; JD Systems Institute & WVSA Secretariat: Madrid, Spain; Vienna, Austria, 2020; Available online: http://www.worldvaluessurvey.org/WVSDocumentationWV7.jsp (accessed on 20 January 2022).
  39. Inglehart, R.; Haerpfer, C.; Moreno, A.; Welzel, C.; Kizilova, K.; Diez-Medrano, J.; Lagos, M.; Norris, P.; Ponarin, E.; Puranen, B. (Eds.) World Values Survey: Round Six—Country- Pooled Datafile; JD Systems Institute & WVSA Secretariat: Madrid, Spain; Vienna, Austria, 2018; Available online: https://www.worldvaluessurvey.org/WVSDocumentationWV6.jsp (accessed on 20 January 2022).
  40. Flint, D.J.; Golicic, S.L. Searching for competitive advantage through sustainability. Int. J. Phys. Distrib. Logist. Manag. 2009, 39, 841–860. [Google Scholar] [CrossRef]
  41. Mueller, J.; Klandt, H.; McDonald, G.; Finke-Schuermann, T. The Chihuahua sustainability practice: Lots of shivering but no real action. Practical sustainability acceptance is low in German and New Zealand firms. Corp. Gov. Int. J. Bus. Soc. 2007, 7, 227–237. [Google Scholar] [CrossRef] [Green Version]
  42. De Villiers, C.; Van Staden, C. New Zealand shareholder attitudes towards corporate environmental disclosure. Pac. Account. Rev. 2012, 24, 186–210. [Google Scholar] [CrossRef]
  43. Global Sustainable Investment Review 2018. 2019. Available online: http://www.gsi-alliance.org/wp-content/uploads/2019/03/GSIR_Review2018.3.28.pdf (accessed on 20 January 2022).
  44. Thompson, R.; Bayes, S. Responsible Investment Benchmark Report New Zealand 2019; Responsible Investment Association Australasia: Sydney, NSW, Australia, 2019. [Google Scholar]
  45. Banhalmi-Zakar, Z.; Boele, N.; Bayes, S. Responsible Investment Benchmark Report Aotearoa New Zealand 2021; Responsible Investment Association Australasia: Sydney, NSW, Australia, 2021; Available online: https://responsibleinvestment.org/wp-content/uploads/2021/09/Responsible-Investment-Benchmark-Report-Aotearoa-New-Zealand-2021.pdf (accessed on 20 January 2022).
  46. Ruggie, J.G. Corporate Purpose in Play: The Role of ESG Investing. In Sustainable Investing: A Path to a New Horizon; Brill, H., Kell, G., Rasche, A., Eds.; Routledge: New York, NY, USA, 2021; pp. 173–189. [Google Scholar]
  47. Ruggie, J.G.; Middleton, E.K. Money, millennials and human rights: Sustaining ‘sustainable investing’. Glob. Policy 2019, 10, 144–150. [Google Scholar] [CrossRef]
  48. Nippert, M.; Tutty, C. ‘We expect KiwiSaver providers to follow the law’—Minister. The New Zealand Herald, 18 August 2020.
  49. Noy, I. The Macroeconomic Consequences of Disasters; Working Paper, No. 07-15; University of California, Santa Cruz Institute for International Economics (SCIIE): Santa Cruz, CA, USA, 2007. [Google Scholar]
  50. Cavallo, E.; Noy, I. The Economics of Natural Disasters: A Survey; IDB Working Paper Series No. IDB-WP-124; Inter-American Development Bank (IDB): Washington, DC, USA, 2010. [Google Scholar]
  51. Cavallo, E.; Galiani, S.; Noy, I.; Pantano, J. Catastrophic natural disasters and economic growth. Rev. Econ. Stat. 2013, 95, 1549–1561. [Google Scholar] [CrossRef] [Green Version]
  52. Edgeclifff-Johnson, A. ESG Groups try to thin a thicket of sustainability metrics. Financial Times, 11 June 2019. Available online: https://www.ft.com/content/1244dc6e-8bec-11e9-a1c1-51bf8f989972 (accessed on 22 November 2022).
  53. Berg, F.; Koelbel, J.F.; Rigobon, R. Aggregate confusion: The divergence of ESG ratings. 2020. Rev. Financ. 2022, 26, 1315–1344. [Google Scholar] [CrossRef]
  54. Chacon, R.; Feng, Z.; Wu, Z. Does Investing in ESG Pay Off? Evidence from REITs around the COVID-19 Pandemic”, Working paper (27 June 2022). Available online: https://ssrn.com/abstract=4147749 (accessed on 22 November 2022).
  55. Morea, D.; Mango, F.; Cardi, M.; Paccione, C.; Bittucci, L. Circular Economy Impact Analysis on Stock Performances: An Empirical Comparison with the Euro Stoxx 50® ESG Index. Sustainability 2022, 14, 843. [Google Scholar] [CrossRef]
  56. Białkowski, J.; Sławik, A. Does a high ESG score pay off during the pandemic outbreak? In Financial Transformations Beyond the COVID-19 Health Crisis; Boubaker, S., Nguyen, D.K., Eds.; World Scientific Publishing Europe: London, UK, 2022; pp. 501–534. [Google Scholar] [CrossRef]
  57. Porter, M.E.; Kramer, M.R. Creating shared value. Harv. Bus. Rev. 2011, 89, 62–77. [Google Scholar]
Figure 1. The impact of the COVID-19 outbreak on the average daily return of 11 broad NZX sectors during the panic phase of the pandemic (grey bubbles) and the bounce-back period (white bubbles).
Sustainability 14 15841 g001
Figure 2. The scatter graph illustrates the relationship between the daily average performance of 56 NZX-listed companies during the 28 February–25 March 2020 period and their ESG scores proxied by Refinitiv’s ESG Combined Scores.
Sustainability 14 15841 g002
Figure 3. The scatter graph illustrates the relationship between the daily average performance of 56 NZX-listed companies during the 26 March 2020–19 January 2021 period and their ESC scores proxied by Refinitiv’s ESG Combined Scores.
Sustainability 14 15841 g003
Table 1. The average daily return for 11 NZX sectors and the S&P/NZX50 index during the COVID-19 panic and rebound periods.
GICS Sector/AbbreviationCOVID-19 Panic Period (in %)COVID-19 Rebound Period (in %)T-Statsp-Value
S&P/NZX All Communication Services (ComS)−0.950.11−2.91 ***0.01
S&P/NZX All Consumer Discretionary (CD)−4.160.33−7.29 ***0.00
S&P/NZX All Consumer Staples (CS)−0.30−0.12−0.340.25
S&P/NZX All Energy (EG)−2.15−0.01−3.70 ***0.01
S&P/NZX All Financials (FN)−2.540.29−6.76 ***0.00
S&P/NZX All Health Care (HC)−0.630.13−1.65 *0.12
S&P/NZX All Industrials (ID)−2.240.24−4.88 ***0.00
S&P/NZX All Information Technology (IT)−3.370.38−5.82 ***0.00
S&P/NZX All Materials (MT)−2.410.28−4.29 ***0.00
S&P/NZX All Real Estate (RE)−1.930.15−5.01 ***0.00
S&P/NZX All Utilities (UT)−1.340.27−3.42 ***0.00
S&P/NZX 50−1.310.15−4.46 ***0.01
***, and * statistically significant at the 10%, and 1% levels, respectively.
Publisher’s Note: MDPI stays neutral with regard to jurisdictional claims in published maps and institutional affiliations.

