1. Introduction
With the introduction of motor vehicles in the early 20th century, road networks became a primary key to modern development and growth in any nation [
1,
2,
3,
4,
5,
6]. An efficient road network connecting population centers reduces the cost of transporting goods and people in the country and supports economic development and growth opportunities. Moreover, on the urban scale, road networks and other modes of transportation profoundly influence social sustainability and the quality of life for residents in urban areas [
7,
8,
9,
10,
11]. In simple terms, one of the basic needs for people in a city is accessibility to convenient and safe transportation infrastructure to travel daily from their homes to their workplaces or schools and back. The general concept of sustainable development was brought to general attention by the Brundtland Commission report [
8] in the late 1980s [
10]. However, most development plans often emphasize the environmental and economic sides of sustainability and overlook the social aspects of sustainability in Brundtland’s report [
7,
12,
13].
Sustainable urban development aims to achieve the best possible balance of economic, social, and environmental goals and warrants coordinated planning across sectors, governments, and organizations to address the holistic nature of human activities. In addition, the goals of sustainability planning have preventive attributes by predicting and managing problems before their occurrence, analogous to preventative medicine [
14]. However, balancing the conflicting environmental, economic, and social objectives while developing sustainable plans is challenging for urban planners, to say the least [
15]. Moreover, the social aspect of sustainable development is elusive, and usually addressed only implicitly by planners.
Furthermore, a second dimension evolves in the case of developing countries, where the data needed for comprehensive planning are sparsely available and unreliable. In addition, there is usually limited cooperation and bureaucratic communication issues between ministries and a shortage of subject matter experts and technical planners, which makes the planning problem even worse. As a result, the planning outcome fails to meet sustainable growth and development expectations [
16,
17,
18].
In addition, most developing countries lack the financial resources to fund such ambitious infrastructure projects and plans. As a result, those countries approach International Funding Institutions (IFIs), such as the World Bank (WB) and the International Monetary Fund (IMF), to secure funds for their infrastructure development projects. However, without reliable data, the IFIs cannot make reliable appraisals of such projects and face the dilemma of financing those projects or not. On one side, if the lending institutions decline to fund these projects, they could be perceived or even accused of holding back the growth of these countries. However, let us say the lenders agree to support poorly thought out and planned projects. In such cases, these loans will not contribute to the sustainable development of those countries, which is supposedly the main goal of most IFIs and the WB in particular [
19]. Furthermore, suppose that an IFI funds poorly planned megaprojects that fall short of sustainable development standards. In that case, the lending institution violates the fundamental definition of sustainable development by compromising the abilities of future generations to develop sustainable socioeconomic plans to meet their own needs in the future [
8].
One key aspect for an urban transportation system to be socially sustainable is that it should reflect an integration between social equity, social exclusion, and quality of life for the people living in a city [
7]. In the context of urban transportation, social sustainability emphasizes meeting human needs and satisfying aspirations for a better life. In addition, sustainability in urban planning aims to establish and maintain livelihoods in cities [
18]. Mobility and accessibility are two primary measures for assessing social equity in urban communities; the current research focuses on mobility assessment.
2. Literature Review
2.1. Sustainable Development Paradigm
The Brundtland report [
8] introduced the new sustainable development paradigm, which extended the traditional mission of transportation planners to cover other aspects, such as safety, environment, social equity, accessibility, and mobility. In the last decade of the 20th century, sustainable mobility (SM) became a focal point in the overall sustainable development paradigm [
20]. The European Union adopted the concept and has been promoting cities and local urban communities to develop Sustainable Urban Mobility Plans (SUMP) following specific procedures and frameworks. The EU developed the first strategy for more sustainable transport planning in the 1990s, focusing on coherence and fair modal competition [
21]. This strategy was later updated to promote regulated competition, modal integration, multimodality, and the elimination of bottlenecks, user- and cost-focused transport policy, alternative fuels, and transport globalization, among other strategic and legislative documents [
21]. Researchers and analysts developed measures and frameworks for SM development [
22,
23,
24,
25,
26,
27]. The Holden [
24] and the Nijkamp [
25] models are the key SM frameworks that received global attention. The Nijkamp hexagonal model covers sets of indicators that, in theory, can define the level of the examined sustainability practices and can be applied at the scale of cities and neighborhoods [
26]. However, despite the flexibility of the Nijkamp model and its broad coverage of sustainable development, the assigned values for the indicators are either score-based or ordinal ranking in most cases.
The updated SUMP guidelines include specific recommendations on how to implement the SUMP idea and create an urban mobility strategy based on a distinct vision for the long-term sustainability of a metropolitan area. The first phase of SUMP, for preparation and analysis, contains three steps, the third of which is: Analyze the Mobility Situation. Now, the question is how to assess the current mobility situation in the preparation phase. We will suggest some available approaches to achieve this task in the following subsections.
2.2. Traditional Methods Limitations
For urban areas, traditional methods such as the four-step planning process [
28,
29,
30] or the relatively new, activity-based method [
31,
32,
33] focus on traffic demand forecasting on the road network and can be used to assess mobility. However, the major drawback of these methods is that they require an enormous volume of data, such as land use, census, employment, socioeconomic data, and more. In developing countries, this volume of data is usually unavailable, and the quality is doubtful if available. Under such circumstances of unreliable data and lack of integration between different ministries and administrative entities, it is hard to assess the feasibility of proposed transportation projects and develop sustainable urban transportation plans.
Another approach could be space syntax [
34,
35,
36], which is based on the configurational theory of space and aims to decode spatial formations and their effects on human activity to study the spatial configuration of cities [
37]. The space syntax approach is a very useful tool for assessing morphology and pedestrian experience at the neighborhood level and gives architects and planners a better perspective on the global integration of major roads in the network [
38,
39,
40]. However, the fundamental shortcoming of the space syntax approach [
41,
42] is that it focuses on network connectivity features, such as link integration levels and depth maps, while ignoring key link properties, such as the effect of traffic congestion on travel time across the road network.
As a result, it is almost impossible to use most of the traditional planning methods to assess mobility in urban areas without a large volume of data. At the same time, other approaches, such as space syntax, have inherent flaws that limit their ability to make a comprehensive assessment for socially sustainable development on a city scale. This result leads us to explore alternative approaches that enable analysts to assess mobility using minimal and publicly available data.
2.3. Congestion as Mobility Assessment Measure
One of the key performance indicators for mobility is travel time and the encountered delay due to traffic congestion [
43]. Therefore, transportation agencies in the United States, such as the Federal Highway Administration (FHWA) and the Transportation Research Board (TRB), were keen to address equity issues between states and local urban areas, especially while allocating funds for federally aided transportation projects. Rothrock and Keefer [
44] did early pioneering work defining the fundamental concepts of assessing urban congestion. They later developed a method for measuring an index for urban congestion (UCI) [
45]. Moreover, the FHWA proposed an alternative approach for mobility assessment on the interstate network and urban arterials by proposing the Peak Hour Travel Time Ratio (PHTTR) as an alternative aggregate assessment of mobility for cities [
46].
The current congestion indicators, UCI and PHTTR, are aggregate measures that do not reflect the congestion status separately for each community in the city. Moreover, these measures indicate the congestion status of the urban network as a whole or for an arterial, and they do not provide specific information about the mobility condition for communities within the metropolitan area. As a result, those measures are unsuitable for assessing neighborhood mobility status. Hence, there is a genuine need to create an index to assess neighborhood mobility that reflects the quality of primary trips encountered by the individuals living in those communities in the city. In the upcoming section, we will present the design for the proposed neighborhood mobility index.
2.4. Objective and Aim
The current study aims to create a novel mobility index for neighborhoods in metropolitan areas using minimal land-use information and third-party travel time data. First, in the method section, the design for the proposed neighborhood mobility index (NMI) is presented. Then, in the results and discussion, the proposed index is applied to a case study supported by actual data from the Greater Cairo Area (GCA) to demonstrate the capabilities of the NMI in showing current mobility status. The proposed NMI has two distinguishing aspects from other measures. First, the NMI integrates the fundamental concepts of the gravitational attraction from traditional transportation planning process with historical travel time data. Secondly, it, the NMI, separately assess the mobility status of different communities in a metropolitan area using a specific mode of transportation and takes the spatial context into consideration.
The outcomes of this study will enable urban planners and policymakers to identify the disparities and inequities in mobility between zones in the city and help tailor future road network enhancement projects to address those deficiencies. In the meantime, IFIs can use the proposed index to have an unbiased preliminary appraisal of social equity aspects in proposed infrastructure development projects by developing nations trying to secure funds.
3. Methodology: Design of the Neighborhood Mobility Index (NMI)
The fundamental principles of the proposed index are the ratio between the peak-hour travel time and the free-flow travel time for the routes connecting an origin to key attractors in the city. Intuitively, not all destinations will attract travelers equally in the city, and the PHTTRs for each OD route will have different weights. Therefore, calculating the neighborhood mobility index will start by dividing the study area into neighborhood zones, as trip generators, and the major attractors in the city, as destinations, similar to the initial step in the four-step transportation planning process. Then, the routes’ PHTTR will be weighted according to the attraction level of each destination, as will be explained later, using the principles of the gravity model.
3.1. Origins and Destinations
This step will divide the study area into trip-generation neighborhoods and attraction zones. The criteria for defining zones in the study area are similar to the process of defining transportation analysis zones (TAZ) in the traditional four-step planning process [
47]. Additionally, the major attraction points will be identified, similar to the initial step in the four-step planning process. Still, it is worth mentioning that not all trip-generation zones are necessary major attractors for trips generated from other zones in the study area.
3.2. Travel Time Ratio
The proposed index will follow the PHTTR concept [
46], which requires actual travel times during peak hours. In addition, researchers have explored using probe vehicles to collect travel time to estimate urban congestion measures [
48,
49,
50]. However, the number of probe vehicles needed in order to have statistically confident travel time values will be high and, consequently, will increase the time and cost of data collection [
49]. Furthermore, with smartphones and vehicle navigation software being widespread, some applications track vehicles while moving in the network and collect mega travel data that they share with other drivers to help them avoid congested areas.
Hence, it is common sense that researchers and analysts are out to use these mega data from many service providers, such as Google Maps, Bing, and Amazon, to predict free flow and peak hour travel time. The travel time data in the current study were based on the expected travel times for each OD pair obtained from the online Google Maps Platform using the Microsoft Visual Basic for Applications (VBA) macro, included in the
Supplementary Materials. The travel time ratio, shown in Equation (1), reflects travelers’ inconvenience in terms of travel time and quality of trips between those OD pairs.
where
TRij is the travel time ratio between the origin (
i) and destination (
j),
PHTTij is the peak hour travel time between the origin (
i) and destination (
j), and
FFTTij is the free-flow travel time between the origin (
i) and destination (
j).
3.3. Trip Distribution: Gravitational Weight
Based on the gravity model, the choice of trip destinations is affected by the neighborhood’s socioeconomic characteristics and the spatial location relative to the city’s major attractions [
47]. For primary trips, such as home-to-work/school, the traveler’s choice for a specific destination depends mainly on trip distance and other socioeconomic parameters. Since the developed model here is targeted for use with minimal data, the gravity model will be used to develop destination weights using only the free flow travel time between the OD pair while ignoring the number of attraction opportunities at destinations. Then, the weight of the PHTTR for each OD pair will be calculated as follows:
Wij is the weight for the route between the origin (
i) and destination (
j), and
Dw is the destination weight based on its classification. Destinations were divided into two main groups according to the primary activities and land use. The first group is mixed land use areas, including retail, business, educational, industrial, and governmental; the attraction weight assigned to this group was 3. The second group comprises higher educational facilities, and the weight was set to 1. The assigned weight values were based on population demographic statistics in the study area [
51] and higher education enrollments in GCA [
52]. Based on available data and age groups in most households in Cairo, the estimated ratio of trips by persons enrolled or employed in higher educational facilities to those heading to work was almost 1:3.
Furthermore, as mentioned earlier, some neighborhoods did not rise to the point of being considered major attraction destinations. In contrast, other neighborhood zones acted as both generators and attractors. Hence, to eliminate interzonal trips, the free flow travel time multiplier IZij was introduced for trip generators and attractors in the same zone. Furthermore, the travel time multiplier, IZij, was set to a high value for destinations within 2 km or less from the zone centroid and one otherwise.
3.4. Neighborhood Mobility Index (NMI)
Then, the mobility index for a neighborhood can be calculated as the weighted average for the PHTTRs between an origin (
i) and the set of destinations in the city {
D}, as follows:
NMIi is the neighborhood mobility index for the neighborhood (i), and {D} is the set of major attractors/destinations in the study area. As shown in Equation (3), the developed NMI reflects the average congestion residents of that neighborhood encountered daily during their trips from home to work or university. Additionally, the data required to estimate this measure can be obtained conveniently from online third-party service providers such as Google Maps API, Bing Maps API, or Amazon Maps API.
4. Case Study: Greater Cairo Area
4.1. Historical Background of GCA
The Greater Cairo Area (GCA) was selected to apply the developed neighborhood mobility index since the Egyptian government has executed mega transportation infrastructure projects in the city in addition to the author’s familiarity with GCA. The greater city of Cairo is home to nearly 21 million inhabitants spread over an area of approximately 2250 km
2. The evolution of the current GCA over the past 70 years, particularly after the military coup by Colonel Nasser in 1952, was followed by consecutive presidents that have ruled Egypt since then [
53]. During that period, successive governments built urban satellite cities in Cairo to accommodate the growing population and to ease congestion in the city’s core.
Figure 1 illustrates the GCA and depicts the different segments of the city, where the core zones of Cairo city are shown in blue, and the relatively new urban satellites are in light blue. Unfortunately, the newly built urban developments lacked comprehensive planning. Moreover, they suffered from poor connectivity, in terms of roads and availability of mass transit, to the core of Cairo, which made those urban areas car based. As a result, only the high and upper middle classes were attracted, and those who could afford the living expenses moved to those areas. On the other hand, the low-income class started building homes on agricultural lands surrounding the city’s core, creating unplanned, densely populated urban sprawl, as depicted in light green in
Figure 1.
4.2. Zones of Production and Attraction
The current analysis divides the GCA into 86 zones (neighborhoods) representing major neighborhoods in the study area. The zone boundaries were identified, considering homogeneity in land use and socioeconomic factors; also, natural and physical barriers were considered, as depicted in
Figure 1. A total of 21 major destinations in the study area were identified. Those destinations represent major industrial areas, commercial centers, major universities, and zones with mixed land use which were selected as potential destinations, as depicted in
Figure 1 and listed in
Table A1.
4.3. Case Study Objectives
Over the past eight years, the Egyptian government has launched ambitious mega projects to enhance the deteriorated infrastructures in the country with a relatively high initial budget exceeding 4.8 trillion Egyptian pounds, nearly equal to USD 280 billion [
54], based on news releases by ministers in the Egyptian government and statements by president Abdel Fattah el-Sisi in several public speeches. The transportation sector’s expenditures were estimated at 196 billion Egyptian Pounds (USD 9.8 billion) [
55]. Most of the Egyptian government’s transportation enhancement projects in GCA can be classified into three major categories: (1) bridges and overpasses at congested intersections, (2) capacity increase in key roads, and (3) the creation of new arterials and elevated highways. In addition, the Egyptian government constructed two elevated monorail lines primarily to serve the New Administrative Capital. Most of those projects are depicted in
Figure 2. Due to the lack of available data on mass transit ridership, the current analysis focused only on private vehicle transportation.
Hence, the objective of the case study is to use the developed neighborhood mobility index (NMI) method to assess the current mobility and equity status for different parts of the study area after all these projects.
5. Results
5.1. Parameters and Assessment Criteria
In the current analysis, Google Maps API was the primary source of travel time data. Google Maps predictive travel time model uses historically collected travel time to estimate travel times at a future date and allows the user to set the traffic model to produce three outputs: pessimistic, optimistic, and best guess [
56]. In the current analysis, the travel time prediction model was set to generate the best guess, which is the most likely travel time.
5.1.1. Time of Day and Day of Week
All travel time data between all origins and destinations in the study area were retrieved from Google Maps Platform using a VBA macro. The free flow travel time (FFTT) for each OD pair in the study area was estimated in the early morning hours, at 2:00 AM and 6:00 AM, and the lowest value was used as the free-flow travel time. For the peak hour travel time (PHTTR) estimation, travel times were estimated during the afternoon peak hour between 1:00–5:00 PM, and the maximum value was selected.
The official weekend holiday in Egypt is on Friday and Saturday; hence, the selected day for obtaining the peak hour travel times was Tuesday, 22 November 2022. The reason for choosing future data was to avoid accidents on the network or any other unrecurring traffic interrupting events that might cause congestion beyond what is usual.
5.1.2. Neighborhood Mobility Index Categorization
According to the FHWA, the acceptable PHTTR ratio is less than 1.5 (150%) of the free-flow travel time. Hence, the selected ranges for NMI were categorized into four categories:
Category 1, between 1.0–1.25: this category reflects the optimum situation where the congestion delay is at most 25% of the free-flow travel time.
Category 2, between 1.25–1.49: This category is marginal but still acceptable, where the congestion delay is between 25% to 50% of the free-flow travel time.
Category 3, between 1.50–1.75: This category is unacceptable because the average delay exceeds 50% of the free-flow travel time. That means if an OD pair’s free-flow travel time was 20 min, the actual travel times for those zones in this category are between 30–35 min.
Category 4, greater than 1.75: This category is considered the worst case, where the congestion delay exceeds 75% of the free-flow travel time, and walking might be a better choice.
5.2. Neighborhood Mobility Index Results
The NMI results for each neighborhood studied are shown in
Figure 3, and the detailed results are included in the
Supplementary Materials. The estimated NMI results show wide disparities between different study area locations, which can be observed in
Figure 3. For example, the highest observed NMI was 2.54 in the Cairo downtown neighborhood, while the lowest was 1.09 in Badr city. These values imply that the average travel time for trips originating from Cairo downtown heading to the potential major destinations will be 2.5 times free-flow travel time. For example, if the travel time to a destination takes 20 min, for trips generated from downtown Cairo, it will be 50 min on average, which is 30 min of delay. Furthermore, for trips originating from Badr city, if the free flow travel time is 20 min, it will take 22 min on average, which is only 2 min of delay.
The NMI results for most of the neighborhoods in the core of Cairo city, where most people live, were higher than the acceptable level of 1.5 [
55], and 90% of the neighborhoods had an NMI ranging between 1.45–2.1.
Figure 4a depicts the NMI ranges (minimum/maximum, upper 90%, lower 90%) for calculated NMI for the different sectors in the Greater Cairo Area (GCA), and
Figure 4b depicts the percentage of zones in each sector. In the core of Cairo city, the average mobility was poor, and the average NMI for those neighborhoods was 1.69 > 1.5. On the contrary, the NMIs for the new urban satellite cities were low, as can be observed in El Sherouk City (and Madinaty), 6th October City, Sheikh Zayed City, New Cairo, Badr City, and Obur City, where the average NMI was 1.29. For the New Administrative Capital, the average NMI was 1.15.
5.3. Results Validation
In validating the estimated NMI results, two approaches are followed. The first is an ANOVA between the estimated NMI results and other metrics available in the literature. The second approach is sampling comparisons of NMI with the observed traffic flow conditions in the study area during peak hours.
5.3.1. Reference Measures in the Literature: Accessibility Measures
Researchers developed several measures in the literature, but most of those measures demand a significant amount of data and addition being aggregated, as mentioned earlier. Therefore, the measure considered relevant to the NMI is the Cumulative-Opportunity negative Linear (CUML) measure [
57,
58], given below in Equation (4).
where
CUML (
T)
i is the cumulative opportunity index for the neighborhood (
i) with trip time threshold (
T),
tij is the travel time between neighborhood (
i) and destination (
j) that is part of the set of major destination {
D},
Wj is the weight for destination (
j).
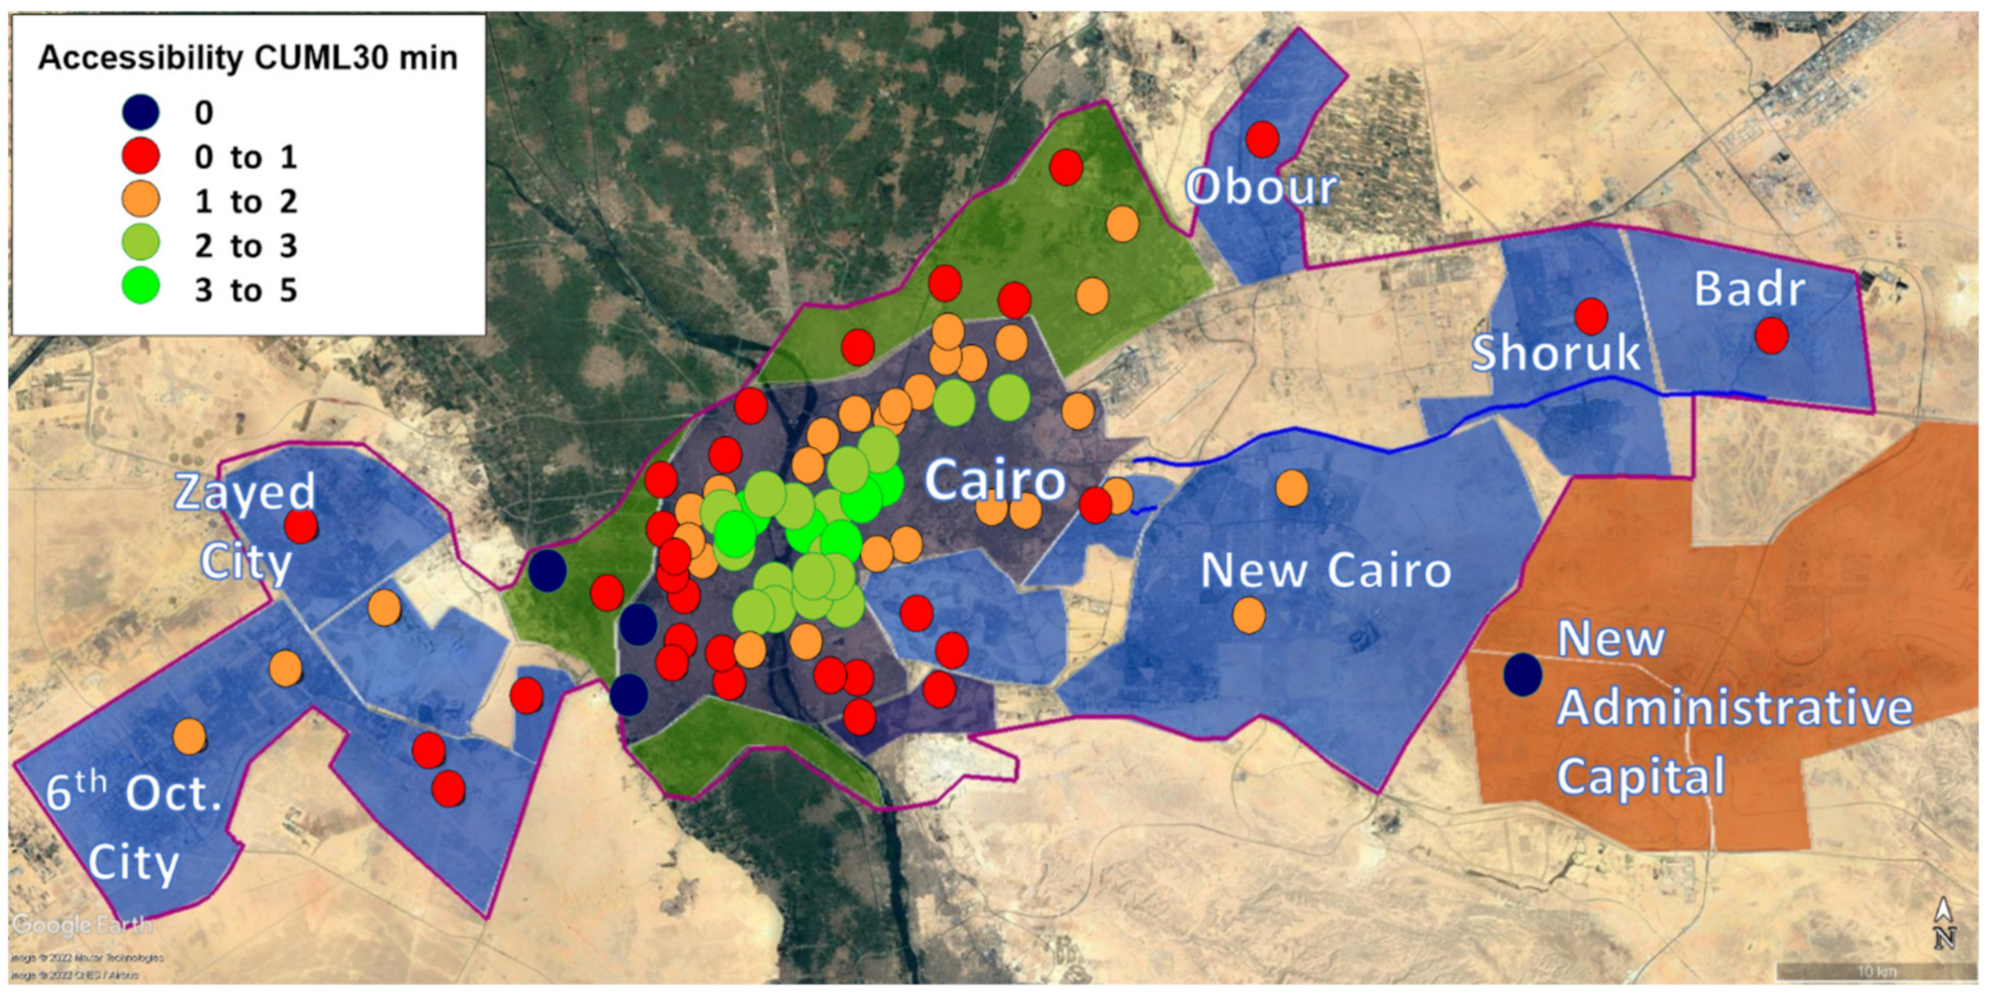
The value of (
T) was set to 30 min, commonly used to assess accessibility in urban areas [
57,
58]. However, due to a shortage of data, all destinations were assigned an equal attraction weight of 1. Hence, the calculated accessibility index value (CUML30) for each neighborhood represents the number of destinations that can be reached within 30 min. For example, if CUML30 = 0, the trip time to the nearest destination in the set {
D} is greater than 30 min.
Figure 5 depicts the calculated CUML30 results for the study area.
5.3.2. ANOVA Testing for the NMI and the CUML30
The test hypothesis is built on the premise that the relationship between mobility and accessibility is reciprocal, which means that good mobility usually comes with limited accessibility to destinations and vice versa [
59]. In other words, people living in the suburbs far from the city’s core will not encounter traffic congestion and will have better trip quality, i.e., better mobility. Still, on the other hand, their average trip duration is relatively high, and the number of destinations they can reach is also limited. Please note that the higher the NMI is, the worse it is, while the higher the CUML30 is, the better.
Table 1 includes the summary of the NMI and the CUML30 ANOVA results. The F-test statistic value (0.2112) is significantly lower than the F-critical value (3.8967), indicating insufficient support for the null hypothesis, which means that the NMI results are consistent with the CUML30 results. Furthermore, the
p-value (0.6463) is greater than the significance level (alpha) value of (0.05), which leads to the same conclusion. Therefore, it is fair to say that the NMI is a reliable indicator of neighborhood mobility in an urban area with a reasonable confidence level.
5.3.3. Sample Peak Hour Traffic Congestion
The estimated NMIs for three neighborhoods were compared to real-time peak-hour traffic conditions as an add-on to the hypothesis testing performed in the previous section.
Figure 6a depicts the traffic conditions for two neighborhoods, Mohandessin 1 and 2, where the NMIs for both were 1.92 and 2.19, respectively, exceeding the acceptable limit of 1.5. In
Figure 6a, most of the streets and arterials within both neighborhoods are congested, which indicates impeded mobility and supports the calculated NMI for both. Additionally,
Figure 6b depicts Sheikh Zayed City, one of the urban satellite cities in GCA, where most streets and arterials are not congested, and only a few exhibited mild congestion; the calculated NMI for this zone was 1.29 < 1.5. This observation indicates good mobility and further supports the calculated NMI. The observation altitude was the same in both situations to eliminate bias from the comparison.
6. Discussion
Equity in access to work, education, health care, and other services that contribute to basic human needs and aspirations for a better life is the basis for achieving socially sustainable urban development [
7]. Furthermore, equity in urban mobility for different neighborhoods within the city is a critical factor for social justice and sustainable development since all residents contribute through taxes to finance most of the urban transportation infrastructure projects. Hence, the initial planning step in the SUMP guidelines is to assess the current mobility situation, reveal current disparities in mobility between urban neighborhoods, and develop plans to address those inequalities.
In our case study, the results revealed distinctive disparities between neighborhoods in GCA. Neighborhoods in the core of Cairo suffer from poor mobility due to heavy traffic congestion, affecting the quality of life for those who live there. Moreover, the impact of congestion is not limited to mobility but extends to the environmental dimension, resulting in high vehicle emissions and poor air quality. Despite these disadvantages, those neighborhoods in the core of Cairo benefit from relatively better accessibility due to their proximity to main metropolitan destinations. For example, the neighborhood of downtown Cairo exhibited the worst mobility value (NMI = 2.54), while it also got the best accessibility value in the study area (CUML30 = 4.1).
On the other hand, the newly built urban satellites have good mobility and better air quality but suffer from poor accessibility because of their proximity to the city’s primary attractions. For example, the New Administrative Capital has an outstanding mobility index value (NMI = 1.14). Still, it has a zero-accessibility score (CUML30 = 0), implying that the nearest destination is greater than 30 min during peak hours. However, most residents in those communities can afford private cars, allowing them to overcome this disadvantage and make the trade-off.
The types of transportation infrastructure projects the government has undertaken in GCA, as shown in
Figure 2, provide another perspective on inequalities in GCA. Major highways and arterials on the East side of GCA were constructed to enhance access to the New Administrative Capital (NAC) and other urban satellites. The same pattern can be seen on the West side of GCA, where a beltway connects the Western side to NAC, and a major highway was built to improve access to the core of Cairo city. It appears that most of those projects were tailored to give better access to NAC while ignoring congestion issues in the city’s core. However, housing costs in these urban satellites and the NAC are prohibitively high for residents with average or low incomes. This observation leads us to believe that most of the funds allocated to these megaprojects will only benefit the wealthy.
Given that NAC is owned, developed, and managed by the Administrative Capital for Urban Development company, which is a joint stock company [
60,
61], undoubtedly, the poor urban development plans the Egyptian government had adopted in the GCA went against the core moral imperatives of sustainable development [
24].
Hence, the developed NMI was powerful in revealing serious deficiencies in the urban development plans for the study area. Additionally, NMI has the inherent advantage of being a quantitative value assessed at the neighborhood level and in the context of the metropolitan area. On the other hand, common SM indicators are aggregated over a city level or local to a neighborhood domain.
Finally, it is important to mention that the developed NMI was based on a single mode of transportation, a private car. Still, it can be extended to other modes of transportation and used similarly. Additionally, it is critical to emphasize that the travel time values used in estimating the NMI are based on the travel time prediction model of Google Maps API and their historical travel time data. Both the travel time prediction model and the historical data might have some deficiencies and are not necessarily exact. The NMI’s primary function is diagnostic for existing disparities in the transportation system and should not be used as a stand-alone transportation planning tool.
7. Conclusions
As mentioned in the introduction, most developing countries suffer from financial shortages to support their infrastructure projects and seek external funds from IFIs. In addition, data availability in those nations is limited and unreliable at best. Hence, funding agencies and institutions find themselves in a dilemma of whether or not to support those projects because they cannot make an appraisal based solely on numbers provided by the government of those nations. As a result, planners and IFI decision-makers need a tool that gives them a detailed assessment of the mobility situation in the area of interest with the condition that such a tool can be used with minimal data. The objective of having a detailed assessment for mobility is to detect existing disparities and inequalities in the area of interest and ensure that the proposed infrastructure projects, subject to appraisal, will address those deficiencies.
Hence, in the current study, we have developed a neighborhood mobility index (NMI) that expresses the relative congestion encountered by residents in each neighborhood during their daily trips to work or school. The developed NMI was designed with low dependency on data, where it needs minimal land-use information and third-party travel time data. The primary function of the developed index is to detect and reveal disparities between neighborhoods in an urban area, which is a diagnostic step prerequisite for developing sustainable urban mobility plans. The developed NMI was evaluated in the Greater Cairo Area. The results were statistically validated by conducting an ANOVA between the NMI results and another measure from the literature. The case study demonstrated the capabilities of the developed index in revealing distinctive disparities and social inequalities existing in the study area despite the billions of dollars spent on transportation infrastructure projects that were carried out over the past eight years.
Furthermore, the case study and the ANOVA outcomes showed that the NMI results are reliable with reasonable confidence and can be applied to other study areas effectively. However, the developed NMI was based on a single mode of transportation and did not consider multimodality. Therefore, expanding this index to cover other modes of transportation and integrating other socioeconomic parameters is highly recommended for future research.


