Abstract
The rising demand for agricultural products and expanding public awareness of environmental friendliness have led to the adoption of the organic farming system rather than the conventional one. The life cycle assessment (LCA) concept is a frequently used method to examine the environmental impacts of any activity across its entire life cycle. This research is the first use of LCA for the impacts of vermicompost and cattle manure as organic fertilizers in rice farming. The main goal of this study was to compare the environmental impacts of conventional and organic rice farming. This paper uses midpoint attributional LCA to analyze environmental damages during rice production. The four primary harm categories used in this strategy to categorize the environmental effects were: (1) climate change, (2) human health, (3) ecosystem quality, and (4) resources. The inventory data for the agricultural stage were obtained through farmer interviews. The system boundaries were set to cradle to farm gate, and 1 ton of final product (dry matter) was used as the functional unit. The results show that in all main damage categories, except for particulate matter formation, stratospheric ozone depletion, mineral resource scarcity, and freshwater eutrophication, conventional rice production has higher environmental impacts than organic rice production. Overall, organic rice production is more effective in diminishing the negative environmental effects of farming compared to conventional rice production.
1. Introduction
Rice (Oryza sativa L.), with around 161 million ha [1] grown globally, is one of the most significant agricultural crops in the world [2]. Over half of the world’s population bases its food security on rice [3]. In 2018, around 782 million tons of paddy rice were produced globally [3]. The Guilan province in Iran is one of the country’s key areas of rice production due to its abundant water, rich soil, and high humidity [4]. Rice is grown on more than 205,000 ha in this region, accounting for 35.8 percent of Iran’s total paddy fields [5].
Conventional agriculture requires a wide range of external inputs to sustain output and profit [6]. Chemical fertilizers and insecticides, in particular, can boost food production while efficiently decreasing crop pests and illnesses to satisfy the rising food demand linked with population expansion [7,8]. In addition, the overuse of chemical fertilizers and pesticides results in a number of environmental problems, such as greenhouse gas (GHG) emissions, nitrate leaching, water eutrophication, soil acidification, groundwater pollution, biological diversity loss, soil degradation, and toxicity across the food chain [6,9,10,11,12,13]. Due to the high proportions of non-renewable resources used in agriculture (such as fuel for machinery), as well as the fact that the production of frequently toxic chemicals causes environmental dangers, it is essential to pay special attention to these issues. To summarize, the production of agriculture is currently facing the enormous challenge of feeding a rising population [14,15]. The agricultural sector contributes 10–20% of worldwide GHGs [16], while paddy fields are the second-largest source of methane (CH4) generation [17]. The emission of GHGs such as carbon dioxide (CO2), CH4, and dinitrogen monoxide (N2O) have a considerable influence on global warming, eutrophication, human toxicity, and ozone layer depletion [18,19]. He et al. (2018) stated that organic farming methods are seen as an effective way to reduce negative environmental consequences [20]. Organic farming, which prohibits the use of synthetic agrochemicals to ensure long-term sustainability in agricultural systems and biodiversity protection, is frequently touted as an essential alternative to conventional farming. The results of some research showed that organic farming methods cause a lower toxicity and eutrophication per unit of product [19,21,22,23,24]. Due to its capacity to enhance soil fertility, the use of organic fertilizer may be a sustainable way to raise grain production [25,26,27,28,29]. For the development of sustainable cropping, it is essential to identify the factors that are affecting the crop’s reaction to organic amendment [21,22,23].
The assessment of environmental risks and health damages of rice production can be done by life cycle assessment (LCA) [2]. The LCA technique considers all input and output sources of the whole production system and can be therefore used to analyze the probable impact of agricultural production on the environment from raw material extraction to final product production and disposal [23,24]. Throughout a product’s life cycle, LCA develops an inventory of relevant environmental flows and assesses any potential environmental consequences linked with those flows [26]. The method examines additional environmental consequences, such as acidification, environmental toxicity, resource depletion, and so on, to reduce environmental impacts at various phases of the production process of various systems of farming [27]. LCA also considers how emissions could affect human health [28]. As a result, the usage of LCA in agricultural research is comprehensive and trustworthy for analyzing production systems [29]. Recently, LCA has been used in several studies throughout the world to analyze different cropping systems [30]. Mansoori et al. (2012), who compared organic and traditional rice cultivation systems, reported that the conventional system had larger energy inputs, with fuel and electricity accounting for the largest share [31]. Several studies have shown that yields in organic rice farming may be quite varying and have increased as a result of improved organic fertilizer or manure application technology [19,30,31,32,33]. The results of Jirapornvaree et al. (2021) show that the yields of organic jasmine rice cultivation were much greater than those of chemical (traditional) jasmine rice production. They stated that for supporting sustainable agriculture, organic rice production is an alternative approach [34]. Jiang et al. (2021) conducted a life cycle assessment of wheat production and stated that the environmental impacts of wheat production greatly improved by changing the conventional strategy to a manure compost strategy, especially with a biochar-amended manure compost strategy [35]. Only a few LCA research studies have been conducted on rice production in Iran, and the existing studies have mostly concentrated on traditional rice [36,37,38,39,40], paddy size [41], crop rotation [42], and organic rice [43]. So far, there has been no LCA study comparing organic and conventional rice production in Iran. Further, it is important to highlight the barriers in the role of organic fertilizers such as cattle manure and vermicompost in rice production. Therefore, the main goals of this study were to investigate the impacts of vermicompost and cattle manure as organic fertilizers in organic farming and further to compare the environmental impact assessment of conventional and organic farming to recognize the environmental damage of each system of farming.
2. Materials and Methods
2.1. Site of Study
This study was conducted in Sharafshadeh, Guilan Province, Iran (37°33’23”N, 50°10’70”E), which is located on the southwest coast of the Caspian Sea. This region has a moderate and humid climate, with a high average yearly precipitation of roughly 1850 mm, which is considerable above the average yearly precipitation of Iran, which is 236 mm [5]. The Caspian Sea, Guilan Province, and its position in Iran are depicted in Figure 1. Soil chemical and physical properties in the study area are given in Table 1. The chemical characteristics of cattle manure and vermicompost used in rice fields are indicated in Table 2.
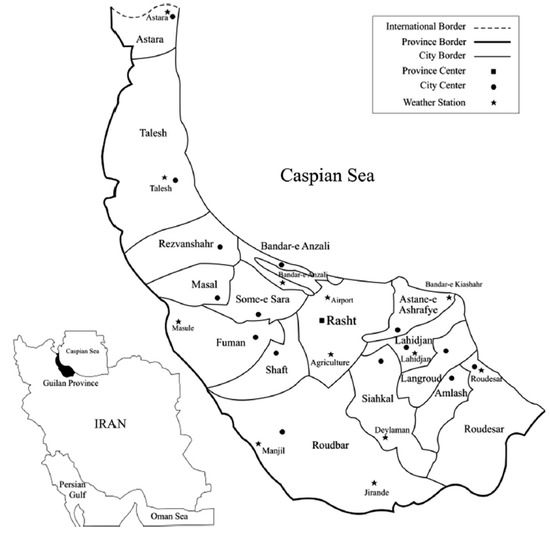
Figure 1.
Guilan province and its location in Iran [5].

Table 1.
Soil characteristics in the studied site.
Table 2.
Characteristics of organic fertilizers (cattle manure and vermicompost).
2.2. Life Cycle Assessment
The LCA method used in this study is based on the standards ISO 14040 (2006) and ISO 14044 (2006) and contains four phases, including goal and scope definition, life cycle inventory (LCI), life cycle impact assessment (LCIA), and data interpretation. In this study, the environmental impacts between organic and conventional rice production in Guilan, Iran, were evaluated. The following sections provide a summary of the major decisions taken during the four LCA phases [42]. This LCA used the ReCiPe 2016 midpoint (H) impact assessment methodology, data from the AGRIBALYSE v1.2/v1.3 and Ecoinvent V.3.5 databases, and openLCA software V.11.0 [44].
2.2.1. Definition of the Scope and Goals
The aim of this study was to determine the environmental effects of organic and conventional Hashemi rice production in Guilan, Iran. For this investigation, 1 ton of final product (dry matter) was used as the functional unit. Figure 2 shows the system boundaries as well as every process from cradle to gate farm that are included in the assessment.
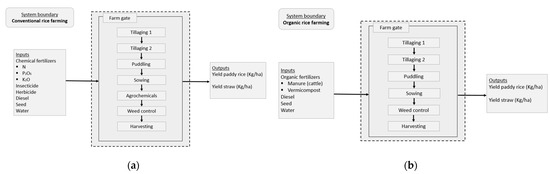
Figure 2.
System boundaries of conventional (a) and organic (b) rice farming.
2.2.2. Life Cycle Inventory (LCI)
This study focused on organic and conventional rice farming systems. Organic farming according to the Organic Agricultural Standard is based on the non-use of agricultural chemicals (synthetic chemical fertilizers, insecticide, herbicides, and fungicides) [43,45]. Hence, only cattle manure and vermicompost were applied to the organic paddy field (Table 3). The weed management was done manually. Conventional farming relies on agricultural chemicals such as pesticides and synthetic fertilizers, insecticide, herbicides, and fungicides (Table 3).
Table 3.
The inventory data of rice cultivation per crop (1 ha).
The inventory data (foreground data) for the agricultural stage were obtained through farmer interviews. The appropriate sample number for this investigation was determined using Cochran’s formula [46,47]:
where n is the required sample number, N is the population size, t is the t value at 95% confidence limit (1.96), s is the standard deviation (SD), and d is the permissible error (5%).
In March 2022, 99 farmers (conventional: 58, organic: 41) were interviewed using questionnaires to gather data on organic and conventional rice farming (Table 3).
The emissions in rice cultivation included agrochemicals used, biogenic soil emissions, and fuel used in agricultural field activities. The Ecoinvent V.3.5 [44,45,46,47,48] and AGRIBALYSE v1.2/v1.3 [44] databases were used to obtain the emissions of agrochemical production. The IPCC method was used to determine the biogenic soil emissions, which are emissions from fertilizers and agricultural residues (IPCC, 2006). Further outputs were calculated in accordance with the SQCB model (nitrate, NO3−), EMEP/EEA, 2016 (ammonia, NH3), the SALCA model (phosphate, PO43−, and phosphorus, P), IPCC 2006 guidelines (CO2), and IPCC 2019 guidelines (N2O and CH4).
2.2.3. Life Cycle Impact Assessment (LCIA)
The fundamental objective of the ReCiPe method is to convert a full life cycle inventory result list to a small number of indicator scores. The midpoint indicator is focused on a particular environmental problem [49]. Eighteen indicators of environmental impacts are included in the ReCiPe midpoint method, which are further specified into four main damage categories: (1) human health, (2) ecosystem quality, (3) resources, and (4) climate change (Appendix A). The classification of emissions and resource inputs for easier interpretation is the aim of the life cycle impact assessment. Characterization, normalization, and weighting are the three processes in the evaluation.
In the phase of data interpretation, the LCI and LCIA data in accordance with scope and goal were examined. Overall, the effect of Hashemi rice production was compared between conventional and organic rice farming.
3. Results
3.1. Impact Assessment
Table 4 and Figure 3 show the impact assessment of conventional and organic rice production to recognize their hot spots. In this study, there were no differences in particulate matter formation (PMFP), stratospheric ozone depletion (ODP), mineral resource scarcity (SOP), and freshwater eutrophication (FEP) between organic and conventional systems of farming. Except for the marine eutrophication potential (MEP), terrestrial acidification potential (TAP), and global warming potential (GWP), the highest emissions and negative environmental effects could be identified in the conventional system of farming in 11 impact categories. Several studies have already indicated that organic agriculture has a lower environmental impact than conventional agriculture, as avoiding chemical use in rice production has various environmental advantages [37,50,51,52,53,54,55,56].
Table 4.
Midpoint environmental impact assessment (1 ton of dry matter) of conventional and organic rice farming.
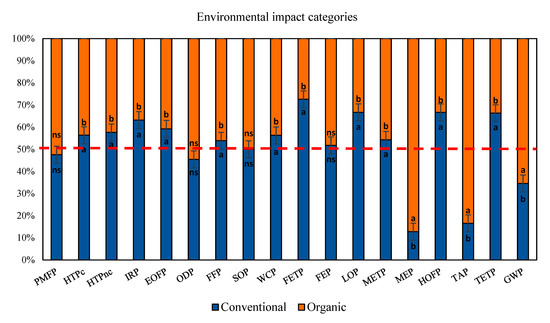
Figure 3.
Midpoint environmental impact assessment of conventional and organic systems of farming (1 ton of dry matter). The impact categories assessed were particulate matter formation potential (PMFP), human carcinogenic toxicity potential (HTPc), human non-carcinogenic toxicity potential (HTPnc), ionizing radiation potential (IRP), ozone formation potential—ecosystems (EOFP), ozone depletion potential (ODP), fossil fuel potential (FFP), surplus ore potential (SOP), water consumption potential (WCP), freshwater ecotoxicity potential (FETP), freshwater eutrophication potential (FEP), agricultural land occupation potential (LOP), marine ecotoxicity potential (METP), marine eutrophication potential (MEP), ozone formation potential (HOFP), terrestrial acidification potential (TAP), terrestrial ecotoxicity potential (TETP), and global warming potential (GWP).
3.1.1. Climate Change Category
The global warming potential (GWP) values found for conventional and organic rice production were 0.38 kg CO2 eq and 0.72 kg CO2 eq per 1 ton of dry matter, respectively (Table 4, Figure 4). Table 5 shows the GHG emissions of conventional and organic systems of rice farming. The results showed that CO2 emissions in organic rice production were 32.7% lower than in conventional production, and the amount of N2O and CH4 emissions in organic rice production were 152.2% and 122.7%, respectively, higher than in conventional production.
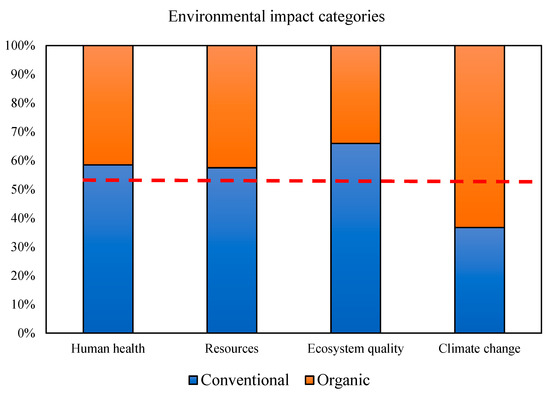
Figure 4.
Environmental effect categories aggregated for conventional and organic system of rice farming.
Table 5.
Greenhouse gases emissions in conventional and organic systems of farming.
3.1.2. Human Health Categories
Table 4 and Figure 4 show the human health categories of rice production for conventional and organic farming systems. The impact assessment of human health categories included particulate matter formation potential (PMFP), human carcinogenic toxicity potential (HTPc), human non-carcinogenic toxicity potential (HTPnc), ionizing radiation potential (IRP), ozone formation potential—ecosystems (EOFP), and ozone depletion potential (ODP).
The particulate matter formation potential (PMFP) for conventional and organic rice was 0.29 kg PM2.5 eq and 0.32 kg PM2.5 eq, respectively. Accordingly, the resulting risk increases of cancer disease incidence (HTPc) for conventional and organic rice were 28.79 kg 1.4-DCB and 23.3 kg 1.4-DCB, respectively, while the risk increases of non-cancer disease incidence (HTPnc) for conventional and organic rice were 20.92 kg 1.4-DCB and 15.4 kg 1.4-DCB, respectively. The difference was significant between organic and conventional systems for both HTPc and HTPnc. The ionizing radiation potential (IRP) for conventional and organic rice was 0.36 kBq Co-60 eq and 0.21 kBq Co-60 eq, respectively, as shown in Table 4; thus, the IRP in organic rice was 41% lower than in conventional rice. The ecosystems ozone formation potential (EOFP) of conventional rice was 31% higher than for organic rice. The EOFP for conventional and organic rice was 0.45 kg NOx eq and 0.31 kg NOx eq, respectively. The ozone depletion potential (ODP) for conventional and organic rice was 0.3 kg CFC11 eq and 0. 36 kg CFC11 eq, respectively.
3.1.3. Ecosystem Quality Categories
Ecosystem quality is based on various factors such as freshwater ecotoxicity potential (FETP), freshwater eutrophication potential (FEP), agricultural land occupation potential (LOP), marine ecotoxicity potential (METP), marine eutrophication potential (MEP), terrestrial acidification potential (TAP), ozone formation potential (HOFP), and terrestrial ecotoxicity potential (TETP). Table 4 and Figure 4 show the ecosystem quality categories of rice production in conventional and organic farming systems.
The freshwater ecotoxicity potential (FETP) was 1.27 kg 1.4-DCB for conventional rice and 0.48 kg 1.4-DCB for organic rice, and there was a significant difference between systems of farming.
Organic rice reduced the marine ecotoxicity potential (METP) compared to conventional rice by 18.53%. The absolute amounts of METP for conventional and organic rice were 91.47 kg 1.4-DCB and 77.17 kg 1.4-DCB, respectively. The pollution of surface and groundwater is caused by leaching following fertilizer application [57].
The freshwater eutrophication potential (FEP) was 1.33 kg P eq for conventional rice and 1.24 kg P eq for organic rice, and there was no significant difference between conventional and organic systems. The marine eutrophication potential (MEP) values were 0.06 kg N eq and 0.41 kg N eq for conventional and organic rice, respectively. There was a significant difference between conventional and organic systems. The terrestrial acidification potential (TAP) values for conventional and organic rice were 0.21 kg SO2 eq and 1.06 kg SO2 eq, respectively. The ozone formation potential (HOFP) was 0.06 kg NOx eq and 0.03 kg NOx eq, respectively, for conventional and organic rice. The terrestrial ecotoxicity potential (TETP) was 4.35 kg 1,4-DCB for conventional rice and 2.21 kg 1,4-DCB for organic rice. There was a significant difference between systems of farming, and the amount in the conventional system was 96.83% higher than in the organic system.
3.1.4. Resources Categories
Table 4 and Figure 4 show the ecosystem quality categories of rice production in conventional and organic farming systems. The impact assessment of resources included fossil fuel potential (FFP), surplus ore potential (SOP), and water consumption potential (WCP).
The fossil fuel potential (FFP) of conventional and organic rice was 0.49 kg oil eq and 0.42 kg oil eq, respectively. The FFP in conventional rice was 16.67% higher than in the organic rice.
The result showed that surplus ore potential (SOP) for conventional and organic rice was 0.01 kg and 0.01 kg, respectively, with no significant difference between systems of farming.
The water consumption potential (WCP) for conventional and organic rice was 11.91 m3 and 9.25 m3, respectively.
4. Discussion
The potential of global warming, which is expressed based on the carbon dioxide equivalent (kg CO2 eq), illustrates the role of GHG emissions for climate change. Global warming is the most important parameter in the climate change category. According to the results, CO2 emissions in organic rice were 32.7% lower than in conventional rice, and the amounts of N2O and CH4 emissions in organic rice were 152.2% and 122.7%, respectively, higher than in conventional rice. He et al. (2018) stated that significant greenhouse gas emissions in organic systems were linked to the usage of a lot of organic manure. They also stated that after the conversion to organic farming, the systems need some time to reach a new stable state [20]. According to Hokazono and Hayashi (2015), in the organic rice system, direct emissions and field operations significantly contribute to the environmental impacts [33]. Similar research studies showed that the usage of chemical fertilizers (especially urea) and fossil fuels had the greatest impact on global warming potential and GHG emissions in other crops [38,39].
According to the findings of Hokazono and Hayashi (2012), paddy agricultural flooding contributes significantly to GHG emissions [49]. Fertilizer use in agriculture has an influence on the environment, since nitrogen in fertilizers contributes to N2O, nitrogen oxides (NOx), and NH3 [41,42] emissions. Fertilizers release N2 because of the process of nitrification followed by denitrification, which is created by microbial interactions in the soil under aerobic and anaerobic conditions [52]. Fertilizer application dosages and their impacts on yields have a large influence on GHG emissions. Changing crop management to organic fertilizers might have the opposite impact due to this relationship. For example, Saber et al. (2020) and Harun et al. (2021) estimated that moving from conventional to organic farming reduces the carbon footprint of rice by two and three times, respectively [3,53]. According to Meng et al. (2014) and Mungkung et al. (2019), organic rice cultivation is promoted because of the supposed decreased risks associated with eliminating chemical inputs, as well as the potential to lessen environmental consequences such as global warming and ecological destruction [54,55]. Organic farming systems use biological and physical controls instead of synthetic fertilizer and prevent groundwater pollution, increase microbial biodiversity, and are less reliant on external inputs [56,57,58]. The main sources of N2O emissions to the atmosphere are nitrification proceeded by denitrification processes carried out by soil microorganisms, though these emissions can change based on agricultural waste management, soil tillage, nitrogen fertilizer used, and climate conditions [50].
According to Table 4, although there was no significant difference between organic and conventional system of farming, organic rice had lower (PMFP) values than conventional rice. The conventional farming strategy relies on a chemical technology in which an extra supplement is applied to improve productivity. Several studies have shown that these practices affect the ecosystem and also have impacts on human health [2,46,50,51]. Agrochemical contamination has a long-term impact on humans, food chains, and the environment. One of the issues with use of pesticide, especially in rice farming, is the migration of pesticide into surface water after treatment. If drinking water is obtained from surface water, pesticides can harm aquatic ecosystems and human health [59,60,61]. Contrary to that, organic agricultural techniques have been shown to be a potential way to reduce negative environmental effects [20]. One of the most important environmental stressors that causes pathogenicity is the inorganic respiration index, which is described as the influence of respiratory minerals on human health. The inorganic respiration index is influenced by field operations, fossil fuel use, and nitrogen fertilizer use [61,62,63]. Darzi-Naftchali et al. (2022) found that on the carcinogenic illnesses index, urea fertilizer had the greatest impact [16]. In rice cropping systems, excessive urea fertilizer application and inadequate nitrogen usage efficiency may exacerbate these negative environmental consequences [64]. According to Darzi-Naftchali et al. (2022), the use of diesel-based fossil fuels had the greatest influence on the ionizing radiation potential, followed by the use of triple superphosphate and urea fertilizers [16]. Agricultural machinery that operates on diesel fuel can exacerbate ozone layer depletion. The consumption of butachlor herbicides is also a source of ozone depletion. Because of the chlorine in its composition, this herbicide has high destructive power and is categorized as a category one danger for water resources and ozone depletion [61,62,63]. Organic rice cultivation is a long-term rice-growing system that uses no chemicals and has the potential to decrease ecological issues [62,63].
FETP in conventional rice was 62.2% higher than in organic rice. The acidification impact is mostly caused by the emission of sulfur dioxide (SO2), NH3, and nitrogen dioxide (NO2) into the air or soil, which are significantly reduced in the organic system compared to the conventional one. These results may be influenced by significant reductions in chemical inputs and diesel rates [3]. The usage of fertilizers and chemical pesticides in agriculture has a direct relationship with soil toxicity. Because of the adsorption of particles to the soil surface, soil is an important pollution sink [24,62,63,64]. Leaching of soil pollutants and toxic elements lead to groundwater pollution. Therefore, high use of these chemicals threatens the lives of animal and plant species [6,9,10,11,12,13]. In general, organic rice reduced the negative environmental effects compared with conventional rice farming.
Organic farming systems generate less damage to marine and freshwater ecosystems per unit of rice production, owing to lower pesticide and synthetic fertilizer use. Utilizing nitrogen-fixing plants in a crop rotation can be a good way to avoid overuse of nitrogen in the production system [65]. On the other hand, increasing resource usage efficiency is a long-term option for reducing agricultural output’s environmental impact, especially in rice production systems [66].
MEP in the organic system was 85.37% higher than for conventional rice production. Fertilizer emissions of nitrogen and phosphorus are a key contribution to eutrophication and acidification effects related to rice cultivation, as well as a cause of climate change and field flooding-related CH4 emissions [29]. According to Darzi-Naftchali et al. (2022), in terms of eutrophication potential, phosphorus fertilizers and pesticides had a much larger percentage than other input sources. They also stated that the use of nitrogen fertilizer has a significant impact on the eutrophication of water sources [16]. In accordance with Table 3, the amount of phosphorous emissions to water for the organic system was higher than for the conventional system (0.85 kg ha−1 and 0.64 kg ha−1, respectively). The high AP content of the applied manure, which enhances the percentage of bioavailable P in the soil surface, especially in the first few days following fertilizer applications, might be the cause of this finding [67]. In terms of nutritional levels and solubility, the impacts of organic replacements are obviously a major cause for worry for P loss through surface runoff [68]. According to reports, phosphorous is the most important element in eutrophication intensification among other inputs [37,50,51,52,53,54,55,56]. In rice cultivation, one way for phosphorous to enter water sources is by leaching [69,70]. Since rice production is carried out in flooded conditions and leaching is common in rice production, improved fertilizer management is critical for reducing the effects of climate change, acidification, and freshwater eutrophication all at the same time [71,72,73].
TAP in the organic system was 80.19% higher than in the conventional system. According to Table 3, the amounts of ammonia emissions to water for organic and conventional systems were 18.67 kg ha−1 and 5.04 kg ha−1, respectively. This is consistent with the reports of Regina et al. (2013) and Schmidt Rivera et al. (2017), who claimed that ammonia (NH3) emissions from fertilizer usage cause these effects [52,72].
In conventional system of rice, high doses of phosphate, potassium, and nitrogen produced from synthetic fertilizers contribute to the terrestrial ecotoxicity potential due to the release of NH3, SO2, and NOx into the soil [50]. Terrestrial ecotoxicity potential (TETP) caused by inorganic substance deposition in the atmosphere allows one to examine the environmental effect of sulfates, nitrates, and phosphates, as well as their subsequent deposition, which can lower soil pH [71]. Increased leaching and the production of acidic chemicals in water sources are caused by a rise in anthropogenic sulfur and nitrogen emissions. In sensitive catchments, this sediment heads to negative environmental consequences on aquatic habitats, as well as ecological loss or extinction. Therefore, as a result of the existence of shallow groundwater and surface water bodies in rice farming, pollution from sulfur and nitrogen sources should be decreased in areas that are vulnerable to acidification [16].
As shown in Table 4 and Figure 3, organic rice had lower values of agricultural land occupation potential (LOP) than conventional rice (0.04 m2a crop eq and 0.02 m2a crop eq for conventional and organic rice, respectively). In this study, the grain yields of organic rice were 4000 (kg ha−1) and for conventional rice 3290 (kg ha−1); thus, the organic rice grain yield was 14.6% higher than the conventional rice grain yield. Therefore, to produce the same amount of paddy, less land is required. One of the factors contributing to the higher yield is the higher amount of organic matter content in organic farming. In fact, organic matter that is accumulated in the soil will help to improve the yield in an organic farming system [34]. Meta-analysis research carried out by Liu et al. (2021), who studied the response of rice yield and agronomic characters to organic fertilization, stated that the use of organic fertilizer improved N absorption by rice by 5.2% on average across all studies [45]. Similarly, when organic fertilizer was applied to rice, it increased P and K uptake by 7.2% and 10.5%, respectively, as compared to the control. In addition, when organic fertilizer was utilized, rice’s physiological N, P, and K usage efficiency increased by 6.2%, 4.6%, and 3.7%, respectively. They also stated that in terms of organic fertilizer types, using animal manure increased rice production more than applying biochar or crop straw. Specifically, animal manure treatment enhanced rice output by 10.5%, whereas organic fertilization using biochar or crop straw increased rice grain yield by only 7.2% and 8.3%, respectively [45]. When organic fertilizer is applied, soil organic carbon, one of the key measures of soil fertility, considerably rises, mostly due to the high carbon content of organic fertilizers [45,55,74,75,76]. More importantly, the increase in nutrients that are accessible with the application of organic fertilizer is greater than the increase in total nutrients for each mineral element, indicating that the increase in nutrients that are available promote the improvement of nutrient use efficiency [45]. The significant increase in plant-available nutrients might be related to the increased soil microbial community activity, which is necessary for nutrient cycling and transformation, and hence improves nutrient availability [72,73,74,75,76]. The application of organic fertilizers may change the architecture of the rice root system, promoting nutrient absorption from the soil, because they include amino acids and other physiologically active chemicals [77]. Organic fertilization could also improve the physical properties of paddy soil and help rice roots grow deeper into the soil, resulting in the absorption of more nutrients [74,75,76]. In general, it can be stated that the use of organic fertilizers compared to chemicals leads to increased yields of rice, and as a result, land occupation potential in organic farming is less than in conventional farming.
The FFP in conventional rice was 16.67% higher than in organic rice. The overuse of non-renewable resources for energy production and fuel significantly increase the risk of climate change. Diesel is a common fuel for agricultural equipment and is an expensive and non-renewable source [77,78]. The use of lower amounts of fertilizers and diesel fuel, as well as ecological methods for disease and insect prevention, could help to lessen the negative environmental impact. The production of fertilizers, which uses a lot of coal or natural gas as a source of hydrogen (to synthesize ammonia), increases CO2 emissions [78,79]. Further, around 1.3–1.8% of the world’s fossil fuel consumption is attributable to the manufacturing of nitrogen fertilizers [50]. According to previous studies, non-renewable inputs have been shown to account for 60–80 % of the overall costs of agricultural crops, with chemicals such as fertilizers and insecticides accounting for 25–97 % of all non-renewable inputs [80,81,82,83,84]. Around 14% of the world’s ammonia production is based on coal gasification, 77% on natural gas reforming, and 9% on the partial oxidation of heavy hydrocarbon fractions and oil products [50].
5. Conclusions
One of the most essential tools for evaluating environmental impacts in production is the life cycle assessment (LCA). In this study, there were no differences in particulate matter formation potential (PMFP), ozone depletion potential (ODP), and surplus ore potential (SOP) between organic and conventional systems of rice farming. Except for marine eutrophication potential (MEP), terrestrial acidification potential (TAP), and global warming potential (GWP), the highest emissions and negative environmental effects could be identified in the conventional system of farming in 11 impact categories. The findings of the study indicated that (1) GHG emissions in organic rice farming were higher than in conventional rice. This is related to the application of a large amount of organic manure in the first year of conversion to organic farming, as the transition of the systems takes some time to reach a new stable state. Therefore, it is important to examine the organic and conventional system of farming in a period of several years. (2) Overall, organic rice production was more effective in diminishing negative environmental effects of farming compared to the conventional system. (3) The total environmental impact indices decreased in organic farming. (4) Higher environmental impacts were associated with conventional rice, while organic rice had lower human toxicity potential, ionizing radiation, ozone formation, water consumption, freshwater ecotoxicity and eutrophication, agricultural land occupation, marine ecotoxicity, ozone formation, and terrestrial ecotoxicity potential. (5) The use of chemical fertilizers and pesticides for conventional rice was one of the main causes of the environmental damage. In conclusion, when compared to traditional ways, organic rice cultivation has the potential to be a sustainable agricultural practice.
Author Contributions
Conceptualization: E.A., J.M., P.K., S.J.H., M.G., R.W.N., Z.J. and T.K. Data curation: E.A., J.M., P.K., S.J.H., M.G., R.W.N., Z.J. and T.K. Formal analysis: E.A., J.M., S.J.H., M.G., Z.J. and T.K. Investigation: E.A., J.M., P.K., S.J.H., M.G., R.W.N., Z.J., T.K. and M.K. Methodology: E.A., J.M., S.J.H., Z.J. and T.K. Project administration: E.A. Resources: E.A., S.J.H., M.G., R.W.N. and Z.J. Software: E.A., J.M., S.J.H., M.G., Z.J. and T.K. Supervision: J.M. Validation: E.A., J.M., P.K., S.J.H., M.G., R.W.N., Z.J., T.K. and M.K. Visualization: E.A., J.M., M.G., S.J.H., R.W.N., Z.J., T.K., P.K. and M.K. Writing—original draft: E.A. Writing—review and editing: J.M., P.K., S.J.H., M.G., R.W.N., Z.J., T.K. and M.K. All authors have read and agreed to the published version of the manuscript.
Funding
This research was supported by the University of South Bohemia in České Budějovice (GAJU 085/2022/Z).
Institutional Review Board Statement
Not applicable.
Informed Consent Statement
Not applicable.
Data Availability Statement
All the shareable data are included in the main manuscript.
Conflicts of Interest
The authors declare no conflict of interest.
Appendix A. Overview of the Midpoint Impact Categories and Related Indicators
| Impact Category | Midpoint CharacterizationFactors | Indicator | Abbreviation | Unit | Damage Category | References |
|---|---|---|---|---|---|---|
| Particulate matter formation | Particulate matter formation potential | PM2.5 population intake | PMFP | kg PM2.5 eq | Human health | [85] |
| Human carcinogenic toxicity | Human toxicity potential | Risk increase of cancer disease incidence | HTPc | kg 1.4-DCB | Human health | [85] |
| Human non-carcinogenic toxicity | Human toxicity potential | Risk increase of non-cancer disease incidence | HTPnc | kg 1.4-DCB | Human health | [85] |
| Ionizing radiation | Ionizing radiation potential | Absorbed dose increase | IRP | kBq Co-60 eq | Human health | [85] |
| Ozone formation, Human health | Ozone formation potential—ecosystems | Increase tropospheric ozone increase | EOFP | kg NOx eq | Human health | [86] |
| Stratospheric ozone depletion | Ozone depletion potential | Stratospheric ozone decrease | ODP | kg CFC11 eq | Human health | [86] |
| Fossil resource scarcity | Fossil fuel potential | Upper heating value | FFP | kg oil eq | Resources | [44] |
| Mineral resource scarcity | Surplus ore potential | Increase of ore extracted | SOP | kg Cu eq | Resources | [87] |
| Water consumption | Water consumption potential | Increases of water consumed | WCP | m3 | Resources | [88] |
| Freshwater ecotoxicity | Freshwater ecotoxicity potential | Hazard-weighted increase in freshwaters | FETP | kg 1.4-DCB | Ecosystem quality | [69] |
| Freshwater eutrophication | Freshwater eutrophication potential | Phosphorus increases in freshwater | FEP | kg P eq | Ecosystem quality | [69,89,90] |
| Land use | Agricultural land occupation potential | Occupation and time-integrated land transformation | LOP | m2a crop eq | Ecosystem quality | [82,83] |
| Marine ecotoxicity | Marine ecotoxicity potential | Hazard-weighted increase in marine water | METP | kg 1,4-DCB | Ecosystem quality | [79,80] |
| Marine eutrophication | Marine eutrophication potential | Phosphorus increases in marine water | MEP | kg N eq | Ecosystem quality | [79,80] |
| Ozone formation, Terrestrial ecosystems | Ozone formation potential: humans | Tropospheric ozone population intake increase | HOFP | kg NOx eq | Ecosystem quality | [86] |
| Terrestrial acidification | Terrestrial acidification potential | Proton increase in natural soils | TAP | kg SO2 eq | Ecosystem quality | [85] |
| Terrestrial ecotoxicity | Terrestrial ecotoxicity potential | Hazard-weighted increase in natural soils | TETP | kg 1.4-DCB | Ecosystem quality | [85] |
| Global warming | Global warming potential | Infrared radiative forcing increase | GWP | kg CO2 eq | Climate change | [91] |
References
- Jolodar, N.R.; Karimi, S.; Bouteh, E.; Balist, J.; Prosser, R. Human Health and Ecological Risk Assessment of Pesticides from Rice Production in the Babol Roud River in Northern Iran. Sci. Total Environ. 2021, 772, 144729. [Google Scholar] [CrossRef] [PubMed]
- Escobar, N.; Bautista, I.; Peña, N.; Fenollosa, M.L.; Osca, J.M.; Sanjuán, N. Life Cycle Thinking for the Environmental and Financial Assessment of Rice Management Systems in the Senegal River Valley. J. Environ. Manag. 2022, 310, 114722. [Google Scholar] [CrossRef] [PubMed]
- Saber, Z.; Esmaeili, M.; Pirdashti, H.; Motevali, A.; Nabavi-Pelesaraei, A. Exergoenvironmental-Life Cycle Cost Analysis for Conventional, Low External Input and Organic Systems of Rice Paddy Production. J. Clean. Prod. 2020, 263, 121529. [Google Scholar] [CrossRef]
- Alipour, A.; Veisi, H.; Darijani, F.; Mirbagheri, B.; Behbahani, A.G. Study and Determination of Energy Consumption to Produce Conventional Rice of the Guilan Province. Res. Agric. Eng. 2012, 58, 99–106. [Google Scholar] [CrossRef]
- Niajalili, M.; Mayeli, P.; Naghashzadegan, M.; Poshtiri, A.H. Techno-Economic Feasibility of off-Grid Solar Irrigation for a Rice Paddy in Guilan Province in Iran: A Case Study. Sol. Energy 2017, 150, 546–557. [Google Scholar] [CrossRef]
- Lyu, Y.; Raugei, M.; Zhang, X.; Mellino, S.; Ulgiati, S. Environmental Cost and Impacts of Chemicals Used in Agriculture: An Integration of Emergy and Life Cycle Assessment. Renew. Sustain. Energy Rev. 2021, 151, 111604. [Google Scholar] [CrossRef]
- Xue, J.-F.; Pu, C.; Liu, S.-L.; Zhao, X.; Zhang, R.; Chen, F.; Xiao, X.-P.; Zhang, H.-L. Carbon and Nitrogen Footprint of Double Rice Production in Southern China. Ecol. Indic. 2016, 64, 249–257. [Google Scholar] [CrossRef]
- Leach, A.M.; Galloway, J.N.; Bleeker, A.; Erisman, J.W.; Kohn, R.; Kitzes, J. A Nitrogen Footprint Model to Help Consumers Understand Their Role in Nitrogen Losses to the Environment. Environ. Dev. 2012, 1, 40–66. [Google Scholar] [CrossRef]
- Humbert, J.-Y.; Dwyer, J.M.; Andrey, A.; Arlettaz, R. Impacts of Nitrogen Addition on Plant Biodiversity in Mountain Grasslands Depend on Dose, Application Duration and Climate: A Systematic Review. Glob. Change Biol. 2016, 22, 110–120. [Google Scholar] [CrossRef]
- Zhang, F.; Chen, X.; Vitousek, P. An Experiment for the World. Nature 2013, 497, 33–35. [Google Scholar] [CrossRef] [PubMed]
- Li, Y.; Zhang, W.; Ma, L.; Huang, G.; Oenema, O.; Zhang, F.; Dou, Z. An Analysis of China’s Fertilizer Policies: Impacts on the Industry, Food Security, and the Environment. J. Environ. Qual. 2013, 42, 972–981. [Google Scholar] [CrossRef]
- Zhang, D.; Wang, H.; Pan, J.; Luo, J.; Liu, J.; Gu, B.; Liu, S.; Zhai, L.; Lindsey, S.; Zhang, Y.; et al. Nitrogen Application Rates Need to Be Reduced for Half of the Rice Paddy Fields in China. Agric. Ecosyst. Environ. 2018, 265, 8–14. [Google Scholar] [CrossRef]
- Ju, X.-T.; Xing, G.-X.; Chen, X.-P.; Zhang, S.-L.; Zhang, L.-J.; Liu, X.-J.; Cui, Z.-L.; Yin, B.; Christie, P.; Zhu, Z.-L.; et al. Reducing Environmental Risk by Improving N Management in Intensive Chinese Agricultural Systems. Proc. Natl. Acad. Sci. USA 2009, 106, 3041–3046. [Google Scholar] [CrossRef] [PubMed]
- Chen, Y.; Zhang, X.; Yang, X.; Lv, Y.; Wu, J.; Lin, L.; Zhang, Y.; Wang, G.; Xiao, Y.; Zhu, X.; et al. Emergy Evaluation and Economic Analysis of Compound Fertilizer Production: A Case Study from China. J. Clean. Prod. 2020, 260, 121095. [Google Scholar] [CrossRef]
- Xu, X.; He, C.; Yuan, X.; Zhang, Q.; Wang, S.; Wang, B.; Guo, X.; Zhang, L. Rice Straw Biochar Mitigated More N2O Emissions from Fertilized Paddy Soil with Higher Water Content than That Derived from Ex Situ Biowaste. Environ. Pollut. 2020, 263, 114477. [Google Scholar] [CrossRef] [PubMed]
- Darzi-Naftchali, A.; Motevali, A.; Keikha, M. The Life Cycle Assessment of Subsurface Drainage Performance under Rice-Canola Cropping System. Agric. Water Manag. 2022, 266, 107579. [Google Scholar] [CrossRef]
- Sun, H.; Feng, Y.; Ji, Y.; Shi, W.; Yang, L.; Xing, B. N2O and CH4 Emissions from N-Fertilized Rice Paddy Soil Can Be Mitigated by Wood Vinegar Application at an Appropriate Rate. Atmos. Environ. 2018, 185, 153–158. [Google Scholar] [CrossRef]
- Sujatha, M.P.; Lathika, C.; Smitha, J.K. Sustainable and Efficient Utilization of Weed Biomass for Carbon Farming and Productivity Enhancement: A Simple, Rapid and Ecofriendly Approach in the Context of Climate Change Scenario. Environ. Chall. 2021, 4, 100150. [Google Scholar] [CrossRef]
- Bernas, J.; Bernasová, T.; Nedbal, V.; Neugschwandtner, R.W. Agricultural LCA for Food Oil of Winter Rapeseed, Sunflower, and Hemp, Based on Czech Standard Cultivation Practices. Agronomy 2021, 11, 2301. [Google Scholar] [CrossRef]
- He, X.; Qiao, Y.; Liang, L.; Knudsen, M.T.; Martin, F. Environmental Life Cycle Assessment of Long-Term Organic Rice Production in Subtropical China. J. Clean. Prod. 2018, 176, 880–888. [Google Scholar] [CrossRef]
- Seufert, V.; Ramankutty, N.; Foley, J.A. Comparing the Yields of Organic and Conventional Agriculture. Nature 2012, 485, 229–232. [Google Scholar] [CrossRef] [PubMed]
- Singh, B.; Shan, Y.H.; Johnson-Beebout, S.E.; Singh, Y.; Buresh, R.J. Chapter 3 Crop Residue Management for Lowland Rice-Based Cropping Systems in Asia. Adv. Agron. 2008, 98, 117–199. [Google Scholar]
- de Ponti, T.; Rijk, B.; van Ittersum, M.K. The Crop Yield Gap between Organic and Conventional Agriculture. Agric. Syst. 2012, 108, 1–9. [Google Scholar] [CrossRef]
- Ahmadpour, M.; Sinkakarimi, M.H.; Arabi, M.H.G.; Abdollahpour, M.; Mansour, A.; Asgharpour, A.; Islami, I.; Ahmadpour, M.; Hosseini, S.H.; Taleshi, M.S.; et al. Minerals and Trace Elements in a Long Term Paddy Soil-Rice System in the North of Iran: Human Health and Ecological Risk Assessment. J. Food Compos. Anal. 2022, 110, 104573. [Google Scholar] [CrossRef]
- Bernas, J.; Bernasová, T.; Kaul, H.-P.; Wagentristl, H.; Moitzi, G.; Neugschwandtner, R.W. Sustainability Estimation of Oat:Pea Intercrops from the Agricultural Life Cycle Assessment Perspective. Agronomy 2021, 11, 2433. [Google Scholar] [CrossRef]
- Fraval, S.; van Middelaar, C.E.; Ridoutt, B.G.; Opio, C. Life Cycle Assessment of Food Products. In Encyclopedia of Food Security and Sustainability; Elsevier: Amsterdam, The Netherlands, 2019; pp. 488–496. [Google Scholar]
- Shafie, S.M.; Masjuki, H.H.; Mahlia, T.M.I. Life Cycle Assessment of Rice Straw-Based Power Generation in Malaysia. Energy 2014, 70, 401–410. [Google Scholar] [CrossRef]
- Hesampour, R.; Bastani, A.; Heidarbeigi, K. Environmental Assessment of Date (Phoenix doctylifera) Production in Iran by Life Cycle Assessment. Inf. Process. Agric. 2018, 5, 388–393. [Google Scholar] [CrossRef]
- Oguzcan, S.; Dvarioniene, J.; Tugnoli, A.; Kruopiene, J. Environmental Impact Assessment Model for Substitution of Hazardous Substances by Using Life Cycle Approach. Environ. Pollut. 2019, 254, 112945. [Google Scholar] [CrossRef]
- Abdul Rahman, M.H.; Chen, S.S.; Abdul Razak, P.R.; Abu Bakar, N.A.; Shahrun, M.S.; Zin Zawawi, N.; Muhamad Mujab, A.A.; Abdullah, F.; Jumat, F.; Kamaruzaman, R.; et al. Life Cycle Assessment in Conventional Rice Farming System: Estimation of Greenhouse Gas Emissions Using Cradle-to-Gate Approach. J. Clean. Prod. 2019, 212, 1526–1535. [Google Scholar] [CrossRef]
- Mansoori, H.; Moghaddam, P.R.; Moradi, R. Energy Budget and Economic Analysis in Conventional and Organic Rice Production Systems and Organic Scenarios in the Transition Period in Iran. Front. Energy 2012, 6, 341–350. [Google Scholar] [CrossRef]
- Bacenetti, J.; Paleari, L.; Tartarini, S.; Vesely, F.M.; Foi, M.; Movedi, E.; Ravasi, R.A.; Bellopede, V.; Durello, S.; Ceravolo, C.; et al. May Smart Technologies Reduce the Environmental Impact of Nitrogen Fertilization? A Case Study for Paddy Rice. Sci. Total Environ. 2020, 715, 136956. [Google Scholar] [CrossRef] [PubMed]
- Hokazono, S.; Hayashi, K. Life Cycle Assessment of Organic Paddy Rotation Systems Using Land- and Product-Based Indicators: A Case Study in Japan. Int. J. Life Cycle Assess. 2015, 20, 1061–1075. [Google Scholar] [CrossRef]
- Jirapornvaree, I.; Suppadit, T.; Kumar, V. Assessing the Economic and Environmental Impact of Jasmine Rice Production: Life Cycle Assessment and Life Cycle Costs Analysis. J. Clean. Prod. 2021, 303, 127079. [Google Scholar] [CrossRef]
- Jiang, Z.; Zheng, H.; Xing, B. Environmental Life Cycle Assessment of Wheat Production Using Chemical Fertilizer, Manure Compost, and Biochar-Amended Manure Compost Strategies. Sci. Total Environ. 2021, 760, 143342. [Google Scholar] [CrossRef] [PubMed]
- Saber, Z.; van Zelm, R.; Pirdashti, H.; Schipper, A.M.; Esmaeili, M.; Motevali, A.; Nabavi-Pelesaraei, A.; Huijbregts, M.A.J. Understanding Farm-Level Differences in Environmental Impact and Eco-Efficiency: The Case of Rice Production in Iran. Sustain. Prod. Consum. 2021, 27, 1021–1029. [Google Scholar] [CrossRef]
- Khoshnevisan, B.; Rajaeifar, M.A.; Clark, S.; Shamahirband, S.; Anuar, N.B.; Mohd Shuib, N.L.; Gani, A. Evaluation of Traditional and Consolidated Rice Farms in Guilan Province, Iran, Using Life Cycle Assessment and Fuzzy Modeling. Sci. Total Environ. 2014, 481, 242–251. [Google Scholar] [CrossRef] [PubMed]
- Motevali, A.; Hashemi, S.J.; Tabatabaeekoloor, R. Environmental Footprint Study of White Rice Production Chain-Case Study: Northern of Iran. J. Environ. Manag. 2019, 241, 305–318. [Google Scholar] [CrossRef]
- Houshyar, E.; Chen, B.; Chen, G.Q. Environmental Impacts of Rice Production Analyzed via Social Capital Development: An Iranian Case Study with a Life Cycle Assessment/Data Envelopment Analysis Approach. Ecol. Indic. 2019, 105, 675–687. [Google Scholar] [CrossRef]
- Rezaei, M.; Soheilifard, F.; Keshvari, A. Impact of Agrochemical Emission Models on the Environmental Assessment of Paddy Rice Production Using Life Cycle Assessment Approach. Energy Sources Part A Recover. Util. Environ. Eff. 2021, 1–16. [Google Scholar] [CrossRef]
- Habibi, E.; Niknejad, Y.; Fallah, H.; Dastan, S.; Tari, D.B. Life Cycle Assessment of Rice Production Systems in Different Paddy Field Size Levels in North of Iran. Environ. Monit. Assess. 2019, 191, 202. [Google Scholar] [CrossRef]
- Morandini, N.P.; Petroudi, E.R.; Mobasser, H.R.; Dastan, S. Life Cycle Assessment of Crop Rotation Systems on Rice Cultivars in Northern Iran. Int. J. Plant Prod. 2020, 14, 531–548. [Google Scholar] [CrossRef]
- Dastan, S.; Ghareyazie, B.; Pishgar, S.H. Environmental Impacts of Transgenic Bt Rice and Non-Bt Rice Cultivars in Northern Iran. Biocatal. Agric. Biotechnol. 2019, 20, 101160. [Google Scholar] [CrossRef]
- Huijbregts, M.A.J.; Steinmann, Z.J.N.; Elshout, P.M.F.; Stam, G.; Verones, F.; Vieira, M.; Zijp, M.; Hollander, A.; van Zelm, R. ReCiPe2016: A Harmonised Life Cycle Impact Assessment Method at Midpoint and Endpoint Level. Int. J. Life Cycle Assess. 2017, 22, 138–147. [Google Scholar] [CrossRef]
- Liu, L.; Li, H.; Zhu, S.; Gao, Y.; Zheng, X.; Xu, Y. The Response of Agronomic Characters and Rice Yield to Organic Fertilization in Subtropical China: A Three-Level Meta-Analysis. Field Crops Res. 2021, 263, 108049. [Google Scholar] [CrossRef]
- Ghasemi-Mobtaker, H.; Kaab, A.; Rafiee, S.; Nabavi-Pelesaraei, A. A Comparative of Modeling Techniques and Life Cycle Assessment for Prediction of Output Energy, Economic Profit, and Global Warming Potential for Wheat Farms. Energy Rep. 2022, 8, 4922–4934. [Google Scholar] [CrossRef]
- Lu, B.; Yang, J.; Ijomah, W.; Wu, W.; Zlamparet, G. Perspectives on Reuse of WEEE in China: Lessons from the EU. Resour. Conserv. Recycl. 2018, 135, 83–92. [Google Scholar] [CrossRef]
- Moradi, M.; Nematollahi, M.A.; Mousavi Khaneghah, A.; Pishgar-Komleh, S.H.; Rajabi, M.R. Comparison of Energy Consumption of Wheat Production in Conservation and Conventional Agriculture Using DEA. Environ. Sci. Pollut. Res. 2018, 25, 35200–35209. [Google Scholar] [CrossRef]
- Hokazono, S.; Hayashi, K. Variability in Environmental Impacts during Conversion from Conventional to Organic Farming: A Comparison among Three Rice Production Systems in Japan. J. Clean. Prod. 2012, 28, 101–112. [Google Scholar] [CrossRef]
- Zappe, A.L.; Fernandes de Oliveira, P.; Boettcher, R.; Rodriguez, A.L.; Machado, Ê.L.; Mantey dos Santos, P.A.; Rodriguez Lopez, D.A.; Amador de Matos, M.A. Human Health Risk and Potential Environmental Damage of Organic and Conventional Nicotiana Tobaccum Production. Environ. Pollut. 2020, 266, 114820. [Google Scholar] [CrossRef]
- Goglio, P.; Smith, W.N.; Grant, B.B.; Desjardins, R.L.; Gao, X.; Hanis, K.; Tenuta, M.; Campbell, C.A.; McConkey, B.G.; Nemecek, T.; et al. A Comparison of Methods to Quantify Greenhouse Gas Emissions of Cropping Systems in LCA. J. Clean. Prod. 2018, 172, 4010–4017. [Google Scholar] [CrossRef]
- Regina, K.; Kaseva, J.; Esala, M. Emissions of Nitrous Oxide from Boreal Agricultural Mineral Soils—Statistical Models Based on Measurements. Agric. Ecosyst. Environ. 2013, 164, 131–136. [Google Scholar] [CrossRef]
- Harun, S.N.; Hanafiah, M.M.; Aziz, N.I.H.A. An LCA-Based Environmental Performance of Rice Production for Developing a Sustainable Agri-Food System in Malaysia. Environ. Manag. 2021, 67, 146–161. [Google Scholar] [CrossRef] [PubMed]
- Mungkung, R.; Pengthamkeerati, P.; Chaichana, R.; Watcharothai, S.; Kitpakornsanti, K.; Tapananont, S. Life Cycle Assessment of Thai Organic Hom Mali Rice to Evaluate the Climate Change, Water Use and Biodiversity Impacts. J. Clean. Prod. 2019, 211, 687–694. [Google Scholar] [CrossRef]
- Meng, F.; Olesen, J.E.; Sun, X.; Wu, W. Inorganic Nitrogen Leaching from Organic and Conventional Rice Production on a Newly Claimed Calciustoll in Central Asia. PLoS ONE 2014, 9, e98138. [Google Scholar] [CrossRef]
- Sampanpanish, P. Use of Organic Fertilizer on Paddy Fields to Reduce Greenhouse Gases. Sci. Asia 2012, 38, 323. [Google Scholar] [CrossRef]
- Ikemura, Y.; Shukla, M.K.; Tahboub, M.; Leinauer, B. Some Physical and Chemical Properties of Soil in Organic and Conventional Farms for a Semi-Arid Ecosystem of New Mexico. J. Sustain. Agric. 2008, 31, 149–170. [Google Scholar] [CrossRef]
- Seufert, V.; Mehrabi, Z.; Gabriel, D.; Benton, T.G. Current and Potential Contributions of Organic Agriculture to Diversification of the Food Production System. In Agroecosystem Diversity; Elsevier: Amsterdam, The Netherlands, 2019; pp. 435–452. [Google Scholar]
- Blengini, G.A.; Busto, M. The Life Cycle of Rice: LCA of Alternative Agri-Food Chain Management Systems in Vercelli (Italy). J. Environ. Manag. 2009, 90, 1512–1522. [Google Scholar] [CrossRef]
- Bacenetti, J.; Fusi, A.; Negri, M.; Bocchi, S.; Fiala, M. Organic Production Systems: Sustainability Assessment of Rice in Italy. Agric. Ecosyst. Environ. 2016, 225, 33–44. [Google Scholar] [CrossRef]
- Zheng, S.; Chen, B.; Qiu, X.; Chen, M.; Ma, Z.; Yu, X. Distribution and Risk Assessment of 82 Pesticides in Jiulong River and Estuary in South China. Chemosphere 2016, 144, 1177–1192. [Google Scholar] [CrossRef]
- Sumon, K.A.; Rashid, H.; Peeters, E.T.H.M.; Bosma, R.H.; Van den Brink, P.J. Environmental Monitoring and Risk Assessment of Organophosphate Pesticides in Aquatic Ecosystems of North-West Bangladesh. Chemosphere 2018, 206, 92–100. [Google Scholar] [CrossRef] [PubMed]
- Jaipieam, S.; Visuthismajarn, P.; Sutheravut, P.; Siriwong, W.; Thoumsang, S.; Borjan, M.; Robson, M. Organophosphate Pesticide Residues in Drinking Water from Artesian Wells and Health Risk Assessment of Agricultural Communities, Thailand. Hum. Ecol. Risk Assess. An Int. J. 2009, 15, 1304–1316. [Google Scholar] [CrossRef] [PubMed]
- Wang, L.; Gao, S.; Yin, X.; Yu, X.; Luan, L. Arsenic Accumulation, Distribution and Source Analysis of Rice in a Typical Growing Area in North China. Ecotoxicol. Environ. Saf. 2019, 167, 429–434. [Google Scholar] [CrossRef] [PubMed]
- Chen, H.; Tang, Z.; Wang, P.; Zhao, F.-J. Geographical Variations of Cadmium and Arsenic Concentrations and Arsenic Speciation in Chinese Rice. Environ. Pollut. 2018, 238, 482–490. [Google Scholar] [CrossRef] [PubMed]
- Feng, W.; Guo, Z.; Xiao, X.; Peng, C.; Shi, L.; Ran, H.; Xu, W. Atmospheric Deposition as a Source of Cadmium and Lead to Soil-Rice System and Associated Risk Assessment. Ecotoxicol. Environ. Saf. 2019, 180, 160–167. [Google Scholar] [CrossRef] [PubMed]
- Nie, S.-W.; Gao, W.-S.; Chen, Y.-Q.; Sui, P.; Eneji, A.E. Use of Life Cycle Assessment Methodology for Determining Phytoremediation Potentials of Maize-Based Cropping Systems in Fields with Nitrogen Fertilizer over-Dose. J. Clean. Prod. 2010, 18, 1530–1534. [Google Scholar] [CrossRef]
- Brentrup, F.; Küsters, J.; Lammel, J.; Barraclough, P.; Kuhlmann, H. Environmental Impact Assessment of Agricultural Production Systems Using the Life Cycle Assessment (LCA) Methodology II. The Application to N Fertilizer Use in Winter Wheat Production Systems. Eur. J. Agron. 2004, 20, 265–279. [Google Scholar] [CrossRef]
- Helmes, R.J.K.; Huijbregts, M.A.J.; Henderson, A.D.; Jolliet, O. Spatially Explicit Fate Factors of Phosphorous Emissions to Freshwater at the Global Scale. Int. J. Life Cycle Assess. 2012, 17, 646–654. [Google Scholar] [CrossRef]
- Cui, N.; Cai, M.; Zhang, X.; Abdelhafez, A.A.; Zhou, L.; Sun, H.; Chen, G.; Zou, G.; Zhou, S. Runoff Loss of Nitrogen and Phosphorus from a Rice Paddy Field in the East of China: Effects of Long-Term Chemical N Fertilizer and Organic Manure Applications. Glob. Ecol. Conserv. 2020, 22, e01011. [Google Scholar] [CrossRef]
- Zanon, J.A.; Favaretto, N.; Democh Goularte, G.; Dieckow, J.; Barth, G. Manure Application at Long-Term in No-till: Effects on Runoff, Sediment and Nutrients Losses in High Rainfall Events. Agric. Water Manag. 2020, 228, 105908. [Google Scholar] [CrossRef]
- Schmidt Rivera, X.C.; Bacenetti, J.; Fusi, A.; Niero, M. The Influence of Fertiliser and Pesticide Emissions Model on Life Cycle Assessment of Agricultural Products: The Case of Danish and Italian Barley. Sci. Total Environ. 2017, 592, 745–757. [Google Scholar] [CrossRef] [PubMed]
- Hasler, K.; Bröring, S.; Omta, S.W.F.; Olfs, H.-W. Life Cycle Assessment (LCA) of Different Fertilizer Product Types. Eur. J. Agron. 2015, 69, 41–51. [Google Scholar] [CrossRef]
- Gougoulias, C.; Clark, J.M.; Shaw, L.J. The Role of Soil Microbes in the Global Carbon Cycle: Tracking the below-Ground Microbial Processing of Plant-Derived Carbon for Manipulating Carbon Dynamics in Agricultural Systems. J. Sci. Food Agric. 2014, 94, 2362–2371. [Google Scholar] [CrossRef] [PubMed]
- Dai, H.; Chen, Y.; Yang, X.; Cui, J.; Sui, P. The Effect of Different Organic Materials Amendment on Soil Bacteria Communities in Barren Sandy Loam Soil. Environ. Sci. Pollut. Res. 2017, 24, 24019–24028. [Google Scholar] [CrossRef] [PubMed]
- Wang, L.; Li, Q.; Coulter, J.A.; Xie, J.; Luo, Z.; Zhang, R.; Deng, X.; Li, L. Winter Wheat Yield and Water Use Efficiency Response to Organic Fertilization in Northern China: A Meta-Analysis. Agric. Water Manag. 2020, 229, 105934. [Google Scholar] [CrossRef]
- Cai, A.; Xu, M.; Wang, B.; Zhang, W.; Liang, G.; Hou, E.; Luo, Y. Manure Acts as a Better Fertilizer for Increasing Crop Yields than Synthetic Fertilizer Does by Improving Soil Fertility. Soil Tillage Res. 2019, 189, 168–175. [Google Scholar] [CrossRef]
- Xu, R.; Zhao, A.; Yuan, J.; Jiang, J. PH Buffering Capacity of Acid Soils from Tropical and Subtropical Regions of China as Influenced by Incorporation of Crop Straw Biochars. J. Soils Sediments 2012, 12, 494–502. [Google Scholar] [CrossRef]
- Sangakkara, U.R.; Liedgens, M.; Soldati, A.; Stamp, P. Root and Shoot Growth of Maize (Zea Mays) as Affected by Incorporation of Crotalaria Juncea and Tithonia Diversifolia as Green Manures. J. Agron. Crop Sci. 2004, 190, 339–346. [Google Scholar] [CrossRef]
- Hosseini-Fashami, F.; Motevali, A.; Nabavi-Pelesaraei, A.; Hashemi, S.J.; Chau, K. Energy-Life Cycle Assessment on Applying Solar Technologies for Greenhouse Strawberry Production. Renew. Sustain. Energy Rev. 2019, 116, 109411. [Google Scholar] [CrossRef]
- Hussain, M.; Malik, R.N.; Taylor, A.; Puettmann, M. Hazardous Pollutants Emissions and Environmental Impacts from Fuelwood Burned and Synthetic Fertilizers Applied by Tobacco Growers in Pakistan. Environ. Technol. Innov. 2017, 7, 169–181. [Google Scholar] [CrossRef]
- Su, Y.; He, S.; Wang, K.; Shahtahmassebi, A.R.; Zhang, L.; Zhang, J.; Zhang, M.; Gan, M. Quantifying the Sustainability of Three Types of Agricultural Production in China: An Emergy Analysis with the Integration of Environmental Pollution. J. Clean. Prod. 2020, 252, 119650. [Google Scholar] [CrossRef]
- Lu, H.; Bai, Y.; Ren, H.; Campbell, D.E. Integrated Emergy, Energy and Economic Evaluation of Rice and Vegetable Production Systems in Alluvial Paddy Fields: Implications for Agricultural Policy in China. J. Environ. Manag. 2010, 91, 2727–2735. [Google Scholar] [CrossRef] [PubMed]
- Houshyar, E.; Wu, X.F.; Chen, G.Q. Sustainability of Wheat and Maize Production in the Warm Climate of Southwestern Iran: An Emergy Analysis. J. Clean. Prod. 2018, 172, 2246–2255. [Google Scholar] [CrossRef]
- van Zelm, R.; Huijbregts, M.A.J.; van de Meent, D. USES-LCA 2.0—A Global Nested Multi-Media Fate, Exposure, and Effects Model. Int. J. Life Cycle Assess. 2009, 14, 282–284. [Google Scholar] [CrossRef]
- Hayashi, K.; Nakagawa, A.; Itsubo, N.; Inaba, A. Expanded Damage Function of Stratospheric Ozone Depletion to Cover Major Endpoints Regarding Life Cycle Impact Assessment (12 Pp). Int. J. Life Cycle Assess. 2006, 11, 150–161. [Google Scholar] [CrossRef]
- Vieira, M.; Ponsioen, T.; Goedkoop, M.; Huijbregts, M. Surplus Cost Potential as a Life Cycle Impact Indicator for Metal Extraction. Resources 2016, 5, 2. [Google Scholar] [CrossRef]
- Pfister, S.; Koehler, A.; Hellweg, S. Assessing the Environmental Impacts of Freshwater Consumption in LCA. Environ. Sci. Technol. 2009, 43, 4098–4104. [Google Scholar] [CrossRef] [PubMed]
- Azevedo, L.B.; van Zelm, R.; Hendriks, A.J.; Bobbink, R.; Huijbregts, M.A.J. Global Assessment of the Effects of Terrestrial Acidification on Plant Species Richness. Environ. Pollut. 2013, 174, 10–15. [Google Scholar] [CrossRef]
- Azevedo, L.B.; Henderson, A.D.; van Zelm, R.; Jolliet, O.; Huijbregts, M.A.J. Assessing the Importance of Spatial Variability versus Model Choices in Life Cycle Impact Assessment: The Case of Freshwater Eutrophication in Europe. Environ. Sci. Technol. 2013, 47, 13565–13570. [Google Scholar] [CrossRef]
- de Baan, L.; Alkemade, R.; Koellner, T. Land Use Impacts on Biodiversity in LCA: A Global Approach. Int. J. Life Cycle Assess. 2013, 18, 1216–1230. [Google Scholar] [CrossRef]


Publisher’s Note: MDPI stays neutral with regard to jurisdictional claims in published maps and institutional affiliations. |
© 2022 by the authors. Licensee MDPI, Basel, Switzerland. This article is an open access article distributed under the terms and conditions of the Creative Commons Attribution (CC BY) license (https://creativecommons.org/licenses/by/4.0/).