Article

Distribution, Risk Assessment, and Source Identification of Potentially Toxic Elements in the Sediments of the Upper Reaches of Zhanghe River, Haihe Basin

1
State Key Laboratory of Simulation and Regulation of Water Cycle in River Basin, China Institute of Water Resources and Hydropower Research, Beijing 100038, China
2
School of Water Conservancy and Hydroelectric Power, Hebei University of Engineering, Handan 056038, China
3
Hebei Key Laboratory of Intelligent Water Conservancy, Hebei University of Engineering, Handan 056038, China
*
Authors to whom correspondence should be addressed.
Sustainability 2022, 14(23), 15885; https://doi.org/10.3390/su142315885
Submission received: 19 October 2022 / Revised: 24 November 2022 / Accepted: 26 November 2022 / Published: 29 November 2022

Abstract

:
The Beijing–Tianjin–Hebei region is mostly located in the Haihe Basin. Studying the distribution and sources of potentially toxic elements (PTEs) and heavy metals in the upper reaches of Zhanghe River, the largest tributary of Haihe runoff, is of great significance to the water security of Beijing–Tianjin–Hebei region, a world-class urban agglomeration. In this study, 32 sediment samples were collected in the upper reaches of Zhanghe River, and the concentrations of eight PTEs were analyzed. The results show that the concentrations of PTEs in sediments ranked are as follows: Mn > Cr > Zn > Cu > Pb > Co > As > Cd. Cr, Cu, Zn, and Cd show a random spatial variation trend; Mn, As, and Pb are mainly distributed in the headwaters of the Zhuozhang River. Ninety percent of samples of Cr, Cu, Zn, Cd, and Pb are under the threshold effect level, and 16% of the Cr samples are above the probable effect level. PTEs in the study area have low to moderate pollution as the enrichment factor and geo-accumulation index showed, and the contribution of anthropogenic sources to the enhancement of PTEs in sediment samples is still at a preliminary stage. Potential ecological risk results indicate that 96% of the upper reaches of Zhanghe River have a low risk level. The three evaluation methods all point out that Cr is the main pollutant in the upper reaches of Zhanghe River, and the Southern Headwater of Zhuozhang River is the main polluted area. Cr, Mn, Co, and Pb originate from mining activities and road dust, while Cu, Zn, As, and Cd originate from agricultural activities.

1. Introduction

With rapid economic development and urban expansion, potentially toxic elements (PTEs) are being discharged increasingly into the aquatic environment from geological sources such as weathered rocks or anthropogenic sources such as industry and agriculture, resulting in the river PTE pollution becoming more and more serious [1,2]. In particular, the toxicity and high bioaccumulation of PTEs have attracted extensive attention from scholars [3]. As the sediment is a source or sink in the aquatic environment [4,5,6], PTE pollution in the sediment has become a complicated and persistent problem [7]. PTEs discharged into the aquatic environment can accumulate in sediments through adsorption, hydrolysis, and precipitation. Moreover, PTEs in sediments may re-enter the overlying water with the change of environment, causing secondary pollution [8]. These pollutants may even enter the food chain, affecting the survival of aquatic organisms and the safety of human health [9]. After a long period of cumulative effect, sediments can act as an indicator for pollution levels in rivers, reflecting historical and recent river pollution conditions [10,11].
As the largest and most dynamic region in northern China, the Beijing–Tianjin–Hebei region has attracted more and more attention from China and even the whole world; most of its area is located in the Haihe Basin [12]. Its water environment problem causes a great concern accompanied by the development of industry and urbanization [13,14]. The research on the nine sub-basins of the Haihe Basin found that most of the sediment related to Hg seemed to come from natural sources [15]. There was a moderate risk of Hg in the Da Qing He, Luan He, and Tu-Hai Ma-Xia rivers. The Cd in the sediments of the Haihe Basin was at a high level of pollution and became a severe pollutant of this ecosystem [16]. The study on the three reservoirs in Beijing and Tianjin showed the environmental water quality standard of PTEs, which provided a reference for local water quality assessment in China [17]. However, the ecological risk of PTEs in the Zhanghe River (ZR), which is the source of the Haihe Basin and flows in its tributaries, is seldom studied. Many mathematicians ignored the main factors of ecological risk in the assessment process [18,19,20].
ZR is located upstream of the southern system of the Haihe Basin, and its upper reaches are an important source of water for industrial and agricultural production and drinking water for Shanxi, Hebei, and Henan provinces [21]. There are many coal and chemical enterprises in this region, and there are also many roads built along the river to transport coal and chemical products. Studies have shown that the exploitation and combustion of fossil fuels and the processing and transportation of ore will bring PTEs into rivers [22,23,24]. Therefore, to ensure the water safety of the Haihe Basin and understand the distribution, composition, and source of PTEs in the Haihe Basin, the PTE pollution in sediments of the upper reaches of ZR was studied in combination with the local industrial structure.
For the future ecological risk management and water security control of the ZR basin, this study collected 32 sampling sites and measured the concentrations of Cr, Mn, Co, Cu, Zn, As, Cd, and Pb, with the following specific objectives: (1) investigate the concentration level and enrichment degree of PTEs and visualize the pollution situation; (2) evaluate the pollution and risk caused by each PTE, using the ratio of EI to RI to explain the role of PTE toxicity in increasing risk; and (3) combine local industrial structure and multivariate analysis to discuss the possible sources of PTEs.

2. Materials and Methods

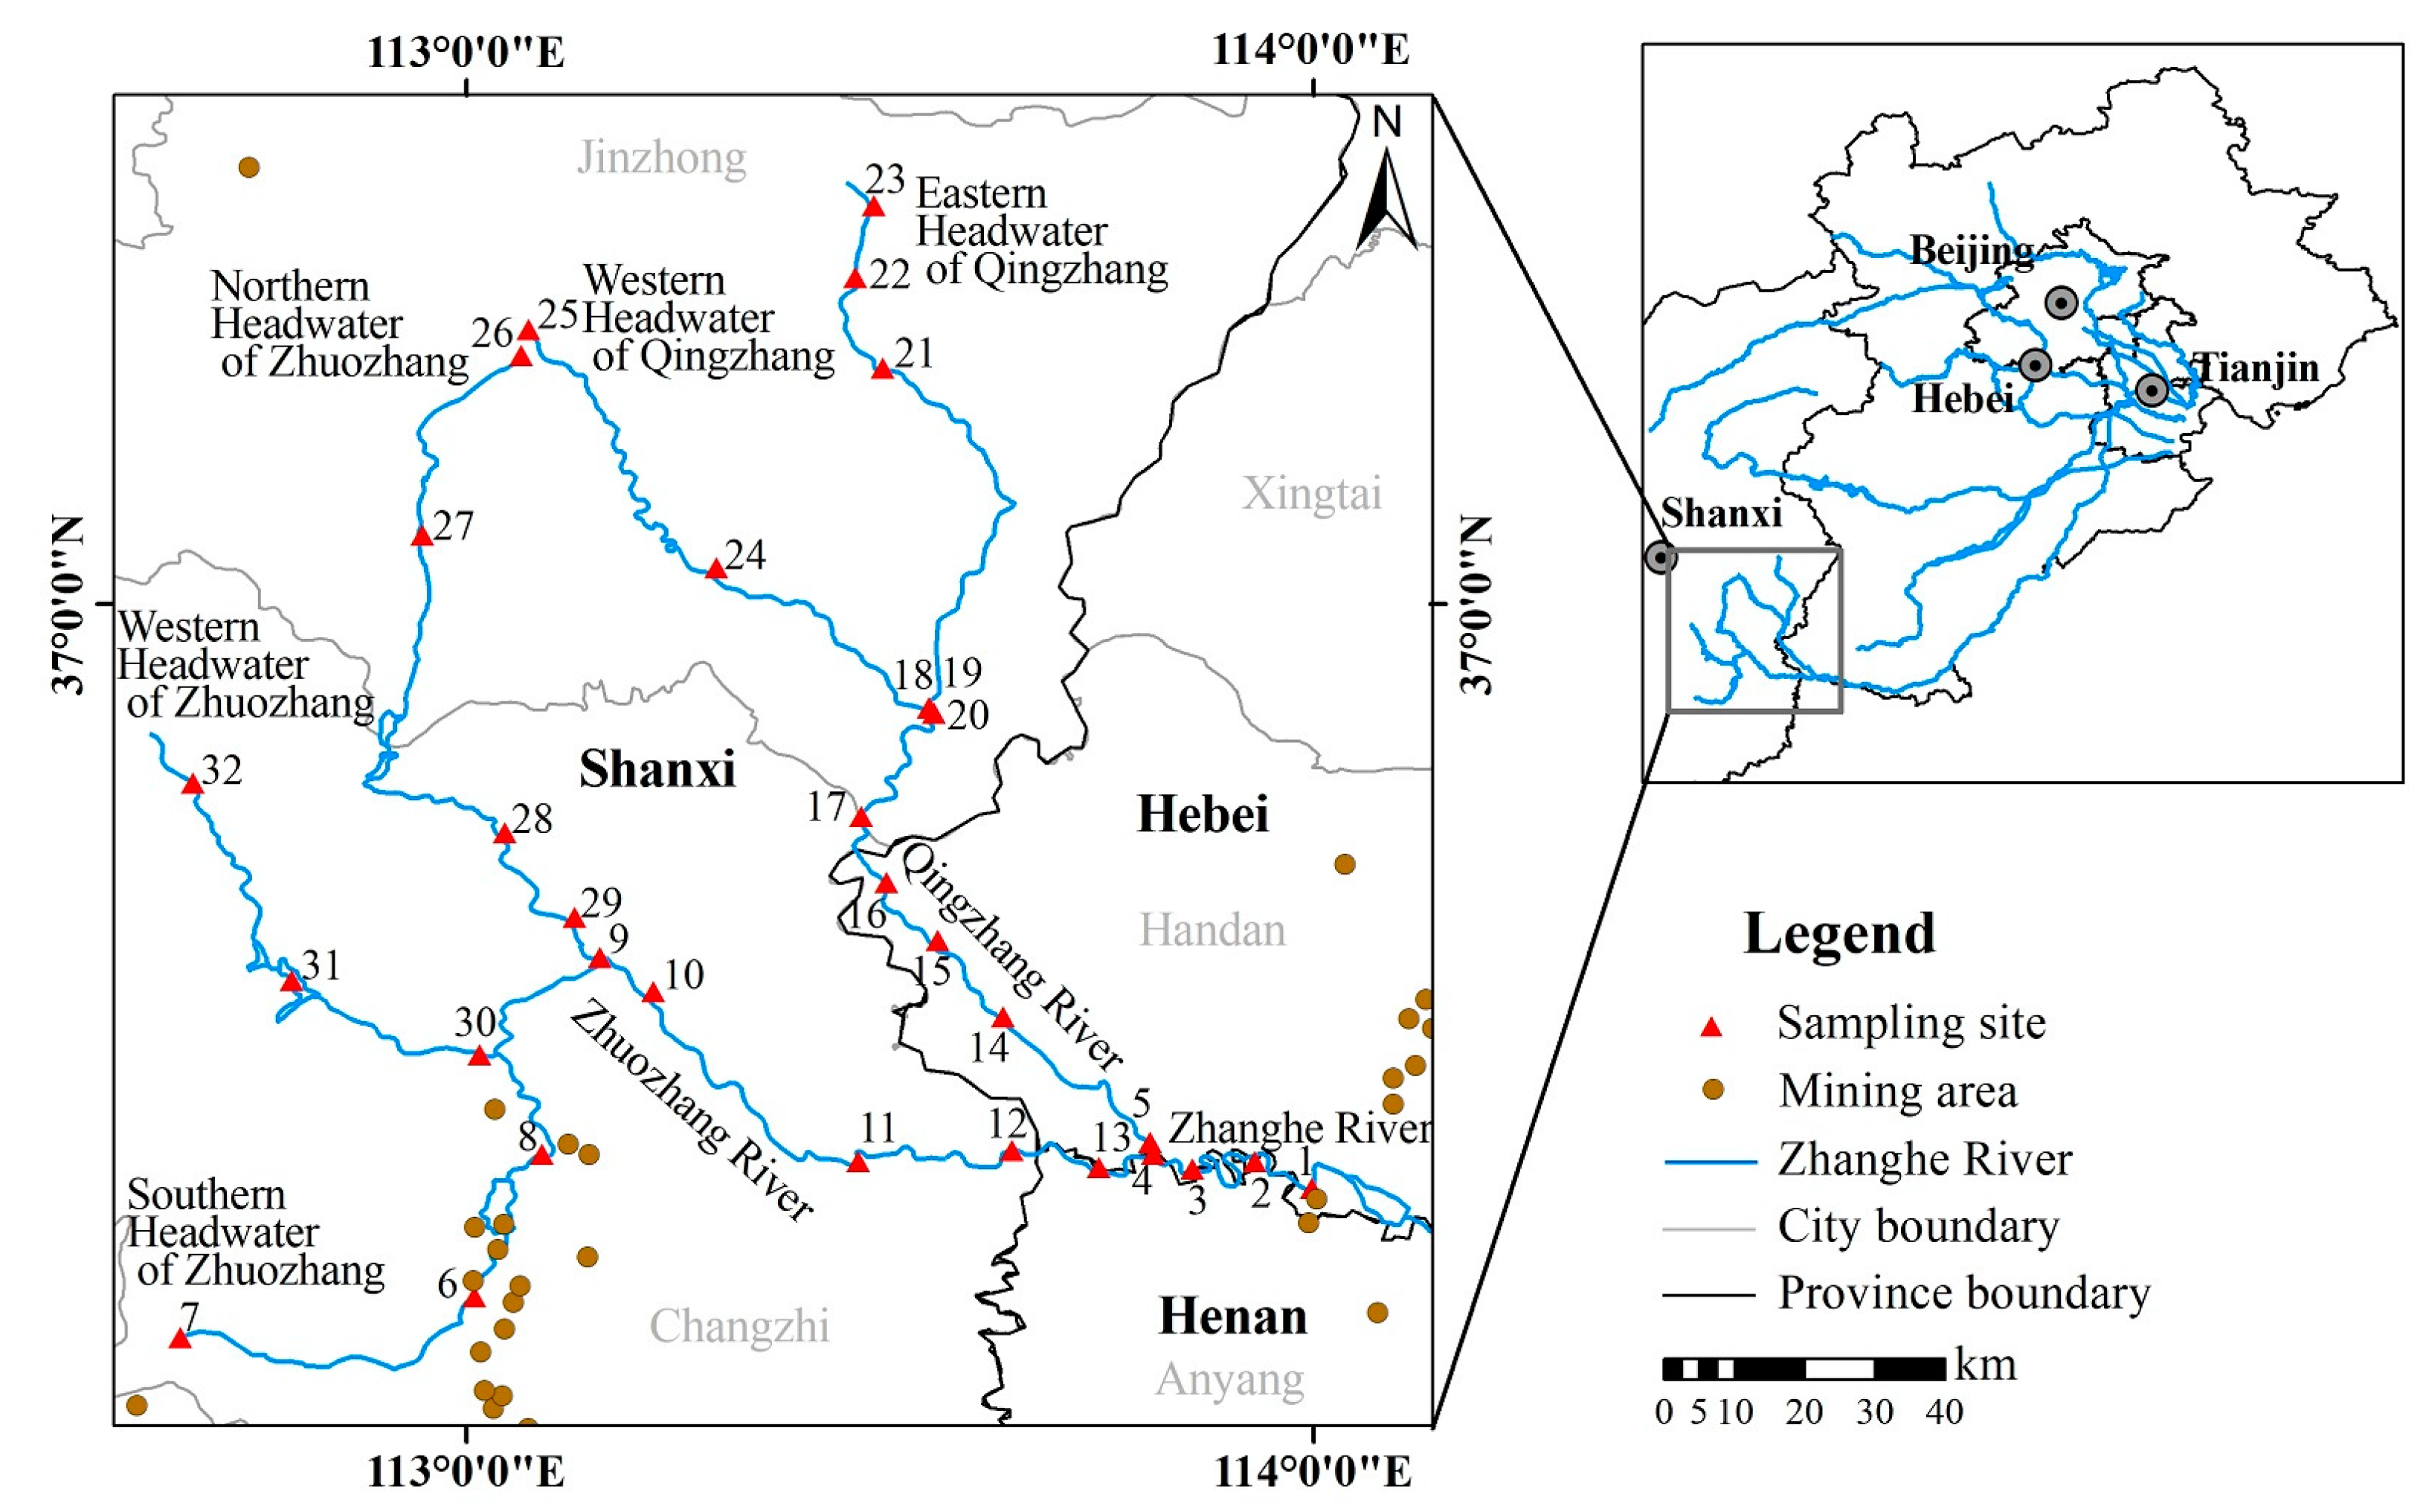
2.1. Study Area and Sample Collection

Zhanghe River, flowing through four cities in three provinces, belongs to the Zhangwei South Canal water system of Haihe Basin, including Qingzhang River and Zhuozhang River, two independent water systems [25]. The whole basin is a temperate to warm temperate climate, with four distinct seasons, a short summer and a long winter, and a short frost-free period. The annual precipitation is about 560 mm, and the overall terrain of the basin is high in the northwest, low in the southeast, and relatively flat in the middle. Qingzhang River has many mountains, cliffs, gullies, and steep terrain. Zhuozhang River has rolling hills and a plain. Qingzhang River is divided into the mainstream of the Qingzhang River (MQR) and the headwaters of the Qingzhang River (HQR), such as the eastern headwater of the Qingzhang River (EHQR) and western headwater of the Qingzhang River (WHQR), with a basin area of 5339 km2. Zhuozhang River is divided into the mainstream of the Zhuozhang River (MZR) and headwaters of the Zhuozhang River (HZR), such as the western headwater of the Zhuozhang River (WHZR), southern headwater of the Zhuozhang River (SHZR), and northern headwater of the Zhuozhang River (NHZR), with a basin area of 11688 km2. It is called the Zhanghe River (ZR) after the convergence of the Zhuozhang River and Qingzhang River.
In September 2019, 32 sampling sites of surface sediments were set up in the upper reaches of ZR (Figure 1), considering the spatial geographical location and accessibility of the study area. To avoid confusion in analyzing the spatial distribution, each tributary was divided into mainstream and headwater, such as ZR, MZR, MQR, HZR, and HQR. S1~S5 belonged to ZR, S9~S13 belonged to MZR, S14~S20 belonged to MQR, S6~S8 and S26~S32 belonged to HZR, and S21~S25 belonged to HQR. Surface sediment samples were taken with a grab sampler. Three samples were taken at each sampling site, mixed thoroughly, put into polyethylene bags with sealed numbers, and stored away from light for immediate transfer to the laboratory. After freeze-drying, stones, tree fragments, and other residues were removed. A mortar was used to grind the sediment samples after impurities were removed, and after passing the ground sediments were passed through a 100-mesh nylon sieve to remove large particles, the processed samples were stored at 4 °C before analysis.

2.2. Potentially Toxic Elements Analysis

Before the concentrations of PTEs were measured, precisely 0.2 g of the treated sediment sample was weighed and digested with 6 mL HNO3 and 2 mL HF in a Teflon container (SP-12, Preekem, Shanghai, China). After microwave digestion, an electric heating plate heated to 150 °C was used to drive out acid. After cooling, the residue was diluted with deionized water to 25 mL and the solution was passed through a 0.45 μm membrane. For the measurement of PTE concentrations, inductively coupled plasma mass spectrometry (ICP-MS NeXI0N 300X, Perkin Elmer, Waltham, MA, USA) was used for the determination of PTEs in the digested solution under routine operation. Quality assurance and quality control were strictly guaranteed in all experiments [26]. The instruments were calibrated with standards before the experiments. The glassware and polyethylene vessels were rinsed with deionized water after a soak in 1 mol/L HNO3 for more than 24 h; all reagents used were of analytical purity or higher grade. Standard reference materials used to calibrate the accuracy and precision of the analytical procedures were GBW07311 (GSD-11) and GBW07366 (GSD-23). The recoveries ranged from 94% to 103% for total PTEs and 93% to 105% for PTE fractions ((sum of fractions/total PTEs) × 100). Blank samples were used to eliminate experimental errors, and experiments were repeated to ensure the accuracy of experimental data. Relative deviations were within ± 5% for all batches of treated duplicate samples.

2.3. Assessment of Sediment Pollution

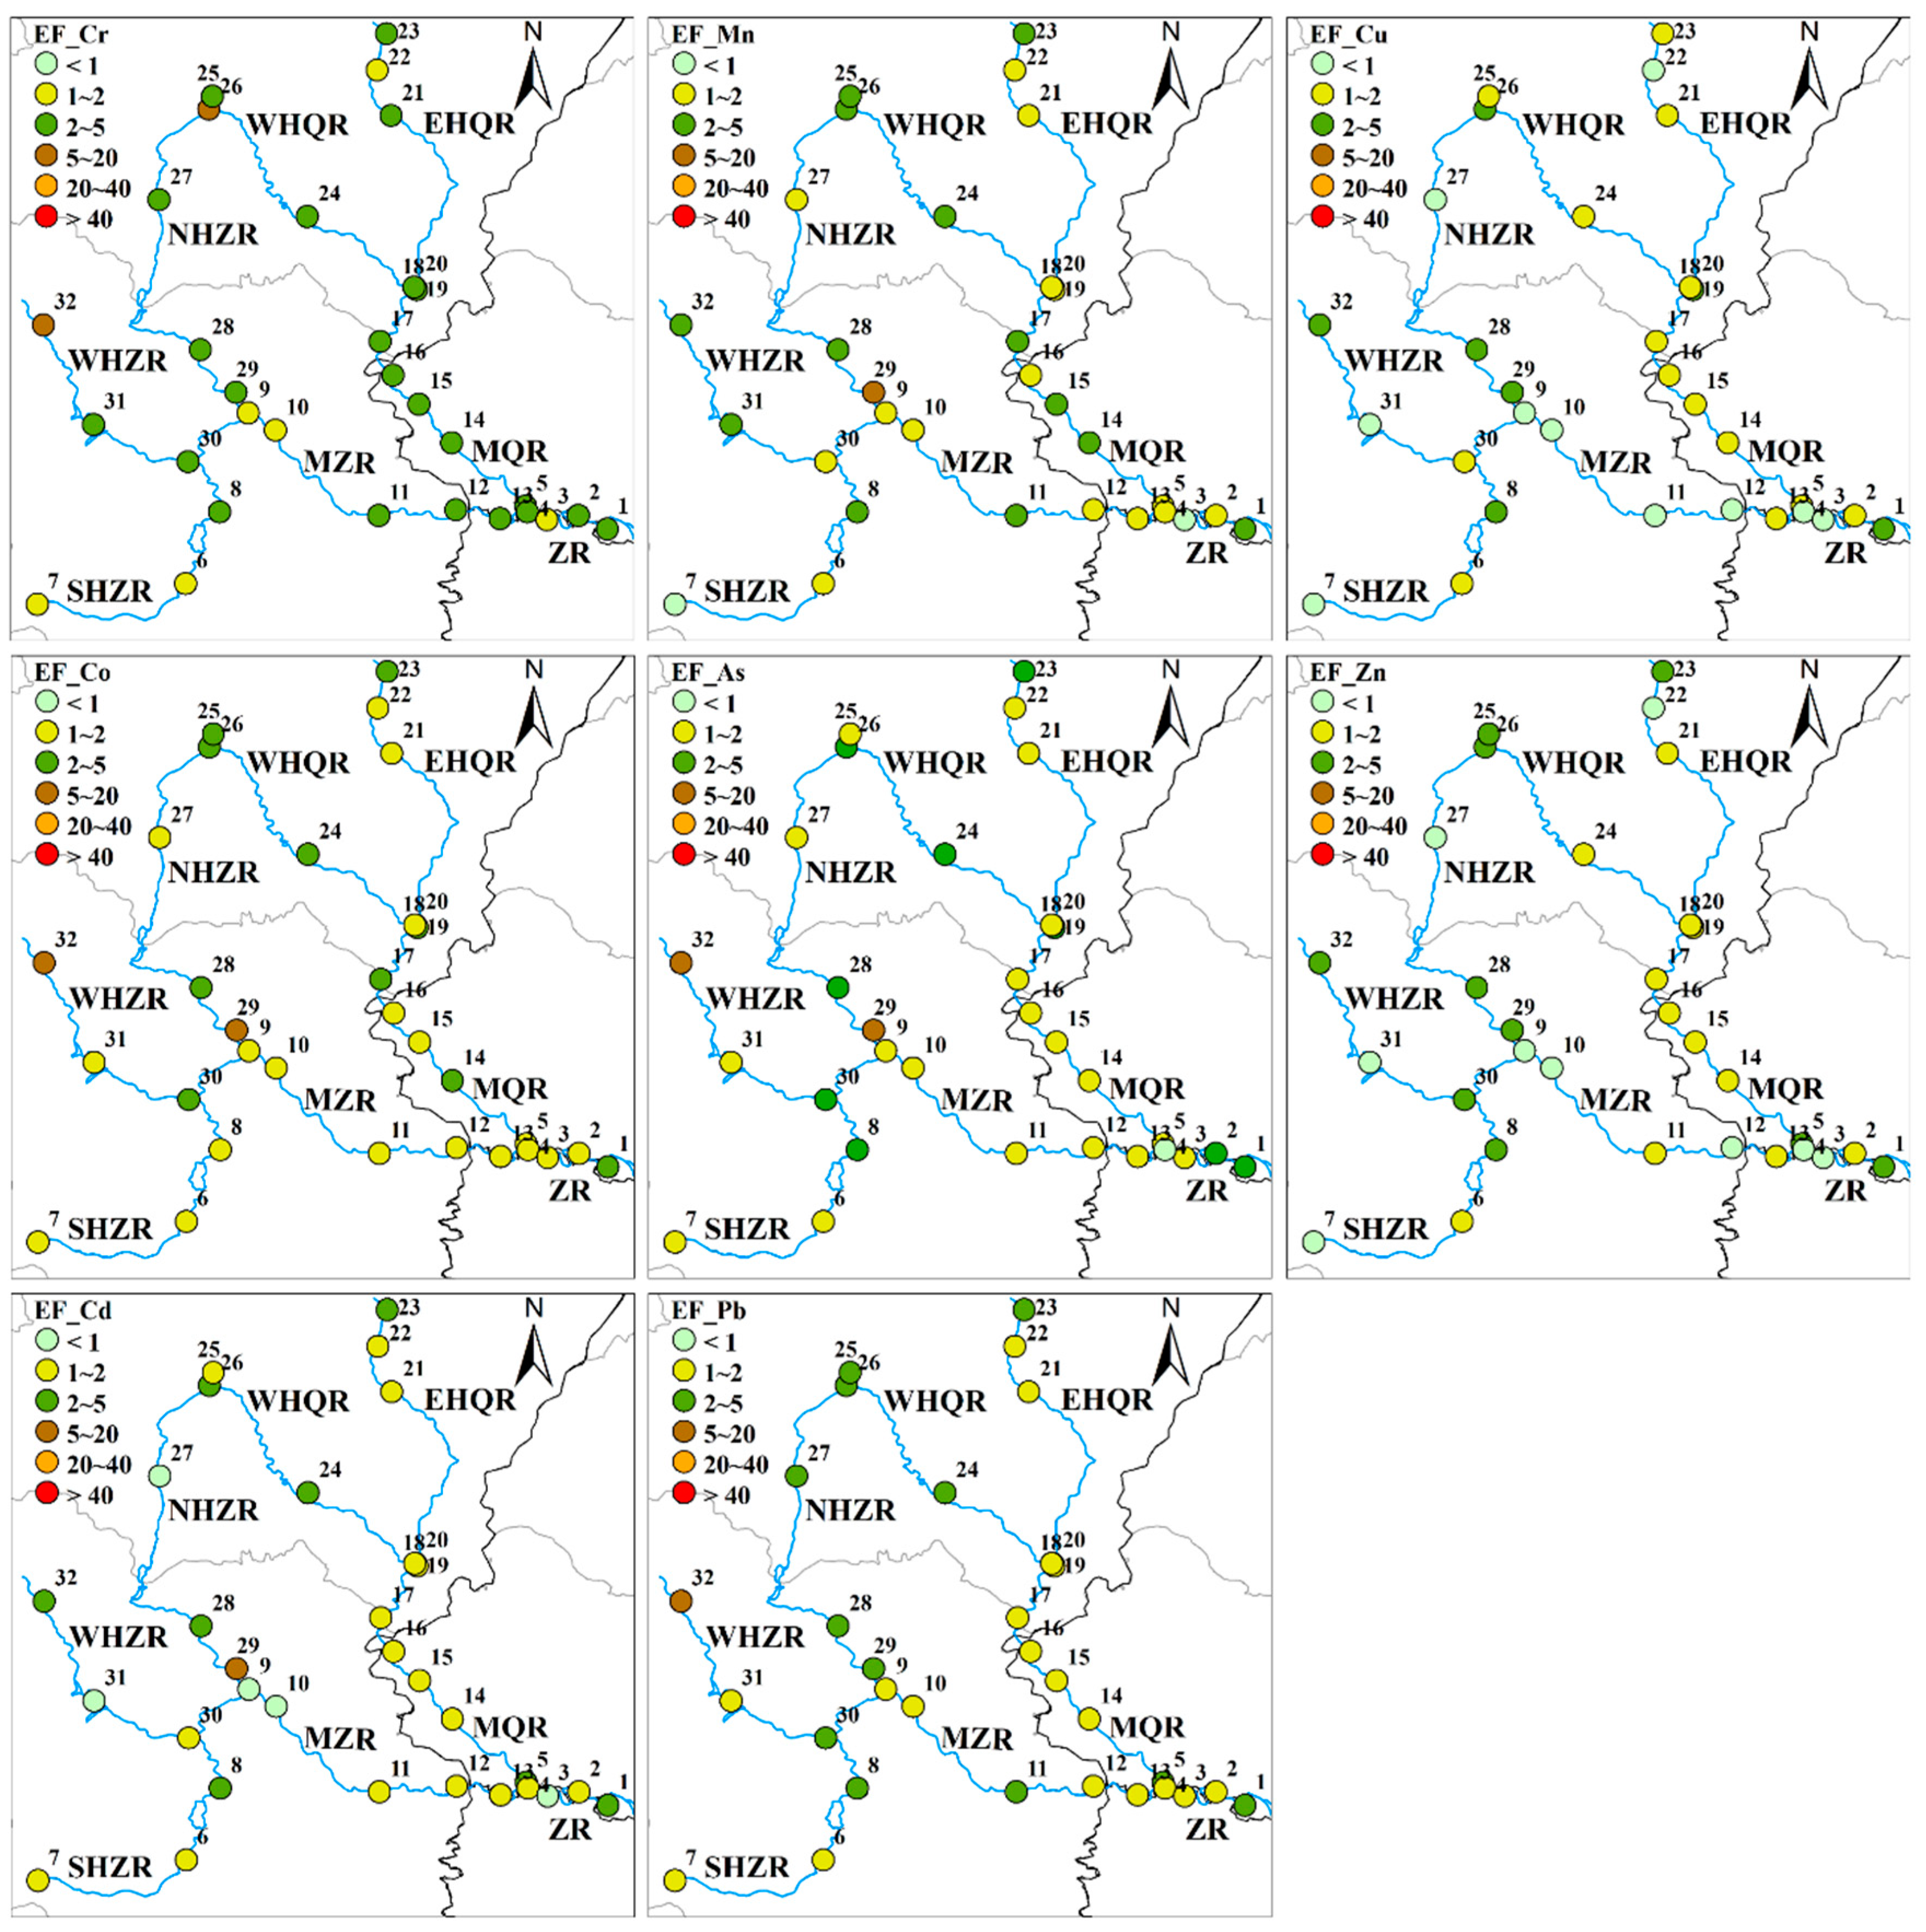
2.3.1. Enrichment Factor

The enrichment factor (EF) can be used to distinguish between anthropogenic or natural geological inputs of PTEs and evaluate the concentration levels of anthropogenic inputs [27]. The reference PTE chosen in this study is Al, which is stable in the process of migration. The following is the equation for calculating EF:
E F = [ C i / C n ] s a m p l e / [ B i / B n ] b a c k g r o u n d
where C i and C n are the measured concentrations of the PTE to be assessed and the reference PTE, respectively. B i and B n are the background concentrations of the PTE to be assessed and reference PTE, respectively. The relationship between the grades of EF and the degrees of pollution is shown in Table 1.

2.3.2. Geo-Accumulation Index

A previous work [28] proposed the geo-accumulation index (Igeo) to evaluate the environmental pollution of PTEs. The following is the equation for calculating Igeo:
I g e o = log 2 [ C i / ( k × B i ) ]
where C i and B i are the same as aforesaid. k is the coefficient that eliminates the difference in background concentration and is typically taken as 1.5 [29]. The relationship between the grades of Igeo and the degree of pollution is shown in Table 1 [30].

2.3.3. Potential Ecological Risk Index

Considering the biological toxicity factors of PTEs, the potential ecological risk index (RI) could comprehensively assess the risk of PTEs [31]. The following equations show the calculation process of RI:
C F i = C i / B i
E r i = T r i × C F i
R I = i = 1 n E r i
where C i and B i are the same as aforesaid; E r i (EI) and T r i are the potential ecological risk factor and biological toxicity factor of PTEs, respectively. RI is the potential ecological risk index of PTEs at the sampling site. PTE biological toxicity factors from largest to smallest are Cd (30), As (10), Co (5), Cu (5), Pb (5), Cr (2), Mn (1), and Zn (1) [32]. The relationships between the RI and the pollution level are listed in Table 2.

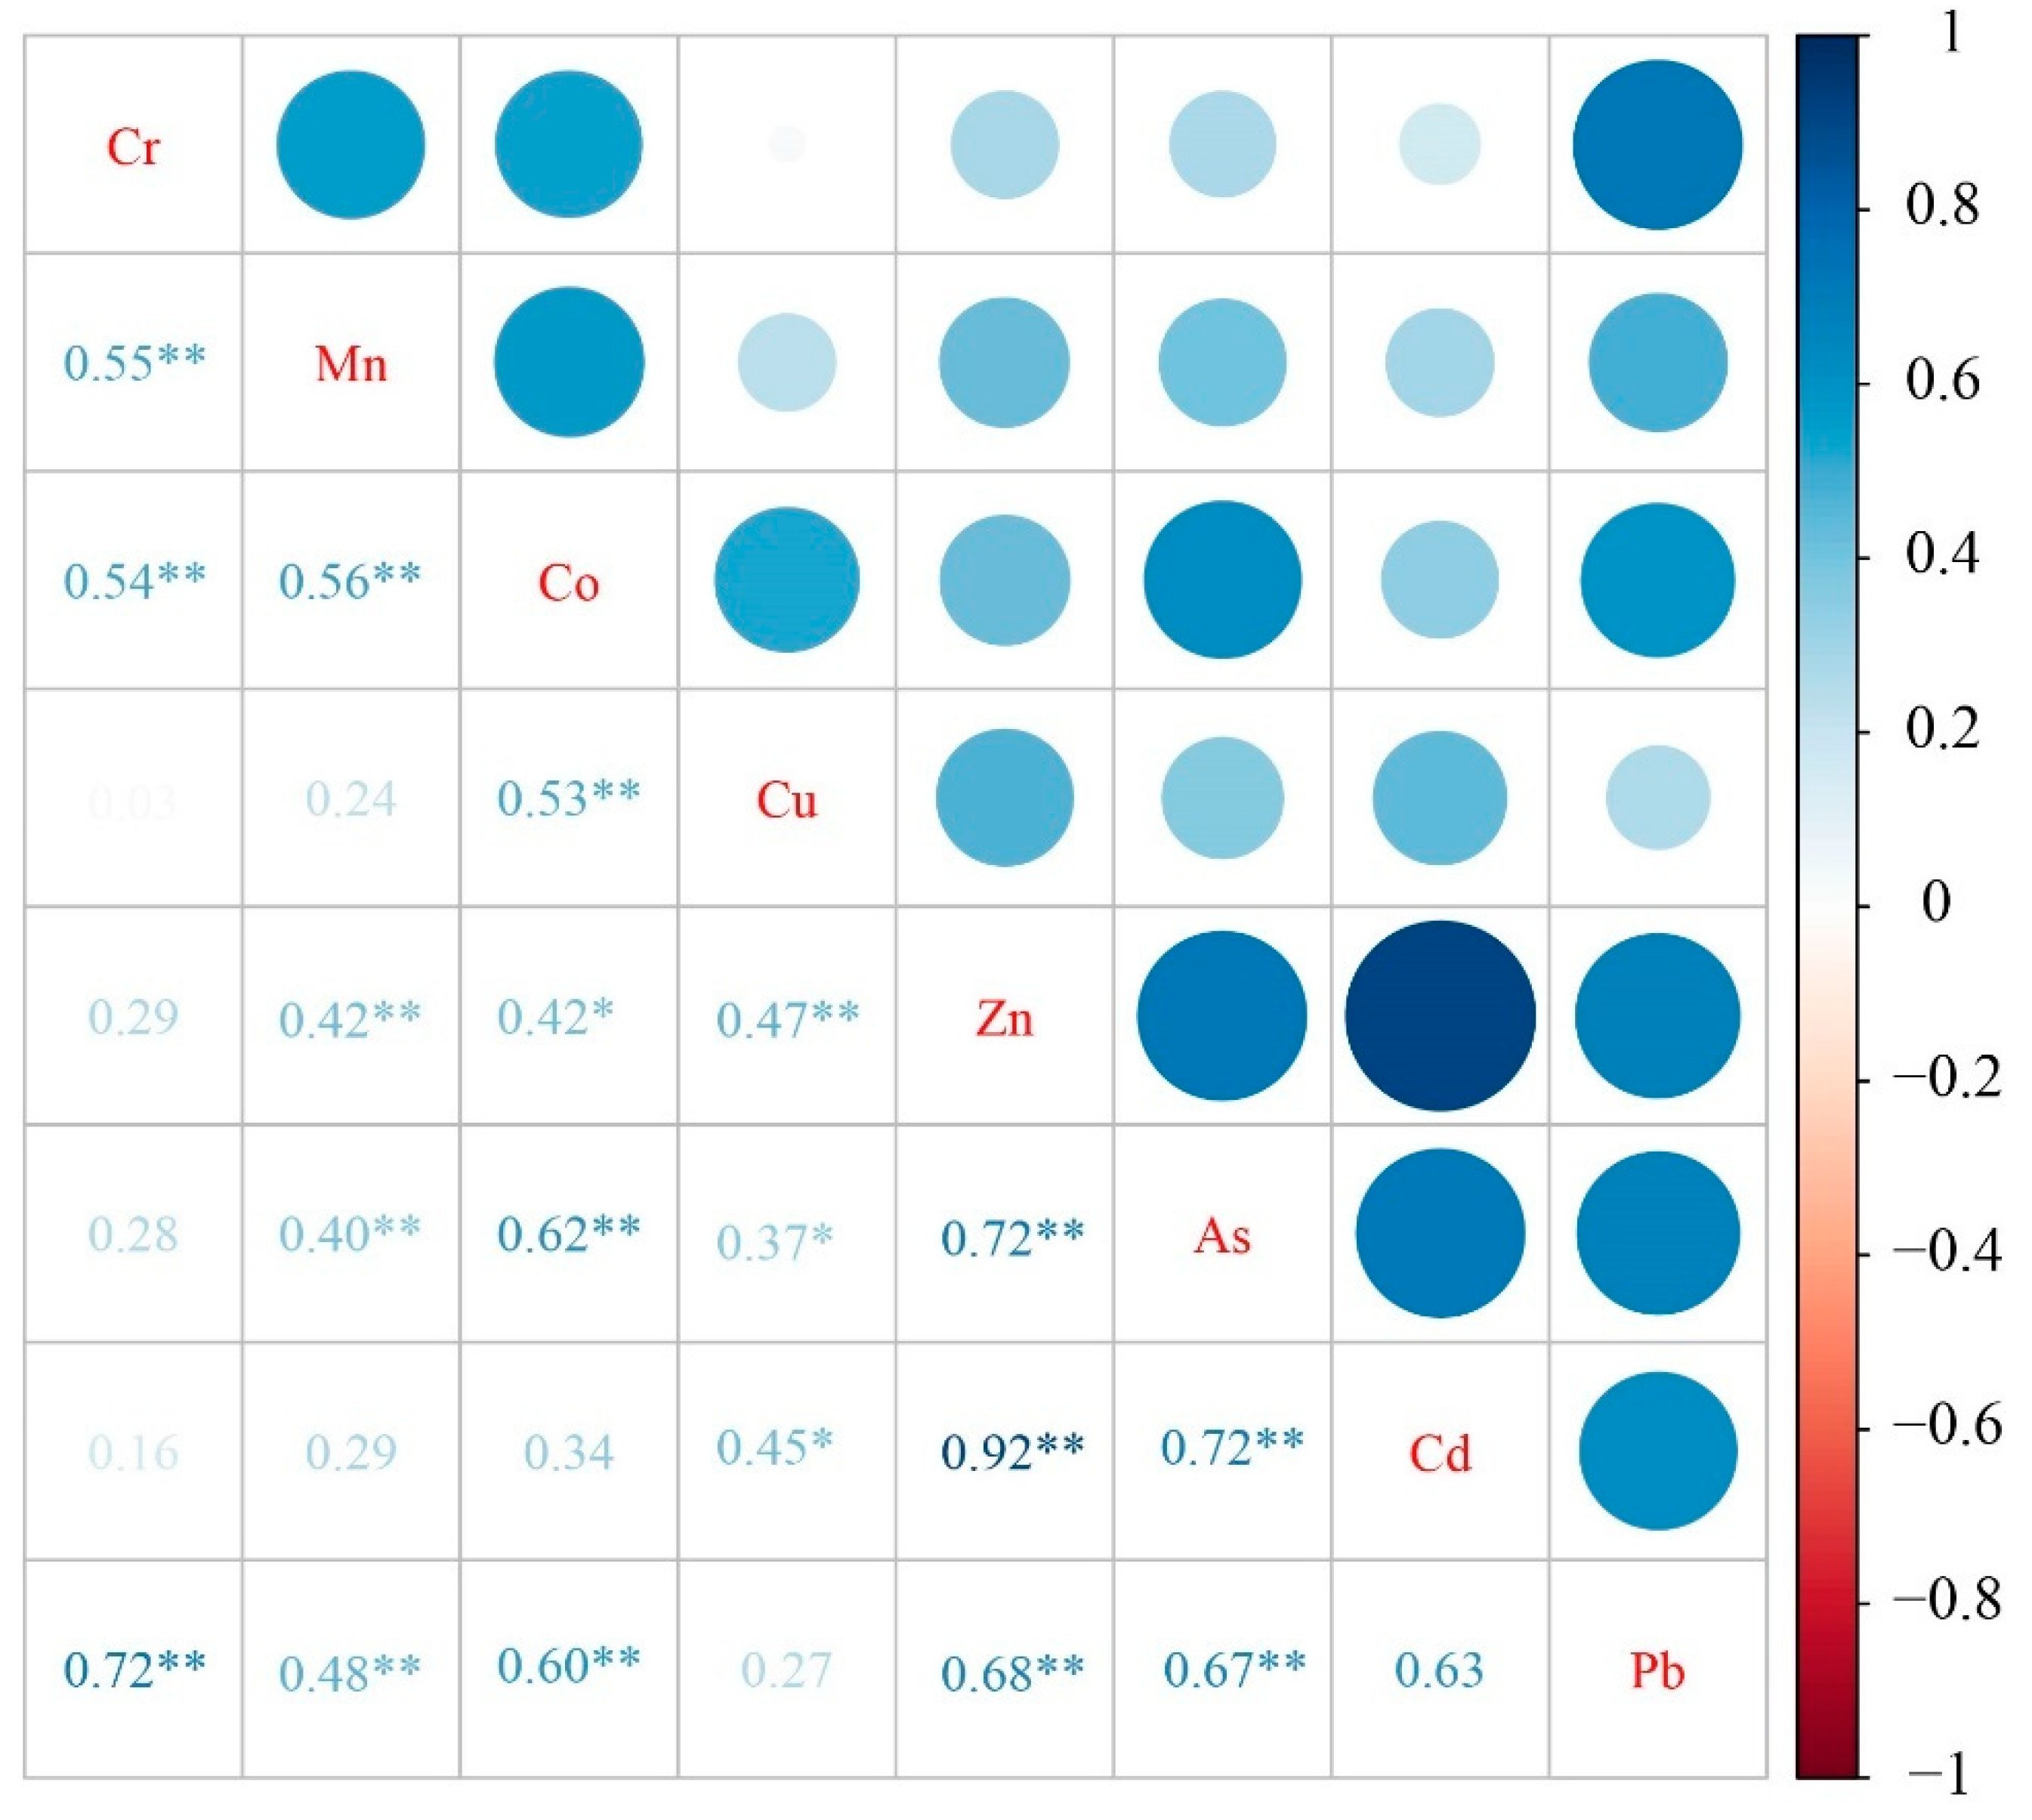
2.4. Statistical Analysis

SPSS 19.0 (IBM, New York, NY, USA) and Origin 2018b were used for all statistical analyses. The differences in PTE concentrations between mainstreams and headwaters were analyzed using one-way analysis of variance (ANOVA) [33]. To ensure the normal distribution of PTE concentrations, the one-sample Kolmogorov–Smirnov (K-S) normality test was adopted. The possible sources of PTEs were assessed by Pearson correlation analysis and principal component analysis (PCA). The concentration classification and EF classification of PTEs were completed using ArcGIS 10.7.

3. Results and Discussion

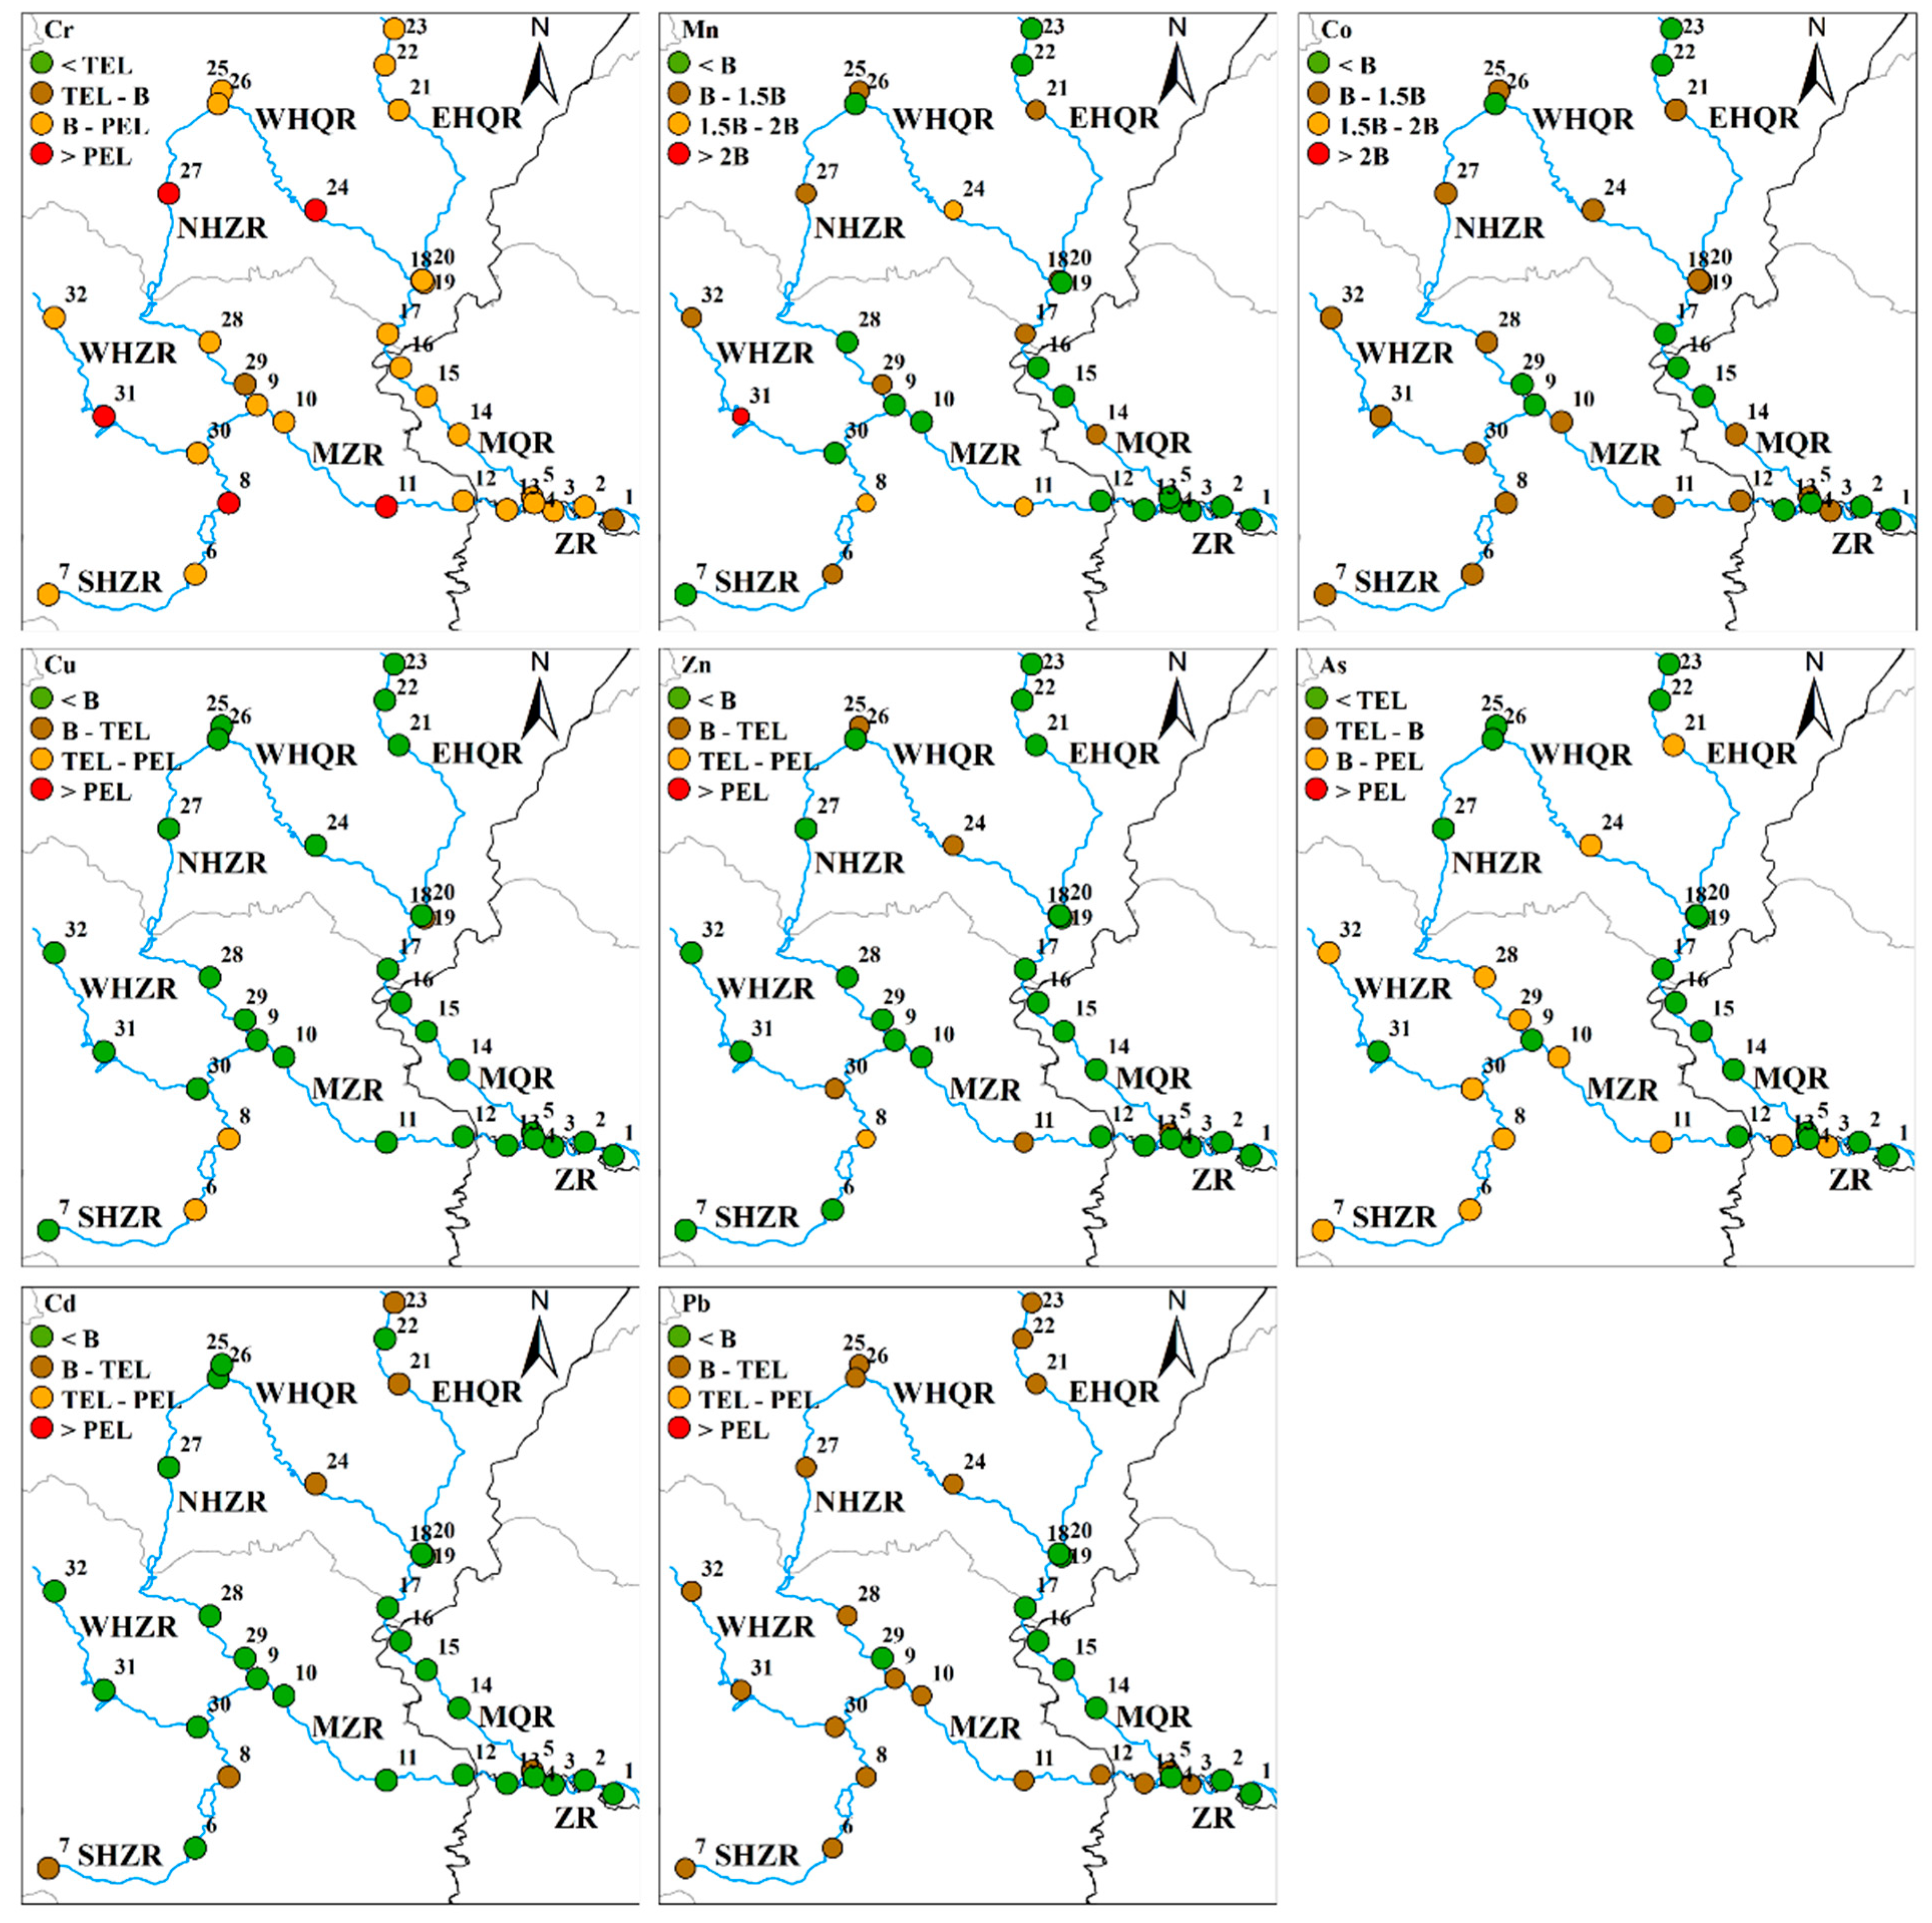
3.1. Spatial Distribution of PTEs in the River Sediments

The parameters of PTEs in sediments of the upper reaches of ZR are shown in Table 3. The mean content of PTEs in the study area is as follows: Mn > Cr > Zn > Cu > Pb > Co > As > Cd. The background concentrations of PTEs refer to the original chemical composition and structural characteristics of soil. A comparison of the background concentrations of PTEs with the measured values can be performed to determine whether the sediments in this area have changed greatly due to external influences. The background concentrations of Chinese soil elements are used as a guideline for PTEs [34]. The average contents of Cu, Zn, and Cd are below the background concentrations, while those of Cr, Mn, Co, As, and Pb are above the background concentrations. This is especially the case for Co and Pb, with more than 60% of the samples having higher concentrations than background concentrations, showing the possible pollution of Co and Pb in this area. According to the threshold effect level (TEL) and probable effect level (PEL), it is possible to judge the possible adverse biological effects of PTEs [35,36]. Adverse biological effects occur rarely when PTE concentrations are below the TEL, occasionally when concentrations are between the TEL and PEL, and frequently when concentrations exceeded the PEL [37]. For Cd and Pb, all sample concentrations are less than the TEL, but 16% of the samples have Cr concentrations above the PEL. Cr might cause undesirable biological effects, and care should be taken to prevent the adverse biological impact of Cr in sediments on the ecological environment. It deserves to be mentioned that the background concentrations of Cr and As exceed the corresponding TEL and might still have adverse biological effects even if the concentrations are within the background concentrations.
According to the one-way ANOVA of PTEs, as shown in Figure 2, the concentrations of Cr, Cu, Zn, and Cd in each tributary have no significant difference and are evenly distributed (p > 0.05). Mn, As, and Pb are mainly distributed in the HZR, and Co is evenly distributed throughout the upper reaches of ZR (p < 0.05). Each PTE was divided into four concentration gradients, which are shown in Figure 3. Cr is the most concentrated; the contents of Cr in the MZR, HZR, and WHQR were over the PEL. As was mainly distributed in the MZR and the HZR. The contents of Cd and Pb are under the TEL in all sampling sites, and in the SHZR, the content of Zn is between the TEL and PEL. Cu is only present in the SHZR at TEL and PEL. The content of Mn is more than twice the background concentration in the WHZR, and the Co contents are all within 1.5 times the background concentration. In general, Cu, Zn, and Cd have low concentrations, while Cr and As have the highest. The pollution is mainly distributed in the MZR and HZR, especially in the SHZR, where all eight PTEs are enriched, showing that the mining activities of SHZR input many PTEs into rivers [36]. S8 is the most seriously polluted site; it is located in Luzhou District, Changzhi City, which covers the smallest area but has a much higher population density than other urban areas. The growing industrial activities might pose a considerable risk to the ecosystem [39]. In contrast, the ZR has low levels of PTE concentrations. According to the Zhangwei Canal Administration Bureau, the ZR basin is rich in coal and petroleum resources, mainly including coal, petroleum, steel, power generation, textile, paper, and various processing enterprises, with a wide distribution of point-source pollution resulting in spatial differences in PTEs [40].
The PTE concentrations in the study area were compared with those in other areas in China (Table 4). The upper reaches of ZR have higher Cr concentrations than other rivers except for the Yellow River. In contrast, As and Cd in the upper reaches of ZR have lower concentrations than those in other rivers. Although Pb is at moderate levels compared to other rivers, Pb at low concentrations could also threaten the survival of aquatic organisms [41]. These differences in the concentrations of PTEs might be caused by different industrial structures [20]. Due to the lack of reference information on Mn and Co concentrations in river sediments, it is impossible to make a comprehensive comparison for Mn and Co. Overall, the upper reaches of ZR have low to moderate PTE concentrations in the sediments.

3.2. Potentially Toxic Element Pollution Characteristics

EF is used to identify abnormal concentrations of PTEs in sediments so as to better identify the enrichment level in rivers [45]. Figure 4 shows EF values of PTEs in sediments of the upper reaches of ZR. The mean EF values of Cu, Zn, As, and Cd are under 2, and they are slightly enriched, showing a similar spatial distribution. The mean EF values of Cr, Mn, Co, and Pb are over 2; this indicates that the geogenic rock weathering is no longer the main source and anthropogenic activities may become the dominant factor [46]. Cr is moderately enriched at most sampling sites, indicating the pollution of Cr was prevalent in the area. Overall, ZR, MQR, and MZR have lower enrichment levels. PTEs reached significant enrichment in HZR, and the pollution is more severe than that in the other regions. This is generally consistent with the concentration distribution, indicating that most of the PTEs in HZR come from anthropogenic activities.
The pollution levels of PTEs were evaluated by Igeo; Figure 5 shows the Igeo values of PTEs in the sediments of the upper reaches of ZR. The pollution of PTEs ranges from practically unpolluted to moderately polluted. The mean Igeo values of all PTEs do not exceed 0 and belong to practically unpolluted. The Igeo value of Cr with the most serious pollution level does not exceed 2, showing this PTE does not pollute the upper reaches of ZR for the time being. It is worth noting that the PTEs in S8 have abnormally high Igeo values, and the most elevated, for Zn, reaches 1.33, which is in the state of no pollution to moderate pollution. This means anthropogenic activities have given rise to PTE pollution [47]. The results of the EF and Igeo show consistency, both pointing to Cr as the primary pollutant, with pollution distributed at the HZR.

3.3. Potential Ecological Risk

In this study, RI was used to assess ecological risks. The RI is formed by the EI accumulation of each PTE, as shown in Figure 6. The RI of all samples is under 150, indicating that the upper reaches of ZR present a low ecological risk. The RI of S8 is 143.26, which is higher than that of other sites. The rest of the samples range from 41.57 to 74.97. Since this method emphasizes the role of toxicology, the ratio of EI and RI is adopted in this study to explain the role of toxicity of PTEs in increasing risks. Although the content of Cd is the lowest, it provides the highest risk, followed by As, and while the content of Mn is the largest, it provides a more negligible risk. Although concentration is one of the indicators to calculate ecological risk, the toxicity of PTEs plays a leading role, and high biological toxicity factors cause high ecological risk [48]. Therefore, Cd and As should receive more attention. The results of RI show that the PTEs are generally of low risk in the sediments of the upper reaches of ZR, but pollution control, especially the comprehensive treatment of PTEs with high biological toxicity factors, is still needed in some aspects.

3.4. Possible Sources of PTEs

Discussing the source of PTEs is an essential step in formulating pollution control strategies [49,50]. Both natural and anthropogenic sources can release PTEs into rivers. Natural sources include volcanic eruptions, forest fires, and rock weathering, while major anthropogenic sources include industrial discharge, agricultural activities, domestic sewage, and fossil fuel burning [26,51]. The interrelationships between PTEs were analyzed using Pearson correlation analysis. Correlations between PTEs might reveal the sources and distribution of metals in specific environments [52]. Significant correlations between PTEs indicate that their behavior is driven by similar factors [8], and relatively weak correlations suggest a complex source of PTEs due to industrial activities [47]. Cr, Mn, Co, and Pb are correlated significantly (p < 0.01), indicating a possible same source (Figure 7). PCA was used to reveal the potential sources of PTEs in this study. The results show that the concentrations of Mn, Co, As, and Pb are normally distributed (p < 0.05), while the contents of Cr, Cu, Zn, and Cd do not pass the normality test, indicating anthropogenic emissions existed in some areas [53]. The varimax rotation method is used for rotation in the process of PCA. The result of the KMO value is 0.73, while the Bartlett sphericity test result is < 0.001, which determines the applicability of the data of this study to the PCA. Two principal components whose eigenvalues exceeded 1 were determined, and 72.867% of the total variance was explained (Table 5).
The first principal component (PC1), which includes Cr, Mn, Co, and Pb, explained 39.704% of the total variance, agreeing with the Pearson correlation analysis. These four metals are spread throughout almost the whole upper reaches of ZR (Figure 2). Cr in nature is mainly derived from the crust [54,55], in forms such as weathering products and in association with Fe and Mn mineral deposits [56]. Co is commonly found in Mn and Pb ores. Considering that the mean EF of these metals is over 2, it is unlikely that natural activity represents a source for these metals. There are abundant mineral resources in the upper reaches of ZR, and the high pollution caused by long-term mining operations has caused tremendous damage to the ecological environment of the basin. It has been documented that in the mining process, PTEs exposed at the surface ground are finally washed into the river by rain [57,58], eventually accumulating in sediments. Therefore, these PTEs are likely to be imported into the river after being exposed to dust and rocks on the ground during mining activities. On the other hand, there are many roads built along the river. Due to road construction and mining, there are still millions of tons of PTE dust particles, including Cr and Pb from vehicle traffic, Mn from rock, and soil parent material [59], which enter rivers through atmospheric deposition, runoff erosion, and street-cleaning [60]. Thus, these PTEs might also reflect the accumulation of road dust and historical pollution levels in the past. Combining EF analysis, Pearson correlation analysis, and PCA, PC1 is derived from mining activities and road dust, indicating that the PTEs in rivers are controlled by the natural mineral composition of sediments and anthropogenic activities [61].
The second principal component (PC2), which includes Cu, Zn, As, and Cd, explained 33.863% of the total variance, agreeing with the Pearson correlation analysis. In China, livestock manure, fertilizers, pesticides, and plastic films are widely used in agricultural soils. Unreasonable large-scale application of pesticides and fertilizers not only causes waste of pesticides and fertilizers but also pollutes surface water and groundwater through loss and infiltration. Therefore, excessive application of pesticides or fungicides causes Cu and Zn accumulation in sediments [62]. In addition, Cd in the environment might be caused by long-term abuse of phosphate fertilizers and pesticides [32]. It is mainly used as a component of pesticides, herbicides, and fertilizers, and it migrates in suspension [18]. The PTEs released by these agricultural activities might eventually accumulate in the sediments through rainfall. It is reported that as the components of fertilizers and pesticides, As, Cd, and Zn also cause pollution of surface water [63]. Therefore, PC2 is derived from agricultural activities, indicating that agricultural production might cause ecological pollution of rivers. Therefore, PTE pollution in the upper reaches of ZR is mainly affected by mining activities and road dust, followed by the use of pesticides and fertilizers in agricultural production.

4. Conclusions

In this study, the pollution of eight PTEs from the upper reaches of ZR was analyzed. The results show that the concentration of Mn in river sediments is the highest and that of Cd is the lowest. Ninety percent of Cr, Cu, Zn, Cd, and Pb samples are under the TEL, and 16% of the Cr samples are above the PEL, which indicates potential adverse biological effects on the study area. The distribution of Cr, Cu, Zn, and Cd is relatively uniform; there is no obvious difference in concentration among the tributaries. In addition, compared with other major rivers in China, the concentration of PTEs in sediments in the upper reaches of ZR is at a low level. The average EF of Cr, Mn, Co, and Pb exceeds 2, indicating that these PTEs may come from human activities. The PTE enrichment levels of ZR, MQR, and MZR are low. PTEs in HZR also reached significant enrichment. The average Igeo of all PTEs is less than 0, and there is almost no pollution. Igeo outliers generally appear in S8, where there are human activities. Igeo shows that Cr is the main pollutant, and the pollution is distributed in the HZR. The RI results indicate that 96% of the upper reaches of ZR have a low risk level. Cd content is the lowest, but the risk is the greatest, followed by As. Mn content is the highest, but the risk is even negligible. PCA analysis indicates that Cr, Mn, Co, and Pb originate from mining activities and road dust, while Cu, Zn, As, and Cd originate from agricultural activities.

Author Contributions

Writing—original draft, P.G.; investigation and formal analysis, J.S., J.W., Z.M., M.S., J.F. and Y.Z.; conceptualization, and methodology, Y.C. and Y.W. All authors have read and agreed to the published version of the manuscript.

Funding

This research was funded by the National Natural Science Foundation of China (U1802241, U204021, 920472045, and 52209013) and Open Research Fund of State Key Laboratory of Simulation and Regulation of Water Cycle in River Basin, China Institute of Water Resources and Hydropower Research (IWHR-SKL-202214).

Institutional Review Board Statement

Not applicable.

Informed Consent Statement

Not applicable.

Data Availability Statement

The data generated during the study are available from the corresponding author upon reasonable request.

Conflicts of Interest

The authors declare no conflict of interest.

References

  1. Huang, Y.; Chen, Q.; Deng, M.; Japenga, J.; Li, T.; Yang, X.; He, Z. Heavy metal pollution and health risk assessment of agricultural soils in a typical peri-urban area in southeast China. J. Environ. Manag. 2018, 207, 159–168. [Google Scholar] [CrossRef] [PubMed]
  2. Liu, Q.; Wang, F.; Meng, F.; Jiang, L.; Li, G.; Zhou, R. Assessment of metal contamination in estuarine surface sediments from Dongying City, China: Use of a modified ecological risk index. Mar. Pollut. Bull. 2018, 126, 293–303. [Google Scholar] [CrossRef] [PubMed]
  3. Che, F.; Chen, J.; Zhang, B.; Jiang, X.; Wang, S. Distribution, risk and bioavailability of metals in sediments of Lake Yamdrok Basin on the Tibetan Plateau, China. J. Environ. Sci. 2020, 97, 169–179. [Google Scholar] [CrossRef]
  4. Dash, S.; Borah, S.S.; Kalamdhad, A.S. Heavy metal pollution and potential ecological risk assessment for surficial sediments of Deepor Beel, India. Ecol. Indic. 2021, 122, 107265. [Google Scholar] [CrossRef]
  5. Wang, R.; Zhang, C.; Huang, X.; Zhao, L.; Yang, S.; Struck, U.; Yin, D. Distribution and source of heavy metals in the sediments of the coastal East China sea: Geochemical controls and typhoon impact. Environ. Pollut. 2020, 260, 113936. [Google Scholar] [CrossRef]
  6. Liu, B.; Xu, M.; Wang, J.; Wang, Z.; Zhao, L. Ecological risk assessment and heavy metal contamination in the surface sediments of Haizhou Bay, China. Mar. Pollut. Bull. 2021, 163, 111954. [Google Scholar] [CrossRef] [PubMed]
  7. Almeida, L.C.; da Silva Junior, J.B.; Dos Santos, I.F.; de Carvalho, V.S.; de Santana Santos, A.; Hadlich, G.M.; Ferreira, S.L.C. Assessment of toxicity of metals in river sediments for human supply: Distribution, evaluation of pollution and sources identification. Mar. Pollut. Bull. 2020, 158, 111423. [Google Scholar] [CrossRef] [PubMed]
  8. Jiang, R.; Huang, S.; Wang, W.A.E. Heavy metal pollution and ecological risk assessment in the Maowei sea mangrove, China. Mar. Pollut. Bull. 2020, 161, 111816. [Google Scholar] [CrossRef]
  9. Ranjbar Jafarabadi, A.; Mitra, S.; Raudonyte-Svirbutaviciene, E.; Riyahi Bakhtiari, A. Large-scale evaluation of deposition, bioavailability and ecological risks of the potentially toxic metals in the sediment cores of the hotspot coral reef ecosystems (Persian Gulf, Iran). J. Hazard. Mater. 2020, 400, 122988. [Google Scholar] [CrossRef]
  10. Cheng, H.; Li, M.; Zhao, C.; Yang, K.; Li, K.; Peng, M.; Yang, Z.; Liu, F.; Liu, Y.; Bai, R.; et al. Concentrations of toxic metals and ecological risk assessment for sediments of major freshwater lakes in China. J. Geochem. Explor. 2015, 157, 15–26. [Google Scholar] [CrossRef]
  11. Hu, C.; Yang, X.; Dong, J.; Zhang, X. Heavy metal concentrations and chemical fractions in sediment from Swan Lagoon, China: Their relation to the physiochemical properties of sediment. Chemosphere 2018, 209, 848–856. [Google Scholar] [CrossRef] [PubMed]
  12. Zhang, Y.; Li, H.; Yin, J.; Zhu, L. Risk assessment for sediment associated heavy metals using sediment quality guidelines modified by sediment properties. Environ. Pollut. 2021, 275, 115844. [Google Scholar] [CrossRef] [PubMed]
  13. Wen, Z.; Song, K.; Liu, G.; Lyu, L.; Shang, Y.; Fang, C.; Du, J. Characterizing DOC sources in China’s Haihe River basin using spectroscopy and stable carbon isotopes. Environ. Pollut. 2020, 258, 113684. [Google Scholar] [CrossRef]
  14. Qin, C.; Zhao, Y.; Li, H.; Qu, J. Assessment of regional water saving potential. S. N. Water Transf. Water Sci. Technol. 2021, 19, 36–42. [Google Scholar] [CrossRef]
  15. Tang, W.; Shan, B.; Zhao, Y.; Wang, X. Comprehensive analysis of mercury pollution in the surface riverine sediments in the Haihe Basin, China. Environ. Sci. Pollut. Res. Int. 2017, 24, 20794–20802. [Google Scholar] [CrossRef]
  16. Tang, W.; Zhang, W.; Zhao, Y.; Zhang, H.; Shan, B. Basin-scale comprehensive assessment of cadmium pollution, risk, and toxicity in riverine sediments of the Haihe Basin in north China. Ecol. Indic. 2017, 81, 295–301. [Google Scholar] [CrossRef]
  17. Cui, L.; Wang, X.; Li, J.; Gao, X.; Zhang, J.; Liu, Z. Ecological and health risk assessments and water quality criteria of heavy metals in the Haihe River. Environ. Pollut. 2021, 290, 117971. [Google Scholar] [CrossRef]
  18. Zhuang, S.; Lu, X.; Yu, B.; Fan, X.; Yang, Y. Ascertaining the pollution, ecological risk and source of metal(loid)s in the upstream sediment of Danjiang River, China. Ecol. Indic. 2021, 125, 107502. [Google Scholar] [CrossRef]
  19. Yuan, X.; Xue, N.; Han, Z. A meta-analysis of heavy metals pollution in farmland and urban soils in China over the past 20 years. J. Environ. Sci. 2021, 101, 217–226. [Google Scholar] [CrossRef]
  20. Yao, W.; Hu, C.; Yang, X.; Shui, B. Spatial variations and potential risks of heavy metals in sediments of Yueqing Bay, China. Mar. Pollut. Bull. 2021, 173, 112983. [Google Scholar] [CrossRef]
  21. Fu, C.; Su, J.; Zhao, H.; Li, Q. Estimation of urban non-point source pollution load in upper reaches of Zhanghe River based on GIS. Water Resour. Prot. 2020, 36, 60–66. [Google Scholar] [CrossRef]
  22. Sun, L.; Guo, D.; Liu, K.; Meng, H.; Zheng, Y.; Yuan, F.; Zhu, G. Levels, sources, and spatial distribution of heavy metals in soils from a typical coal industrial city of Tangshan, China. Catena 2019, 175, 101–109. [Google Scholar] [CrossRef]
  23. Islam, N.; Rabha, S.; Subramanyam, K.; Saikia, B.K. Geochemistry and mineralogy of coal mine overburden (waste): A study towards their environmental implications. Chemosphere 2021, 274, 129736. [Google Scholar] [CrossRef]
  24. Trechera, P.; Moreno, T.; Córdoba, P.; Moreno, N.; Zhuang, X.; Li, B.; Li, J.; Shangguan, Y.; Dominguez, A.O.; Kelly, F.; et al. Comprehensive evaluation of potential coal mine dust emissions in an open-pit coal mine in Northwest China. Int. J. Coal Geol. 2021, 235, 103677. [Google Scholar] [CrossRef]
  25. Li, C.; Wang, A.; Hui, X.; Du, S.; Guo, X. Fish and Macrobenthos Community Structures in the shanxi Section of ZhangheRiver. J. Hydroecology 2020, 41, 122–132. [Google Scholar] [CrossRef]
  26. Chen, H.; Teng, Y.; Li, J.; Wu, J.; Wang, J. Source apportionment of trace metals in river sediments: A comparison of three methods. Environ. Pollut. 2016, 211, 28–37. [Google Scholar] [CrossRef]
  27. Sarkar, S.K.; Mondal, P.; Biswas, J.K.; Kwon, E.E.; Ok, Y.S.; Rinklebe, J. Trace elements in surface sediments of the Hooghly (Ganges) estuary: Distribution and contamination risk assessment. Environ. Geochem. Health 2017, 39, 1245–1258. [Google Scholar] [CrossRef]
  28. Muller, G. Index of Geoaccumulation in Sediments of the Rhine River. GeoJournal 1969, 2, 109–118. [Google Scholar]
  29. Zhao, J.; Wu, E.; Zhang, B.; Bai, X.; Lei, P.; Qiao, X.; Li, Y.F.; Li, B.; Wu, G.; Gao, Y. Pollution characteristics and ecological risks associated with heavy metals in the Fuyang river system in North China. Environ. Pollut. 2021, 281, 116994. [Google Scholar] [CrossRef]
  30. Chowdhury, R.; Favas, P.J.; Pratas, J.; Jonathan, M.P.; Ganesh, P.S.; Sarkar, S.K. Accumulation of Trace Metals by Mangrove Plants in Indian Sundarban Wetland: Prospects for Phytoremediation. Int. J. Phytoremediation 2015, 17, 885–894. [Google Scholar] [CrossRef]
  31. Hakanson, L. An ecological risk index for aquatic pollution control. A sedimentological approach. Water Res. 1980, 14, 975–1001. [Google Scholar] [CrossRef]
  32. Zhang, Z.; Lu, Y.; Li, H.; Tu, Y.; Liu, B.; Yang, Z. Assessment of heavy metal contamination, distribution and source identification in the sediments from the Zijiang River, China. Sci. Total Environ. 2018, 645, 235–243. [Google Scholar] [CrossRef] [PubMed]
  33. Yuan, Q.; Wang, P.; Wang, C.; Chen, J.; Wang, X.; Liu, S.; Feng, T. Metals and metalloids distribution, source identification, and ecological risks in riverbed sediments of the Jinsha River, China. J. Geochem. Explor. 2019, 205, 106334. [Google Scholar] [CrossRef]
  34. China National Environmental Monitoring Station. Background value of soil elements in China. China Environ. Sci. 1990, 229–493. [Google Scholar]
  35. Zhang, Y.; Han, Y.; Yang, J.; Zhu, L.; Zhong, W. Toxicities and risk assessment of heavy metals in sediments of Taihu Lake, China, based on sediment quality guidelines. J. Environ. Sci. 2017, 62, 31–38. [Google Scholar] [CrossRef]
  36. Lin, H.; Lan, W.; Feng, Q.; Zhu, X.; Li, T.; Zhang, R.; Song, H.; Zhu, Y.; Zhao, B. Pollution and ecological risk assessment, and source identification of heavy metals in sediment from the Beibu Gulf, South China Sea. Mar. Pollut. Bull. 2021, 168, 112403. [Google Scholar] [CrossRef]
  37. Ke, X.; Gui, S.; Huang, H.; Zhang, H.; Wang, C.; Guo, W. Ecological risk assessment and source identification for heavy metals in surface sediment from the Liaohe River protected area, China. Chemosphere 2017, 175, 473–481. [Google Scholar] [CrossRef]
  38. MacDonald, D.D.; Ingersoll, C.G.; Berger, T.A. Development and evaluation of consensus-based sediment quality guidelines for freshwater ecosystems. Arch. Environ. Contam. Toxicol. 2000, 39, 20–31. [Google Scholar] [CrossRef]
  39. Kumar, V.; Sharma, A.; Pandita, S.; Bhardwaj, R.; Thukral, A.K.; Cerda, A. A review of ecological risk assessment and associated health risks with heavy metals in sediment from India. Int. J. Sediment Res. 2020, 35, 516–526. [Google Scholar] [CrossRef]
  40. Ji, Z.; Zhang, H.; Zhang, Y.; Chen, T.; Long, Z.; Li, M.; Pei, Y. Distribution, ecological risk and source identification of heavy metals in sediments from the Baiyangdian Lake, Northern China. Chemosphere 2019, 237, 124425. [Google Scholar] [CrossRef]
  41. Liu, B.; Dong, D.; Hua, X.; Dong, W.; Li, M. Spatial Distribution and Ecological Risk Assessment of Heavy Metals in Surface Sediment of Songhua River, Northeast China. Chin. Geogr. Sci. 2021, 31, 223–233. [Google Scholar] [CrossRef]
  42. Hao, J.; Ren, J.; Fang, H.; Tao, L. Identification Sources and High-Risk Areas of Sediment Heavy Metals in the Yellow River by Geographical Detector Method. Water 2021, 13, 1103. [Google Scholar] [CrossRef]
  43. Wang, J.; Liu, G.; Lu, L.; Zhang, J.; Liu, H. Geochemical normalization and assessment of heavy metals (Cu, Pb, Zn, and Ni) in sediments from the Huaihe River, Anhui, China. Catena 2015, 129, 30–38. [Google Scholar] [CrossRef]
  44. He, Z.; Li, F.; Dominech, S.; Wen, X.; Yang, S. Heavy metals of surface sediments in the Changjiang (Yangtze River) Estuary: Distribution, speciation and environmental risks. J. Geochem. Explor. 2019, 198, 18–28. [Google Scholar] [CrossRef]
  45. Fang, X.; Peng, B.; Wang, X.; Song, Z.; Zhou, D.; Wang, Q.; Qin, Z.; Tan, C. Distribution, contamination and source identification of heavy metals in bed sediments from the lower reaches of the Xiangjiang River in Hunan province, China. Sci. Total Environ. 2019, 689, 557–570. [Google Scholar] [CrossRef] [PubMed]
  46. Xu, X.; Cao, Z.; Zhang, Z.; Li, R.; Hu, B. Spatial distribution and pollution assessment of heavy metals in the surface sediments of the Bohai and Yellow Seas. Mar. Pollut. Bull. 2016, 110, 596–602. [Google Scholar] [CrossRef]
  47. Liu, H.; Zhang, Y.; Yang, J.; Wang, H.; Li, Y.; Shi, Y.; Li, D.; Holm, P.E.; Ou, Q.; Hu, W. Quantitative source apportionment, risk assessment and distribution of heavy metals in agricultural soils from southern Shandong Peninsula of China. Sci. Total Environ. 2021, 767, 144879. [Google Scholar] [CrossRef]
  48. Liu, R.; Men, C.; Liu, Y.; Yu, W.; Xu, F.; Shen, Z. Spatial distribution and pollution evaluation of heavy metals in Yangtze estuary sediment. Mar. Pollut. Bull. 2016, 110, 564–571. [Google Scholar] [CrossRef]
  49. Wang, S.; Cai, L.M.; Wen, H.H.; Luo, J.; Wang, Q.S.; Liu, X. Spatial distribution and source apportionment of heavy metals in soil from a typical county-level city of Guangdong Province, China. Sci. Total Environ. 2019, 655, 92–101. [Google Scholar] [CrossRef]
  50. Xia, P.; Ma, L.; Sun, R.; Yang, Y.; Tang, X.; Yan, D.; Lin, T.; Zhang, Y.; Yi, Y. Evaluation of potential ecological risk, possible sources and controlling factors of heavy metals in surface sediment of Caohai Wetland, China. Sci. Total Environ. 2020, 740, 140231. [Google Scholar] [CrossRef]
  51. Xu, M.; Wang, R.; Yang, X.; Yang, H. Spatial distribution and ecological risk assessment of heavy metal pollution in surface sediments from shallow lakes in East China. J. Geochem. Explor. 2020, 213, 106490. [Google Scholar] [CrossRef]
  52. Rani, S.; Ahmed, M.K.; Xiongzhi, X.; Keliang, C.; Islam, M.S.; Habibullah-Al-Mamun, M. Occurrence, spatial distribution and ecological risk assessment of trace elements in surface sediments of rivers and coastal areas of the East Coast of Bangladesh, North-East Bay of Bengal. Sci. Total Environ. 2021, 801, 149782. [Google Scholar] [CrossRef] [PubMed]
  53. Ma, L.; Yang, Z.; Li, L.; Wang, L. Source identification and risk assessment of heavy metal contaminations in urban soils of Changsha, a mine-impacted city in Southern China. Environ. Sci. Pollut. Res. Int. 2016, 23, 17058–17066. [Google Scholar] [CrossRef]
  54. Guo, B.; Liu, Y.; Zhang, F.; Hou, J.; Zhang, H.; Li, C. Heavy metals in the surface sediments of lakes on the Tibetan Plateau, China. Environ. Sci. Pollut. Res. Int. 2018, 25, 3695–3707. [Google Scholar] [CrossRef] [PubMed]
  55. Islam, S.; Ahmed, K.; Habibullah-Al, M.; Masunaga, S. Potential ecological risk of hazardous elements in different land-use urban soils of Bangladesh. Sci. Total Environ. 2015, 512–513, 94–102. [Google Scholar] [CrossRef] [PubMed]
  56. Pellinen, V.; Cherkashina, T.; Gustaytis, M. Assessment of metal pollution and subsequent ecological risk in the coastal zone of the Olkhon Island, Lake Baikal, Russia. Sci. Total Environ. 2021, 786, 147441. [Google Scholar] [CrossRef]
  57. Li, R.; Tang, X.; Guo, W.; Lin, L.; Zhao, L.; Hu, Y.; Liu, M. Spatiotemporal distribution dynamics of heavy metals in water, sediment, and zoobenthos in mainstream sections of the middle and lower Changjiang River. Sci. Total Environ. 2020, 714, 136779. [Google Scholar] [CrossRef]
  58. Sun, Z.; Xie, X.; Wang, P.; Hu, Y.; Cheng, H. Heavy metal pollution caused by small-scale metal ore mining activities: A case study from a polymetallic mine in South China. Sci. Total Environ. 2018, 639, 217–227. [Google Scholar] [CrossRef]
  59. Magnano, G.C.; Marussi, G.; Pavoni, E.; Adami, G.; Larese Filon, F.; Crosera, M. Percutaneous metals absorption following exposure to road dust powder. Environ. Pollut. 2022, 292, 118353. [Google Scholar] [CrossRef]
  60. Wang, S.; Wang, L.; Huan, Y.; Wang, R.; Liang, T. Concentrations, spatial distribution, sources and environmental health risks of potentially toxic elements in urban road dust across China. Sci. Total Environ. 2021, 805, 150266. [Google Scholar] [CrossRef]
  61. Sanjai Gandhi, K.; Pradhap, D.; Saravanan, P.; Krishnakumar, S.; Kasilingam, K.; Sukanta Patel, H.; Prakash, P.; Muthukumaran, S.; Magesh, N.S. Metal concentration and its ecological risk assessment in the beach sediments of Coromandel Coast, Southern India. Mar. Pollut. Bull. 2020, 160, 111565. [Google Scholar] [CrossRef] [PubMed]
  62. Shomar, B.H. Trace elements in major solid-pesticides used in the Gaza Strip. Chemosphere 2006, 65, 898–905. [Google Scholar] [CrossRef] [PubMed]
  63. Niu, Y.; Jiang, X.; Wang, K.; Xia, J.; Jiao, W.; Niu, Y.; Yu, H. Meta analysis of heavy metal pollution and sources in surface sediments of Lake Taihu, China. Sci. Total Environ. 2020, 700, 134509. [Google Scholar] [CrossRef] [PubMed]
Figure 1. The upper reaches of Zhanghe River and sampling sites.
Sustainability 14 15885 g001
Figure 2. Spatial distribution of sediment PTE concentrations in the upper reaches of Zhanghe River. ZR (n = 5), MQR (n = 7), HQR (n = 5), MZR (n = 5), HZR (n = 10). There is no significant difference between bars with the same letter, but there is a significant difference between bars with different letters (p < 0.05).
Sustainability 14 15885 g002
Figure 3. Classification and spatial distribution of PTE concentrations. B indicates background value.
Sustainability 14 15885 g003
Figure 4. The EF spatial distribution of PTEs in the upper reaches of Zhanghe River.
Sustainability 14 15885 g004
Figure 5. The PTEs Igeo values in the upper reaches of Zhanghe River.
Sustainability 14 15885 g005
Figure 6. The PTE RI in the upper reaches of the Zhanghe River.
Sustainability 14 15885 g006
Figure 7. Correlation matrix for PTEs in the upper reaches of Zhanghe River. * and ** represent significant correlations at the levels of 0.05 and 0.01.
Sustainability 14 15885 g007
Table 1. Evaluation criteria for the enrichment factor and geo-accumulation index.
GradeEFEnrichment LevelGradeIgeoPollution Level
I1~2Slightly enrichedI0~1Unpolluted to moderately polluted
II2~5Moderately enrichedII1~2Moderately polluted
III5~20Significantly enrichedIII2~3Moderately to heavily polluted
IV20~40Intensely enrichedIV3~4Heavily polluted
V>40Extremely enrichedV4~5Heavily to extremely polluted
VI VI>5Extremely polluted
Table 2. Evaluation criteria for the potential ecological risk index.
Grade E r i Risk LevelGradeRIRisk Level
I<40Low riskI<150Low risk
II40~80Moderate riskII150~300Moderate risk
III80~160Considerable riskIII300~600Considerable risk
IV160~320High riskIV≥600Very high risk
V≥320Very high risk
Table 3. PTE content in sediments of the upper reaches of Zhanghe River.
Descriptive Statistics (mg/kg)CrMnCoCuZnAsCdPb
Min44.13370.347.0312.4938.745.710.0710
Max175.571242.7514.3763.41284.1721.400.3635.77
Mean91.51583.8110.6621.9367.499.810.1218.30
SD24.30207.901.8010.4840.823.050.055.43
TEL43.40NGNG31.601219.790.9935.80
PEL111NGNG149459334.98128
Soil background concentrations61.80554.009.9026.9075.509.800.1315.80
<TEL (%)0--919759100100
>PEL (%)16--00000
TEL: threshold effect level. PEL: probable effect level [38]. NG: no guideline.
Table 4. The mean concentrations of PTEs in sediments of rivers in China (mg/kg).
RiversCrMnCoCuZnAsCdPbReferences
Zhanghe River91.51583.8110.6621.9367.499.810.1218.3This study
Liaohe River35.06--17.82-9.881.210.57[37]
Songhua River18.5--2459.3-439[41]
Yellow River101.87--22.4789.7-1.388.16[42]
Huaihe River---31.3183.57--53.43[43]
Changjiang River84.7--24.389.510.30.2521[44]
Table 5. The PCA results for PTEs in the upper reaches of the Zhanghe River.
Potentially Toxic ElementsComponent
12
Cr−0.0310.926
Mn0.1990.755
Co0.4070.698
Cu0.6660.063
Zn0.8820.290
As0.7650.393
Cd0.9190.146
Pb0.5110.728
Eigenvalues3.1202.709
% of variance39.70433.863
% of cumulative39.70472.867
Rotation method: varimax rotation. Rotation converged in three iterations.
Publisher’s Note: MDPI stays neutral with regard to jurisdictional claims in published maps and institutional affiliations.

