Article

Evaluation of Fresh and Hardened Concrete Properties Incorporating Glass Waste as Partial Replacement of Fine Aggregate

by
Zalipah Jamellodin
1,
Lim Qian Yi
1,
Qadir Bux Alias Imran Latif
2,*,
Hassan Amer Algaifi
3,
Rafidah Hamdan
1 and
Adel Al-Gheethi
1,*
1
Department of Civil Engineering, Faculty of Civil Engineering and Build Environment, Universiti Tun Hussein Onn Malaysia, Parit Raja, Batu Pahat 86400, Johor, Malaysia
2
Department of Civil and Environmental Engineering, College of Engineering and Architecture, University of Nizwa, P.O. Box 33, Nizwa 616, Ad Dakhliyah, Oman
3
School of Civil Engineering, Faculty of Engineering, Universiti Teknologi Malaysia, Johor Bahru 81310, Johor, Malaysia
*
Authors to whom correspondence should be addressed.
Sustainability 2022, 14(23), 15895; https://doi.org/10.3390/su142315895
Submission received: 1 November 2022 / Revised: 14 November 2022 / Accepted: 21 November 2022 / Published: 29 November 2022
(This article belongs to the Section Environmental Sustainability and Applications)

Abstract

:
To date, the utilization of glass waste as an alternative aggregate in concrete has gained significantly increasing attention, owing to its remarkable properties. However, its high replacement content and glass particle size, of greater than 5 mm, causes an increase in the alkali-silica reaction expansion and a reduction in the concrete strength in most of the present literature. Therefore, this study investigated the effect of a lower sand replacement content (5–25%) in glass waste (smaller than 5 mm) on both the mechanical and durability properties of concrete. In particular, the effect of varying the replacement of fine aggregate by glass waste (5%, 10%, 15%, 20% and 25%) on compressive strength and water permeability of concrete (30 MPa grade) was evaluated at 7 and 28 days. Moreover, scanning electron microscope (SEM) tests were taken into account to assess the morphology characteristics of the concrete. Based on the results, the highest concrete strength (37.5 MPa) was recorded when the replacement percentage was 15%, while the control strength was 33.5 Mpa. The outcomes also exposed that the water permeability coefficient of the samples was decreased (0.883 × 10⁻⁹ m/s), at 5% compared to that of the control mix (1.097 × 10⁻⁹ m/s). In conclusion, a lower replacement percentage of glass waste leads to enhanced concrete properties and would act as a sustainable and alternative material in the near future.

1. Introduction

The growth and continuous development of concrete production are associated with the demand for concrete [1]. In Europe, the concrete demand has increased from 532.32 million tonnes (in 2013) to 602.67 million tonnes (in 2018) [2]. The increment is approximately 13%. Furthermore, in the same year, the United States achieved higher concrete demand than Europe countries, where its concrete demand was 659.39 million tonnes, which has increase by approximately 19%, in 2013. The demand increasing phenomenon is applied not only to concrete but is also applicable to its raw materials such as sand. According to Chilamkurthy et al. [3], the sand consumption of China, India, Japan, Thailand and Italy has also experienced a 1.92%, 9.9%, 8.30%, 5.26% and 4.0% increment from 2015 to 2016. In 2020, the United Nations Environment Program [4] report revealed that the sand consumption of the United States had increased by approximately 5% from 2018 to 2019. Sand consumption in the United States had increased from 937 million tons to 980 million tonnes. In fact, the excessive extraction of sand has resulted in various environmental issues. These issues including damage to the ecosystem, the deterioration of water quality, the eroding of riverbanks and an increase in damage levels of floods [5]. No matter the phenomenon of increasing demand or the adverse environmental impacts of sand extraction, it is in opposition to the concept of sustainable development that had been issued in the eleventh Malaysian Plan. To this end, it is important to find suitable alternative materials for concrete production.
Glass waste (GW) is regarded as an alternative waste material and its reputation has been increased in the civil engineering community in recent years [6,7,8,9,10]. This is because it is distinguished by its remarkable physical characteristics and chemical composition. In particular, it has a low water absorption and is rich with silica [11]. Many researchers have utilized glass waste as an alternative aggregate, either in mortar or concrete. For instance, Kou and Poon [12] partially replaced 10 mm granite with recycled glass cullet (5%, 10% and 15%). Based on their findings, the compressive strength of the concrete decreased in terms of all the replacement percentages compared to that of the control mix and the decrement increased with the increase in glass content. This negative result is consistent with other previous published studies [13]. In addition, the replacement of aggregate by larger particles with a size of glass waste greater than 5 mm increased the alkali-silica reaction expansion inside the concrete matrix. Jin and Meyer [14] found that the concrete strength decreased and the alkali-silica reaction expansion developed when the size of the glass waste particles was in the range of between 5 and 10 mm. This fact was attributed to the chemical reaction between the alkali in the concrete pore and the rich silica available in the glass [15]. Therefore, several researchers have shifted their attention to replace fine aggregate, rather than coarse aggregate, by glass waste in concrete. However, the majority of these studies have focused on the high replacement percentage of sand by glass waste. Tamanna and Tuladhar [16] investigated the suitability of replacing natural sand with glass waste at three levels: 20%, 40% and 60%. The authors concluded that the highest compressive strength achieved at the replacement level was 20%.
Hence, to fill the gap in the present literature, a low content of glass waste (5–25%) with maximum particle size of 2.36 mm was introduced inside a concrete matrix as a replacement for sand, and its impact on both the mechanical and durability properties of concrete was evaluated. The relationship between the compressive strength and water-penetration test, as well as density, is also presented. In addition, the microstructure of concrete containing GW is discussed. Ultimately, the present study would contribute and reveal the applicability of utilizing glass waste as a fine aggregate in cement-based concrete structures in the near future.

2. Procedure of Experiment

The experimental procedure was conducted through several steps, as shown in Figure 1. The first step was to prepare the raw materials of the concrete matrix involving glass waste. Then, the fresh and hardened concrete properties were investigated and evaluated.

2.1. Materials

In this study, Ordinary Portland cement (OPC), complying with ASTM C150, was employed. A crushed granite aggregate (10 mm) was used as a coarse aggregate, while local natural sand was utilized as a fine aggregate, with a specific gravity of 2.7 and 2.6, respectively. Tap water was considered for the mix design. Regarding the glass waste, it was collected from the Sustainable Campus Office (SCO) recycling center, UTHM. The collected GW was ground, using a grinder, as shown in Figure 2. Then, Sieve analysis was conducted, following the procedures specified in Standard BS 812: Part 103: 1985 [17]. Subsequently, the results of the sieve analysis were compared with the standard grading limit stated in BS 882:1992 [18].
Table 1 shows the final passing percentage of the sand and glass waste. Figure 3 shows the particle size distribution of the sand and GW. Based on Figure 3, it was noted that the particle size distribution of both the sand and GW materials are well graded and within the standard grading limits specified in the standard BS 882:1992 [18]. As the particle size distribution of the GW is within the standard grading limit, it can be inferred that the GW is suitable to be used as sand replacement material in terms of particle size distribution. This result is parallel with the result of the Bostanci sieve analysis [19]. In addition, it was noted that the GW is coarser than the sand in the size range of 0 to 0.6 mm, whereas the sand is coarser than the GW in the size range of 1.18 to 10 mm. Therefore, based on these results, the particle size distribution of both materials is complementary.

2.2. Concrete Mix Proportions

According to the British specification (Department of Environment (DOE), the control concrete mix (without GW) was first designed, in which the characteristic compressive strength was 30 MPa after 28 days. The mixing of the concrete was carried out following the procedures stated in the standard BS 1881: Part 125:1986 [20]. In particular, all of the materials were first weighted according to the predetermined mix design proportion. Meanwhile, the equipment and drum mixer were cleaned and ensured that it was in a saturated surface dry state. Subsequently, all of the weighted aggregate was poured into the drum mixer and left to mix for 15 to 30 s. Next, a portion of water was added and mixed for 15 s. The weighted cement was then added into the mixture and mixed for 30 s. Finally, the residue water was added to the mixture and mixed, until the paste reached a homogenous state. The workability of the fresh concrete mix was evaluated using the slump test, following the procedures stated in the Standard BS EN 12350-2:2009 [21]. As shown in Figure 4a, it was found that the slump test ranged between 10 and 20 mm. After that, the fresh concrete was casted into a steel mold of (150 × 150 × 150 mm), progressively, three times. The method for casting the samples followed the procedures specified in the Standard BS EN 12390-2:2000 [22]. Later, the concrete samples were allowed to harden for 24 h, at room temperature. After 24 h, the concrete samples were removed from the mold and cured in a curing water tank, with a temperature of 25 °C ± 2 °C, as shown in Figure 4b.
For the glass-based concrete, the fine aggregate (sand) was partially replaced by 5%, 10%, 15%, 20% and 25% of the glass waste, which were named as Mix B1, B2, B3, B4 and B5, respectively. Table 2 shows the proportions of all the concrete mixes. It should be noted that the water cement ratio was maintained at constant (0.55) for all concrete mixes.

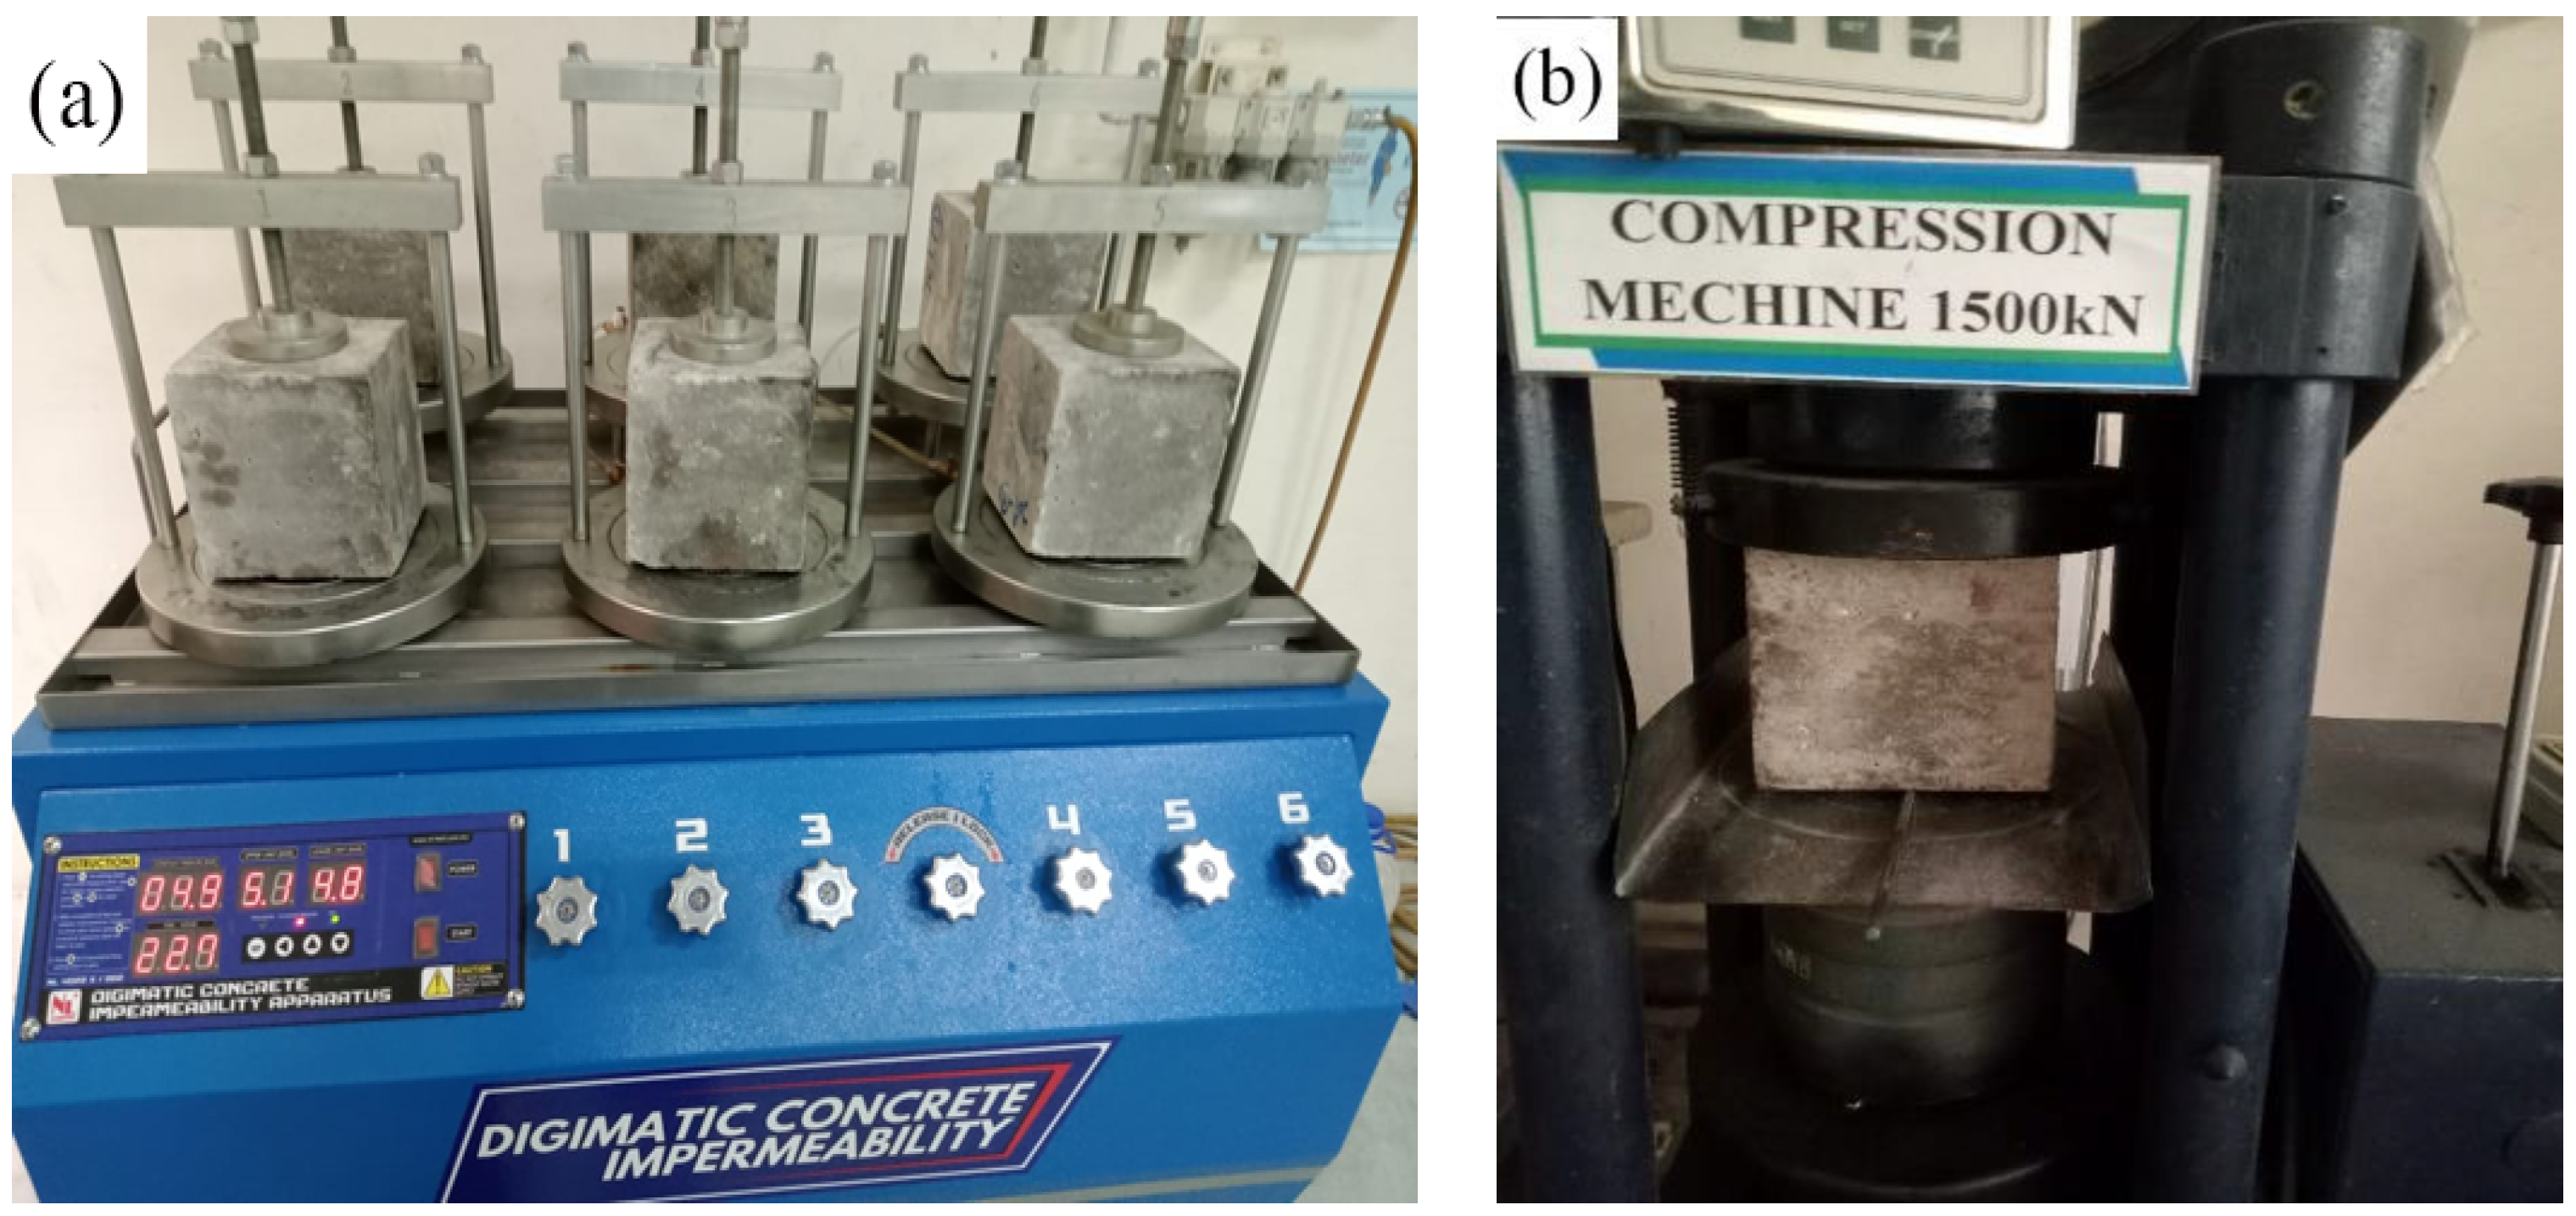
2.3. Hardened Concrete Tests

Two hardened concrete test samples were taken into account, involving a compressive strength and water permeability test. Indeed, compressive strength is an important parameter for revealing the extent to which the concrete can sustain loads [23,24]. In addition, the water permeability test is used as an indicator to show the quality of the concrete mixture [25]. High permeability indicates a bad concrete mix, whereas low permeability shows a good concrete mixture. The compressive strength test was performed following the procedures specified in the BS EN 12390-3: 2019 [26]. The target sample was placed into a compression testing machine and the load was applied to the sample, as shown in Figure 5b. The applied load was increased at a constant rate until the failure occurred and the failure load was obtained. The compressive strength of the concrete samples was determined through dividing the failure load by the area of the sample. The test was repeated for three times to obtain the average compressive strength of each concrete mix. It should be noted that the concrete density was obtained by measuring the weight of the concrete cubes prior to the compression test. Then, the weight was divided by the volume of cubes.
On the other hand, the permeability test was evaluated based on the water penetration of the samples. The water permeability coefficient was calculated by using the water penetration depth obtained from the test. The depth of the penetration of the water was determined by carried out the procedures specified in the standard BS EN 12390-8: 2009 [27]. In the test, the samples were placed on water permeability equipment and a 500 kPa water pressure was applied to the samples for 72 h. Figure 5a shows the water permeability equipment with concrete samples. During the testing periods, the surface of the samples was observed periodically, in order to ensure that no water leakage occurred. After 72 h, the samples were removed from the equipment and the excess free water on the samples’ surface was wiped with a piece of dry cloth to remove the extra water. The mass of the samples was immediately measured and recorded. Subsequently, the samples were split in half using a compression testing machine and the water penetration depth of the samples was marked, measured and recorded. Then, the mass of the samples was measured and recorded again, after they were dried at room temperature for 24 h. The water permeability coefficient of the samples was determined and calculated using equation 1. The test was repeated three times to obtain the average water permeability coefficient of the concrete.
K = v d 2 2 h t
where
  • K = Coefficient of water permeability (m/s)
  • v = porosity of concrete
  •   = Mass   gained   from   the   test Area × Water   penetration   depth   × Density   of   water
  • d = Depth of water penetration (m)
  • h = Hydraulic head (m)
  • t = Time of test (s)

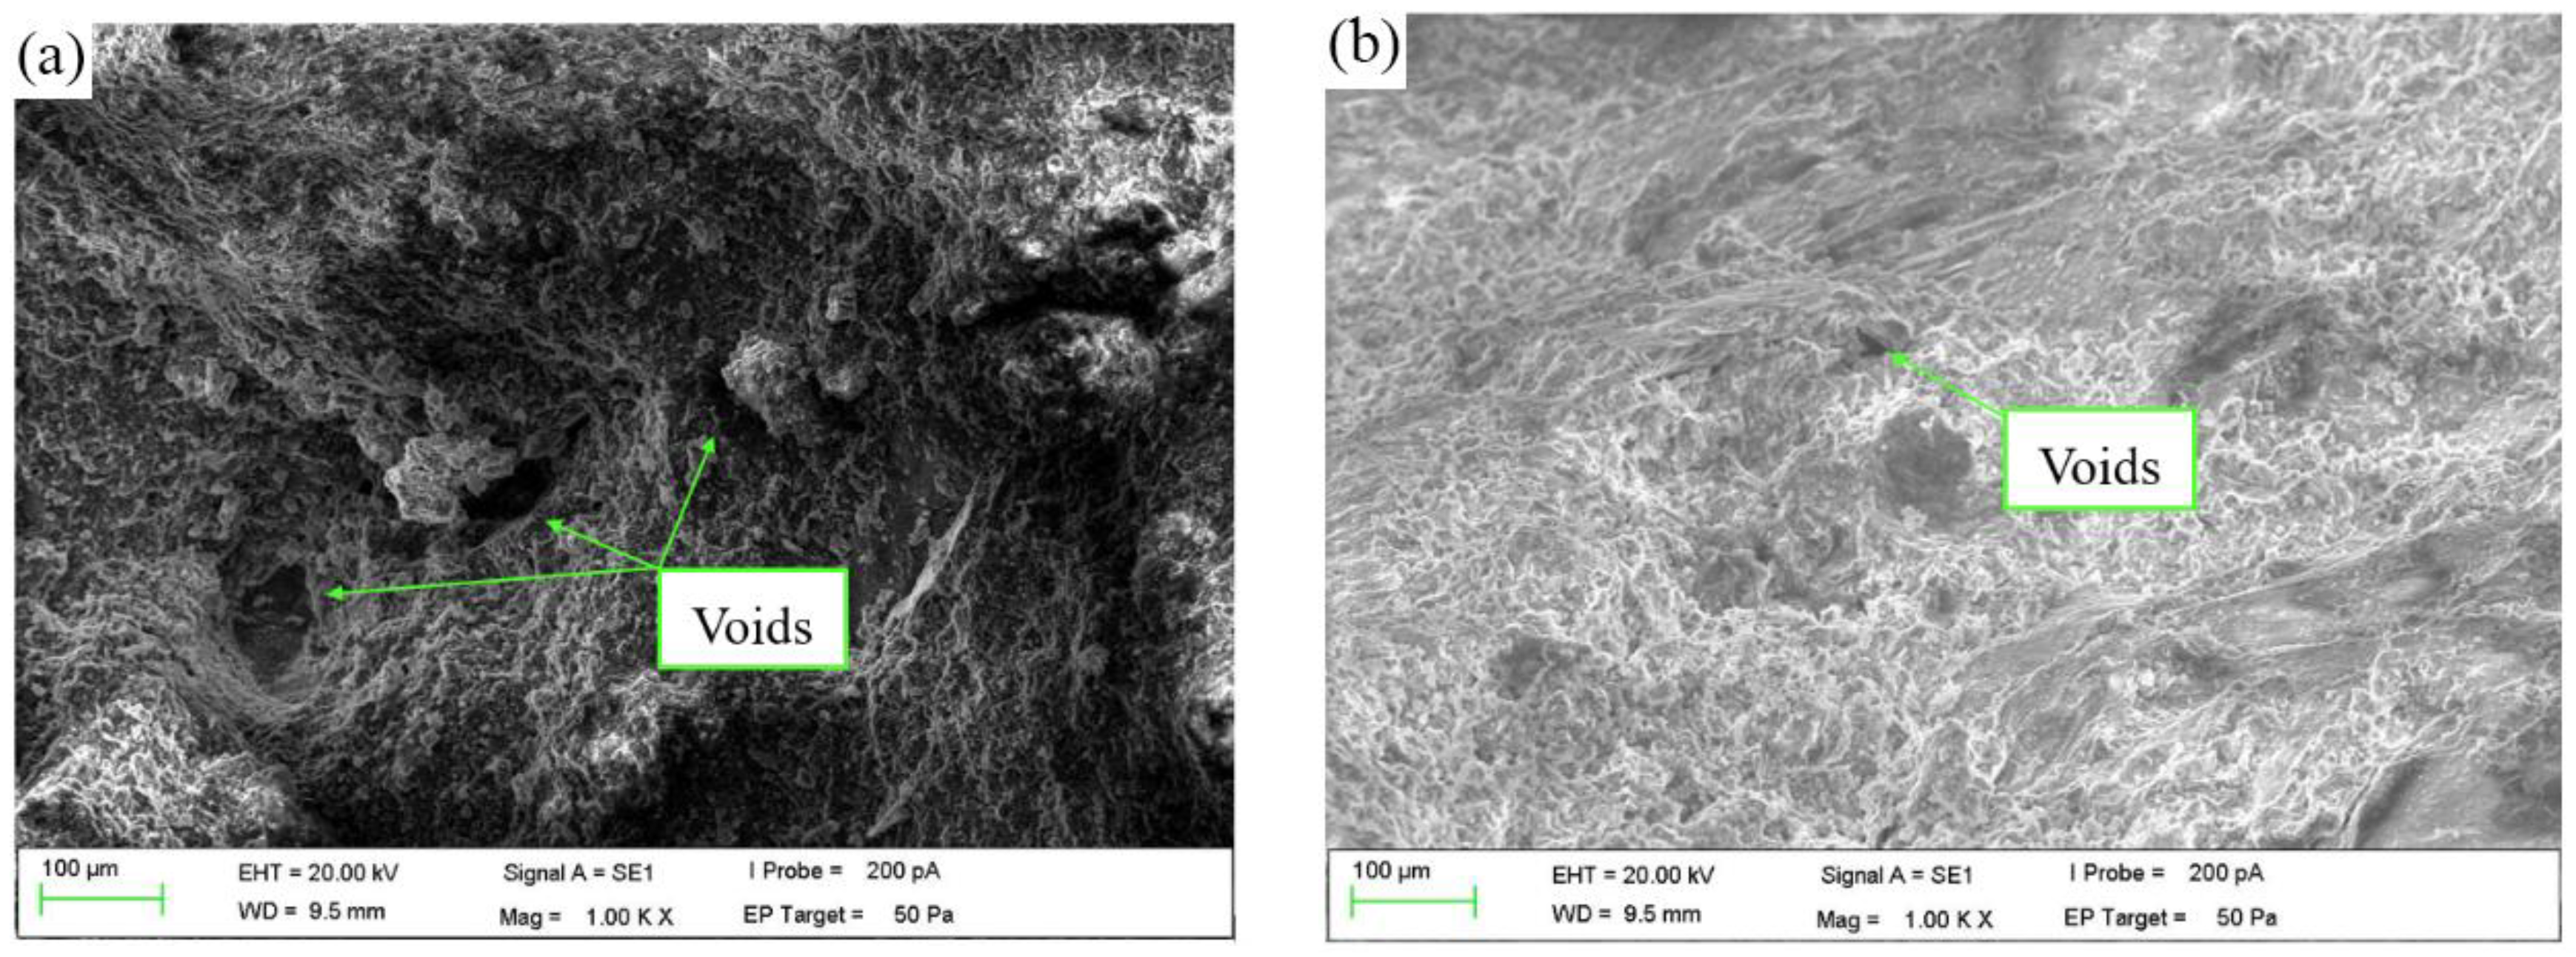
2.4. Microstructure Test

The concrete microstructure was examined using the scanning electron microscope test. The SEM test was an important test to assess the concrete matrix at micro level [28]. The SEM test was conducted at 28 days of curing age. The purpose of conducting the SEM test is to investigate the morphology characteristics of the concrete, as well as to analyze the effect of using GW as a partial replacement for sand on the morphology characteristic of the concrete. At the beginning of test, the samples with a size of no more than 5 mm were selected and taken from the crushed samples, following the compression test. Subsequently, the samples were placed on a sample base. The sample base was placed into the chamber of the SEM machine and the chamber was vacuumed. The vacuum state of the chamber was able to prevent the collision between the released electrons with the gas atoms and able to produce a clear illustration of the morphology of the samples. The SEM images of the samples were collected by adjusting the position, brightness, and contrast of the images.

3. Results and Discussion

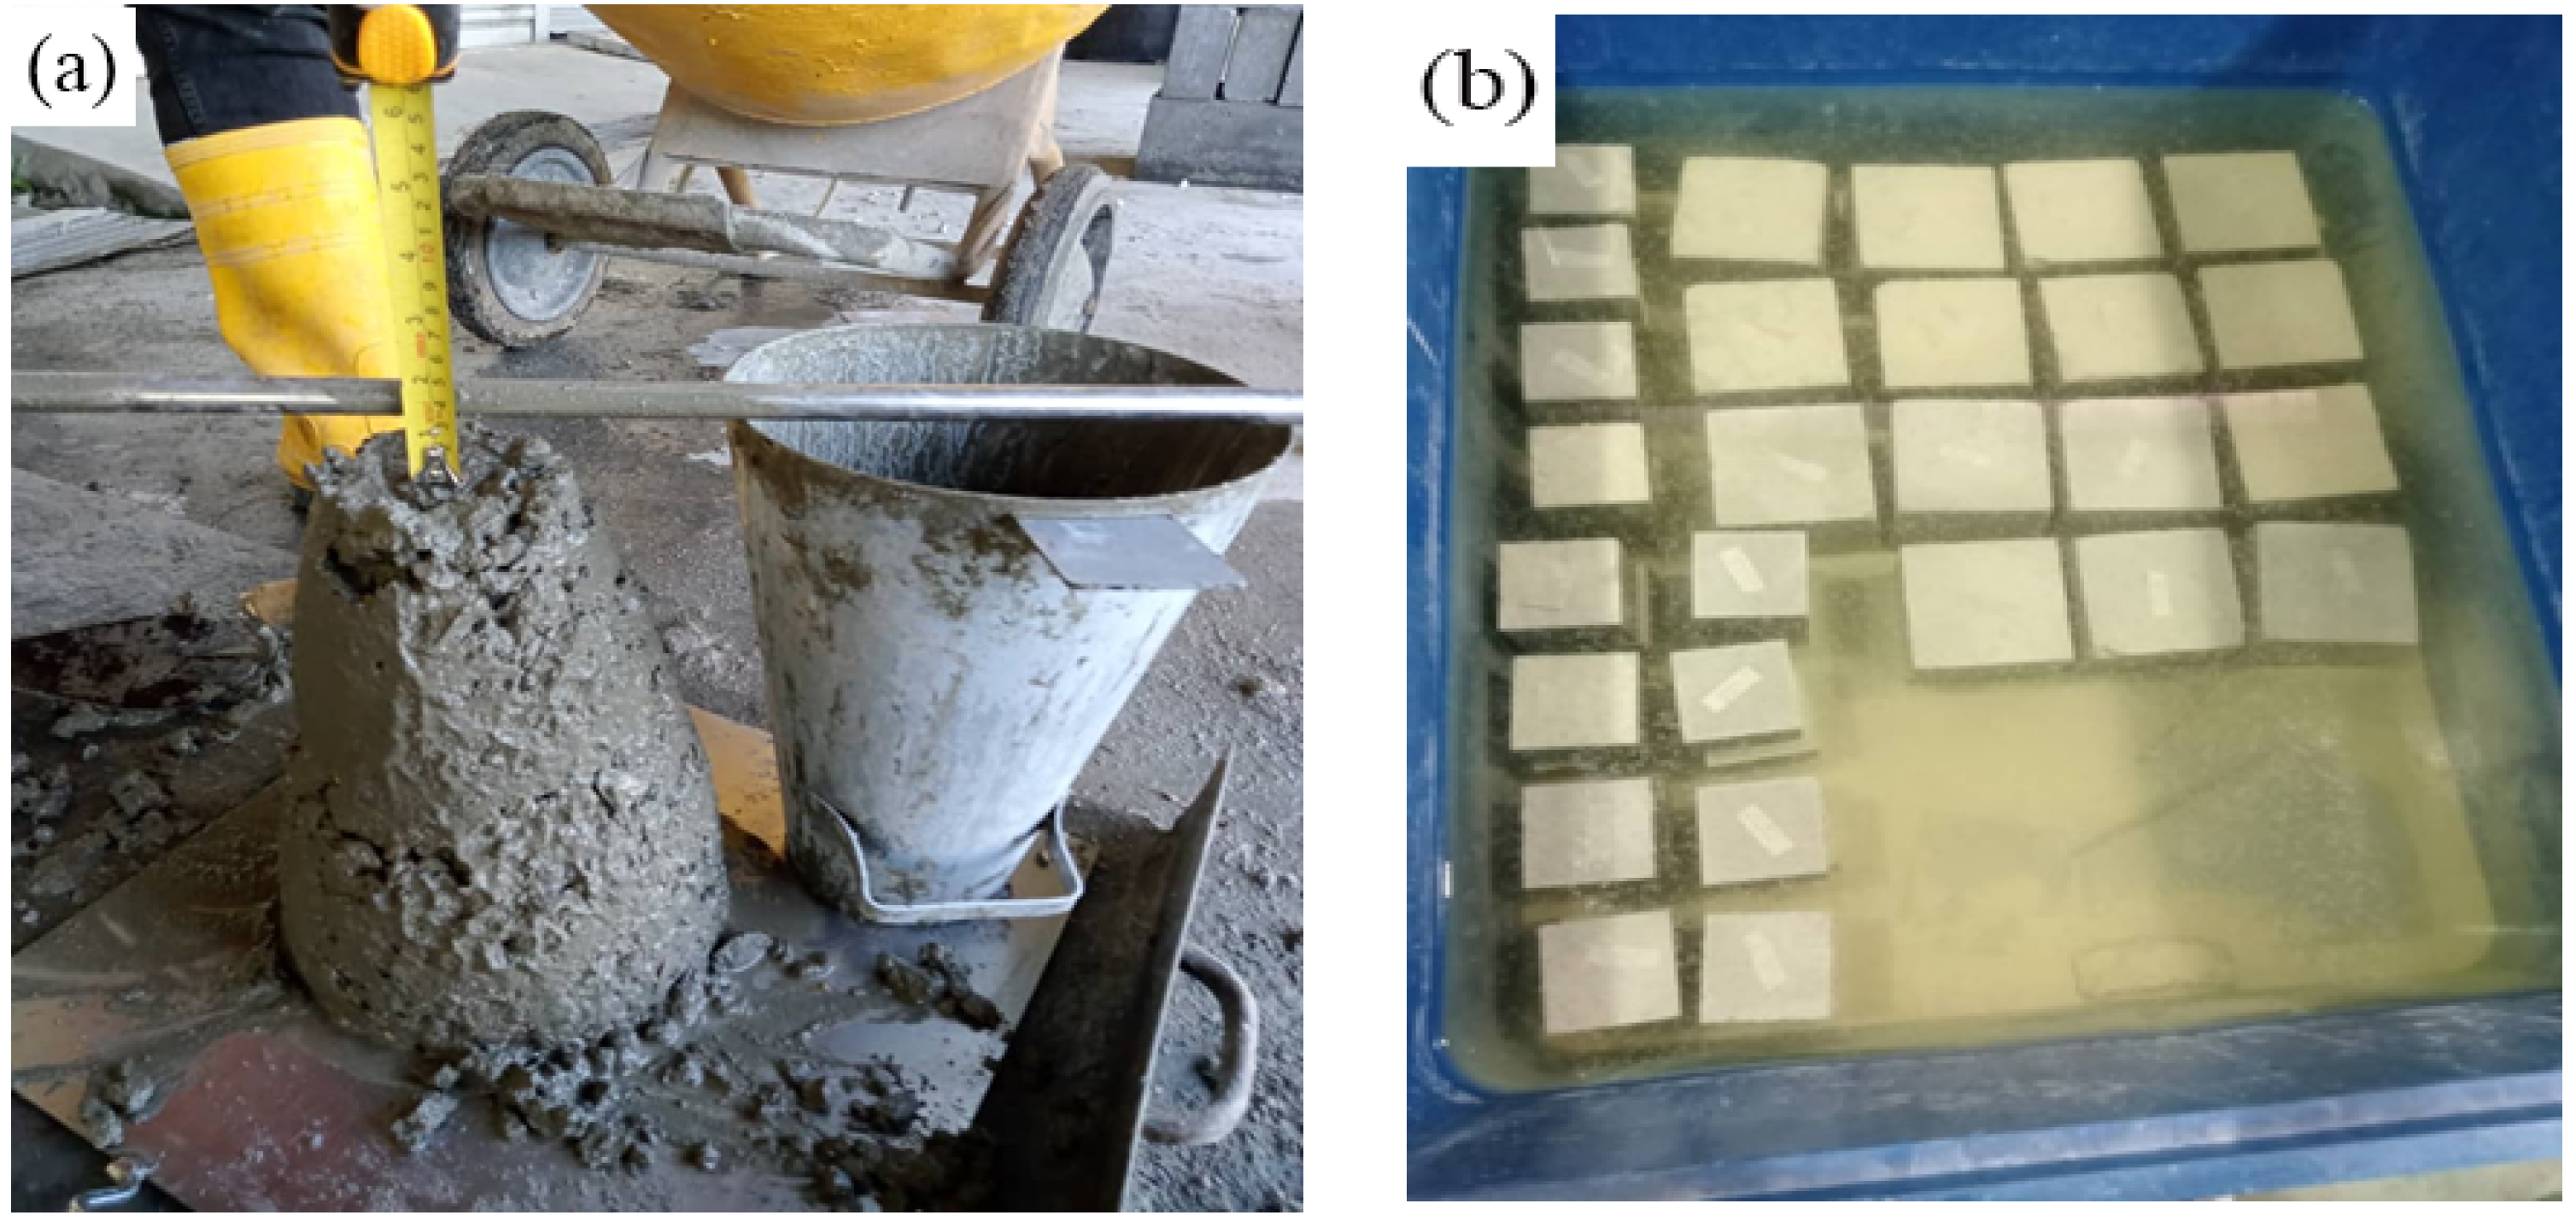
3.1. Workability of Concrete

Table 3 shows the results of the slump test for the control samples (Mix A) and samples with different replacement percentages of GW (B1, B2, B3, B4, and B5). It was observed that the slump values of all the samples are within the designed slump range, which is between 10 and 30 mm. Meanwhile, it was also found that the slump value of the concrete containing GW replacement (B1, B2, B3, B4, and B5) was lower than the slump value of the control mix (A). This may be due to the sharp edges and angular shape of the GW, which reduce the fluidity of the cement paste and reduce the workability of the concrete. These similar results and reasons are also mentioned by Steyn et al. [29] and Tamanna et al. [16]. Bashar and Ghassan [30] also revealed that this reduction may also be due to the low water absorption nature of GW, which reduced the cohesion between the GW and cement paste.

3.2. Density of Concrete

Table 4 shows the average density of the samples at 7 days and 28 days of curing. Based on the results obtained, it was noted that the density of control sample (A) at 7 days and 28 days of curing are 2373.33 kg/m3 and 2376.67 kg/m3, respectively. Moreover, with 7 days of curing, the densities of the samples with different percentages of GW are in the range of 2373.33 kg/m3 and 2400 kg/m3. Furthermore, with 28 days of curing, the densities of the samples with different replacement percentages of GW replacement are in the range of 2380 kg/m3 and 2406.67 kg/m3. According to Mehta and Monteiro [31], the density of the normal-weight concrete is between 2300 kg/m3 and 2400 kg/m3. As the densities of the samples are within and near the density range of normal-weight concrete, the concrete samples are classified as normal-weight concrete.
The results also reveal that the densities of the samples containing GW replacement (B1, B2, B3, B4 and B5) are similar to the density of control sample (A). This may because the sand and GW materials consist of similar specific gravity, where the specific gravity of GW and sand are 2.50 and 2.57, respectively. The difference between the specific gravity of GW and sand is only 2.8% [29]. The results show that the densities of the 28 day samples are higher than the densities of the 7 day samples. This may be due to the continuous hardening process of the concrete, in which the void inside the concrete is filled with the hydration products (ettringite, calcium hydroxide and CSH gel) as the time passes, and form a denser concrete structure [31,32].

3.3. Compressive Strength of Concrete

Figure 6a shows the average compressive strength of all the concrete samples, including the control and the glass-based concrete at 7 days and 28 days of curing. It is evident that the compressive strength of the B1, B2 and B3 samples is improved, compared with the compressive strength of the control mix A. For instance, at 7 days of curing, the compressive strength of B1, B2 and B3 are 27.1 MPa, 27.5 MPa and 27.8 MPa, respectively. The improvements are approximately 0.37%, 1.85% and 2.96%. In addition, at 28 days of curing, the compressive strength of B1, B2 and B3 is 33.8 MPa, 35.1 MPa and 37.0 MPa, respectively. The improvements are approximately 0.60%, 4.46% and 10.12%.
The improvement may be attributed to the incorporation of GW, as it has provided a better bonding at the interface of the GW and cement paste. This fact is in line with the results of the SEM test that were obtained in this study. Figure 6b,c show the SEM images of the control mix and glass-based concrete, respectively. From the images, it can be seen that the incorporation of GW provides better bonding at the interface compared to the control sample. In other words, the control sample consists of a bigger gap at the interface of aggregate and cement paste compared with the interface of the glass-based concrete. This result is also in good agreement with Steyn et al. [29], who stated that a better bonding at the interface may be due to the pozzolanic reaction between the GW and cement paste.
In contrast, it was found that the compressive strength of the B4 and B5 samples was reduced in comparison to the control sample, A. For example, at 7 days of curing, the compressive strength of B4 and B5 is 26.8 MPa and 25.0 MPa. The reductions are approximately 0.74% and 7.41%, respectively. Moreover, at 28 days of curing, the compressive strength of B4 and B5 are 33.5 MPa and 30.1 MPa. The reductions are approximately 0.30% and 10.42%, respectively. This reduction may be due to the weakening of the bonding at the interface. Tamanna et al. [16] revealed that the weakening of the bonding at the interface may be due to the excess quantity and angular shape of the GW.

3.4. Water Permeability Coefficient of Concrete

Table 5 shows the results of the water permeability test. Based on the results obtained, the water permeability coefficient of the control mix and Mix B1 are 1.097 × 10⁻⁹ m/s, and 0.883 × 10⁻⁹ m/s, respectively. With 5% of GW replacement, the water permeability coefficient of the sample is improved. This improvement may be attributed to the filler effect of the GW, as the particle size distribution of GW and sand are complementary. This statement is consistent with the results obtained from the SEM test. Figure 7a,b shows the SEM images of the control and glass-based concrete. From the images, it can be observed that the void’s quantity and void’s width in the Mix B1 sample are lesser and smaller than those of the control mix. This finding supports the results of the water permeability test, where the water permeability coefficient of the B1 samples is lower than that of the control samples.
In the same context, it was found that the water permeability of the B2, B3, B4 and B5 samples increased in comparison to the control sample. These results confirm that the lower content of glass waste is recommended. This is in line with Tamanna et al. [16], who revealed that the increase in the quantity of the voids and void width may be due to the excess quantity and angular shape of the GW.

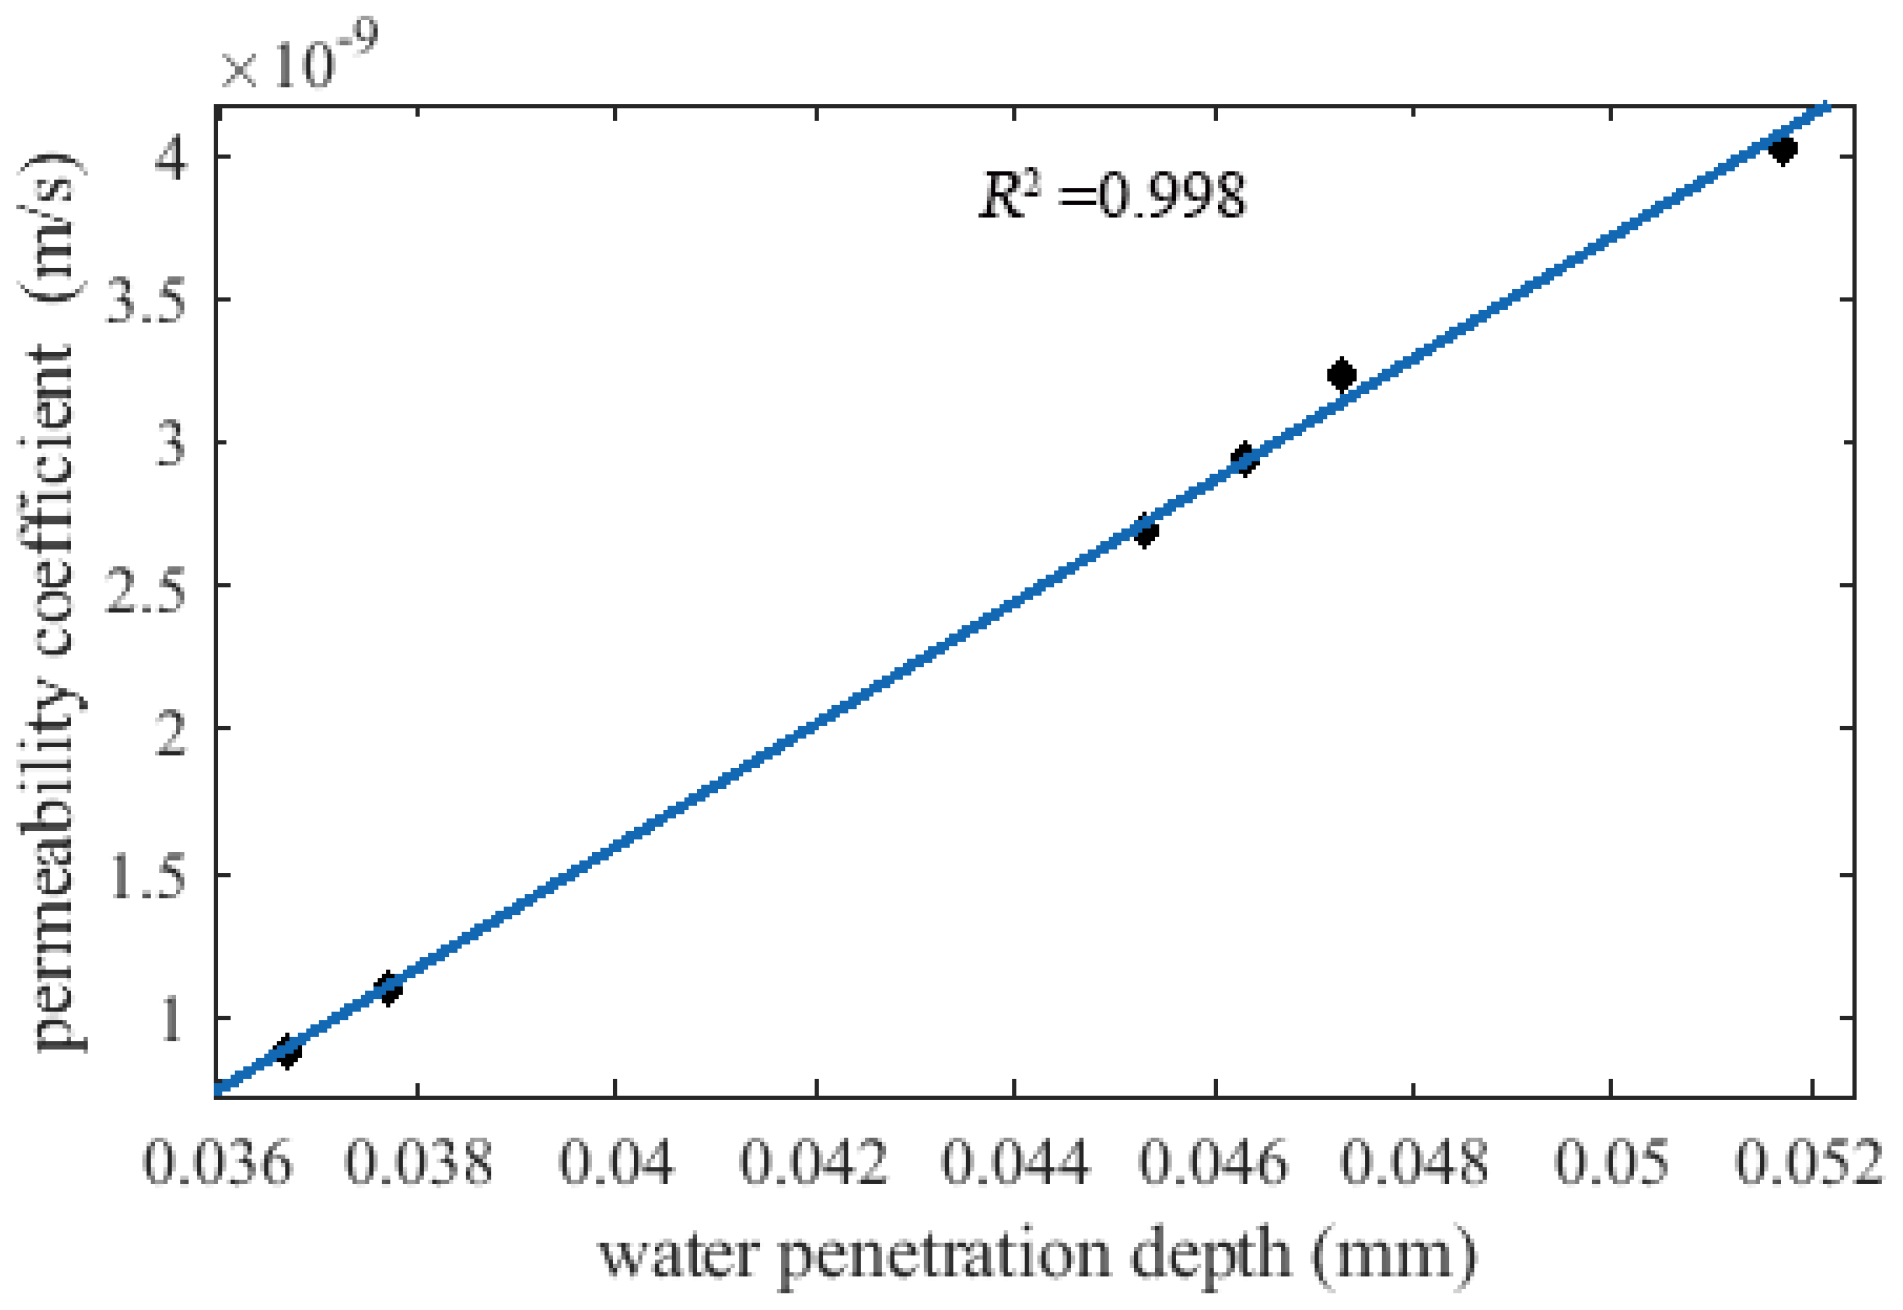
3.5. Permability Cofficeient Versus Perntration Depth of Water

The relationship between the permeability coefficient and the penetration depth of the water in all of the concrete mixes involving control and glass-based concrete mixes (A, B1, B2, B3, B4 and B5) was investigated and analyzed. This relationship is important as it reflects the quality of the concrete mixture. In particular, the resistance of the concrete to water penetration or other harmful ions is dependent on the porosity, the size of pores and the interconnectivity of the pores [33,34]. High water penetration depth means that the concrete mixture is permeable and has a lot of pores connected to each other. As shown in Figure 8, it is found that the relationship between permeability and penetration depth is linear, with a high correlation coefficient (greater than 0.9). In addition, the slope gradient is high, confirming that both the penetration depth and permeability coefficient are highly sensitive to glass waste content. With the increase in the glass waste content, both the water penetration and permeability coefficient also increased. This in line with our earlier discussion, in which the best glass content was 10% in term of concrete strength. From the viewpoint of permeability and penetration test, the best replacement percentage of fine aggregate by glass was 5% at 28 days.

4. Conclusions

In this study, the properties of fresh and hardened concrete incorporating glass waste as a partial replacement of fine aggregate were investigated and evaluated. The natural fine aggregate was replaced by 5%, 10%, 15%, and 20% of local glass waste. Based on the outcome of the present study, the main conclusions can be summarized as follow:
  • The workability of fresh glass-based concrete slightly decreased compared to that of the control concrete (without glass waste). The decrement in workability was attributed to the shape of the GW, which reduced the fluidity of the cement paste. In general, all of the concrete mixes including control and glass-based concrete had acceptable workability between 10 and 30 mm.
  • The glass-based concrete exhibited a higher compressive strength (37 MPa) in compression to the control (33.6 MPa), particularly when the replacement percentage increased up to 15%. Such a positive result was attributed to the availability of silica in the glass.
  • From the viewpoint of durability, the concrete incorporating 5% of glass waste showed a better performance compared to the control mix. Their water penetration and permeability coefficient were 0.0367, and 0.883 × 10⁻⁹ m/s, respectively, while the control mix had 0.0377 and 1.097 × 10⁻⁹ m/s.
  • It can be said that the incorporation of a lower content of glass waste is a good strategy and sustainable solution for further works. In addition, further concrete properties such as acid resistance and fire resistance should also be investigated.

Author Contributions

Conceptualization, R.H. and Z.J.; methodology, L.Q.Y.; software, L.Q.Y.; validation, R.H. and Z.J. formal analysis, A.A.-G.; investigation, L.Q.Y.; resources, Q.B.A.I.L.; data curation, R.H. and Z.J.; writing—original draft preparation, A.A.-G.; writing—review and editing, H.A.A.; writing—review and editing, R.H., Z.J. and Q.B.A.I.L.; visualization, Z.J. and L.Q.Y.; supervision, R.H. and Z.J.; project administration, R.H. and Z.J.; funding acquisition, Q.B.A.I.L. All authors have read and agreed to the published version of the manuscript.

Funding

This research was funded by MOHE TRC OMAN, grant number BFP/RGP/EI/21/041” and “The APC was funded by grant BFP/RGP/EI/21/041, College of Engineering and Architecture, University of Nizwa, OMAN”.

Institutional Review Board Statement

Not applicable.

Informed Consent Statement

Not applicable.

Data Availability Statement

Not applicable.

Acknowledgments

This research was supported by Universiti Tun Hussein Onn Malaysia (UTHM) through Tier 1 (Vot H906). The authors would like to acknowledge the support and funding of MOHE TRC OMAN, grant number BFP/RGP/EI/21/041” Department of Civil and Environmental Engineering, College of Engineering and Architecture, University of Nizwa, OMAN.

Conflicts of Interest

The authors declare no conflict of interest.

References

  1. Algaifi, H.A.; Shahidan, S.; Zuki, S.S.M.; Ibrahim, M.H.W.; Huseien, G.F.; Rahim, M.A. Mechanical properties of coconut shell-based concrete: Experimental and optimisation modelling. Environ. Sci. Pollut. Res. 2022, 29, 21140–21155. [Google Scholar] [CrossRef] [PubMed]
  2. European Ready Mixed Concrete Organization Association. Ready-Mixed Concrete Industry Statistics; European Ready Mixed Concrete Organization Association: Brussels, Belgium, 2018. [Google Scholar]
  3. Chilamkurthy, K.; Marckson, A.V.; Chopperia, S.T.; Santhanam, M. A Statistical Overview of Sand Demand in Asia and Europe. In Proceedings of the Case Management Conference, Hong Kong, China, 24 November 2016; pp. 1–16. [Google Scholar]
  4. UNEP. Sand and Sustainability: Finding New Solutions for Environmental Goverance of Global Sand Resources; United Nations Environment Programme: Geneva, Switzerland, 2020. [Google Scholar]
  5. Filho, W.L.; Hunt, J.; Lingos, A.; Platje, J.; Vieira, L.W.; Will, M.; Gavriletea, M.D. The Unsustainable Use of Sand: Reporting on a Global Problem. Sustainaility 2021, 13, 3356. [Google Scholar]
  6. Algaifi, H.A.; Mohamed, A.M.; Alsuhaibani, E.; Shahidan, S.; Alrshoudi, F.; Huseien, G.F.; Bakar, S.A. Optimisation of GBFS, Fly Ash, and Nano-Silica Contents in Alkali-Activated Mortars. Polymers 2021, 13, 2750. [Google Scholar] [CrossRef] [PubMed]
  7. Mujtaba, H.; Khalid, U.; Farooq, K.; Elahi, M.; Rehman, Z.; Shahzad, H.M. Sustainable utilization of powdered glass to improve the mechanical behavior of fat clay. KSCE J. Civ. Eng. 2020, 24, 3628–3639. [Google Scholar] [CrossRef]
  8. Paul, D.; Bindhu, K.; Matos, A.M.; Delgado, J. Eco-friendly concrete with waste glass powder: A sustainable and circular solution. Constr. Build. Mater. 2022, 355, 129217. [Google Scholar] [CrossRef]
  9. Cadore, B.C.; Ribeiro, F.R.C.; Modolo, R.C.E.; Pacheco, F. Performance analysis of concrete with repurposed industrial glass waste. J. Build. Pathol. Rehabil. 2023, 8, 1–13. [Google Scholar] [CrossRef]
  10. Chen, X.; Chen, H.; Tan, W. Effect of Glass Powder on the Mechanical and Drying Shrinkage of Glass-Fiber-Reinforced Cementitious Composites. Case Stud. Constr. Mater. 2022, 17, e01587. [Google Scholar] [CrossRef]
  11. Samadi, M.; Shah, K.W.; Huseien, G.F.; Lim, N.H.A.S. Influence of glass silica waste nano powder on the mechanical and microstructure properties of alkali-activated mortars. Nanomaterials 2020, 10, 324. [Google Scholar] [CrossRef] [Green Version]
  12. Kou, S.C.; Poon, C.S. Properties of self-compacting concrete prepared with recycled glass aggregate. Cem. Concr. Compos. 2009, 31, 107–113. [Google Scholar] [CrossRef]
  13. Olofinnade, O.M.; Ndambuki, J.M.; Ede, A.N.; Olukanni, D.O. Effect of substitution of crushed waste glass as partial replacement for natural fine and coarse aggregate in concrete. Mater. Sci. Forum 2016, 866, 58–62. [Google Scholar]
  14. Jin, W.; Meyer, C.; Baxter, S. “Glascrete”-concrete with glass aggregate. ACI Mater. J. 2000, 97, 208–213. [Google Scholar]
  15. Małek, M.; Łasica, W.; Jackowski, M.; Kadela, M. Effect of waste glass addition as a replacement for fine aggregate on properties of mortar. Materials 2020, 13, 3189. [Google Scholar] [CrossRef] [PubMed]
  16. Tamanna, N.; Tuladhar, R.; Sivakugan, N. Performance of recycled waste glass sand as partial replacement of sand in concrete. Constr. Build. Mater. 2020, 239, 117804. [Google Scholar] [CrossRef]
  17. BS 812: Part 103:1985; Testing Aggregates-Part 103: Methods for Determination of Particle Size Distribution. British Standard Institution: London, UK, 1985.
  18. BS 882:1992; Specification for Aggregates from Natural Sources for Concrete. British Standard Institution: London, UK, 1992.
  19. Bostanci, S.C. Use of Waste Marble Dust and Recycled Glass for Sustainable Concrete Production. J. Clean. Prod. 2020, 150, 119785–119799. [Google Scholar] [CrossRef]
  20. BS 1881: Part 125:1986; Testing Concrete- Part 125: Methods for Mixing and Sampling Fresh Concrete in the Laboratory. British Standard Institution: London, UK, 1986.
  21. BS EN 12390-3:2019; Testing Hardened Concrete-Part 3: Compressive Strength of Test Specimens. British Standard Institution: London, UK, 2019.
  22. BS EN 12390-2:2000; Testing Hardened Concrete-Part 2: Marking and Curing Specimens for Strength Tests. British Standard Institution: London, UK, 2000.
  23. Algaifi, H.; Bakar, S.A.; Alyousef, R.; Sam, A.R.; Salami, B.A. Machine learning and RSM models for prediction of compressive strength of smart bio-concrete. Smart Struct. Syst. 2021, 28, 535–551. [Google Scholar]
  24. Matos, A.M.; Sousa-Coutinho, J. Municipal solid waste incineration bottom ash recycling in concrete: Preliminary approach with Oporto wastes. Constr. Build. Mater. 2022, 323, 126548. [Google Scholar] [CrossRef]
  25. Mokhtar, N.; Johari, M.A.M.; Tajarudin, H.A.; Al-Gheethi, A.A.; Algaifi, H.A. A sustainable enhancement of bio-cement using immobilised Bacillus sphaericus: Optimization, microstructural properties, and techno-economic analysis for a cleaner production of bio-cementitious mortars. J. Clean. Prod. 2021, 318, 128470. [Google Scholar] [CrossRef]
  26. EN, B., 12390–12393: 2019; Standard Test Method for Compressive Strength. British Standards Institution: London, UK, 2019.
  27. EN, B., 12390–12398 (2012); Testing hardened concrete. Depth of penetration of water under pressure. BSI: London, UK, 2009.
  28. Hamza, M.; Nie, Z.; Aziz, M.; Ijaz, N.; Ijaz, Z.; Rehman, Z.U. Strengthening potential of xanthan gum biopolymer in stabilizing weak subgrade soil. Clean Technol. Environ. Policy 2022, 24, 2719–2738. [Google Scholar] [CrossRef]
  29. Steyn, Z.C.; Babafemi, A.; Fataar, H.; Combrink, R. Concrete Containing Waste Recycled Glass, Plastic and Rubber as Sand Replacement. Constr. Build. Mater. 2021, 269, 121242–121251. [Google Scholar] [CrossRef]
  30. Bashar, T.; Ghassan, N. Properties of Concrete Contains Mixed Color Waste Recycled Glass as Sand and Cement Replacement. Constr. Build. Mater. 2008, 22, 713–720. [Google Scholar]
  31. Mehta, P.K.; Monteiro, P.J. Concrete: Microstructure, Properties, and Materials, 4th ed.; McGraw-Hill Education: New York, NY, USA, 2014. [Google Scholar]
  32. Jhun, K.K.; Sulieman, M.Z.; Talib, R. Recycled Coarse Aggregates (RCA) as Natural Coarse Aggregates Replace-ment in Concrete Design; The better Alternative. Cem. Concr. Compos. 2011, 36, 3307–3310. [Google Scholar]
  33. Amran, Y.M.; Alyousef, R.; Alabduljabbar, H.; Alaskar, A.; Alrshoudi, F. Properties and water penetration of structural concrete wrapped with CFRP. Results Eng. 2020, 5, 100094. [Google Scholar] [CrossRef]
  34. Mhaya, A.M.; Baharom, S.; Baghban, M.H.; Nehdi, M.L.; Faridmehr, I.; Huseien, G.F.; Algaifi, H.A.; Ismail, M. Systematic Experimental Assessment of POFA Concrete Incorporating Waste Tire Rubber Aggregate. Polymers 2022, 14, 2294. [Google Scholar] [CrossRef] [PubMed]
Figure 1. Flowchart of the experimental work.
Sustainability 14 15895 g001
Figure 2. Grinding of glass waste.
Sustainability 14 15895 g002
Figure 3. Particle size distribution of sand and GW.
Sustainability 14 15895 g003
Figure 4. Slump test (a); curing of concrete samples (b).
Sustainability 14 15895 g004
Figure 5. Water permeability equipment with concrete samples (a); a compression testing machine (b).
Sustainability 14 15895 g005
Figure 6. Compressive strength of concrete (a) SEM test for control mix (b) SEM test for Glass-based concrete B1 (c).
Sustainability 14 15895 g006
Figure 7. SEM test for (a) control mix (b) Glass-based concrete B1.
Sustainability 14 15895 g007
Figure 8. Correlation between permeability coefficient and penetration depth at 28 days.
Sustainability 14 15895 g008
Table 1. Sieve analysis results of sand and glass waste.
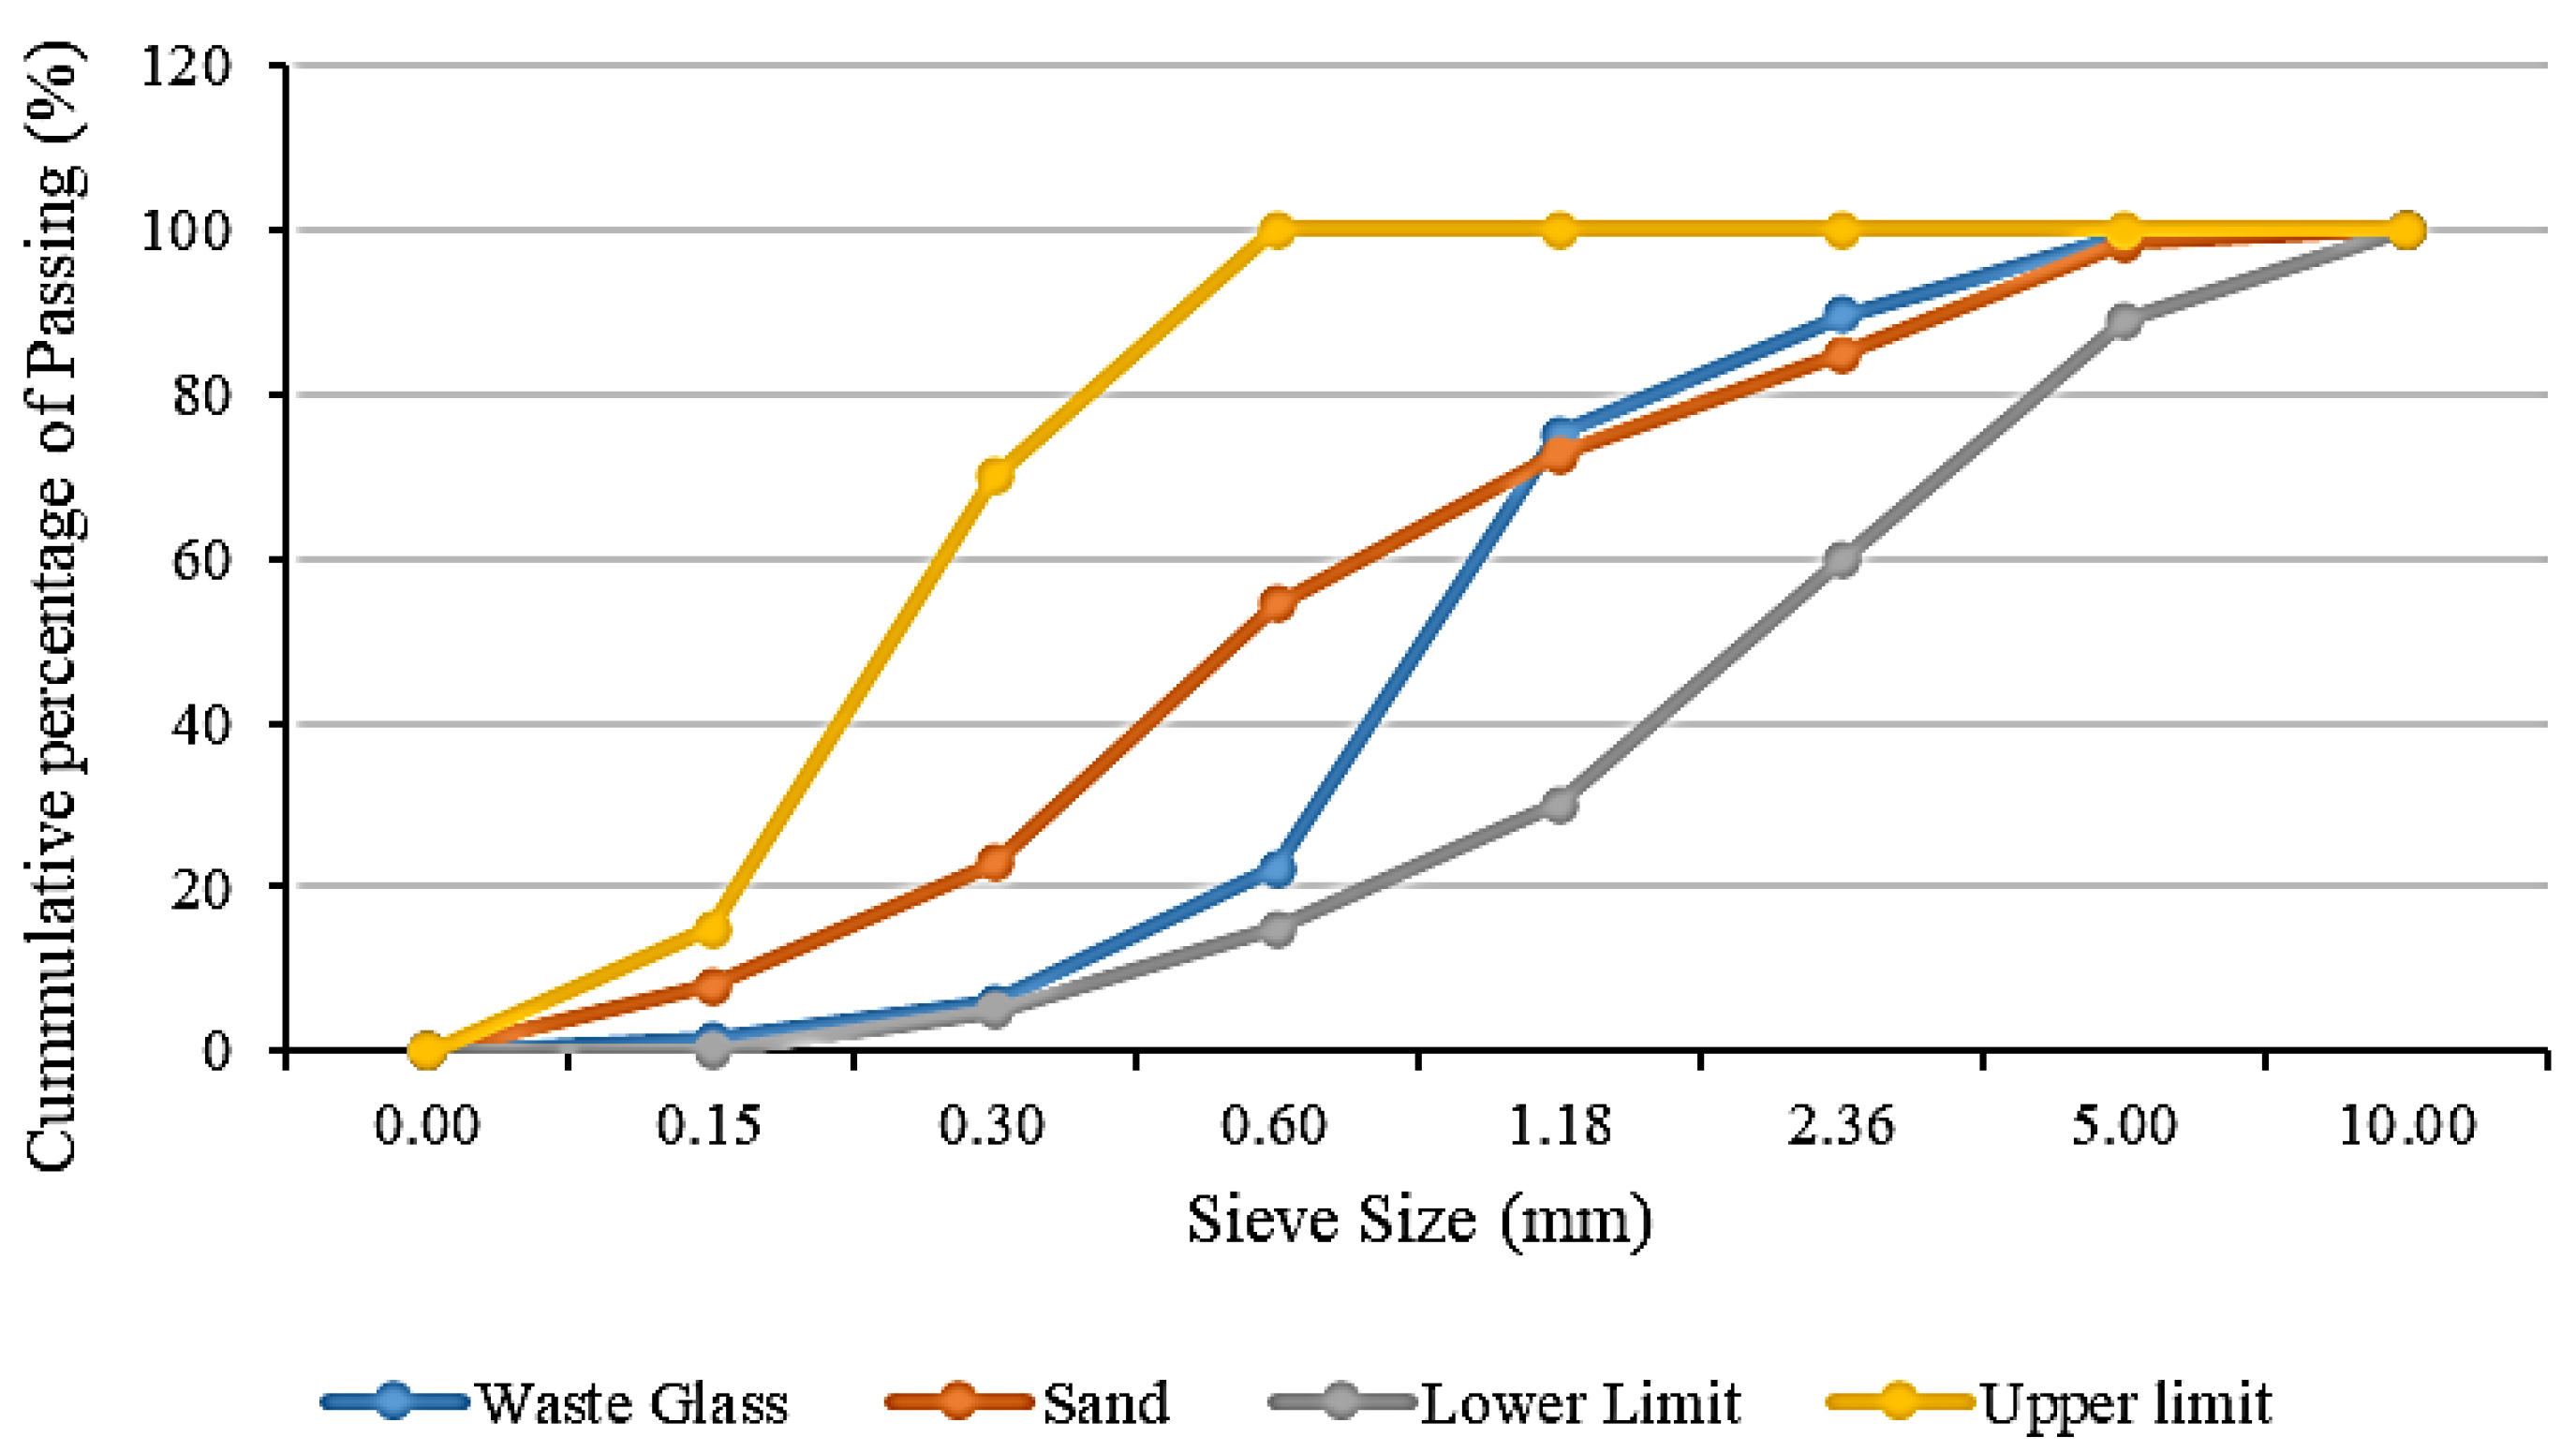
Sieve Analysis Results of Sand and GW
Sieve SizeGlass Waste (GW)Sand
Percentage of Cumulative Retained (%)Percentage of Cumulative Passing (%)Percentage of Cumulative Retained (%)Percentage of Cumulative Passing (%)
10.0 mm0.00100.000.00100.00
5.0 mm0.8099.201.6098.40
2.36 mm10.4789.5315.0384.97
1.18 mm24.8775.1327.4572.55
600 μm77.7322.2745.4954.51
300 μm94.006.0077.1522.85
150 μm98.531.4791.988.02
Pan100.000.00100.000.00
Table 2. Mix design proportion of concrete mixes.
Proportions of Concrete Mix Per 1 m3
Concrete MixesCement
(kg)
Water
(kg)
Sand
(kg)
Glass Waste
(kg)
Coarse Aggregate (kg)
10 mm20 mm
Mix A (0% GW)3101706350.0450900
Mix B1 (5% GW)310170603.2531.75450900
Mix B2 (10% GW)310170571.563.5450900
Mix B3 (15% GW)310170539.7595.25450900
Mix B4 (20% GW)310170508127450900
Mix B5 (25% GW)310170476.25158.75450900
Table 3. Slump test results of samples.
Concrete MixesSlump Value (mm)
A (0% GW)30
B1 (5% GW)19
B2 (10% GW)25
B3 (15% GW)15
B4 (20% GW)18
B5 (25% GW)20
Table 4. Average density of samples at 7 and 28 days.
Average Density (kg/m3)
Concrete Mixes7 days28 days
A (0% GW)2373.332376.67
B1 (5% GW)2373.332380.00
B2 (10% GW)2383.332390.00
B3 (15% GW)2400.002406.67
B4 (20% GW)2386.672400.00
B5 (25% GW)2376.672380.00
Table 5. Water permeability test results for 28 days samples.
Concrete MixesAverage Water Penetration Depth (m)Water Permeability Coefficient (m/s)
A (0% GW)0.03771.097 × 10−9
B1 (5% GW)0.03670.883 × 10−9
B2 (10% GW)0.04532.692 × 10−9
B3 (15% GW)0.04632.940 × 10−9
B4 (20% GW)0.04733.237 × 10−9
B5 (25% GW)0.05174.022 × 10−9
Publisher’s Note: MDPI stays neutral with regard to jurisdictional claims in published maps and institutional affiliations.

