Abstract
Water scarcity is a current problem in many parts of the planet and there is a worldwide concern about water availability to meet future water demand. In countries like Brazil, where most of the electricity is produced by hydroelectric power plants, water scarcity directly impacts energy production. The water–energy nexus is directly related and impacted by CO2 emissions and its climate consequences, which calls to a broader approach: energy–carbon–water nexus. In this context, the Sustainable Water and Energy Consumption (SWEC) Program was developed to mitigate water and energy supply problems in a railway company in Brazil. The actions took place in four main areas: (a) users conscientization, (b) consumption diagnosis, (c) indicators for evaluating water and energy consumption, and (d) evaluation of implementing alternative cleaner water and energy sources. The per capita consumption of water and energy were reduced by 10% and 19%, respectively. Permanent results were achieved by the SWEC Program, such as the acquisition of two photovoltaic systems with a total capacity of 96.5 kWp. The investment made provided an average monthly reduction in energy consumption of 56% in 2022. This work contributed to the UN Agenda 2030 and the findings may help companies and industries, and other institutions, such as universities and schools, to improve their water and electricity consumption.
1. Introduction
Humans are using more natural resources every day, which raises questions about how their actions may directly contribute to climate change and how their consumption may affect the emissions of harmful gases into the environment. As the population increases, the demand for goods and services in major urban centers increases. This is due to the possibility that a lack of infrastructure development, timely delivery, or storage could limit the availability of water [1,2,3].
Water scarcity is a current problem in many parts of the planet and there is a worldwide concern about water availability to meet future water demand. Overall, from 2016 to 2050, the global urban water shortage is expected to worsen significantly. Moreover, nearly half of the world’s urban population (1.693–2.373 billion people) is expected to reside in a water-scarce region by 2050 [4]. Engineering and infrastructure have traditionally been used to alleviate urban water shortages, however, water infrastructure is expensive and has the potential to cause environmental consequences [4].
Given the proportion of all transport activity that rail makes up, rail infrastructure only accounts for 3% of the global demand for transport energy. Nevertheless, steps must be taken to lessen the energy requirements of the transportation sector, which is a major contributor to world energy consumption and related greenhouse gas emissions [5,6].
Water scarcity is related to energy shortage. For the safe and reliable generation of electricity, the power generation industry requires large amounts of water, from moving turbines in the case of hydroelectric or to condensing steam in the case of thermoelectric [7]. In countries like Brazil, where most of the electricity is produced by hydroelectric power plants, water scarcity directly impacts energy production.
The implementation of actions for sustainable use of water and energy is critical for mitigating water and energy supply problems. Demand-side management (DSM) is one of these efforts and consists of planning and conducting water or energy consumption activities to encourage consumers to change their use levels and patterns [8]. Furthermore, DSM programs are designed to minimize consumption by supporting high-efficiency technology and building design [9,10,11,12,13,14,15]. Technological tools have been reported to achieve a 35–50% reduction in water consumption in household appliances [16].
Most literature reports the application of DSM programs to reduce water and energy consumption in schools [17,18,19,20], universities [21,22], hotels [23], households [24], and railway [6]. The lack of knowledge has been considered a hindrance in implementing sustainable specifications for public buildings [8].
Another effort is the development of regulations, which are being created and updated in both developed and developing nations to obtain optimum energy savings in buildings. Building certification is a key technique for making these laws and regulations effective [25], such as LEED, BREEAM, VERDE, and LiderA [26]. In Brazil, the MPOG Normative Instruction of 19 January 2010 established environmental sustainability criteria in the acquisition of goods, contracting of services, or works by the Federal Public Administration [27]; and, later, Decree No. 7746, of 5 June 2012 [28], established sustainable criteria, practices, and guidelines for hiring carried out by the federal public administration as legal frameworks for the adoption of criteria to reduce energy consumption and water consumption.
Strategies to promote water and energy savings may reflect in the reduction of carbon dioxide emissions [25]. The water–energy nexus is directly related and impacted by CO2 emissions and its climate consequences, which calls to a broader approach: energy–carbon–water nexus [29].
The shift to a more carbon-efficient global energy system could help us achieve such goals. Buildings, in particular, account for 40% of energy usage, and there is significant room for reduction [30]. In order to understand the true impacts of these emissions, it is necessary to know how goods and services are consumed by society and to measure the impacts they cause. Moreover, the current energy crises observed in Europe reinforces the need for a solution on improving energy consumption efficiency and expanding the energy matrix.
Recently, it was observed that the sustainability field is understudied in railway research [31]. In this context, to fill the gap of more action in the railway sector to reduce water and energy consumption, and consequently GHG emissions, the Sustainable Water and Energy Consumption (SWEC) Program was developed. This paper presents the SWEC validation in the buildings of a public railway company in Brazil. The work is divided into three sections: (i) Methodology, (ii) Results, (iii) Limitation and future work, and finally, (iv) Conclusions.
2. Materials and Methods
2.1. SWEC Validation—Case Study
The SWEC validation was carried out at a public company of light railway operation and maintenance. The company buildings were distributed in four different municipalities of northeastern Brazil, as shown in Figure 1: João Pessoa, Cabedelo, Santa Rita, and Bayeux. The system is composed of 12 train stations distributed throughout 30 km of the railway. The main office, where most of the employee’s works, is in the João Pessoa Rail Station (7°06′54″ S, 34°53′26″ W), while the workshop where the train maintenance is performed is located in the Cabedelo Rail Station. The company possess a total of 17 hydrometers and 22 electricity meters distributed throughout the buildings. The main office consumes most of the energy and water in the company (>90%), followed by the train workshop and train station.
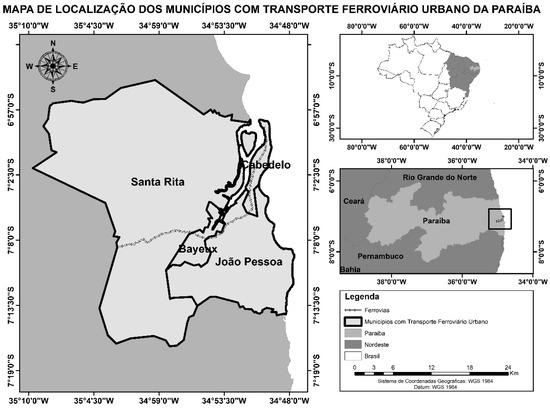
Figure 1.
Location map of the Paraiba Railway System, Brazil (adapted from [32]).
2.2. Sustainable Water and Energy Consumption Program Overview
The SWEC Program aims to promote (i) the sustainable usage of energy and water; (ii) the reduction of resource waste; (iii) optimization of water and energy expenses; and (iv) user conscientization. The specific goals are shown in Table 1.

Table 1.
Specific goals of the Sustainable Water and Energy Consumption Program.
The following sections will detail the SWEC Program framework, which consists of actions divided into four sections: (a) users conscientization, (b) consumption diagnosis, (c) indicators for evaluating water and energy consumption, and (d) evaluation of implementing alternative cleaner water and energy sources.
2.3. Sustainable Water and Energy Consumption (SWEC) Program Framework
2.3.1. Users’ Conscientization and Consumption Diagnosis
Previous research and other studies [33,34,35] have reported on the impact of water usage behaviors on water savings. Interventions such as workshops, e-mails, signs on washrooms, posters, and hand-delivered booklet have been shown to reduce water consumption by up to 35% [36]. A marketing campaign was developed to raise users’ awareness. The initiative had four major components: (i) reminder signs, (ii) an educational booklet, (iii) periodic reports, and (iv) informative talks.
The reminder signs were placed on all faucets to encourage water conservation, and on all light switches to remind users to turn off the lights before leaving the room. Furthermore, signs were placed around the buildings requesting that water leaks and other maintenance issues regarding water and energy use be reported.
A printed educational booklet containing information on smarter water and energy-saving practices was delivered to all employees. Following the program’s launching, bi-monthly updates on water and energy consumption and expenses were sent by institutional e-mail to supervisors and managers. The informative talks were placed during key events, such as “Safety and Environmental Week” which included contests and the distribution of gifts and prizes.
For the consumption diagnosis, a database was created to gather information on water and energy use, costs, and consuming items. Table 2 lists the sources for each kind of information.
Table 2.
Sources of information for water and energy consumption diagnosis.
2.3.2. Indicators for Evaluating Water and Energy Consumption
Indicators were set to monitor the SWEC Program results. The indicators for water and energy are displayed in Table 3.
Table 3.
Indicators for water and energy consumption.
The indicators W5 and E4 were included in the Program after observing an increment in the number of employees in the company of 15% in the first year. The addition of W3 was justified by the findings by other studies that more than 50% of the water saving is possible by changing the type of faucet [37]. In addition, a study conducted in a hotel in Spain showed that installing water-saving devices in the taps is highly profitable [38].
The frequency of data collection for each indicator was defined as follows: monthly for W1, W2, W5, E1, E2, and E4, which the primary source of information is the monthly bills of the concessionaires; biannual for W3, W4 and E3, whose main source of information is on-site inspections of all buildings. The frequency of data collection can be flexible depending upon the needs and resources available for implementing the Program.
On-site inspections were carried out to identify, count, and examine the state of all water and energy consumption items. The surveys were conducted with peers every 6 months, although a higher frequency can improve the results by fast detecting issues.
2.3.3. Clean Alternative Energy and Alternative Water Supplies
The SWEC Program’s technological efforts also included the installation of greener sources of water and energy. Given the local characteristics of the 5.82 kWh m−2 average global radiation [39] and an annual average precipitation of 1914 mm, the acquisition of a photovoltaic system for alternative energy and rainwater harvesting for non-contact uses water supply was suitable to meet the goal of reducing water and the energy cost, particularly through more sustainable sources.
3. Results and Discussion
3.1. First 24-Months Results
Table 4 shows the results of a SWOT analysis conducted to evaluate the SWEC Program´s implementation in the company.
Table 4.
SWOT analysis of SWEC Program implementation in the building of a public railway company in northeastern Brazil.
Table 5 presents the summary of the indicator’s performance after the first 24-months of Sustainable Water and Energy Consumption Program in the public company of light railway in northeastern Brazil.
Table 5.
Summary of the results for each indicator after 24-months of implementation.
The global water consumption, W1, increased significantly while the global energy consumption, E1, decreased. The increase in water consumption may be justified by the following reasons: the company had an increase in manpower of 15% during the period, the maintenance and replacement of hydrometers which were broken or not properly reading the real water consumption, and the water theft from the company in remote areas considering the economic crises and the unemployment number in Brazil in the last years [40].
As seen in Table 5, the reduction per capita energy consumption, E4, was greater than per capita water consumption, W5. This may be justified by the fact that, in addition to the user´s conscientization actions, more efficient electrical items, such as air-conditioning with inverter technology and LED lightings, were substituted (E3). In Israel, some green schools were defined in research and as having particularly low usage in buildings that had a very efficient air conditioning system (VRF) installed [19]. It was observed that this strategy consumed approximately 41% less energy per year than the educational systems.
Only via the user´s education and corrective maintenance of hydraulic items it was possible to reduce per capita water consumption by 10%. Unfortunately, it was not possible to acquire more efficient hydraulic equipment, such as self-closing faucet (W3) or dual flushing toilets kits. For W2 the Poco station highlighted with an observed reduction of 77%, attributed to a leaking fixture in the toilet flush.
After 18 months, employees were given a questionnaire, and the following results were obtained: 97% agree totally or partially with the importance of acquiring more efficient equipment, 88.7% declare, wherever feasible, act to reduce water consumption, and 93% care about sustainable water consumption.
During the on-site inspection, it was detected that some water-consuming items such as flushes and faucets were broken or showed some defect that limited their use. As a result of the SWEC Program´s application, these items were repaired or substituted by maintenance staff, and consequently, the number of water consuming items increased. The slightly increase in the leaking hydraulic components, W4, can be justified by the fact that past defective items, which have since been repaired, were susceptible to leaking from misusage or minimal maintenance. The W4 results clearly indicate that greater attention should be spent towards maintenance of consuming items, as their leakage might represent a large amount of water wasted daily, reducing the overall Program efficiency for water saving. Water waste in public buildings has been identified as a serious issue in public buildings as a result of faulty plumbing fixtures [41].
Water conservation education and awareness initiatives, as well as the marketing of water-saving devices, have a significant influence on water use [34]. To improve the user’s conscientization, it would be highly recommended to create a social media campaign, which is proven to make marketing campaigns much more powerful [42].
Given that rainwater acceptability is higher for non-contact and non-intake uses [43], the SWEC Program proposed rainwater usage for gardening, trains washing, and toilet flushing. It was found that for the mentioned usage, the economic viability of the system would be met [44]. However, it was not possible to be executed due to administration restrictions. Moreover, a study conducted in Recife (a city nearby Joao Pessoa) showed that green roofs also have a great potential for non-potable uses and should be considered in buildings to reduce consumption of public supply water [45].
3.2. Recent Results
One of the main results of the SWEC Program was achieved some years after two years, by the installation of two on-grid photovoltaic (PV) systems: (a) a PV system of 67 kWp in João Pessoa office, and (b) a PV system of 29.5 kWp in Cabedelo train workshop. Figure 2 shows the PV system installed in the Joao Pessoa office. The simple payback period was expected to be four years. This estimate was based on the PV system prices in the region, insulation hours in the area, and the electricity prices.
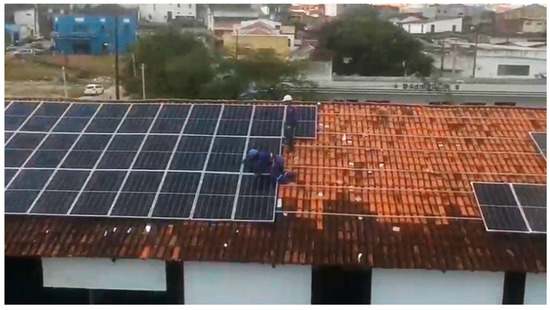
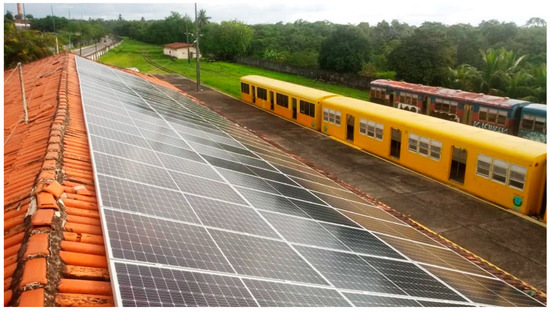
Figure 2.
Photovoltaic systems from Joao Pessoa office during (top) and after (down) installation.
Figure 3 and Table 6 show the results of energy consumption for the period before and after PV system installation. The period of 2019 was compared to that from 2022 (until September), because 2020 and 2021 were atypical years affected by pandemic lockdowns. An average monthly reduction of 56% was observed in 2022. Other programs have achieved a 42.4% reduction on net-energy demand with a program to implement PV systems, a total replacement of actual lighting by LED, and the implementation of a battery system using lithium-ion batteries with a capacity of 100 kWh [22].
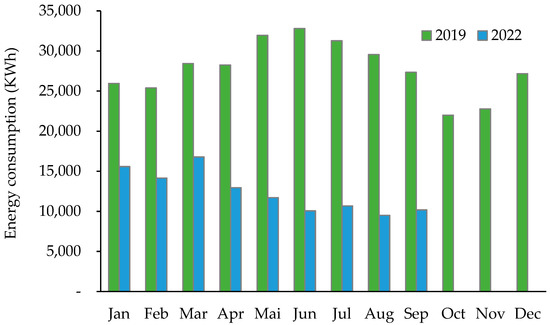
Figure 3.
Comparison of energy consumption in Paraiba rail company before (2019) and after (2022) photovoltaic system installation.
Table 6.
Energy consumption in the Paraiba rail system in 2019 and 2022.
When comparing sustainable building research to the same energy-saving studies, most have achieved an average of 30 to 50% reduction in energy consumption by implementing sustainable projects with photovoltaic systems, replacement of inefficient lightning, and implementing new air conditioning and heating technologies [19,20,21].
3.3. Emission of Greenhouse Gas (GHG)
The photovoltaic system originating from solar energy, a renewable source, can also reduce the CO2 emission. The reduction on CO2 emissions related to the energy savings by the photovoltaic system was quantified. For the emissions of each GHG to be transformed into CO2e emissions, the Global Warming Potential (GWP) was used. The GWP is an indicator of the ability of a gas to contribute to global warming and compares the heat factor in the atmosphere of a ton of a GHG for a given time interval with a ton of CO2, showing the relative contribution of the emission to the atmosphere of 1 t of a given GHG compared to the emission of 1 t of CO2 [46,47]. This time interval is called the time horizon, which represents the period of analysis counted from the instantaneous emission of the GHG [46].
The analysis of the carbon footprint has been done by adopting a streamlined lifecycle approach and the results are presented using a CO2 e metric [48]. This approach is in essence a slimmed down version of a complete LCA adopting all its core processes and excluding low contributing processes that would be otherwise included in a full LCA. The methodology adopted in this work for the carbon footprint is based partially on the framework described by the World Resources Institute (WRI) [49], The Ministry of Science, Technology, and Innovation of Brazil (MCTI) [48], and the conceptual LCA framework guidelines designated by the ISO [50,51].
In this context, to perform the calculation, the parameters of The Ministry of Science, Technology, and Innovation (MCTI) [48] were used, using the Equation (1): GHG emission calculation for the purchase of electricity [49].
where ECO2 are the emissions attributable to electricity consumption from the national grid in month m of year y, in tCO2e; Cm,y is the electricity consumption from the national grid in month m of year y, in MWh; FECO2 is the emission factor applicable to electricity from the national grid in month m of year y, in t CO2/MWh; m is the month of consumption referring to electricity consumption; and y is the reference year.
ECO2, m, = Cm, FECO2, m,
The two-year epidemic prevented the rail system from operating at full capacity and prevented all staff from working. To better understand the true impact of The SWEC Program and the deployment of the solar system, it was decided to compare the years before and “after” the epidemic. Table 7 and Figure 4 show a comparison between the greenhouse gas emissions in 2019 and 2022.
Table 7.
GHG Emission CO2 (t).
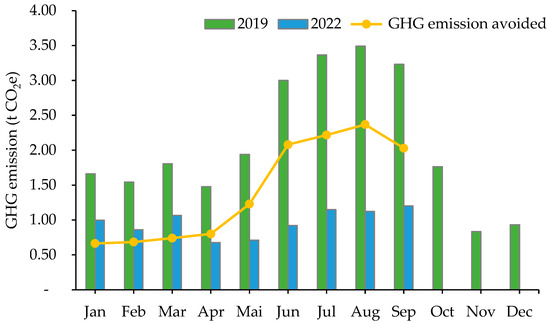
Figure 4.
GHG emission in 2019 and 2022, after photovoltaic system installation.
The months with the lowest emissions of greenhouse gases were June, with 69%, August, with 67%, and July, with 65%, respectively. These months are winter in Brazil, but because to the region’s proximity to the equator, the solar insulation remains constant, showing no seasonal variation reflected in the greenhouse gases emission stability in 2022.
More than 50% of GHG emissions were avoided in every month, indicating that the SWEC Program and the use of photovoltaic energy were successful to promote carbon reduction by the company.
4. Limitations and Future Work
The SWEC Program brought a radical shift in the rail company by changing the way employees thought about water and energy use, which helped to develop solutions and creative consumption habits. However, the Program´s execution was limited to the public budget and availability of personnel to carry out activities other than their regular responsibilities. The implementation of initiatives, which depends on investments, is very limited in governmental companies, particularly in emerging economies. Other technologies and devices are suggested to provide water and energy savings, such as motion sensor light switch, dual flush toilets, self-closing faucets, flow reducing devices, and faucet aerators. The potential for savings with these items is significant, as it was estimated that each unit increase of each unit of water-saving devices resulted in a 0.512 decrease in the water consumption level in households [52]. Moreover, the irrigation system and vegetation with lower water requirements can also be considered to reduce water consumption and consequently cost, after payback time [53].
The SWEC approach´s effectiveness is highly dependent on a continuous assessment of the consumption. It is wise to verify the consumption of each hydraulic and energy consuming items, as well as estimate the consumption of the railway passengers. A benchmarking study is also necessary to identify other best practices that were critical to water and energy savings at a mid-stage point.
Given that the motivational variable impacts water-saving behaviors and that basic actions may be suitable for integration into a daily routine [54], the SWEC Program should revise its strategy to effectively motivate employees on the issue while also aiming for long-term results.
5. Conclusions
The paper presented a methodology to implement a sustainable consumption approach of water and energy in the building. The methodology was validated in a public company, more specifically, a railway company in northeastern Brazil. The per capita consumption of water and energy was reduced by 10% and 19%, respectively. These results can be justified by the high education campaign, but not only considering technological efforts carried out through the implementation of the Program.
Permanent results were achieved by the SWEC Program implementation, such as the acquisition of two photovoltaic systems with a total capacity of 96.5 kWp. The investment made provided a fast return, with an average monthly reduction in energy consumption of 56% in 2022, due to the high insulation of the region.
An overall evaluation for the SWEC Program revealed that the approach must be applied and evaluated on an ongoing basis. Water use was not reduced globally, and efforts such as analyzing each water-using device, quantifying consumption for the passenger, and implementing the Program in other companies with comparable characteristics are necessary.
The SWEC Program has a strong appeal in sustainability and climate change actions. It decreased the emission of greenhouse gases by more than 50% on average per month, calculated by the reduction on energy use, leading to an average reduction of 1.4 tons of CO2 emission per month, and minimizing the environmental effect caused by the operation of the rail system.
The findings of this paper may be useful to other companies and industries, public or private, and other public institutions, such as universities and schools with large buildings and elevated consumption of water and electricity. Finally, this work contributed to the UN Agenda 2030, mainly to the Sustainable Development Goals 11 (Sustainable Cities and Communities), 7 (Affordable and Clean Energy), and 13 (Climate Action).
Author Contributions
Conceptualization. M.A.C., D.D.F.-S. and L.H.M.P.; methodology. M.A.C., D.D.F.-S. and L.H.M.P.; validation. M.A.C., L.H.M.P. and D.D.F.-S.; formal analysis. M.A.C., D.D.F.-S. and L.H.M.P.; investigation. M.A.C., L.H.M.P. and D.D.F.-S.; data curation. M.A.C. and L.H.M.P.; writing—original draft preparation. M.A.C., D.D.F.-S. and L.H.M.P.; writing—review and editing. M.A.C., L.H.M.P., D.D.F.-S. and A.F.R.-R.; visualization. M.A.C. and L.H.M.P.; supervision. A.F.R.-R.; project administration. M.A.C., D.D.F.-S. and L.H.M.P. All authors have read and agreed to the published version of the manuscript.
Funding
This research received no external funding.
Institutional Review Board Statement
Not applicable.
Informed Consent Statement
Not applicable.
Data Availability Statement
Not applicable.
Acknowledgments
We would like to thank all the employees from the Brazilian Company of Urban Trains in João Pessoa (Brazil) which contributed to this work. We also would like to thank Gilson Athayde Barbosa Jr. from the Federal University of Paraiba (UFPB) and his students Afonso Eris Ferreira de Andrade and Elda Karoline Videres for their relevant contribution in this work.
Conflicts of Interest
The authors declare no conflict of interest.
References
- Gassner, A.; Lederer, J.; Kanitschar, G.; Ossberger, M.; Fellner, J. Extended ecological footprint for different modes of urban public transport: The case of Vienna, Austria. Land Use Policy 2018, 72, 85–99. [Google Scholar] [CrossRef]
- Zisopoulou, K.; Zisopoulos, D.; Panagoulia, D. Water Economics: An In-Depth Analysis of the Connection of Blue Water with Some Primary Level Aspects of Economic Theory I. Water 2022, 14, 103. [Google Scholar] [CrossRef]
- Zisopoulou, K.; Panagoulia, D. An In-Depth Analysis of Physical Blue and Green Water Scarcity in Agriculture in Terms of Causes and Events and Perceived Amenability to Economic Interpretation. Water 2021, 13, 1693. [Google Scholar] [CrossRef]
- He, C.; Liu, Z.; Wu, J.; Pan, X.; Fang, Z.; Li, J.; Bryan, B.A. Future global urban water scarcity and potential solutions. Nat. Commun. 2021, 12, 4667. [Google Scholar] [CrossRef]
- Ji, L.; Yu, Z.; Ma, J.; Jia, L.; Ning, F. The Potential of Photovoltaics to Power the Railway System in China. Energies 2020, 13, 3844. [Google Scholar] [CrossRef]
- Barone, G.; Buonomano, A.; Forzano, C.; Giuzio, G.F.; Palombo, A. Assessing energy demands of building stock in railway infrastructures: A novel approach based on bottom-up modelling and dynamic simulation. Energy Rep. 2022, 8, 7508–7522. [Google Scholar] [CrossRef]
- Sanders, K.T. Critical Review: Uncharted Waters? The Future of the Electricity-Water Nexus. Environ. Sci. Technol. 2015, 49, 51–66. [Google Scholar] [CrossRef]
- Gellings, C.W. Evolving practice of demand-side management. J. Mod. Power Syst. Clean Energy 2017, 5, 1–9. [Google Scholar] [CrossRef]
- Boshell, F.; Veloza, O.P. Review of developed demand side management programs including different concepts and their results. In Proceedings of the 2008 IEEE/PES Transmission and Distribution Conference and Exposition: Latin America, Bogota, Colombia, 13–15 August 2008. [Google Scholar] [CrossRef]
- Moreno-Camacho, C.A.; Montoya-Torres, J.R.; Jaegler, A.; Gondran, N. Sustainability metrics for real case applications of the supply chain network design problem: A systematic literature review. J. Clean. Prod. 2019, 231, 600–618. [Google Scholar] [CrossRef]
- Nižetić, S.; Jurčević, M.; Čoko, D.; Arıcı, M. A novel and effective passive cooling strategy for photovoltaic panel. Renew. Sustain. Energy Rev. 2021, 145, 111164. [Google Scholar] [CrossRef]
- Ben Amara, H.; Bouadila, S.; Fatnassi, H.; Arici, M.; Guizani, A.A. Climate assessment of greenhouse equipped with south-oriented PV roofs: An experimental and computational fluid dynamics study. Sustain. Energy Technol. Assess. 2021, 45, 101100. [Google Scholar] [CrossRef]
- Shalaby, S.; Kabeel, A.E.; Moharram, B.E.; Shama, A.; Abosheiasha, H.A. Experimental study on the single basin solar still integrated with shell and spiral finned tube latent heat storage system enhanced by copper oxide nanoparticles. Environ. Sci. Pollut. Res. 2022. [Google Scholar] [CrossRef]
- Rasheed, M.B.; Javaid, N.; Ahmad, A.; Jamil, M.; Khan, Z.A.; Qasim, U.; Alrajeh, N. Energy Optimization in Smart Homes Using Customer Preference and Dynamic Pricing. Energies 2016, 9, 593. [Google Scholar] [CrossRef]
- Balouch, S.; Abrar, M.; Muqeet, H.A.; Shahzad, M.; Jamil, H.; Hamdi, M.; Malik, A.S.; Hamam, H. Optimal Scheduling of Demand Side Load Management of Smart Grid Considering Energy Efficiency. Front. Energy Res. 2022, 10, 861571. [Google Scholar] [CrossRef]
- Inman, D.; Jeffrey, P. A review of residential water conservation tool performance and influences on implementation effectiveness. Urban Water J. 2006, 3, 127–143. [Google Scholar] [CrossRef]
- Flores, R.A.; Ghisi, E. Benchmarking Water Efficiency in Public School Buildings. Sustainability 2022, 14, 3794. [Google Scholar] [CrossRef]
- Antunes, L.N.; Ghisi, E. Water and energy consumption in schools: Case studies in Brazil. Environ. Dev. Sustain. 2020, 22, 4225–4249. [Google Scholar] [CrossRef]
- Meron, N.; Meir, I.A. Building green schools in Israel. Costs, economic benefits and teacher satisfaction. Energy Build. 2017, 154, 12–18. [Google Scholar] [CrossRef]
- Katsaprakakis, D.A.; Zidianakis, G. Upgrading Energy Efficiency For School BuildingsIn Greece. Procedia Environ. Sci. 2017, 38, 248–255. [Google Scholar] [CrossRef]
- Khoshbakht, M.; Gou, Z.; Dupre, K. Energy use characteristics and benchmarking for higher education buildings. Energy Build. 2018, 164, 61–76. [Google Scholar] [CrossRef]
- Fonseca, P.; Moura, P.; Jorge, H.; De Almeida, A. Sustainability in university campus: Options for achieving nearly zero energy goals. Int. J. Sustain. High. Educ. 2018, 19, 790–816. [Google Scholar] [CrossRef]
- Tirado, D.; Nilsson, W.; Deyà-Tortella, B.; García, C. Implementation of Water-Saving Measures in Hotels in Mallorca. Sustainability 2019, 11, 6880. [Google Scholar] [CrossRef]
- Lee, M.; Tansel, B.; Balbin, M. Influence of residential water use efficiency measures on household water demand: A four year longitudinal study. Resour. Conserv. Recycl. 2011, 56, 1–6. [Google Scholar] [CrossRef]
- Lopes, A.D.C.P.; Filho, D.O.; Altoe, L.; Carlo, J.C.; Lima, B.B. Energy efficiency labeling program for buildings in Brazil compared to the United States’ and Portugal’s. Renew. Sustain. Energy Rev. 2016, 66, 207–219. [Google Scholar] [CrossRef]
- Polli, G.H.B. A Comparison about European Environmental Sustainability Rating Systems: BREEAM UK, DGNB, LiderA, ITACA and HQE. U. Porto J. Eng. 2020, 6, 46–58. [Google Scholar] [CrossRef]
- Ministério do Planejamento, Orçamento e Gestão (MPOG). Instrução Normativa n. 01 de 19 de Janeiro de 2010; Ministry of Planning, Budget and Management: Brasilia, Brazil, 2010. [Google Scholar]
- Casa Civil da Presidência da República. Decreto n. 7.746 de 05 de Junho de 2012; Civil House of the Presidency of the Republic: Brasilia, Brazil, 2012. [Google Scholar]
- Li, H.; Zhao, Y.; Lin, J. A review of the energy–carbon–water nexus: Concepts, research focuses, mechanisms, and methodologies. WIREs Energy Environ. 2020, 9, e358. [Google Scholar] [CrossRef]
- Commision of the European Union. Directive 2012/27/EU of the European Parliament and of the Council of 25 October 2012 on Energy Efficiency. Off. J. Eur. Union 2012, OJ L 315, 1–56. [Google Scholar]
- Da Fonseca-Soares, D.; Galvinicio, J.D.; Eliziário, S.A.; Ramos-Ridao, A.F. A Bibliometric Analysis of the Trends and Characteristics of Railway Research. Sustainability 2022, 14, 13956. [Google Scholar] [CrossRef]
- de Almeida Carneiro, M.; da Fonseca Soares, D. Solar Photovoltaic Assistance System Study for a Brazilian Light Rail Vehicle. U. Porto J. Eng. 2020, 6, 35–45. [Google Scholar] [CrossRef]
- Lee, M.; Tansel, B. Water conservation quantities vs customer opinion and satisfaction with water efficient appliances in Miami, Florida. J. Environ. Manag. 2013, 128, 683–689. [Google Scholar] [CrossRef]
- Tortajada, C.; González-Gómez, F.; Biswas, A.K.; Buurman, J. Water demand management strategies for water-scarce cities: The case of Spain. Sustain. Cities Soc. 2019, 45, 649–656. [Google Scholar] [CrossRef]
- Martínez-Espiñeira, R.; García-Valiñas, M.Á. Adopting versus adapting: Adoption of water-saving technology versus water conservation habits in Spain. Int. J. Water Resour. Dev. 2013, 29, 400–414. [Google Scholar] [CrossRef]
- Ehret, P.J.; Hodges, H.E.; Kuehl, C.; Brick, C.; Mueller, S.; Anderson, S.E. Systematic Review of Household Water Conservation Interventions Using the Information–Motivation–Behavioral Skills Model. Environ. Behav. 2020, 53, 485–519. [Google Scholar] [CrossRef]
- Englart, S.; Jedlikowski, A. The influence of different water efficiency ratings of taps and mixers on energy and water consumption in buildings. SN Appl. Sci. 2019, 1, 525. [Google Scholar] [CrossRef]
- Barberán, R.; Egea, P.; Gracia-De-Rentería, P.; Salvador, M. Evaluation of water saving measures in hotels: A Spanish case study. Int. J. Hosp. Manag. 2013, 34, 181–191. [Google Scholar] [CrossRef]
- Melquíades, T.F.; Diniz, F.F.; Nunes, A.M.M.; Martins, J.M.; Júnior, E.P.S.; Junior, L.M.C. Previsão da radiação solar global em João Pessoa, Paraíba, Brasil: Uma aplicação dos modelos da família ARIMA. Concilium 2022, 22, 213–224. [Google Scholar] [CrossRef]
- Pereira, S.D.; Cabral, J.P.C. Informalidade e crise do emprego no Brasil (Informality and the employment crisis in Brazil). Humanid. Inovação 2019, 6, 92–102. [Google Scholar]
- Roccaro, P.; Falciglia, P.P.; Vagliasindi, F.G.A. Effectiveness of water saving devices and educational programs in urban buildings. Water Sci. Technol. 2011, 63, 1357–1365. [Google Scholar] [CrossRef]
- Ketter, E.; Avraham, E. The social revolution of place marketing: The growing power of users in social media campaigns. Place Brand. Public Dipl. 2012, 8, 285–294. [Google Scholar] [CrossRef]
- Takagi, K.; Otaki, M.; Otaki, Y.; Chaminda, T. Availability and public acceptability of residential rainwater use in Sri Lanka. J. Clean. Prod. 2019, 234, 467–476. [Google Scholar] [CrossRef]
- De Andrade, A.E.F.; Anthayde, G.B., Jr.; Carneiro, M.D.A.; Ferraz, E.K.V. Estudo da viabilidade econômica para sistema de aproveitamento de águas de chuva na sede da companhia brasileira de trens urbanos em João Pessoa/PB (Economical viability study of a rainwater harvesting system to the João Pessoa company of urban trains). In Proceedings of the 2nd National Symposium on Urban Management and Engineering (SINGEURB 2019), São Paulo, Brazil, 27–29 November 2019; Blucher: São Paulo, Brazil; pp. 560–568. [Google Scholar] [CrossRef]
- Santana, T.C.; Guiselini, C.; Cavalcanti, S.D.L.; da Silva, M.V.; Vigoderis, R.B.; Júnior, J.A.S.; Moraes, A.S.; Jardim, A.M.D.R.F. Quality of rainwater drained by a green roof in the metropolitan region of Recife, Brazil. J. Water Process Eng. 2022, 49, 102953. [Google Scholar] [CrossRef]
- Intergovernmental Panel on Climate Change (IPCC). Climate Change 2021: The Physical Science Basis; Cambridge University Press: Cambridge, UK; New York, NY, USA, 2021; 2391p. [Google Scholar]
- Goldemberg, J.; Lucon, O. Energia, Meio Ambiente & Desenvolvimento, 2nd ed.; Editora da Universidade de São Paulo: São Paulo, Brazil, 2003. [Google Scholar]
- Ministério da Ciência, Tecnologia, Inovação e Comunicação. Fatores de Emissão de CO2 para Utilizações que Necessitam do Fator Médio de Emissão do Sistema Interligado Nacional do Brasil; Ministry of Science, Technology, Innovation and Communication: Brasilia, Brazil, 2021. [Google Scholar]
- World Resources Institute and World Business Council for Sustainable Development. Product Lifecycle Reporting and Accounting Standard; WRI & WRBSD: Washington, DC, USA, 2011. [Google Scholar]
- ISO 14040 (E); Environmental Management: Life Cycle Assesment—Principles and Frameworks. ISO: Geneva, Switzerland, 2006.
- ISO 14044 (E); Environmental Management: Life Cycle Assesment—Requirements and Guidelines. ISO: Geneva, Switzerland, 2006.
- Ali, M.; Munala, G.; Muhoro, T.; Shikuku, J.; Nyakundi, V.; Gremley, A. Water Usage Patterns and Water Saving Devices in Households: A Case of Eastleigh, Nairobi. J. Water Resour. Prot. 2020, 12, 303. [Google Scholar] [CrossRef]
- Ferraz, E.K.V.; de Almeida Carneiro, M.; Anthayde, G.B., Jr.; De Andrade, A.E.F. Análise de um programa de consumo sustentável na redução do consumo de água e energia na empresa de trens urbanos de João Pessoa (Analysis of a sustainable consumption program in the reduction of water and energy consumption in the company of urban trains of João Pessoa). In Proceedings of the 2nd National Symposium on Urban Management and Engineering (SINGEURB 2019), São Paulo, Brazil, 27–29 November 2019; pp. 586–593. [Google Scholar] [CrossRef]
- Dean, A.J.; Kneebone, S.; Tull, F.; Lauren, N.; Smith, L.D. ‘Stickiness’ of water-saving behaviours: What factors influence whether behaviours are maintained or given up? Resour. Conserv. Recycl. 2021, 169, 105531. [Google Scholar] [CrossRef]


Publisher’s Note: MDPI stays neutral with regard to jurisdictional claims in published maps and institutional affiliations. |
© 2022 by the authors. Licensee MDPI, Basel, Switzerland. This article is an open access article distributed under the terms and conditions of the Creative Commons Attribution (CC BY) license (https://creativecommons.org/licenses/by/4.0/).