Abstract
Limited access to electricity and endemic power shortages are huge problems in West African countries, as the lack of sufficient power impedes the socio-economic development in the region. Improving access to and reliability of electricity in West Africa will require close cooperation among neighboring countries, and this was one of the aims for the creation of the West African power pool (WAPP). In this study, a sustainable and economically viable pathway to achieve 100% electricity access and 48% renewable energy sources share in the region by the year 2030 set by WAPP was presented by considering environmental, geographical, technical and economic factors. The technologies of both renewable and non-renewable sources are considered in the model development. Simulation analysis was carried out on individual countries within the region and also as a unified synchronous electricity grid network. The most feasible results were discussed in terms of the initial investment cost, total annual cost, electricity production capacities, carbon emissions and renewable energy sources shared using EnergyPLAN computer software. The integration of natural gas (42,000 MW) with the three RES technologies with the following capacities, wind (13,000 MW), PV (13,000 MW) and hydro (29,000 MW), was shown to be the most feasible, suitable and reliable case scenario for meeting the lofty set target as a unified synchronous grid. This will reduce carbon emissions by almost 50%, from 150 to 77.8 Mt per year, and incur a total investment cost and a total annual cost of USD 250.37 billion and USD 14.71 billion, respectively.
1. Introduction
Climate change has been one of humanity’s greatest challenges. According to the newest study from the Intergovernmental Panel on Climate Change, the global temperature rise caused by humans already topped 1 °C in 2017 when compared to pre-industrial levels [1]. The awareness of climate change in the global energy space has set the trend toward creating policies that increase efficient and sustainable power production. However, despite the growing attention to carbon-free policies, the power sector continues to have a huge contribution to global carbon dioxide emissions. The United States Environmental Protection Agency (EPA) states that the power sector contributes 25% to CO2 emissions [2]. The highest emitter of CO2, sulfur dioxide and other pollutants is coal power plants, and this begs for a cleaner alternative for electricity generation globally. However, coal-fired power plants are often economically competitive and represent a significant fraction of baseload generation, raising concerns regarding their replacement by non-dispatchable renewable sources [3]. Governments across the world, including international organizations, have set out to curb the threat caused by fossil fuel production, and Africa has not been an exception.
The discourse of the energy situation in Africa is complex, considering the diverse, unique factors that play significant roles in individual regions and countries. Situations in the continent such as population growth [4], economic growth [5], access to energy [6], energy poverty [7], energy consumption [8], political instability [9] and vast natural resources [10] are key parameters that have been investigated in different studies concerning the analysis of energy scenarios and development of energy strategies and solutions. Africa is the second most populous continent after Asia and is currently characterized by a high rate of population growth which started in the second half of the 20th century. According to an analysis by United Nations [11], the population grew from 230 to 810 million, for which Eastern, Middle and Western African regions increased by 2.5%. Projection of the population pattern in Africa estimates that the African population will be 1.47 billion and 2.39 billion in 2025 and 2050, respectively [11]. This population trend significantly impacts the energy demand in the region, which is forecasted to exponentially increase in the future [12]. Furthermore, in the last decade, there has been an increasing development in the economies in Africa, attributed to the high revenues from natural resources and growth in manufacturing sectors [13]. A study by Wang and Dong [14] in 2019, stated that Africa averages a 2.2% GDP growth rate between 2015 and 2017. However, disparities exist within the region in terms of economic growth, as few countries such as South Africa, Nigeria, Algeria, Morocco, Tunisia and Angola contribute a large percentage to overall Africa`s GDP [15]. The relationship between economic growth and energy consumption pioneered by Kraft and Kraft [16], is fundamental to the analysis of the energy situation in the African region [17]. The clear contrast between urban and rural areas is another aspect of Africa that influences the energy access dynamic. The majority of Africa’s population lives in rural areas, and the distribution of urban and rural populations within sub-regions vary according to the economic structure. While it is incorrect to argue that Africa is rapidly urbanizing, as most African countries’ urban growth rates follow national demographic patterns [18], it is undeniably true that underdevelopment and poverty are mostly rural phenomena: over 70% of the poor live in rural areas [19].
The frame of the energy situation in Africa is affected by the above-discussed factors such as population, economic growth, demographic pattern, etc. The total primary energy supply (TPES) in Africa shows an increasing pattern, for which North, West and Southern Africa contribute equal measures [20]. The TPES values represent the population and economic development of the African sub-region. In terms of population, Northern Africa has a similar total to that of Eastern and Western Africa, but the economy there is much more developed (i.e., a higher GDP and supply of energy per capita), so the TPES is higher. South Africa, which accounted for about 20% of Africa’s total TPES, is home to Africa’s largest and most developed economy, and as a result, it has the continent’s highest TPES per caliber population [20].
The focus on West Africa in the study is predicated upon the strategic plan of the West African Power Pool (WAPP), which was established in 2000 to promote integration and support the implementation of energy projects among West African countries. This was an important step as most West African countries have target policies to improve the share of renewable energy in their power grid (a summary of these targets is shown in Table 1). The West African Power Pool (WAPP) was established to harness available energy resources in the region to benefit all of its member countries with the purpose of delivering sustainable and competitive electricity. WAPP set a lofty target of interconnecting all member countries’ power systems into a unified regional electricity market by 2025 through the development of generating and transmission infrastructure [21]. Moreover, the Economic Community of West African States (ECOWAS) has set a goal of achieving 100% electrification in all of its member countries as well as improving the share of renewable energy in the electricity mix to 48% by the year 2030 [22,23]. Due to the above-stated aspirations, this research was carried out to meet the target. In this study, the juxtaposition of energy poverty and the renewable energy potential in West African countries is made. Therefore, the generation of electricity from the abundant RE potential is considered from the generation side. The novelty of this study hinged on the proposal of a synchronous central grid system as a possible solution for the energy poverty problem in West Africa. The synchronous grid of continental Europe, which covers 24 European countries, was utilized as a template for the applicability of the proposed model in this study. This study aimed to determine the RE electricity generation capacities, economic costs and supply strategies required to balance the projected future electricity demand in West Africa. Considering that the different countries in the West African region have differing energy conditions in terms of renewable energy potential, land size and fossil fuel reserves, it creates a scenario for which a technical analysis of an effective synchronous energy grid is to be made. This paper, through the EnergyPLAN modeling, describes the best approach for which the WAPP power pool project should be developed. Moreover, no study in the literature considers the decarbonization plan of the West African power pool organization to ascertain the technicalities behind the proposed renewable electricity target. This study studied the potential of each West African nation and its contribution to the interconnected electricity grid. In addition, this study optimized different hybrid RE in each West African nation, which is lacking in the literature.

Table 1.
Target policies set by West African countries for renewable energy [24,25].
To the best of the authors’ knowledge, this study is the first to consider providing a feasible pathway to achieve these lofty targets set by ECOWAS as a region, based on hourly time steps for a whole year. The countries considered in this paper are the fourteen (14) ECOWAS members, except for Cape Verde, which is an island and also not a member of WAPP. The countries include Benin Republic, Burkina Faso, Cote d’Ivoire, Gambia, Ghana, Guinea, Guinea-Bissau, Liberia, Mali, Niger, Nigeria, Senegal, Sierra Leone and Togo, as shown in Figure 1. This study contributes first to the literature on increasing the spatial resolution of interconnected electricity network models by considering 100% electricity access and 48% renewable energy integration. This study also contributes to the practical creation of the West African synchronous grid as it considers the land mass for the installation of renewable energy technologies in the choice of countries for the grid networks.
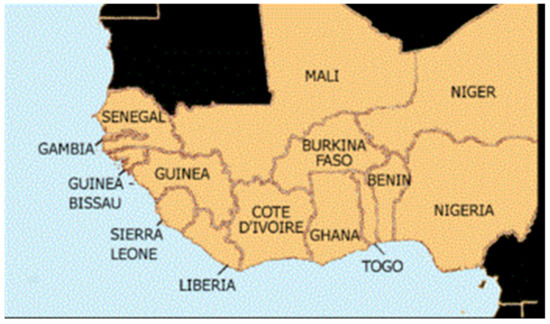
Figure 1.
Member countries of West Africa Power Pool.
1.1. Literature Review
The energy sector in Africa is critical to the continent’s economic growth and development. In the discourse of energy growth in Africa, the growing importance of climate change concerns and the necessity to devise solutions to minimize greenhouse gas emissions while attaining continued economic expansion has taken center stage [26]. Africa suffers challenges in electricity access, reliability and sustainability despite the improvements in the northern part of Africa and South Africa. The Sub-Saharan region suffers from energy poverty even though blessed with a high level of both renewable and non-renewable sources [27]. Non-renewable energy sources, majorly natural gas, oil and coal, are used to generate about 80% of electricity in Africa. The major renewable energy source in Africa is hydropower, with an installed capacity of over 38 GW, which accounts for about 70% of the renewable share and 16% of the total electricity share [28]. Figure 2 and Figure 3 show the total energy supply and electricity source, respectively, measured in Tera-Joule (Tj) and terawatt-hour (Twh). The figures give a vivid picture of the enormous fossil fuel generation and insufficient electricity access in Africa. In 2019, the electricity generated in Africa was 856.1 TWh, which is approximately 73% of the Europe 28 Value. As compared to Southern Africa, North Africa have a lower consumption per capita, for which the electricity access in the North African region is 97.6% [29], while that of South Africa is 51.6% as of 2019 [30]. Middle and Western Africa have comparable electricity consumption per capita, and the difference in total electricity generated is due to population differences, whereas Eastern Africa’s slightly higher consumption results in higher electricity generation than Western Africa, despite its smaller population. The electricity access in West Africa is approximately 43%, while that of Eastern Africa is 36%. Regarding electricity generation in African regions, it is also noteworthy that the energy mix in individual regions is dependent on indigenous energy resources, as there is limited inter-state trade of energy resources. North Africa is heavily reliant on oil and natural gas, accounting for 65.4 and 22%, respectively, while in South Africa, coal is the predominant energy resource which accounts for about 94% of electricity generation. Western, Eastern and Central regions of Africa are reliant on hydropower and natural gas (especially due to the extensive exploitation in Nigeria) [31].
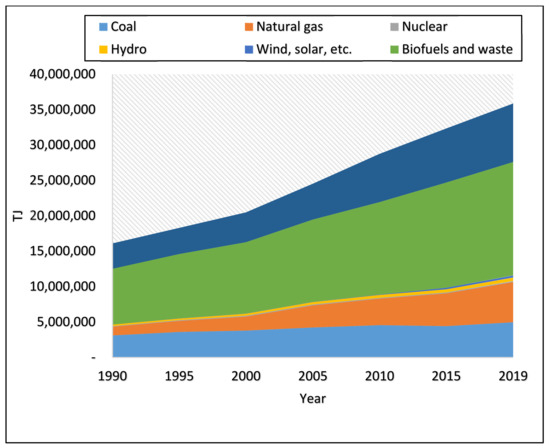
Figure 2.
Total energy supply in Africa between 1990 and 2019. Source: IEA [32].
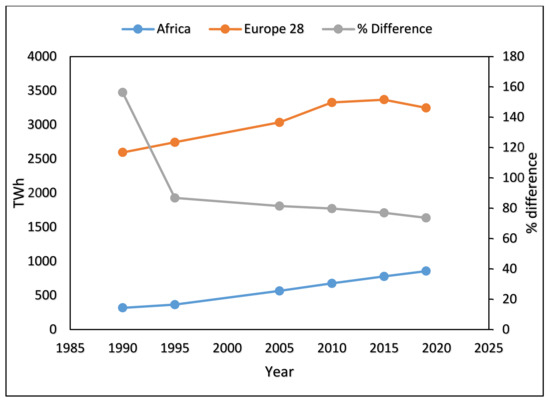
Figure 3.
Global Electricity Generation Profile (1985–2019). Source: IEA [32].
There is a simultaneous practice of harvesting both traditional and modern energy systems for energy consumption in sub-Saharan Africa due to the hybridization of traditional and modern energy systems across the region. The need to thereby expand modern services to the poor in Africa creates a scenario that requires well-thought-out solutions [33]. On the one hand, there is the traditional energy system, in which biomass fuels and inefficient technologies dominate the household sector’s energy needs, while mechanical energy for agriculture and transportation is frequently produced through the use of human and animal labor [34]. On the other end of the energy spectrum is a modern energy system that utilizes electricity, modern fuels, and modern appliances. Although there is an urban/rural divide in terms of energy distribution infrastructure and practices, the line between the two is not precisely defined. For example, even in relatively high-income houses in many African cities, the simultaneous use of biomass fuels, kerosene or LPG is frequent [35]. Given the fragmented character of the energy system in much of Africa, which does not lend itself to the formation of an integrated energy strategy, the dual nature of the energy picture brings into light the huge issues that policymakers in Africa face [33]. Another issue regarding energy production in Africa is that despite the availability of 141 GW of Renewable energy, it is grossly unexploited, with only about 28 GW of renewable energy power generation [36].
When considering this situation, an investigation into resolving electricity challenges in Africa should be analyzed based on the different regions. The Northern African region has an alliance with the Middle Eastern region (known as the Middle East and North African region, MENA), for which there have been economic and energy trades as a means to solve the energy crisis in the region [37].
1.2. Related Works to Solve the Electricity Problem in West African Countries
In a study by Sterl et al. [24], at the hourly resolution, the ERA5 reanalysis was used to examine the synergy of solar photovoltaic (PV) and wind power potential in the West Africa region. The stability coefficient Cstab is a novel metric that is being developed to assess the synergies between solar PV and wind power for producing a balanced power output while limiting storage needs. By using this metric, it was demonstrated that hybrid solar/wind power had the potential to be exploited in a larger area of West Africa, covering more important population centers and being closer to existing grid structures than average maps of solar and wind resource availability. The findings of this study showed why the multi-scale temporal synergy of power mixtures should be taken into account in RE system planning from the beginning [24]. A study by [38] was carried out to solve Nigeria’s power deficit by 2030 using EnergyPLAN computer software. Their study forecasted 200 TWh to be the electricity demand, and their result showed that 36,000 MW natural gas power plant capacity was required if the total demand would be met by the use of single power technology. Their result also suggested that the most sustainable and viable solution was to use a combination of fossil fuel and renewable energy, which was found to be natural gas, photovoltaic and wind with a capacity of 32,500 MW, 12,000 MW and 7000 MW, respectively [38]. In the case of Burkina Faso, research by [39] was carried out to determine the feasibility of expanding the existing network to provide 100% access. The authors stated that the inclusion of renewable energy sources is necessary to meet the target with a total cost of 1.7 billion Euros [39]. Papua New Guinea signed a partnership deal with New Zealand, Australia, Japan and the USA in 2018, which is aimed at providing electricity to 70% of the country’s population by the year 2030, estimated to cost about 1.7 billion US dollars [40]. A study by [41] on the Sierra Leone power system showed that to achieve 100% electrification in the future (2065), power generation will majorly be based on hydropower which is to generate 60%, solar PV 28% and balance to be generated from other sources [41].
The reviewed literature shows that several studies analyzed the individual countries in West Africa and, by considering their indigenous energy resource, proposed and simulated appropriate scenarios for solving their energy situations. However, considering that the concentration of certain renewable energy is more prevalent in some countries, developing an interconnected electricity grid system can be a feasible solution to the energy crisis in the West African region. Furthermore, upon the ECOWAS target, which was initiated by the WAPP project, achieving 100% electricity access in all member countries by the year 2030 would require that a strategic grid system in the region be developed. It is upon this thesis that this study was carried out. This research focused on forecasting hourly electricity demand, which is imperative for generation capacity planners in optimizing investment and technical options for 14 West African countries. The model was developed taking into account the available daylight hours, daily conditions, electricity rates, household appliances and type of days. The result showed that electricity demand in 2030 will be five times the demand in 2016 [42]. Furthermore, a model to study the complementarities between hydro, solar and wind at these sizes was analyzed. This study shows how effective hydropower plant management in West Africa may provide significant grid integration of solar and wind power while controlling natural gas usage and preventing environmentally detrimental hydropower overexploitation. This study demonstrates that pooling regional resources and planning transmission grid expansion based on spatiotemporal hydro–solar–wind synergies are critical for fully using West Africa’s renewable potential. Renewable electricity in the regional power pool, with solar and wind contributing roughly half of the total, might be at least 10% cheaper than natural gas electricity by 2030 [43].
1.3. Electricity Power Situation and Potential in West Africa
The West Africa Regional Energy Trade Development Policy Financing Program (West Africa Energy DPF) aims to cut power costs for consumers, increase company competitiveness, and improve supply resilience and dependability by removing obstacles to electricity trade within the region. Only about 43% of the population in West Africa have access to electricity, and they pay about the highest electricity cost in the world—more than twice as much as East African consumers. Furthermore, electrical services are unpredictable due to operational issues, with an average of 44 h of outages per month [44]. The 2018 analysis predicts that renewable electricity capacity in West Africa might reach up to 65% of peak load by 2030, based on an upgraded application of IRENA’s System Planning Test model for West Africa (SPLAT-W) [45]. Table 2 and Figure 4 display the individual countries with their electricity access percentage as well as the types of resources used for electricity generation. It can be seen that only Cote d’Ivoire, Ghana, Nigeria and Senegal have more than 50% access to electricity, with Ghana being the highest, recording 85%. The remaining ten countries have below 50%, with Liberia having the least, with 12% access. The major source of power production is fossil fuels (oil and natural gas). The only renewable energy source with a reasonable share is hydro, with about 26% [46].
Table 2.
Electricity access and power generation sources.
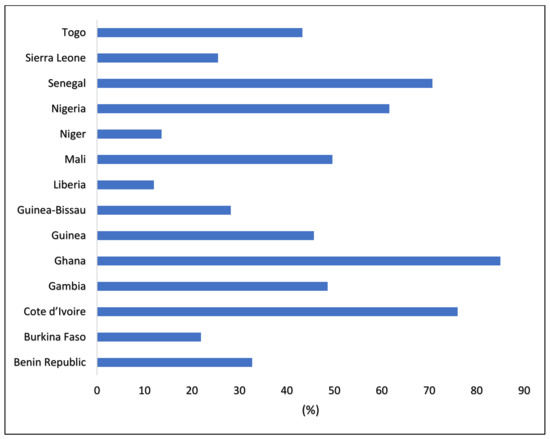
Figure 4.
Electricity access in West Africa by country.
The western region of Africa has a high level of renewable energy sources, majorly solar, wind and hydro. In 2013, IRENA conducted its first assessment of the prospects for renewable energy development in ECOWAS countries on the continent. The 2018 analysis predicts that renewable energy capacity in Western Africa region might reach levels of 65% of the peak load by 2030, based on an upgraded application of IRENA’s System Planning Test model for West Africa (SPLAT-W).
West Africa is regarded as the home to the “richest solar resource in the world”, but unfortunately, it has only installed 5 GW of solar PV, which is less than 1% of the world’s total [48]. In 2018, an IRENA report revealed that a study by LUT University shows that West Africa can deploy about 20 GW of solar by the year 2030. Within the region, Nigeria has the highest potential for solar PV capacity of 492 GW, which is followed by Niger and Mali, with a potential of 443 GW and 298 GW, respectively [49].
According to a report [50] published by the International Finance Corporation, Africa’s technical on-shore wind resource potential is over 59,000 GW, which is enough to power the continent 250 times. A project known as West Africa’s “first-ever utility-scale wind farm” with a capacity of 158.7 MW is already transmitting power into Senegal’s national power grid [48]. A study by Sawadogo et al. [51] shows that wind power density over the West African region is about 73.36 W/m2.
Hydropower generates about 26% of West Africa’s electricity, with the rest coming largely from oil and natural gas; as a result, practically all of its RE is currently accounted for. Hydropower dominates the generation mix in a few countries [43]. In a study conducted by Poyry et al. [52], Nigeria was found to be the country with the highest theoretical hydropower potential in West Africa. Guinea, Sierra Leone and Liberia also have a good hydropower potential for small projects [52]. Nigeria has the highest installed capacity in the region with 2.11 GW, followed by Ghana with 1.58 GW, then Cote d’Ivoire and Guinea with 879 MW and 706 MW, respectively [28].
It is worth stating that biomass was not used in the modeling analysis, despite being a major fuel in rural communities in West Africa. This is due to the consideration of the nexus assessment of land, food and water in the attainment of sustainable security in West Africa, as one resource sector should not compromise an adjacent resource sector [53]. Studies [54,55] have shown that there is a conflict between food–land use and water (food–land–water nexus) in growing biomass in Africa. A study by Kiplagat et al. [8] mentioned that there the reliance on wood biomass in the Kenyan population had led to an imbalance in supply and demand, which has placed huge pressure on vegetation stock and further accelerated the process of land degradation [56]. Moreover, in a study by Louise et al. [57], it was stated that the water required for agricultural and bioenergy was beyond the capacity of the country.
Biomass systems that use dedicated feedstock generate the largest footprints; thus, land-related aspects need particularly critical evaluation when taking into account the use of bioenergy in the future [58]. It is not only the “occupied area” that distinguishes land use but also the type of impact (e.g., topsoil removal versus soil sealing), the type of land (e.g., pristine natural areas, brownfields, degraded land, or forests) and the duration and reversibility of “occupation.” [59]. Expanding bioenergy and biofuels at a rapid pace, without proper planning and implementation, could increase emissions from land use change and jeopardize food security [60]. Bioenergy production on a large scale and the associated increased demand for irrigation may exacerbate existing pressures on water resources [61]. Furthermore, the increasing population growth rate in West Africa poses tension to land–water–food in the region as it relates to the utilization of biomass for energy production [62]. The long-term plan toward increasing the production of bioenergy could exert the greatest downward pressure on food production in West Africa.
2. Materials and Methods
In this study, both renewable and non-renewable energy source technologies were considered to meet total demand. For non-renewable, natural gas power generation technology was considered, and for renewable energy technologies, river hydro, solar PV and on-shore wind power systems were considered due to the potential high-level availability in the region as well as their technology maturity in application globally. Moreover, due to the intermittency of these renewable sources, pumped hydro storage is the only type of storage facility considered in this study.
The natural gas-fired power plant was the only non-renewable technology considered in this research; it is being operated in many of the West African countries for electricity production, as seen in Table 2, one of the reasons being that it is found in abundance within Africa, including Nigeria and Guinea from the western part [62]. Hydropower is the major renewable source currently in use by many countries, also as noted in Table 2. Hydropower is more expensive than the other RES technology considered in this research in terms of investment cost, but it is the most reliable and with the highest capacity factor among them. Solar PV technology is the cheapest in terms of both investment cost and operation and maintenance, as seen in Table 3. Wind energy technology is considered due to its relatively high potential in some of the countries in the region. It is also relatively cheap compared to hydropower. Because it is the most sustainable and environmentally friendly storage method, the pumped hydro storage system is the sole one used in the study.
Table 3.
Economic parameters for power production [63].
2.1. EnergyPLAN Simulator
EnergyPLAN is a commercial software/program developed at Aalborg University that incorporates the economic, technical and environmental aspects of energy systems to optimize different energy technology mix/topologies, as shown in Figure 5. The program includes a platform for integrating a case study’s electricity, heat and transportation sectors. It is useful for describing future energy systems because it allows for comparative analysis of various energy systems and hourly simulation of regional and national energy systems. The EnergyPLAN model assesses and calculates the best energy system (technology) mix for a given location using several criteria, which are [25]:
- Carbon dioxide emissions;
- Primary energy supply is the total fuel usage and fuel equivalents for non-fuel energy sources;
- Excess power generation is also referred to as exportable excess electricity;
- Fossil fuel and share renewable energy share;
- Production mix across primary energy sources;
- Socio-economic costs and business economic costs, which include the total annual costs, fuel costs, and operation and maintenance costs.

Figure 5.
Layout of EnergyPLAN simulator.
Figure 5.
Layout of EnergyPLAN simulator.

The EnergyPLAN model’s goal is to highlight the best technology mix for configuring the energy system. This is accomplished by evaluating pre-defined energy system configurations. EnergyPLAN software was utilized since it considers all of the technical specifics of each of the technologies investigated in this study. Each of the technologies considered in this study was first simulated to meet the total demand; afterward, two or more technologies were combined for electricity generation. It is noteworthy that EnergyPLAN only permits the use of pump hydro-storage with RE power plants. The model used in estimating the required generation capacities and the procedure for optimization to abate the energy poverty in the selected 14 West African countries is summarized in Figure 6, with priority given to RES, of which the main aim is to integrate as much share as possible. After each simulation, based on the defined supply, there are four possible outcomes:
- No CEEP and PPI warning: this indicates that the defined supply is sufficient for the set demand;
- CEEP and PPI warning: this indicates that the power produced is not sufficient to meet the demand. However, there is excess production by some of the RES at some point;
- CEEP warning: indicates there’s excess production by some of the RES at some point; therefore, RES supply capacity should be reduced;
- PPI warning: this indicates that the power produced is not sufficient to meet the hourly demand. Supply is increased with priority given to RES.
The design of the model is constructed to avoid power production import (PPI). Moreover, CEEP is reduced in the simulation process. Furthermore, some assumptions were made in the technical analysis of the model development and analysis. It is assumed that there is no break in the power networks; hence, the operation of the power plants is all year round. Moreover, the constraints of insufficient distribution and transmission line for electricity generation is neglected.

Figure 6.
Summary of the research model and optimization flowchart.
Figure 6.
Summary of the research model and optimization flowchart.

2.2. Research Model
In this study, analysis was carried out on all 14 countries individually to determine the feasibility of providing 100% access to electricity as well as the optimum share of renewable energy sources that can be integrated into the grid to meet the minimum target of 48% set for 2030. Moreover, a regional synchronous power grid analysis was considered to operate in the same manner as European Union Synchronous grid, which connects 24 European countries and serves 400 million customers.
Regarding economic viability and feasibility, the EnergyPLAN cost database was used considering the year 2030 for simulation, as seen in Table 3 [63]. The economic parameters considered are initial investment cost, plant lifetime, operation and maintenance and fuel cost. The current price of CO2 is slated between USD 57.16 and 62.88 per metric ton, and it is projected to increase to USD 97.18 by 2030, which is the value used in this study [64]. It is also noteworthy that all the figures used for simulation are forecasted assumed expenses for power plants for the year 2030. The countries within the region have similar weather conditions, which result in almost the same capacity factor. The capacity factors used in this study are shown in Table 4.
Table 4.
Capacity factors (%).
In this study, the model was built such that critical excess electricity production and power production imports are avoided. The input parameters include the renewable energy profile of all the countries [63], electricity demand profile, 2030 estimated electricity demand, interest rate, cost of emission, fuel cost, technology life span, technology cost and operation and maintenance cost, as provided by EnergyPLAN database [63].
2.3. Electricity Demand
The annual electricity demand for all WAPP countries was forecasted in a study conducted by Omotola and Catalina [41] using multiple regression analysis, as shown in Table 5. In their study, the estimation of the hourly electricity demand was performed between 2016 and 2030 for West African countries. Their study addressed both residential and non-residential sectors in terms of different factors that affect electricity demand. The factors analyzed in the forecast analysis were occupancy patterns, weather conditions, daylight hours, and types of settlement (residential and non-residential). In terms of the residential sectors, the variables considered for the forecast were electricity access and appliance ownership, while in terms of the non-residential sector, the variables considered were electricity demand, gross domestic product (GDP), and population growth. Their result, as shown in Table 5, shows that Guinea Bissau had the lowest forecasted electricity demand for 2030, while Nigeria has the highest. This projection is attributed to the differing population size of both countries.
Table 5.
Annual Electricity demand forecasted for 2030.
Furthermore, in the study, the forecasted annual electricity demand estimated in the study by [41] increased by 15%. The reason for this is to account for any unforeseen reasons that may occur to increase the demand for practicability. The total estimated annual electricity demand for the region summed up to 331.5 TWh, with Nigeria constituting 60% of the total demand.
2.4. Renewable Technology Modelling
In simulating the renewable energy production for the West African countries considered in this study, the renewable energy potential was considered. However, considering that there are insufficient data in West Africa, the ENEGYPLAN software gives the solution of inputting the capacity factor of each renewable energy source. This helps to adjust the production of the RE plants. The capacity factor of each of the renewable energy sources (PV and wind power) was retrieved from the literature, as shown in Table 4.
2.4.1. Solar Photovoltaic
Benin Republic has solar potential ranging from 3.9 to 6.2 kWh/m2, as recorded by REEEP, 2012 [69,70]. Burkina Faso receives an average of 3000 h of sunshine in a year with an abundant mean annual solar radiation of 19.8 MJ/m2 [71]. There is average solar radiation that ranges between 4 and 6 kWh/m2 per day in Cote d’Ivoire [72]. The Gambia has a very high solar potential with a daily minimum power production capacity of 4 kWh/m2 [73]. In Ghana, there is a high potential for solar energy, which is estimated at 35 EJ [74]. There is average sunshine of 2700 h per year in Guinea, and it enjoys mean annual insolation of almost 5 kWh/m2 per day, making it a suitable area for grid-connected solar power production [75]. Liberia has a very high and consistent solar energy potential of up to 1712 kWh/m2 per year [76]. In Nigeria, solar energy capacity ranges from 3.5 to 7 kW/m2 per day [69]. There is approximately 1460 kWh/m2 of solar radiation annually in Sierra Leone, according to the ministry of energy and water resources [77]. As a region, West Africa has an enormous solar potential average ranging between 4 and 6.5 kW/m2 [78]. In 2018, an IRENA report revealed that a study by LUT University shows that West Africa can deploy about 20 GW of solar by the year 2030. Within the region, Nigeria has the highest potential for solar PV capacity of 492 GW, which is followed by Niger and Mali, with a potential of 443 GW and 298 GW, respectively [48].
2.4.2. Wind
The West African region has a reasonable wind energy potential, which is the strongest along the coastal area as well as the northern part of the region, which are Mali, Niger and Senegal [79]. A study by Sawadogo et al. [50] shows that wind power density over the West African region is about 73.36 W/m2. In this study, all the simulations carried out were with real hourly distribution wind data for a year of each of the countries, with a speed of up to 10 m/s at the height of 80 m at some times of the year [67].
2.4.3. Hydropower
West Africa has a very high potential for hydropower generation, and currently, most of the countries in the region generate electricity through it, as shown in Table 2. Benin Republic has an estimated hydropower potential of 760 MW. Côte d’Ivoire has the potential to generate about 46 TWh/year [80]. Ghana has a potential capacity of 2480 MW [81]. Guinea has an estimated potential of 6100 MW [82]. Guinea-Bissau’s available hydropower potential is estimated to be 184 MW [83]. Hydropower potential in Liberia is estimated to be 4478 MW [84]. There is just over 1000 MW of hydropower potential in Mali [85]. Niger has an estimated hydropower potential of over 400 MW [86]. Nigeria has a high exploitable hydropower potential estimated at 14,120 MW [87]. Senegal has a relatively low hydropower potential of 253 MW [88]. Hydropower potential in Sierra Leone is estimated to be 2000 MW [89], and Togo has an estimated potential of over 150 MW [90].
2.4.4. Mathematical Modelling
This section presents the modeling equations used for renewable energy technologies as well as makes an economic analysis. In regards to solar PV systems, the output power at an hour of a PV module is calculated using Equation (1):
where I(t) represents the hourly solar insolation (kW/m2), ηPV is the efficiency of the PV module and then A denotes the PV module area (m2). The EnergyPLAN software also takes into considering loses associated with PV systems.
The wind farms are modeled taking into consideration all the technicalities of a functional wind power plant; therefore, as the wind speed rises, the power produced by the generators proportionally also increases; so far, the speed is above the cut-in velocity (Vci). Moreover, the power generation remains constant at the rated power (Pr) once the wind speed surpasses the rated velocity (Vr); thus, once the cut-out velocity (Vco) is surpassed, the generators stop operating in a bid to protect it from damage, resulting to zero output. Mathematically, the power output of a wind turbine (ρWT) at an hour t is modeled using Equation (2):
In the case of hydropower, the power out is calculated with Equation (3) for dam hydropower and Equation (4) for run-off river hydropower:
where:
- P is the power output, measured in Watts;
- η is the efficiency of the turbine;
- ρ is the density of water;
- g is the acceleration of gravity;
- H is the usable fall height, expressed in units of lengthl;
- Q is the discharge (also called the flow rate), calculated as Q = A ∗ v;
- A is the cross-sectional area of the channel;
- v is the flow velocity.
In this study, the economic analysis focuses on the total investment and running costs. The total investment (Itech) of each production unit is calculated as follows:
where Punit−tech is the per-unit price, and Ctech is the total capacity of the technology.
3. Results and Discussions
In this section, the result of the simulations is presented and discussed in detail. Since none of the West African countries has total access to electricity, the results are in three stages. The first stage is for 100% access to meet the total demand for natural gas-fired power plants. The second is for the maximum RES that can be integrated into the grid without producing CEEP, concerning RES potential available in each country. The third stage is only taken into account if stage two does not meet up with the target of 48% minimum RES share. In this stage, a certain capacity of storage was incorporated to meet the target. During simulation and obtaining results, priority was given to hydropower due to less requirement of landmass and better technology reliability followed by technologies with less investment cost while considering power factor and minimizing or eliminating the use of storage system to achieve the target without CEEP. Where possible, all technologies considered in this study were integrated to improve power quality and sustainability. It is noteworthy that the results presented are not necessarily the cheapest scenario, but it is the best way found to meet the target.
3.1. Results for Individual Countries
Table 6 provides the summary of the simulation result for each West African country in terms of the combination of the technologies and in meeting the electricity demand for 2030. The scenario is the case of utilizing renewable energy in tandem with natural gas for each country. It is worth stating that in certain countries where specific RE sources are scarce, the model made the exclusion of such resources. Table 6 is a summary result of the simulations based on the standard case of integrating 48% renewable energy into the grid system of west African countries, based on avoidance of critical excess electricity production (CEEP). The plan of the WAPP is the integration of 48% renewable energy; however, it is seen that the economic and environmental implications on the West African countries differ. This is also tied to the amount of fossil fuel needed to augment the RE sources for electricity generation. The highest renewable energy penetration was noticed in Nigeria, Ghana and Burkina Faso. The least investment in the RE integration was measured in Guniea Bissau and Gambia for the same 48% RE integration scenario.
Table 6.
Result summary for individual countries.
Figure 7, Figure 8, Figure 9, Figure 10, Figure 11, Figure 12, Figure 13, Figure 14, Figure 15, Figure 16, Figure 17, Figure 18, Figure 19 and Figure 20 show the hourly production of the RE and forecasted demand. The production of fossil fuel is non-variable; hence, it is excluded from the graphs.
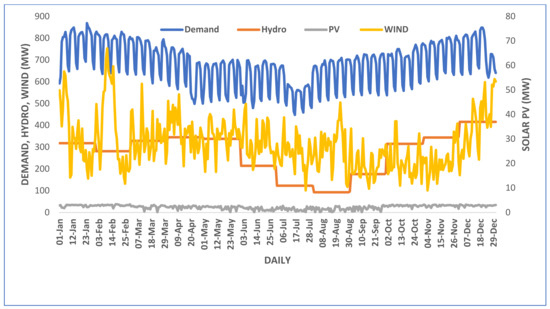
Figure 7.
Electricity demand and RE productions for Benin Republic.
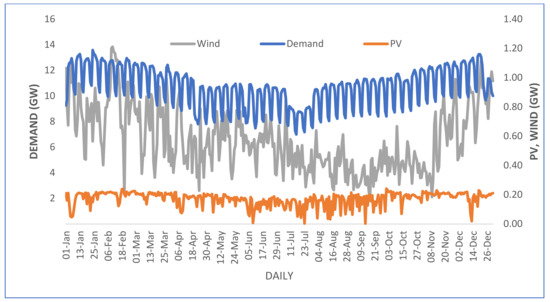
Figure 8.
Electricity demand and RE productions for Burkina Faso.
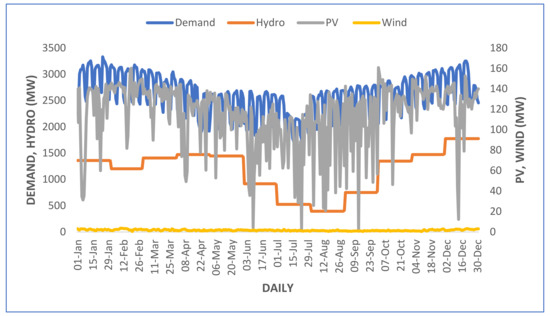
Figure 9.
Electricity demand and RE productions for Cote d’Ivoire.
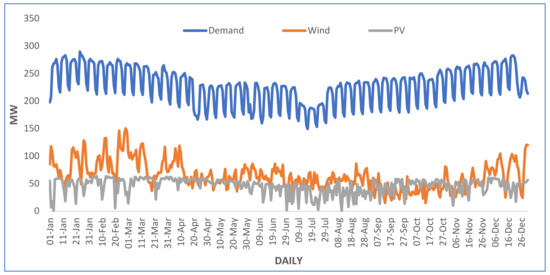
Figure 10.
Electricity demand and RE productions for Gambia.
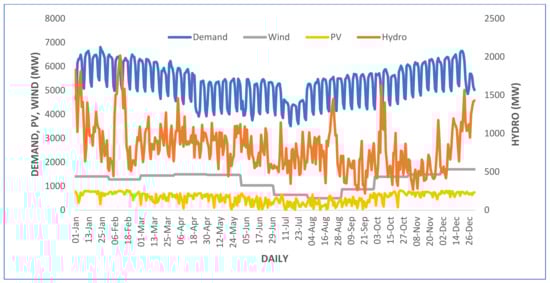
Figure 11.
Electricity demand and RE productions for Ghana.
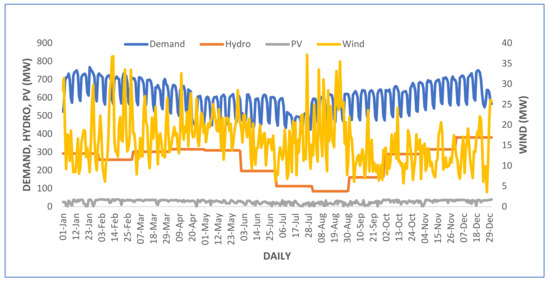
Figure 12.
Electricity demand and RE productions for Guinea.
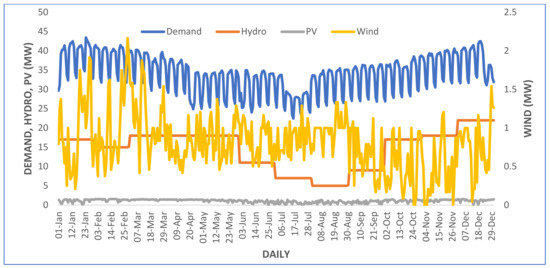
Figure 13.
Electricity demand and RE productions for Guinea-Bissau.
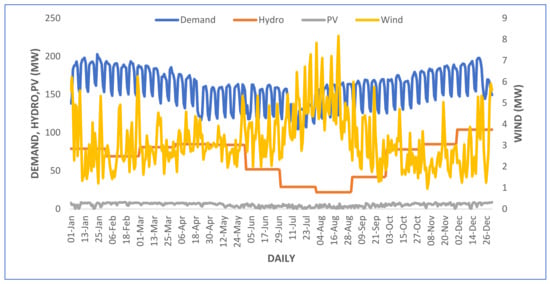
Figure 14.
Electricity demand and RE productions for Liberia.
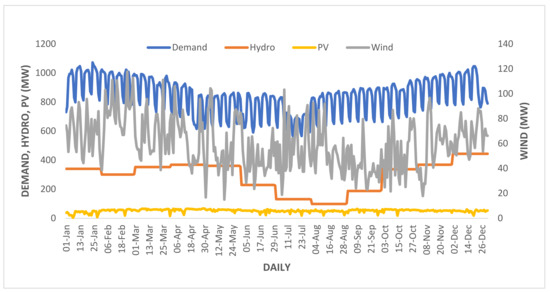
Figure 15.
Electricity demand and RE productions for Mali.
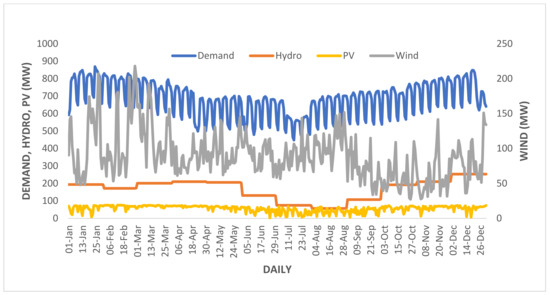
Figure 16.
Electricity demand and RE productions for Niger.
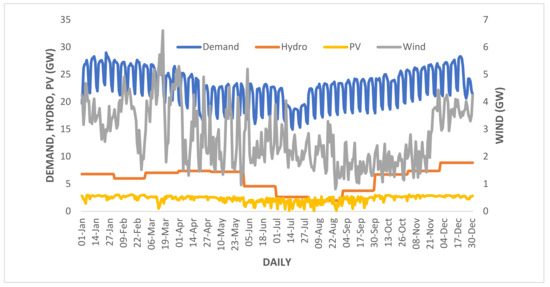
Figure 17.
Electricity demand and RE productions for Nigeria.
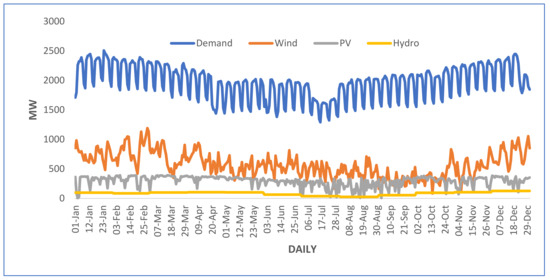
Figure 18.
Electricity demand and RE productions for Senegal.
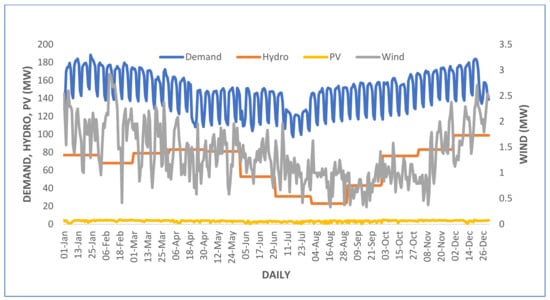
Figure 19.
Electricity demand and RE productions for Sierra Leone.
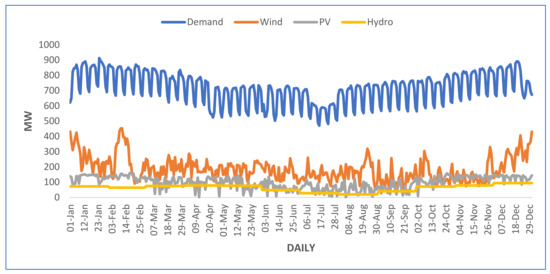
Figure 20.
Electricity demand and RE productions for Togo.
Benin Republic has an estimated hydropower potential of 760 MW. Based on the simulation result, to meet its demand of 6 TWh for the year 2030 with 100% electricity access, a natural gas-fired power plant with a capacity of 1055 MW is required, which produces CO2 emission of 2.722 Mt yearly. In order to meet the minimum 48% target, a hydro capacity of 655 MW, 155 MW capacity of PV and 100 MW of wind are required, as plotted in Figure 7, which will reduce emissions massively down to 1.418 Mt. The total annual electricity produced by hydro, wind and PV are 2.41 TWh, 0.25 TWh and 0.22 TWh, respectively. The total investment cost and the total annual cost are estimated to be USD 5.18 billion and USD 296 million, respectively.
Burkina Faso is said to have limited potential for hydropower due to irregularity and also unfavorable hydro-meteorological conditions [91]; therefore, it was not considered. A 1440 MW natural gas-fired power plant is required to meet the estimated demand of 8.2 TWh/year. This will produce an emission of 3.72 Mt. With the integration of wind and solar PV, only a maximum of 41% RES share could be achieved with CEEP. In order to meet the 48% minimum target, 1330 MW of natural gas, 900 MW of solar PV, 800 MW of wind and a minimum of 2 GW storage are required to be integrated to avoid CEEP. Concerning the synchronous grid system in West Africa, the consequences of CEEP are forced export (if adequate interconnection capacity does not exist). Without the integration of a storage facility, there will be CEEP. The total investment cost and total annual cost are estimated at USD 2.84 Billion and USD 220.65 million, respectively. CO2 emissions will drop from 3.72 Mt to 1.94 Mt per year. The electricity demand and RE productions are plotted in Figure 8.
The government is working to make the country a West African electrical hub with some of the best energy infrastructure in the region. The existing power system in Côte d’Ivoire is the third-largest in West Africa, with 76% access to electricity. Côte d’Ivoire has a total installed capacity of 2179 MW as of 2020, with around 60% of it generated by thermal power and the remaining 40% by hydroelectric dams with an installed capacity of 879 MW [92]. The country has the potential to generate about 46 TWh/year [80], which is twice the total demand of 23 TWh for 2030. In order to meet the demand for solely natural gas, an installed capacity of 4100 MW is required, which will produce 10.43 Mt of emission. In order to meet the target without CEEP, 2900 MW of natural gas, 2800 MW of hydro, 600 MW of PV and 5 MW of wind are required. The total investment cost and the total annual cost will amount to USD 21.25 billion and USD 1.19 billion, respectively. Moreover, CO2 emissions will drop from 10.43 to 5.29 Mt per year. The electricity demand and RE productions are plotted in Figure 9.
Gambia has no hydropower-generating potential [93]; therefore, it was not considered in this research. In order to meet the total forecasted demand of 2 TWh for 2030 with only natural gas, an installed capacity of 470 MW is required, which will produce 0.9 Mt of CO2 emission. Only 29% RES share can be achieved using PV and wind without CEEP. In order to meet the target of 48% RES share, 320 MW of natural gas, 240 MW of PV, 235 MW of wind and 1 GW of storage are required; the electricity demand and RE productions are plotted in Figure 10. Without the integration of a storage facility, there will be CEEP. This will reduce emissions from 0.9 to 0.47 Mt per year and incur a total investment cost and a total annual cost of USD 751 million and USD 57 million, respectively.
Ghana is the country with the highest electricity access, with 85% in the region. The country has a hydropower installed capacity of 1584 MW which makes up about 40% of the total electricity generation capacity in the country, with a potential capacity of 2480 MW [81]. Therefore, it will cost the country much less to meet the target. In order to meet the electricity demand of 47 TWh for 2030 with only natural gas, an installed capacity of 8300 MW is required and will produce an emission of 21.32 Mt.
A maximum of 33.7% RES share can be achieved without CEEP and the use of storage. An installed capacity of 6500 MW of natural gas, 2300 MW of hydro, 3000 MW of PV, 3000 MW of wind and 8 GW of storage are required to meet 48% RES share without CEEP. Total investment cost and total annual costs are USD 26.85 billion and USD 1.69 billion, respectively. CO2 emissions will drop from 21.32 to 11.09 Mt per year. The electricity demand and RE productions are plotted in Figure 11.
Guinea has an installed capacity of 368 MW of hydropower with an estimated potential of 6100 MW [82]. Hydropower amount to about 75% of the total electricity generation capacity [42]; therefore, the country is in a very good state with the minimum RES share required, but there is only about 45.7% electricity access. In order to meet the total demand of 5.3 TWh for 2030 with natural gas, an installed capacity of 950 MW is required and will produce 2.4 Mt emissions per year. Furthermore, to provide 100% electricity access and meet the RES share target, 700 MW of natural gas, 600 MW of hydro, 150 MW PV and 70 MW of wind are required. This will reduce emissions from 2.4 to 1.23 Mt. Moreover, the total investment cost and total annual costs are USD 4.96 billion and USD 288 million, respectively. The electricity demand and RE productions are plotted in Figure 12.
Guinea-Bissau’s available hydropower potential from the rivers Corubal and Geba is estimated to be 184 MW. Even though hydropower has a great deal of potential, Guinea-Bissau has yet to make considerable use of it [83]. A 55 MW capacity of a natural gas-fired power plant is required to meet the projected demand of 0.3 TWh, and this will produce 0.136 Mt of emission. In order to meet the target, 40 MW of natural gas, 35 MW of hydro, 6 MW of PV and 3 MW of wind are required. This will reduce emissions from 0.136 to 0.07 Mt per year and will incur a total investment cost and a total annual cost of USD 272 million and USD 14.86 million, respectively. The electricity demand and RE productions are plotted in Figure 13.
Hydropower potential in Liberia is estimated to be 4478 MW with an installed capacity of 88 MW [84]. In order to meet 100% electricity access of 1.4 TWh by 2030 with only natural gas power plant, an installed capacity of 250 MW is required, and this will produce 0.635 Mt CO2 emission per year. By integrating 180 MW of natural gas, 170 MW of hydropower, 35 MW of PV and 12 MW of wind, a minimum target of 48% RES share can be achieved without CEEP. The total investment cost and total annual costs are USD 1.3 billion and USD 73.17 million, respectively. In addition, this will reduce emissions from 0.635 to 0.331 Mt per year. The electricity demand and RE productions are plotted in Figure 14.
In order to meet Mali’s 100% electricity access of 7.4 TWh by 2030 with only a natural gas power plant, an installed capacity of 1300 MW is required, and this will produce 3.36 Mt CO2 emission. A 48% RES share can be achieved by installing 950 MW of natural gas, 700 MW of hydro, 250 MW of PV and 200 MW of wind without CEEP. There is just over 1000 MW of hydropower potential in Mali, with an available installed capacity of 310 MW [85]. In order to reach the target, a total investment cost and a total annual cost of USD 5.82 billion and USD 336.12 million, respectively, are required, and this will reduce emissions from 3.336 to 1.75 Mt per year. The electricity demand and RE productions are plotted in Figure 15.
Based on the simulation result, for Niger to meet its demand of 6 TWh for the year 2030 with 100% electricity access, a natural gas-fired power plant with a capacity of 1055 MW is required, which will produce CO2 emission of 2.722 Mt yearly. The country has an estimated hydropower potential of over 400 MW [86]. Without CEEP and the use of storage, 46% RES share can be achieved with an installed capacity of 800 MW of natural gas, 400 MW of hydropower, 250 MW of PV and 300 MW of wind. The total investment cost and total annual costs are USD 3.85 billion and USD 224 million, respectively, which will reduce emissions from 2.722 down to 1.476 Mt per year. The electricity demand and RE productions are plotted in Figure 16.
Nigeria, which is the largest country in the region in terms of population as well as energy demand, is estimated to have a demand of 200 TWh by 2030. In order to meet this demand with only natural gas, a capacity of 36,000 MW is required, as equally stated in previous research [68]. A maximum of 44% RES share can be achieved without CEEP and the use of storage. The country has an installed hydropower capacity of 2110 MW, which generated 6.10 TWh of electricity in 2019. The country has a high exploitable hydropower potential estimated at 14,120 MW [87]. An installed capacity of 27,000 MW of natural gas, 14,000 MW of hydro, 9600 MW of PV, 10,000 MW of wind and 9 GW of storage are required to meet 48% RES share without CEEP. Total investment costs and total annual costs are USD 133.93 billion and USD 8.13 billion, respectively. CO2 emissions will drop from 90.72 to 47.18 Mt per year. The electricity demand and RE productions are plotted in Figure 17.
Senegal is forecasted to have a total demand of 17.3 TWh by 2030, and in order to meet this target with one technology of a natural gas-fired power plant, an installed capacity of 3050 MW is required, which will produce 7.85 Mt of CO2. Based on the simulation carried out in this study, the target of a minimum of 48% of RES share cannot be achieved without the use of storage. In order to prevent CEEP and meet the target, the integration of 2600 MW of natural gas, 1500 MW of PV, 1850 MW of wind, 2.5 GW of storage and 200 MW of hydro are required. Without the integration of a storage facility, there will be CEEP. It is noteworthy that the country has a relatively low hydropower potential of 253 MW [88]. The total investment cost and total annual costs are USD 6.92 billion and USD 509.89 million, respectively, which will reduce emissions from 7.85 down to 4.07 Mt per year. The electricity demand and RE productions are plotted in Figure 18.
Hydropower potential in Sierra Leone is estimated to be 2000 MW [89]. There is currently an installed capacity of 75 MW, which generates about 66 % of the total electricity generation capacity in the country [94]. In order to meet 100% electricity access of 1.3 TWh by 2030 with only natural gas power plant, an installed capacity of 230 MW is required and this will produce 0.59 Mt CO2 emission per year. Hydropower alone of 150 MW can generate up to 44.8% of the demand without CEEP. By integrating 170 MW of natural gas, 150 MW of hydropower, 20 MW of PV and 4 MW of wind, the target of a minimum 48% RES share can be achieved without CEEP. The total investment cost and total annual costs are USD 1.2 billion and USD 69.74 million, respectively. Moreover, this will reduce emissions from 0.59 to 0.306 Mt per year. The electricity demand and RE productions are plotted in Figure 19.
Togo is forecasted to have a total electricity demand of 6.3 TWh by 2030, and in order to meet this target with one technology of a natural gas-fired power plant, an installed capacity of 1120 MW is required, which will produce 2.86 Mt of CO2. Based on the simulation process, a target of a minimum of 48% of RES share can be achieved by the integration of 950 MW of natural gas, 620 MW of PV, 710 MW of wind, 2 GW of storage and 150 MW of hydro are required, without CEEP. Without the integration of a storage facility, there will be CEEP. The country has an installed capacity of 67 MW of hydropower, which as of 2017, produces about 69% of the total electricity generated with an estimated potential of over 150 MW [90]. The total investment cost and total annual costs are USD 3.12 billion and USD 218.36 million, respectively, which will reduce emissions from 2.68 down to 1.48 Mt per year. The electricity demand and RE productions are plotted in Figure 20.
The table shows the technical optimization of different hybrid renewable energy for the countries considered in West Africa. The underlying basis for the modeling is to achieve the set 48% RE integration. From Table 7, it is seen that utilizing the storage facilities eliminates the critical excess electricity, however, with higher investment cost. In the Benin Republic, the hybrid NG + PV + wind gave the least CEEP of 0.04 TWh and an investment cost of USD 2.09 billion. In Togo, the analysis shows that for implementing pumped hydro storage, with the NG + hydro + PV + wind, an additional USD 2.74 billion is required to store 0.49 TW of electricity. For Senegal, the additional cost of USD 1.64 billion is the additional investment required for pumped hydro storage to cater for the 0.94 TW of electricity. There is no substantial hydropower resource in Burkina Faso; therefore, it is excluded from the analysis. The result shows that natural gas and wind hybrid energy resource will yield 0.10 TW of CEEP, and the investment is USD 2.41 billion.
Table 7.
Summary of total investment and CEEP for different hybrids.
Generally, it is seen that despite the huge potential of hydropower in the West African region, it does not present an optimal feasibility for electricity production. A hybrid system utilizing the solar and wind potential in the region can help in significantly meeting the growing energy demands in a cost-effective manner.
3.2. Regional Synchronous Power Grid
The total regional electricity demand for the year 2030 is estimated to be 331.5 TWh. In order to meet this demand that will provide 100% electricity access to the region with the use of only a natural gas-fired power plant, an installed capacity of 58,500 MW is required, and this will produce CO2 emission of 150 Mt per year. The total investment cost and total annual costs are USD 44.18 billion and USD 3.81 billion, respectively. The electricity demand and production profile for a year is plotted in Figure 21. Despite the vast availability of natural gas resources in West African countries, their utilization will pose huge environmental effects. Moreover, it is expensive to operate. It is important to state that controlling CO2 emissions will be difficult if 100% electricity access to the region is facilitated with the use of only a natural gas-fired power plant since natural gas production and consumption are major drivers of the economic growth of most of the West African countries [95]. Furthermore, some limitations of natural gas are fugitive emissions [96], infrastructure costs [97] and limited geographical distribution.
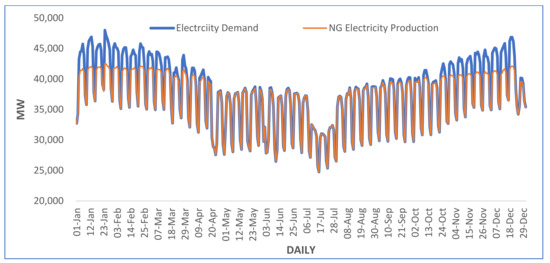
Figure 21.
Electricity demand and supply profile using natural gas for a year.
The WAPP regional plan had only prioritized hydropower and natural gas projects [98]. However, there is a limitation to this. The impact of drought and climate change on hydropower plants, as well as vandalism on gas pipelines, are impediments to this plan. For example, severe droughts in 1998, 2001 and 2007 caused Cote d’Ivoire, Ghana and Nigeria, which rely heavily on hydropower, to have a significant drop in electricity production, affecting electricity trade between countries. Furthermore, there is the possibility of a reduction in hydropower generation from two major rivers in the region by more than 50% between 2015 and 2050 due to climate change [99]. Since 2012, vandalism on several gas pipelines in Nigeria has resulted in a significant decline in both Nigeria’s and Ghana’s electricity generation. However, if 1% of the estimated suitable land is utilized, the region has the potential to generate up to five times its projected demand in 2025 through solar technologies [100]. With an enormous solar photovoltaic (PV) technical potential in the region and the vast hydropower resource, it is necessary to investigate the feasibility of solar technologies and hydropower in meeting the rapidly growing demand of an interconnected West Africa electricity network operating under the auspices of a single regional electricity market [98].
The result shows that 44.6% of the demand can be generated through hydropower, which is approximately 93% of the 48% RES share target. The countries and capacities considered are as follows: Nigeria (14,000 MW), Cote d’Ivoire (12,000 MW), Guinea (6100 MW), Liberia (4400 MW), Ghana (2400 MW), Sierra Leone (2000 MW) and Mali (1000 MW); demand and power supply profile is plotted in Figure 22. Even if other countries within the region are considered, their hydropower potential total is less than 2000 MW, which is still less than what is required to meet the 48% RES share target. The total investment cost and total annual costs are USD 310.49 billion and USD 17.32 billion, respectively, and this will reduce emissions from 150 to 83.3 Mt per year.
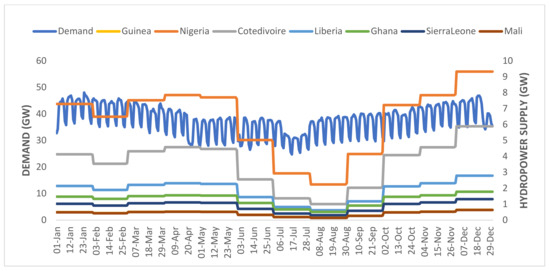
Figure 22.
Electricity demand and hydropower supply profile.
When considering only solar PV integration into the grid while avoiding CEEP, a maximum of 19% RES share can be achieved with a total installed capacity of 34,000 MW, which will reduce emissions from 150 to 122 Mt per year. Seven countries with the highest capacity factor as well as countries with larger landmass, were considered for this analysis. Therefore, when considering integrating only wind, a maximum of 25.6% RES share can be achieved with a total installed capacity of 34,500 MW and will reduce emissions to 111.9 Mt per year. Based on these findings, it is impossible to meet the target or even get close to the use of solar PV or wind alone, and this is due to their high intermittency.
According to this study and within its scope, it is only possible to meet the target if the three renewable energy technologies are integrated to avoid CEEP and the use of storage as a unified synchronous power grid. Table 7 and Figure 23 show the result summary of the technologies, countries, capacities and annual electricity production in this analysis and the electricity demand and supply.
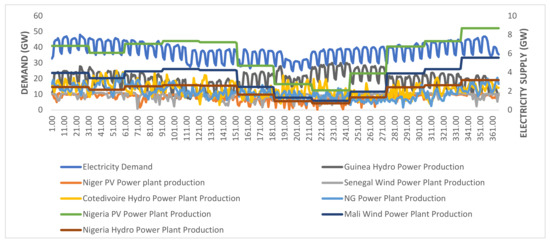
Figure 23.
Hybrid electricity demand and supplies profile for a year.
The analysis was carried out for 100% electricity access and 48% renewable energy utilization, priority in renewable energy generation is given to countries with rich resources and higher potential. Furthermore, the synchronous grid system is simulated to consider the existing bilateral interconnection lines in the region, for instance, Mali–Senegal, Nigeria–Niger, Guinea–Mali and other interconnection projects within the framework of WAPP initiatives such as Nigeria, Cote d’Ivoire and Guinea to other countries [101]. Furthermore, the inclusion criteria for renewable energy generation considered potential, capacity factor and landmass. The system will reduce emissions to 77.8 Mt per year and incur a total investment cost and a total annual cost of USD 250.37 billion and USD 14.71 billion, respectively, which is cheaper than using only hydropower. Table 8 also presents the six countries considered for RE production, with Nigeria and the Niger Republic generating a combined capacity of 13,000 MW from solar PV; Mali and Senegal generating another combined capacity of 13,000 MW from wind; and Nigeria, Cote d’Ivoire and Guinea generating a combined capacity of 29,000 MW from hydro; all the countries put together generate 42,000 MW from natural gas. Figure 24 shows the percentage share of renewable energy. Figure 24 shows that the river hydro has huge potential in West Africa for power generation, as it constitutes 30% of the proposed Synchronous grid system. A study by Harald et al. [102] investigated the hydropower potential of West Africa in detail, using precipitation and potential evapotranspiration data as input. Their result agrees with the findings of this study, as their study conclusively stated that West Africa has huge hydro potential. Furthermore, their study showed that Guinea and the southeastern parts of Nigeria have promising hydropower potential.
Table 8.
Summary of proposed synchronous grid.
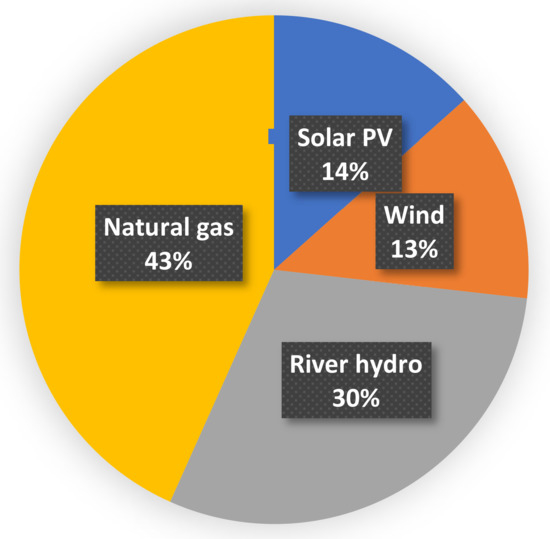
Figure 24.
The percentage share of different electricity production.
The creation of the West African power pool was not only to develop large regional power plants and build interconnected transmission infrastructures between the countries but also to create a unified regional electricity market [101]. The WAPP project established the ECOWAS Regional Electricity Regulatory Authority (ERERA) in 2008 to regulate the cross-border trade of electricity in West Africa. The committee, over the years, have initiated several regulations and policies in driving the commitment to achieve electricity interconnections in ECOWAS [103]. The implementation and installation of the synchronous electricity grid in West Africa will also have economic benefits for the regional power market in the region. Small and energy-constrained states, such as Liberia, the Gambia, Guinea Bissau, Burkina Faso, Niger and Mali, would be the primary beneficiaries of the regional energy market [98]. These countries could save 1 to 3.5% of GDP annually by increasing their reliance on imports and, as a result, reduce their power generation costs by at least 20% [103]. This money could then be used to fund other areas of the economy. The significantly positive outcome of the promotion of regional integration of electricity trading and investments in low-cost electricity generation options (similar to that facilitated by the synchronous grid system) can be seen from the Southern African Power Pool (SAPP) initiative. Bowen et al. [101] explained that the benefits of centralized and competitive dispatch in SAPP could reach USD 100 million per year when compared to existing bilateral electricity trade agreements. These benefits accrue primarily as a result of increased hydropower utilization under integrated operation conditions, as currently, the statistics for the SAPP generation mix are 74.3% coal, 20.1% hydro, 4% nuclear and 1.6% diesel and gas.
3.3. Policy Implementation
The results reveal the pathway for integrating renewable energy sources for 100% electricity access and 48% renewable energy integration as set out by the WAPP. The vision of the organization is achievable only by considering and maximizing the existing optimal renewable potential in the member states. However, such a ramping increase in renewable energy integration requires discourse on some critical issues.
The feasibility of the scenarios presented in this study hinges on the level of policy and private-sector engagement. Firstly, there should be an upgrade in the power grid for the deployment of large-scale PV and wind energy. A study by Masters et al. [104], which investigated the regional pooling and cross-border electricity trade within the West African sub-region, found that the share of transmission grid adaptation costs accounts only for 3% of the total system cost. Moreover, a study by Sanoh et al. [105] mentioned that in West Africa, while hydro and geothermal resources are now very cost-competitive, grid-connected PV and wind generation could supply electricity at costs comparable to present fossil-fuel plants in the long run. Despite the uncertainty of the real costs of grid development in West Africa to meet the set target, it is important to create a unified, efficient policy context to improve the grid system in the region. Moreover, there may be a need to consider the construction of new transmission networks, as most of the renewable energy sites in West Africa are far from the demand areas.
Furthermore, the deployment of renewable energy sources in the member states requires huge private stakeholder involvement and investments. The WAPP committee needs to unanimously work towards renewable energy subsidies in the member states.
The West African region is currently faced with the difficulty of fulfilling rapidly rising energy consumption, which has played a key part in the region’s slow economic development rate. The West African Power Pool was formed to address these issues by constructing regional power plants and integrated transmission systems among the countries. Despite the presence of few studies in the literature that analyzed interconnected electricity networks in West Africa, there remained a huge gap regarding the high spatial power system model for the West Africa region that considered the optimization of renewable energy potential in the different countries in contributing to the synchronous grid network.
4. Results and Discussions
This study investigates the production of 100% electricity access and 48% renewable energy integration by considering economic and geographical factors. In this study, the electricity situation of West African countries has been analyzed, and a solution to energy poverty is being proposed to provide 100% electricity access to the region as well as pathways to achieve a target of 48% RES share by the year 2030. The 14 countries considered in this study were analyzed individually and also as a unified synchronous electricity grid. The prospect of using renewable energy sources to tackle the electricity challenge in the region is analyzed, limited to river hydro, on-shore wind and solar PV. The key conclusions from this study include the following:
- In all the simulation scenarios involving renewable energy, Critical Excess Electricity Production (CEEP) has been avoided;
- When considering the use of single technology, only natural gas-fired power plants can meet the total demand of both individual countries and also a unified grid;
- As for the synchronous grid, to meet the estimated demand of 331.5 TWh/yr with natural gas, an installed capacity of 58,500 MW is required;
- CO2 emission per year will be reduced by almost 50% when the minimum RES share target is met in all cases;
- Nigeria is the most populated country in the region and has a demand of 60% of the total regional electricity demand, which will incur about USD 133.76 billion for the total investment cost to meet the target;
- In order to meet the target as a unified synchronous grid, the most feasible, suitable and reliable case scenario is to integrate the three RES technologies with the following capacities; natural gas (42,000 MW), wind (13,000 MW), PV (13,000 MW) and hydro (29,000 MW);
- Hydropower, which is the most reliable technology among the RES, also largely in use already in the region, will still have to play a major role in achieving the target;
- The unified synchronous grid system will reduce emissions from 150 to 77.8 Mt per year and incur a total investment cost and a total annual cost of USD 250.37 billion and USD 14.71 billion, respectively.
The findings show that expanding renewable energy integration in a fully integrated West African electrical network reduces load shedding and generation costs considerably while meeting growing demand. As a result, more countries are relying on imports to cover more than half of their demand, which could pose a political difficulty because governments may be opposed to such a high level of foreign electrical supply dependency. Utilization of optimum renewable energy sources in West African countries in combination with untapped hydro resources gives a chance for the West African Power Pool to fulfill its aims of boosting electricity supply and lowering existing high electricity rates in the region.
This study can serve as a model for academic research in line with the demand and supply of power and also in integrating renewable energy sources into the power grid. It undoubtedly adds to our understanding of West Africa’s electricity industry and can also serve as a model for other countries as well as regions facing similar challenges. Future research can focus on transmission and distribution requirements within the region to accommodate synchronous grid networks.
Author Contributions
Conceptualization, H.P.I.; methodology, H.P.I. and H.A.; software, H.P.I.; validation, H.P.I. and H.A.; formal analysis, H.A.; investigation, H.P.I.; Resources, H.P.I. and H.A.; data curation, H.P.I. and H.A.; writing—original draft preparation, H.P.I.; writing—review and editing, H.P.I. and H.A.; visualization, H.P.I.; supervision, M.J. and M.K.; project administration, M.J. All authors have read and agreed to the published version of the manuscript.
Funding
This research received no external funding.
Institutional Review Board Statement
Not applicable.
Informed Consent Statement
Not applicable.
Data Availability Statement
Not applicable.
Conflicts of Interest
The authors declare no conflict of interest.
References
- Baleta, J.; Mikulčić, H.; Klemeš, J.J.; Urbaniec, K.; Duić, N. Integration of Energy, Water and Environmental Systems for a Sustainable Development. J. Clean. Prod. 2019, 215, 1424–1436. [Google Scholar] [CrossRef]
- United States Environmental Protection Agency. Global Greenhouse Gas Emissions Data. Available online: https://www.epa.gov/ghgemissions/global-greenhouse-gas-emissions-data (accessed on 22 June 2022).
- Dolter, B.; Rivers, N. The Cost of Decarbonizing the Canadian Electricity System. Energy Policy 2018, 113, 135–148. [Google Scholar] [CrossRef]
- Khavari, B.; Korkovelos, A.; Sahlberg, A.; Howells, M.; Nerini, F.F. Population Cluster Data to Assess the Urban-Rural Split and Electrification in Sub-Saharan Africa. Sci. Data 2021, 8, 117. [Google Scholar] [CrossRef] [PubMed]
- Nathaniel, S.; Barua, S.; Hussain, H.; Adeleye, N. The Determinants and Interrelationship of Carbon Emissions and Economic Growth in African Economies: Fresh Insights from Static and Dynamic Models. J. Public Aff. 2020, 21, e2141. [Google Scholar] [CrossRef]
- Brew-Hammond, A. Energy Access in Africa: Challenges Ahead. Energy Policy 2010, 38, 2291–2301. [Google Scholar] [CrossRef]
- Kaygusuz, K. Energy Services and Energy Poverty for Sustainable Rural Development. Renew. Sustain. Energy Rev. 2011, 15, 936–947. [Google Scholar] [CrossRef]
- Ben Aïssa, M.S.; Ben Jebli, M.; Ben Youssef, S. Output, Renewable Energy Consumption and Trade in Africa. Energy Policy 2014, 66, 11–18. [Google Scholar] [CrossRef]
- Surroop, D.; Raghoo, P. Renewable Energy to Improve Energy Situation in African Island States. Renew. Sustain. Energy Rev. 2018, 88, 176–183. [Google Scholar] [CrossRef]
- Joshua, U.; Bekun, F.V. The Path to Achieving Environmental Sustainability in South Africa: The Role of Coal Consumption, Economic Expansion, Pollutant Emission, and Total Natural Resources Rent. Environ. Sci. Pollut. Res. 2020, 27, 9435–9443. [Google Scholar] [CrossRef]
- United Nations. World Population Prospects: The 2008 Revision, Comprehensive Tables; United Nations: San Francisco, CA, USA, 2010. [Google Scholar]
- World Bank. World Development Indicators 2012; World Bank Publications: Washington, DC, USA, 2012. [Google Scholar]
- Ojah, K.; Muhanji, S.; Kodongo, O. Infrastructure Threshold and Economic Growth in Africa: Do Income Level and Geography Matter? Econ. Plan. 2021, 55, 1587–1627. [Google Scholar] [CrossRef]
- Wang, J.; Dong, K. What Drives Environmental Degradation? Evidence from 14 Sub-Saharan African Countries. Sci. Total. Environ. 2018, 656, 165–173. [Google Scholar] [CrossRef]
- Sinn, H.-W. Austerity, Growth and Inflation—Remarks on the Eurozone’s Unresolved Competitiveness Problem. World Econ. 2014, 37, 1–13. [Google Scholar] [CrossRef]
- Kraft, J.; Kraft, A. On the Relationship between Energy and GNP. J. Energy Dev. 1978, 3, 401–403. [Google Scholar]
- Okwanya, I.; Abah, P.O. Impact of Energy Consumption on Poverty Reduction in Africa. CBN J. Appl. Stat. 2018, 9, 5. [Google Scholar]
- Obeng-Odoom, F. The State of African Cities 2010: Governance, Inequality and Urban Land Markets. Cities 2013, 1, 425–429. [Google Scholar] [CrossRef]
- Sangraula, P.; Chen, S.; Ravallion, M. New Evidence On The Urbanization Of Global Poverty. Popul. Dev. Rev. 2007, 33, 667–701. [Google Scholar] [CrossRef]
- Mandelli, S.; Barbieri, J.; Mattarolo, L.; Colombo, E. Sustainable Energy in Africa: A Comprehensive Data and Policies Review. Renew. Sustain. Energy Rev. 2014, 37, 656–686. [Google Scholar] [CrossRef]
- ECOWAS. West African Power Pool. Available online: https://www.ecowapp.org/ (accessed on 24 June 2022).
- ECREEE. ECOWAS Renewable Energy Policy. 2015. Available online: http://www.ecreee.org/sites/default/files/documents/ecowas_renewable_energy_policy.pdf (accessed on 24 June 2022).
- ECOWAS. Renewable Energy Policy (EREP) towards Sustainability. 2015. Available online: https://ecowas.int/special_agency/ecowas-center-for-renewable-energy-and-energy-efficiency-ecreee/ (accessed on 24 June 2022).
- Ceesay, K.K. Sustainable Energy Action Plan for The Gambia; 2015. ERCEE. 2018. Available online: http://www.ecreee.org/sites/default/files/events/sustainable_energy_action_plan_the_gambia.pdf (accessed on 4 July 2022).
- Bamisile, O.; Babatunde, A.; Adun, H.; Yimen, N.; Mukhtar, M.; Huang, Q.; Hu, W.H. Electrification and Renewable Energy Nexus in Developing Countries; An Overarching Analysis of Hydrogen Production and Electric Vehicles Integrality in Renewable Energy Penetration. Energy Convers. Manag. 2021, 236, 114023. [Google Scholar] [CrossRef]
- Kabiru, I.; Sulaiman, C.; Abdul-rahim, A.S. Renewable Energy Consumption and Economic Growth Nexus: A Fresh Evidence from West Africa. Energy Rep. 2019, 5, 384–392. [Google Scholar]
- Ackah, I.; Graham, E.; Graham, E. Meeting the Targets of the Paris Agreement: An Analysis of Renewable Energy (RE) Governance Systems in West Africa (WA) Such as Climate Change and Sustainable Development Have. Clean Technol. Environ. Policy 2021, 23, 501–507. [Google Scholar] [CrossRef]
- Hydropower in Africa. 2021. Available online: https://www.iea.org/reports/climate-impacts-on-african-hydropower (accessed on 25 June 2022).
- Africa Energy Portal. Regional Profile. 2020. Available online: https://africa-energy-portal.org/region/north-africa (accessed on 25 June 2022).
- Energy Portal. Regional Profile. Available online: https://africa-energy-portal.org/region/southern-africa (accessed on 26 June 2022).
- UNIDO. Scaling up Renewable Energy in Africa. In Proceedings of the 12th Ordinary Session of Heads State Governments of the African Union, Addis Ababa, Ethiopia, 26 January–3 February 2009. [Google Scholar]
- Sokona, Y.; Mulugetta, Y.; Gujba, H. Widening Energy Access in Africa: Towards Energy Transition. Energy Policy 2012, 47, 3–10. [Google Scholar] [CrossRef]
- Karekezi, S.; Kithyoma, W. Renewable Energy Strategies for Rural AFRICA: Is a PV-Led Renewable Energy Strategy the Right Approach for Providing Modern Energy to the Rural Poor of Sub-SAHARAN Africa? Energy Policy 2002, 30, 1071–1086. [Google Scholar] [CrossRef]
- Elias, R.J.; Victor, D.G. Energy Transitions in Developing Countries: A Review of Concepts and Literature. Cent. Environ. Sci. Policy 2005, 40, 38. [Google Scholar]
- IRENA. Prospects for the African Power Sector; International Renewable Energy Agency: Abu Dhabi, United Arab Emirates, 2012. [Google Scholar]
- Azouzoute, A.; Merrouni, A.A.; Touili, S. Overview of the Integration of CSP as an Alternative Energy Source in the MENA Region. Energy Strat. Rev. 2020, 29, 100493. [Google Scholar] [CrossRef]
- Sterl, S.; Brussel, V.U.; Liersch, S. A New Approach for Assessing Synergies of Solar and Wind Power: Implications for West Africa. Environ. Res. Lett. 2018, 13, 094009. [Google Scholar] [CrossRef]
- Moner-Girona, M.; Bódis, K.; Huld, T.; Kougias, I.; Szabó, S. Universal Access to Electricity in Burkina Faso: Scaling-Up Renewable Energy Technologies. Environ. Res. Lett. 2016, 11, 084010. [Google Scholar] [CrossRef]
- Sharma, V.; Heynen, A.P.; Bainton, N.; Burton, J. The Papua New Guinea Electrification Partnership: Power and diplomacy in the Pacific. Energy Res. Soc. Sci. 2021, 79, 102186. [Google Scholar] [CrossRef]
- Budianto, R. A Cost-Optimal and Geospatial Analysis for the Power System of Sierra Leone. Master’s Thesis, KTH Industrial Engineering and Management, Stockholm, Sweden, 2019. [Google Scholar]
- Adeoye, O.; Spataru, C. Modelling and Forecasting Hourly Electricity Demand in West African Countries. Appl. Energy 2019, 242, 311–333. [Google Scholar] [CrossRef]
- Sterl, S.; Vanderkelen, I.; Chawanda, C.J.; Russo, D.; Brecha, R.J.; Van Griensven, A.; Van Lipzig, N.P.M.; Thiery, W. Smart Renewable Electricity Portfolios in West Africa. Nat. Sustain. 2020, 3, 710–719. [Google Scholar] [CrossRef]
- World Bank. West African Electricity Trade; World Bank: New Delhi, India, 2020. [Google Scholar]
- Planning and Prospects for Renewable Power: West Africa. 2018. Available online: https://www.google.com.hk/url?sa=t&rct=j&q=&esrc=s&source=web&cd=&cad=rja&uact=8&ved=2ahUKEwj7zYPOtNL7AhVawTgGHbQ5BnMQFnoECA4QAQ&url=https%3A%2F%2Fwww.irena.org%2F-%2Fmedia%2FFiles%2FIRENA%2FAgency%2FPublication%2F2018%2FNov%2FIRENA_Planning_West_Africa_2018.pdf&usg=AOvVaw25EoZ5ZFZcHRbZ4qAlydcB (accessed on 14 August 2022).
- Energy Agency. Electricity Generation by Sources. 2018. Available online: https://sdg.iisd.org/news/global-energy-demand-in-2018-grew-at-fastest-pace-in-a-decade/ (accessed on 26 July 2022).
- Worldmeters. Electricity Generation. 2016. Available online: https://www.worldometers.info/electricity/ (accessed on 14 August 2022).
- Frangoul, A. West Africa’s First Large-Scale Wind Farm Starts Generating Power. 2019. Available online: https://www.cnbc.com/2019/12/13/west-africas-first-large-scale-wind-farm-starts-generating-power.html (accessed on 24 June 2022).
- Sasu, D.D. Potential for Solar Photovoltaic (PV) Capacity in West Africa. 2020. Available online: https://acp.copernicus.org/articles/20/12871/2020/ (accessed on 27 June 2022).
- Mukasa, D.; Mutambatsere, E.; Arvanitis, Y.; Triki, T. Energy Research & Social Science Wind Energy in Sub-Saharan Africa: Financial and Political Causes for the Sector’s Under-Development. Energy Res. Soc. Sci. 2015, 5, 90–104. [Google Scholar]
- Sawadogo, W. Projected Changes in Wind Energy Potential over West Africa under the Global Warming of 1.5 °C and Above. Theor. Appl. Climatol. 2019, 138, 321–333. [Google Scholar] [CrossRef]
- Small Hydro Mapped Out in West Africa. 2017. Available online: https://www.waterpowermagazine.com/news/newssmall-hydro-mapped-out-in-west-africa-5842789 (accessed on 26 July 2022).
- El Youssfi, L.; Doorsamy, W.; Aghzar, A.; Cherkaoui, S.I.; Elouadi, I.; Faundez, A.G.; Salazar, D.R. Review of Water Energy Food Nexus in Africa: Morocco and South Africa as Case Studies. E3S Web Conf. 2020, 183, 02002. [Google Scholar] [CrossRef]
- Imasiku, K.; Ntagwirumugara, E. An Impact Analysis of Population Growth on Energy-Water-Food-Land Nexus for Ecological Sustainable Development in Rwanda. Food Energy Secur. 2020, 9, e185. [Google Scholar] [CrossRef]
- Endo, A.; Tsurita, I.; Burnett, K.; Orencio, P.M. A Review of the Current State of Research on the Water, Energy and Food Nexus. J. Hydrol. Reg. Stud. 2017, 11, 20–30. [Google Scholar] [CrossRef]
- Kiplagat, J.; Wang, R.; Li, T. Renewable Energy in Kenya: Resource Potential and Status of Exploitation. Renew. Sustain. Energy Rev. 2011, 15, 2960–2973. [Google Scholar] [CrossRef]
- Karlberg, L.; Hoff, H.; Amsalu, T.; Andersson, K.; Binnington, T.; Flores-López, F.; de Bruin, A.; Gebrehiwot, S.G.; Gedif, B.; Johnson, O.; et al. Tackling Complexity: Understanding the Food-Energy-Environment Nexus in Ethiopia’s Lake TANA Sub-Basin. Water Altern. 2015, 8, 710–734. [Google Scholar]
- Popp, J.; Lakner, Z.; Harangi-Rákos, M.; Fári, M. The Effect of Bioenergy Expansion: Food, Energy, and Environment. Renew. Sustain. Energy Rev. 2014, 32, 559–578. [Google Scholar] [CrossRef]
- Ferroukhi, R.; Nagpal, D.; Lopez-Peña, A.; Hodges, T.; Mohtar, R.H.; Daher, B.; Mohtar, S.; Keulertz, M. Renewable Energy in the Water, Energy and Food Nexus. IRENA Abu Dhabi. 2015. Available online: https://www.google.com.hk/url?sa=t&rct=j&q=&esrc=s&source=web&cd=&cad=rja&uact=8&ved=2ahUKEwio1M2OtdL7AhXo-DgGHXXuApEQFnoECAgQAQ&url=https%3A%2F%2Fwww.irena.org%2F-%2Fmedia%2FFiles%2FIRENA%2FAgency%2FPublication%2F2015%2FIRENA_Water_Energy_Food_Nexus_2015.pdf&usg=AOvVaw0G-XJI-miEvfrQc3zyGql8 (accessed on 15 August 2022).
- Phalan, B. The Social and Environmental Impacts of Biofuels in Asia: An Overview. Appl. Energy 2009, 86, S21–S29. [Google Scholar] [CrossRef]
- Fingerman, R.; Torn, M.S.; O’Hare, M.H.; Kammen, D.M. Accounting for the Water Impacts of Ethanol Production. Environ. Res. Lett. 2010, 5, 014020. [Google Scholar] [CrossRef]
- Cooper, P.; Dimes, J.; Rao, K.; Shapiro, B.; Shiferaw, B.; Twomlow, S. Coping Better with Current Climatic Variability in the Rain-Fed Farming Systems of Sub-Saharan Africa: An Essential First Step in Adapting to Future Climate Change? Agric. Ecosyst. Environ. 2008, 126, 24–35. [Google Scholar] [CrossRef]
- Whaley, J. Gas in Africa. 2017. Available online: https://www.geoexpro.com/articles/2017/04/gas-in-africa (accessed on 14 August 2022).
- Study on Energy Prices and Subsidies and Their Impact on Industry and Households. Energy PLAN Cost Database. 2018. Available online: https://www.energyplan.eu/useful_resources/costdatabase/ (accessed on 14 August 2022).
- Krukowska, E. Europe CO2 Prices. 2021. Available online: https://ember-climate.org/data/data-tools/carbon-price-viewer/ (accessed on 23 June 2022).
- Hydropower and the Pathway to Net Zero. Available online: https://www.iea.org/news/hydropower-has-a-crucial-role-in-accelerating-clean-energy-transitions-to-achieve-countries-climate-ambitions-securely (accessed on 3 July 2022).
- Bellini, E. IRENA Sees 20 GW Potential for Solar in West Africa by 2030. 2018. Available online: https://www.pv-magazine.com/2018/11/26/irena-sees-20-gw-potential-for-solar-in-west-africa-by-2030/ (accessed on 12 July 2022).
- Solar and Wind Data. Available online: https://www.swpc.noaa.gov/products/real-time-solar-wind (accessed on 23 July 2022).
- Bamisile, O.; Huang, Q.; Xu, X.; Hu, W.H.; Liu, W.; Liu, Z.; Chen, Z. An Approach for Sustainable Energy Planning towards 100% Electrification of Nigeria by 2030. Energy 2020, 197, 117172. [Google Scholar] [CrossRef]
- Ikeagwuani, I.; Bamisile, O.; Abbasoglu, S.; Julius, A. Performance Comparison of PV and Wind Farm in Four Different Regions of Nigeria. 2016. Available online: https://www.researchgate.net/profile/Ikechukwu-Ikeagwuani/publication/308118262_Performance_Comparison_of_PV_and_Wind_Farm_in_Four_Different_Regions_of_Nigeria/links/57da931f08aeea1959328e7a/Performance-Comparison-of-PV-and-Wind-Farm-in-Four-Different-Regions-of-Nigeria.pdf (accessed on 12 June 2022).
- Energy Consumption and E. Resources, “Benin”, No. Table 1. 2016, pp. 2013–2016. Available online: https://www.google.com.hk/url?sa=t&rct=j&q=&esrc=s&source=web&cd=&cad=rja&uact=8&ved=2ahUKEwjfj6yLt9L7AhX31zgGHaUWDsoQFnoECAsQAQ&url=https%3A%2F%2Fwww.imf.org%2Fexternal%2Fpubs%2Fft%2Fscr%2F2016%2Fcr1606.pdf&usg=AOvVaw3n7OXjCLwcmi4RPw27Kqti (accessed on 12 June 2022).
- Zhu, J.; Wang, X.; Liu, W.; Wang, S. Photovoltaic Direct Drive Water-Saving Irrigation System and Its Optimization Design Method Photovoltaic. J. Phys. Conf. Ser. 2021, 2076, 012013. [Google Scholar] [CrossRef]
- Koua, B.K.; Koffi, P.M.E.; Gbaha, P.; Touré, S. Present Status and Overview of Potential of Renewable Energy in Cote d’Ivoire. Renew. Sustain. Energy Rev. 2015, 41, 907–914. [Google Scholar] [CrossRef]
- Gambia Energy. 2020. Available online: https://www.trade.gov/country-commercial-guides/gambia-energy (accessed on 12 June 2022).
- Kuamoah, C. Renewable Energy Deployment in Ghana: The Hype, Hope and Reality. Insight Afr. 2020, 12, 45–64. [Google Scholar] [CrossRef]
- Hammami, J. Harnessing the Potential of Guinea Conakry’s Renewable Energy Sector. 2021. Available online: https://energycapitalpower.com/harnessing-the-potential-of-guinea-conakrys-renewable-energy-sector/ (accessed on 12 June 2022).
- Solar Energy and Its Potential in Liberia. 2019. Available online: http://www.renewables-liberia.info/index.php/technologies/installation (accessed on 12 June 2022).
- Potential in Sierra Leone, Renewables Salone. 2017. Available online: http://renewables-salone.info/index.php/projects-new/installation (accessed on 12 June 2022).
- West African Solar Opportunities. 2018. Available online: https://www.gogla.org/sites/default/files/recource_docs/west-african-solar-opportunities.v4.pdf (accessed on 12 June 2022).
- Sebastian Sterl, R.B. How West Africa Can Expand Power Supply and Meet Renewable Climate Goals. 2020. Available online: https://climateanalytics.org/blog/2020/how-west-africa-can-expand-power-supply-and-meet-climate-goals/ (accessed on 12 June 2022).
- Hydro Power in Cote D’ivore. Available online: https://www.hydropower.org/country-profiles/cote-divoire#:~:text=Hydropower-currently-accounts-for-approximately,electricity-generated-in-the-country (accessed on 12 June 2022).
- Hydropower in Ghana. 2019. Available online: https://www.hydropower.org/country-profiles/ghana (accessed on 12 June 2022).
- Hydropower in Guinea. 2019. Available online: https://www.hydropower.org/country-profiles/guinea (accessed on 12 June 2022).
- Hydro Power Potential in Guinea-Bissau. 2012. Available online: https://www.reeep.org/guinea-bissau-2012#:~:text=The-available-hydropower-potential-of,of-hydropower-in-Guinea-Bissau (accessed on 12 June 2022).
- GIS Hydropower Resource Mapping—Country Report for Liberia 1 Copyright© Pöyry Energy GmbH, ECREEE. 2017, pp. 1–19. Available online: www.ecowrex.org/sites/default/files/country_report_08_liberia.pdf (accessed on 12 June 2022).
- Mali-Energy. 2021. Available online: https://www.privacyshield.gov/article?id=Mali-Energy (accessed on 12 June 2022).
- IRENA. Renewables Readiness Assessment. Int. Renew. Energy Agency 2014, 1–72. Available online: https://www.irena.org/publications/2014/Dec/Renewables-Readiness-Assessment (accessed on 12 June 2022).
- Hydro Power in Nigeria. 2019. Available online: https://www.hydropower.org/country-profiles/nigeria (accessed on 12 June 2022).
- GIS Hydropower Resource Mapping—Country Report for Senegal 1 Copyright© Pöyry Energy GmbH, ECREEE. 2017, pp. 1–17. Available online: https://www.google.com.hk/url?sa=t&rct=j&q=&esrc=s&source=web&cd=&cad=rja&uact=8&ved=2ahUKEwiP38_YudL7AhUVkmoFHQZ8Db8QFnoECAsQAQ&url=http%3A%2F%2Fwww.ecowrex.org%2Fsites%2Fdefault%2Ffiles%2Fcountry_report_12_senegal.pdf&usg=AOvVaw2Xlv7_PTbl5gxskd7DWbFy (accessed on 12 June 2022).
- Hydropower Potential in Sierra Leone. 2020. Available online: https://energypedia.info/wiki/Sierra_Leone_Energy_Situation (accessed on 12 June 2022).
- Electrification of Togo. 2017. Available online: https://energypedia.info/wiki/Togo_Energy_Situation (accessed on 12 June 2022).
- Renewable Energy in Burkina Faso. 2020. Available online: https://energypedia.info/wiki/Burkina_Faso_Energy_Situation#:~:text=Because-of-low-wind-speed,and-unfavourable-hydro-meterological-conditions (accessed on 12 June 2022).
- Côte d’Ivoire-Country Commercial Guide. 2021. Available online: https://www.trade.gov/country-commercial-guides/cote-divoire-energy (accessed on 12 June 2022).
- Energy Consumption and Production in Gambia. Available online: https://wedocs.unep.org/bitstream/handle/20.500.11822/20510/Energy_profile_Gambia.pdf?sequence=1&isAllowed=y (accessed on 12 June 2022).
- Energy Catalyst-Sierra Leone. 2020. Available online: https://energycatalyst.ukri.org/wp-content/uploads/2020/12/Country-guide-Sierra-Leone.pdf (accessed on 12 June 2022).
- Awodumi, B.; Adewuyi, A.O. The Role of Non-Renewable Energy Consumption in Economic Growth and Carbon Emission: Evidence from Oil Producing Economies in Africa. Energy Strateg. Rev. 2020, 27, 100434. [Google Scholar] [CrossRef]
- Kuo, J.; Hicks, T.C.; Drake, B.; Chan, T.F. Estimation of Methane Emission from California Natural Gas Industry. J. Air Waste Manag. Assoc. 2015, 65, 844–855. [Google Scholar] [CrossRef]
- Ibitoye, I. Ending Natural Gas Flaring in Nigeria’s Oil Fields. J. Sustain. Dev. 2014, 7, 13–22. [Google Scholar] [CrossRef]
- Adeoye, O.; Spataru, C. Sustainable Development of the West African Power Pool: Increasing Solar Energy Integration and Regional Electricity Trade. Energy Sustain. Dev. 2018, 45, 124–134. [Google Scholar] [CrossRef]
- Cervigni, K.M.S.R.; Liden, R.; Neumann, J.E. Enhancing the Climate Resilience of Africa’s Infrastructure: The Power and Water Sectors. 2015. Available online: https://www.worldbank.org/content/dam/Worldbank/Feature%20Story/Africa/Conference%20Edition%20Enhancing%20Africas%20Infrastructure.pdf (accessed on 12 June 2022).
- Hermann, S.; Miketa, A.; Fichaux, N. Estimating the Renewable Energy Potential in Africa: A GIS-Based Approach; IRENA Secretariat: Abu Dhabi, United Arab Emirates, 2014. [Google Scholar]
- Gnansounou, E.; Bayem, H.; Bednyagin, D.; Dong, J. Strategies for Regional Integration of Electricity Supply in West Africa. Energy Policy 2007, 35, 4142–4153. [Google Scholar] [CrossRef]
- Kling, H.; Stanzel, P.; Fuchs, M. Regional Assessment of the Hydropower Potential of Rivers in West Africa. Energy Procedia 2016, 97, 286–293. [Google Scholar] [CrossRef]
- CORMIER, Regional Electricity Trade, Key to Unleashing West Africa’s Power. 2020. Available online: https://blogs.worldbank.org/energy/regional-electricity-trade-key-unleashing-west-africas-power (accessed on 14 June 2022).
- Masters, W.A.; Bowen, B.H.; Plunkett, D.J. Electricity Trade and Capacity Expansion Options in West Africa Summary. Afr. Lond. 2001, 7043, 2000–2001. [Google Scholar]
- Sanoh, A.; Kocaman, A.S.; Kocal, S.; Sherpa, S.; Modi, V. The Economics of Clean Energy Resource Development and Grid Interconnection in Africa. Renew. Energy 2014, 62, 598–609. [Google Scholar] [CrossRef]


Publisher’s Note: MDPI stays neutral with regard to jurisdictional claims in published maps and institutional affiliations. |
© 2022 by the authors. Licensee MDPI, Basel, Switzerland. This article is an open access article distributed under the terms and conditions of the Creative Commons Attribution (CC BY) license (https://creativecommons.org/licenses/by/4.0/).